
Effects of Weak Acids on the Microbiological, Nutritional and Sensory Quality of Baltic Herring (Clupea harengus membras)

 , , ,
, , ,  and
and
Abstract
1. Introduction
2. Materials and Methods
2.1. Raw Material and Sample Preparation
2.2. Microbiological Quality
2.3. pH
2.4. Composition
2.5. Lipid Oxidation
2.6. Sensory Profile
2.7. Statistical Analysis
3. Results
3.1. Microbiological Quality
3.2. pH
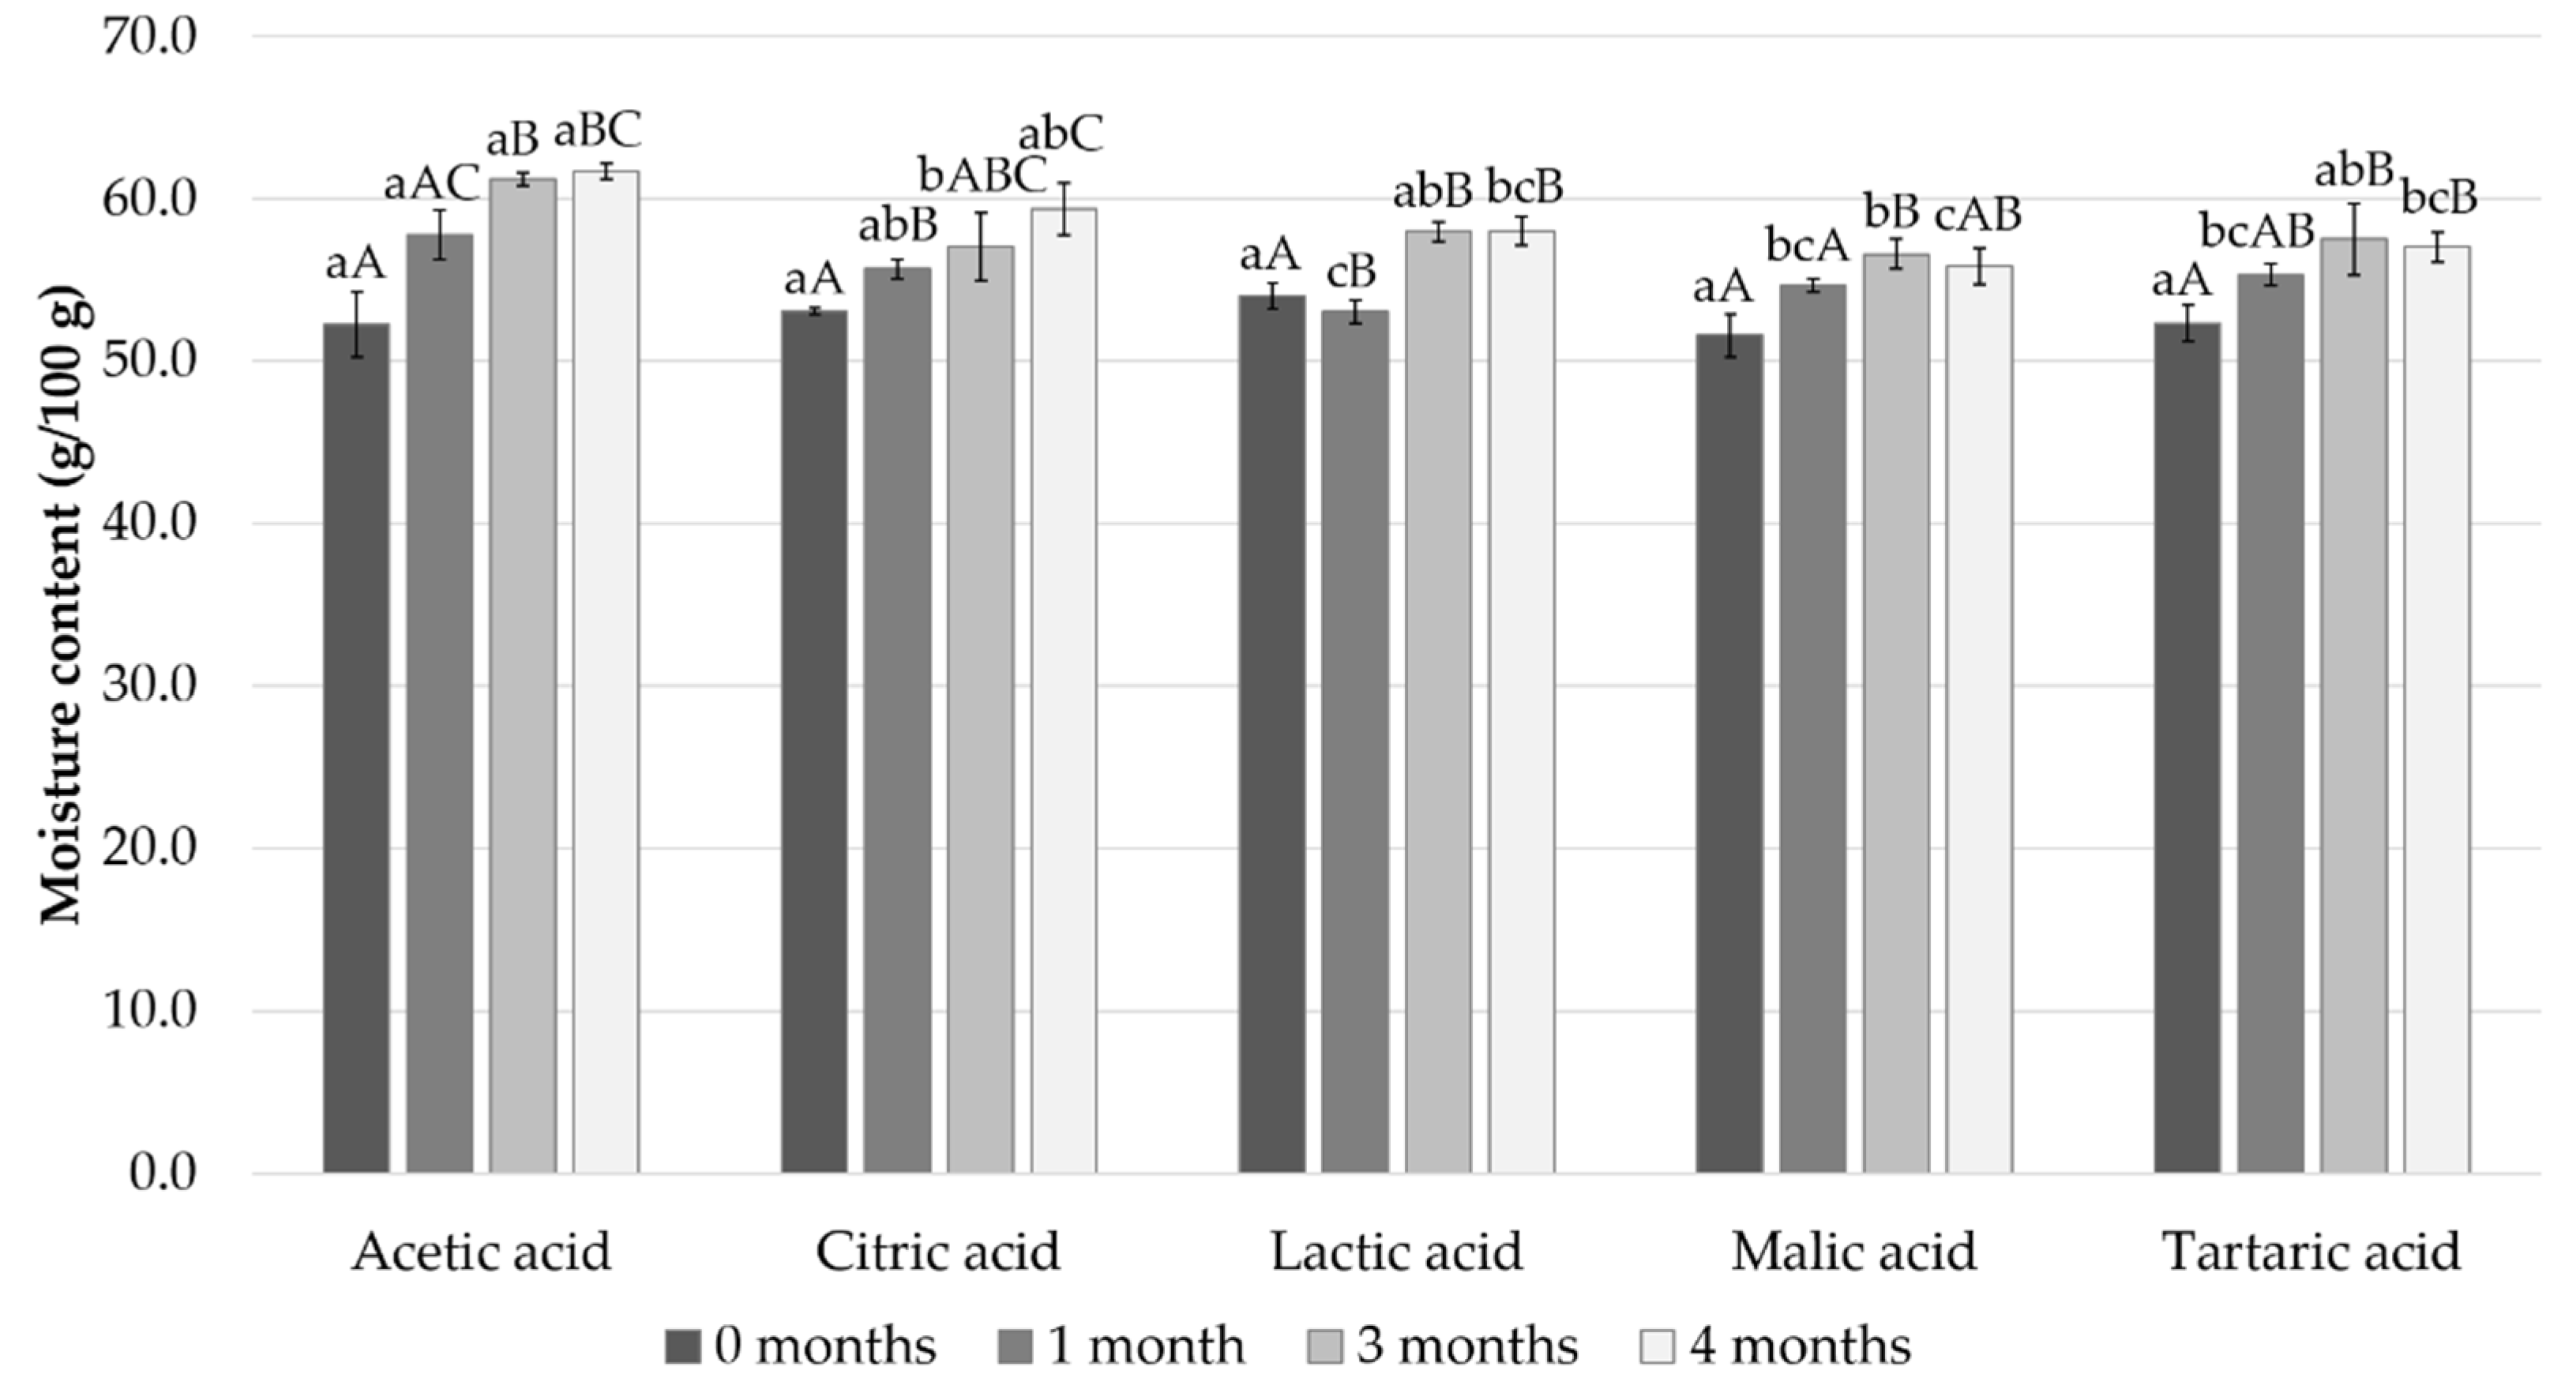
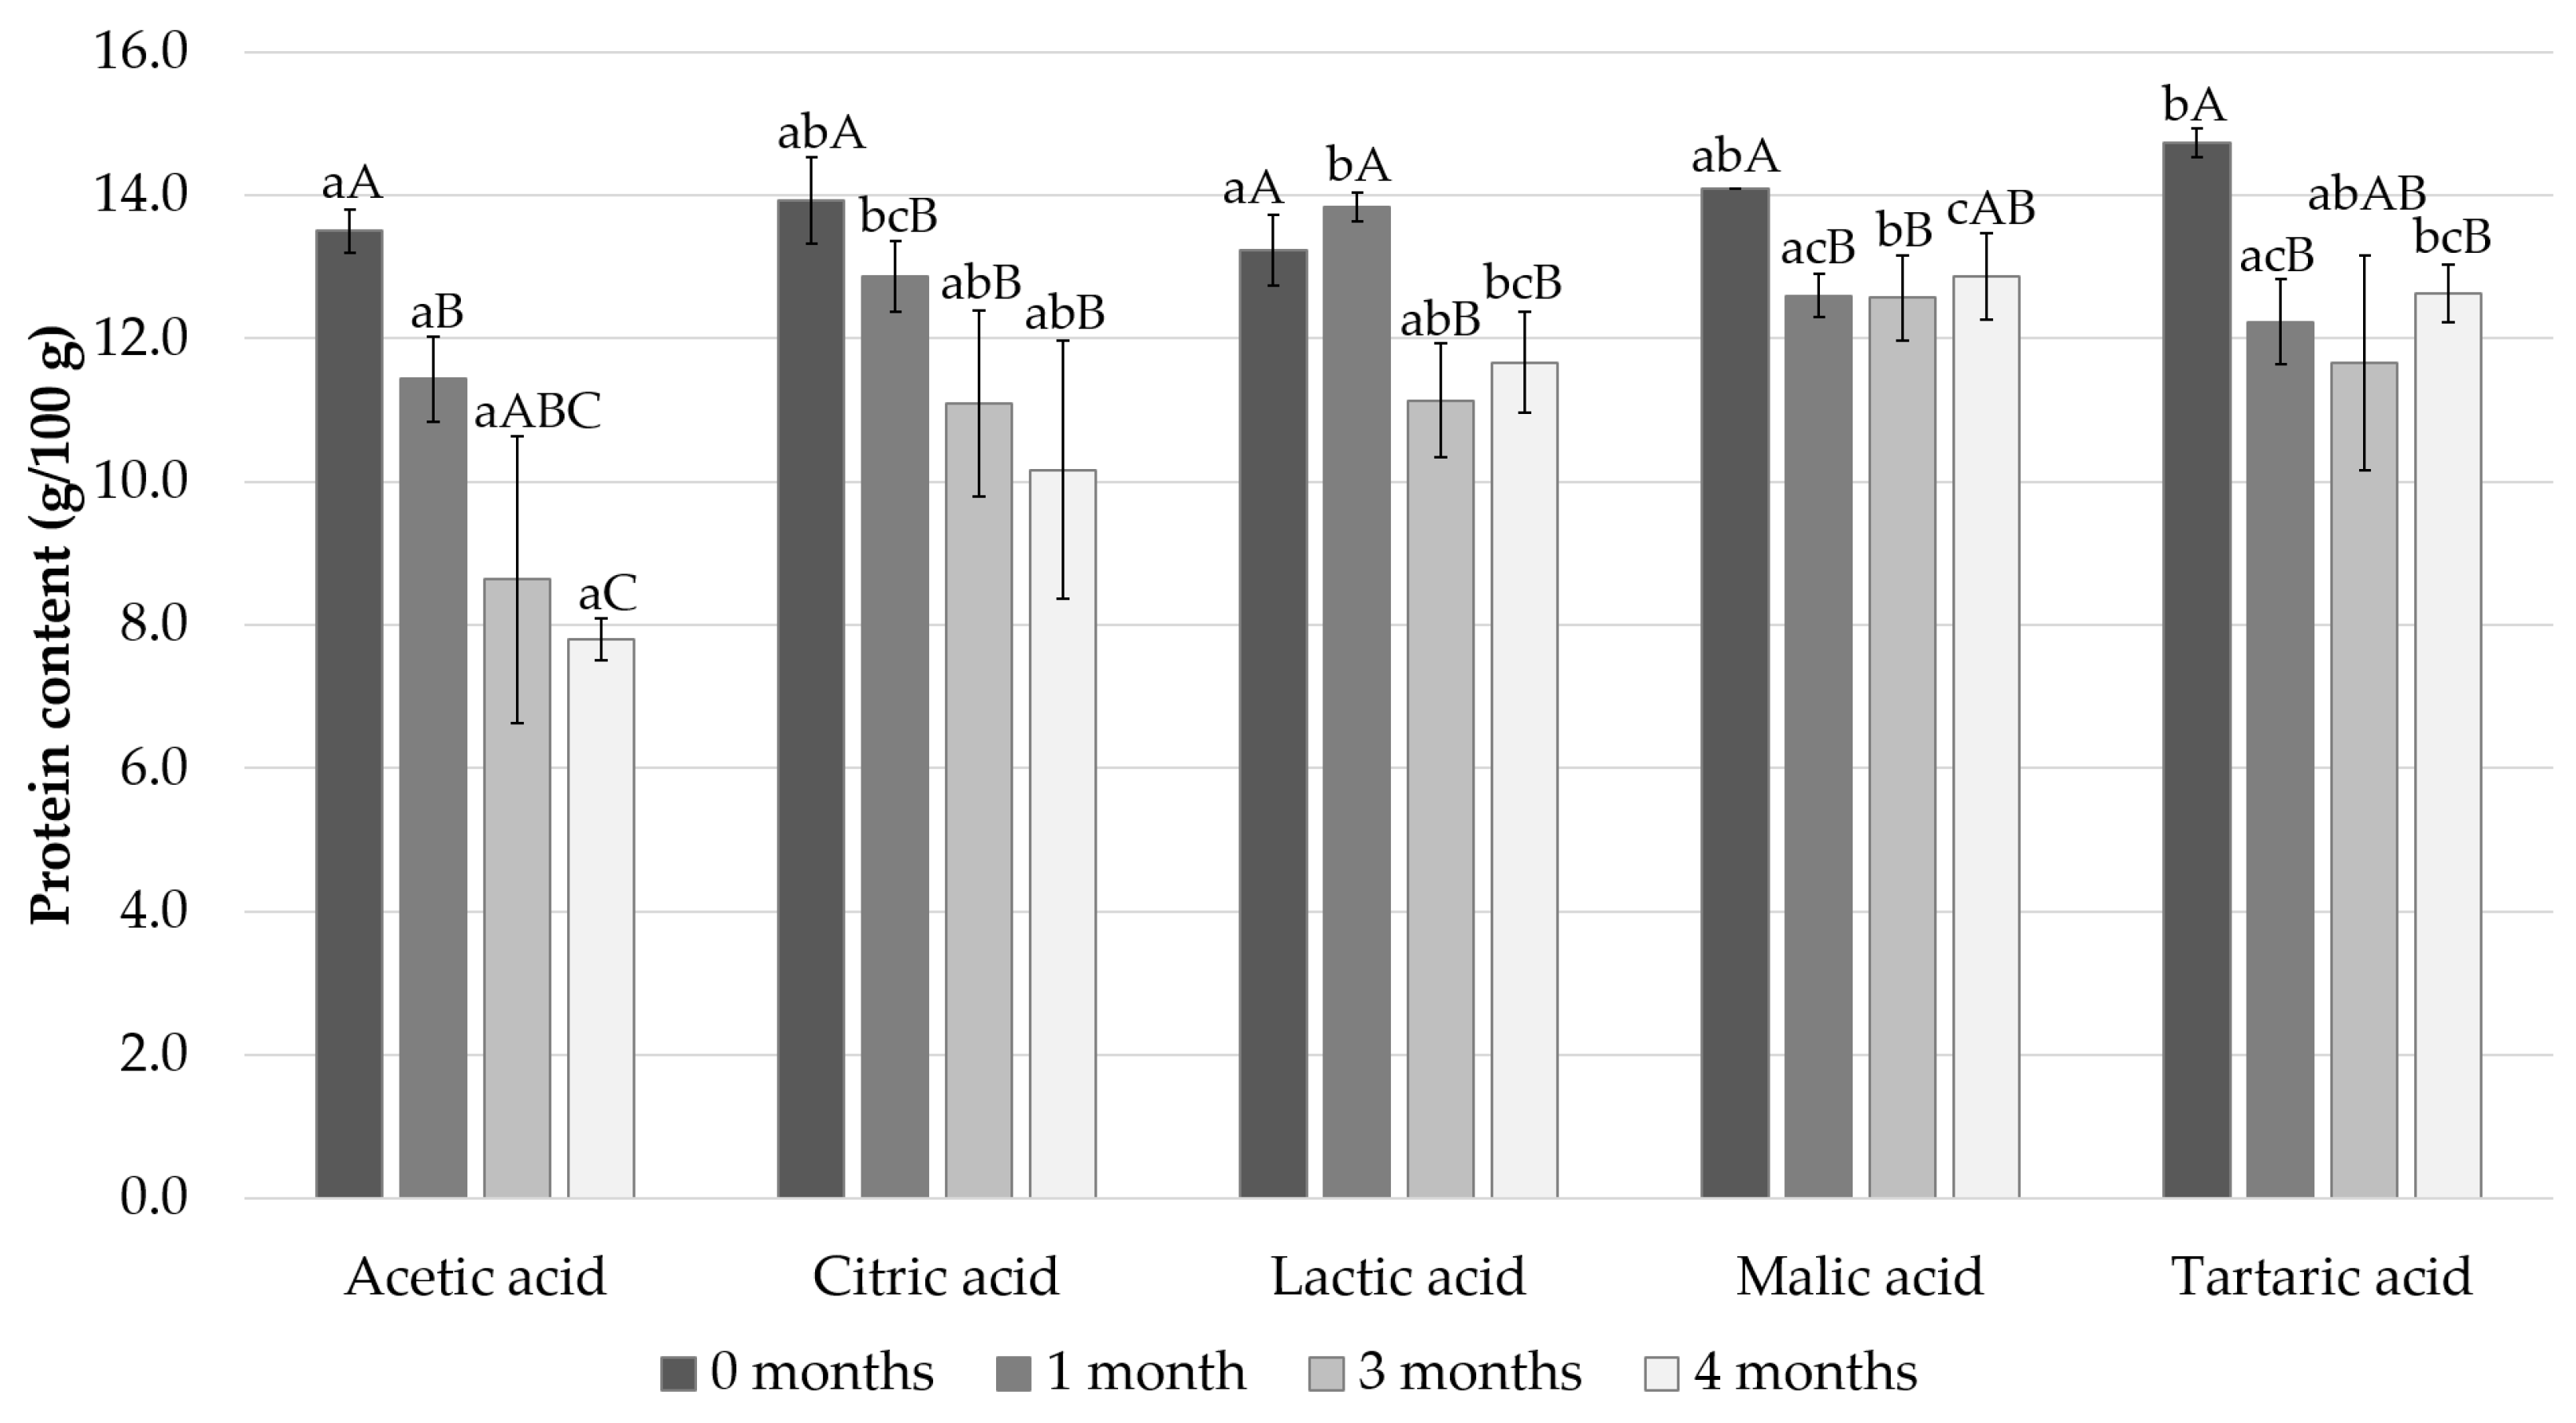
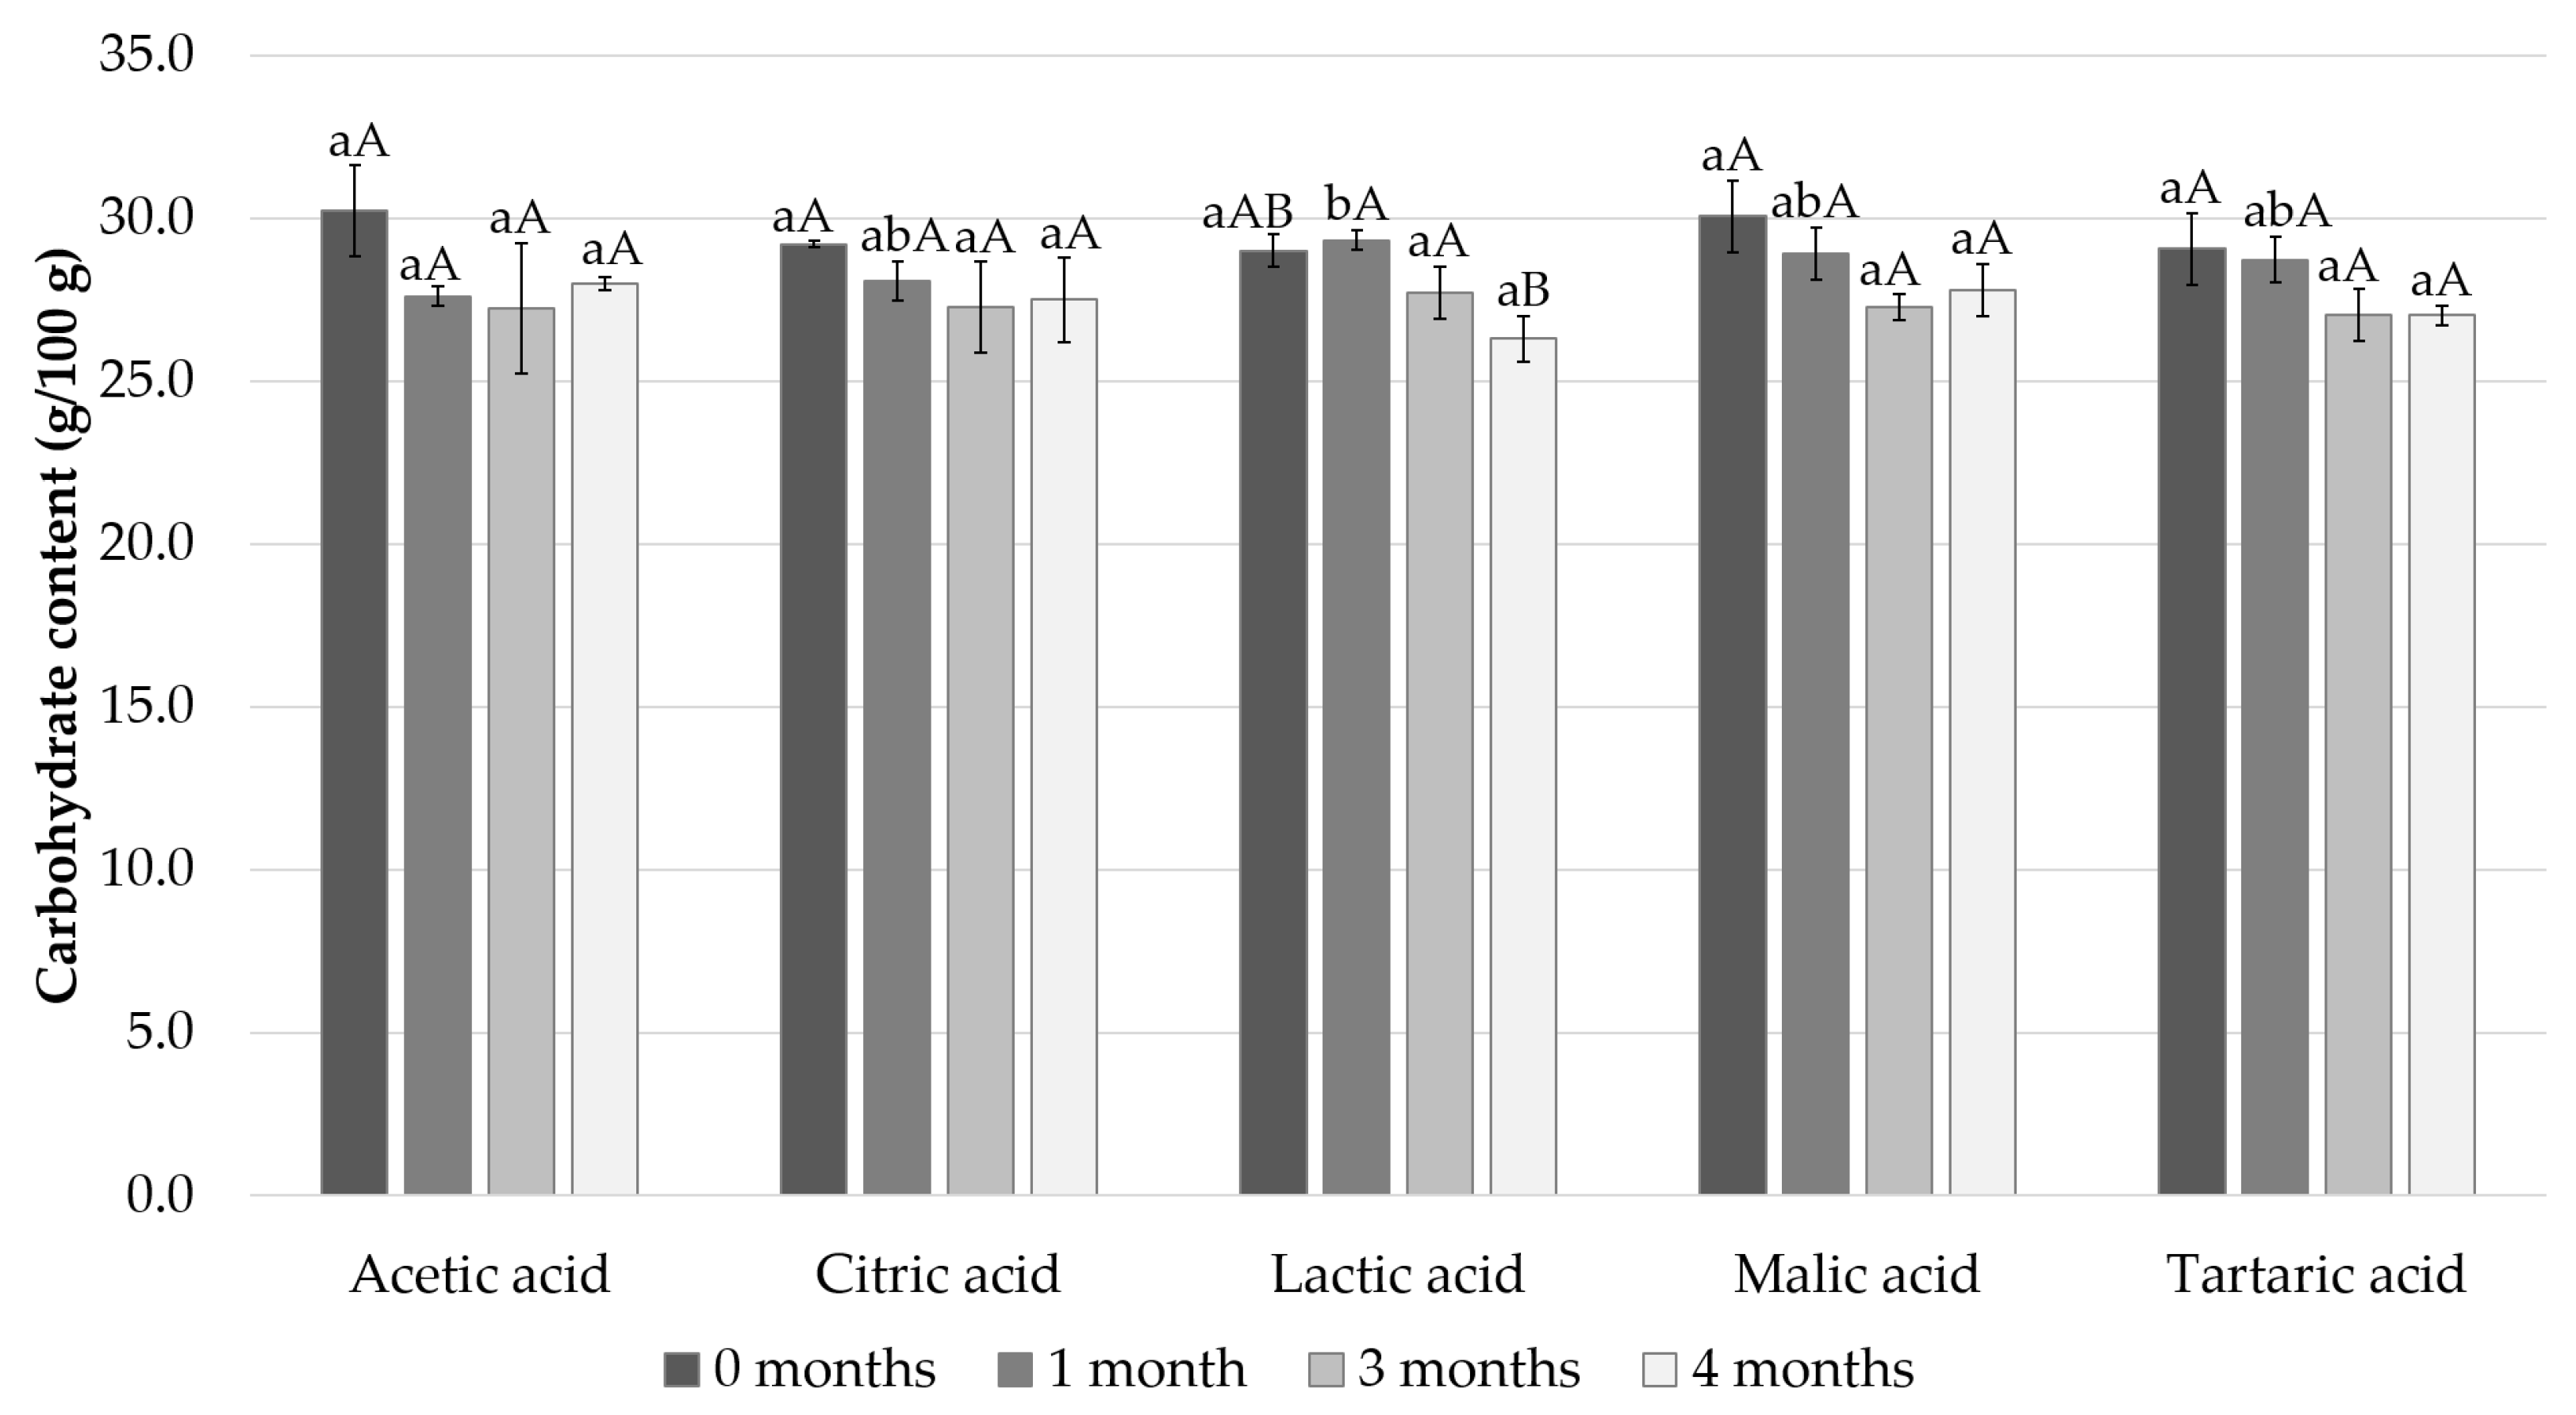
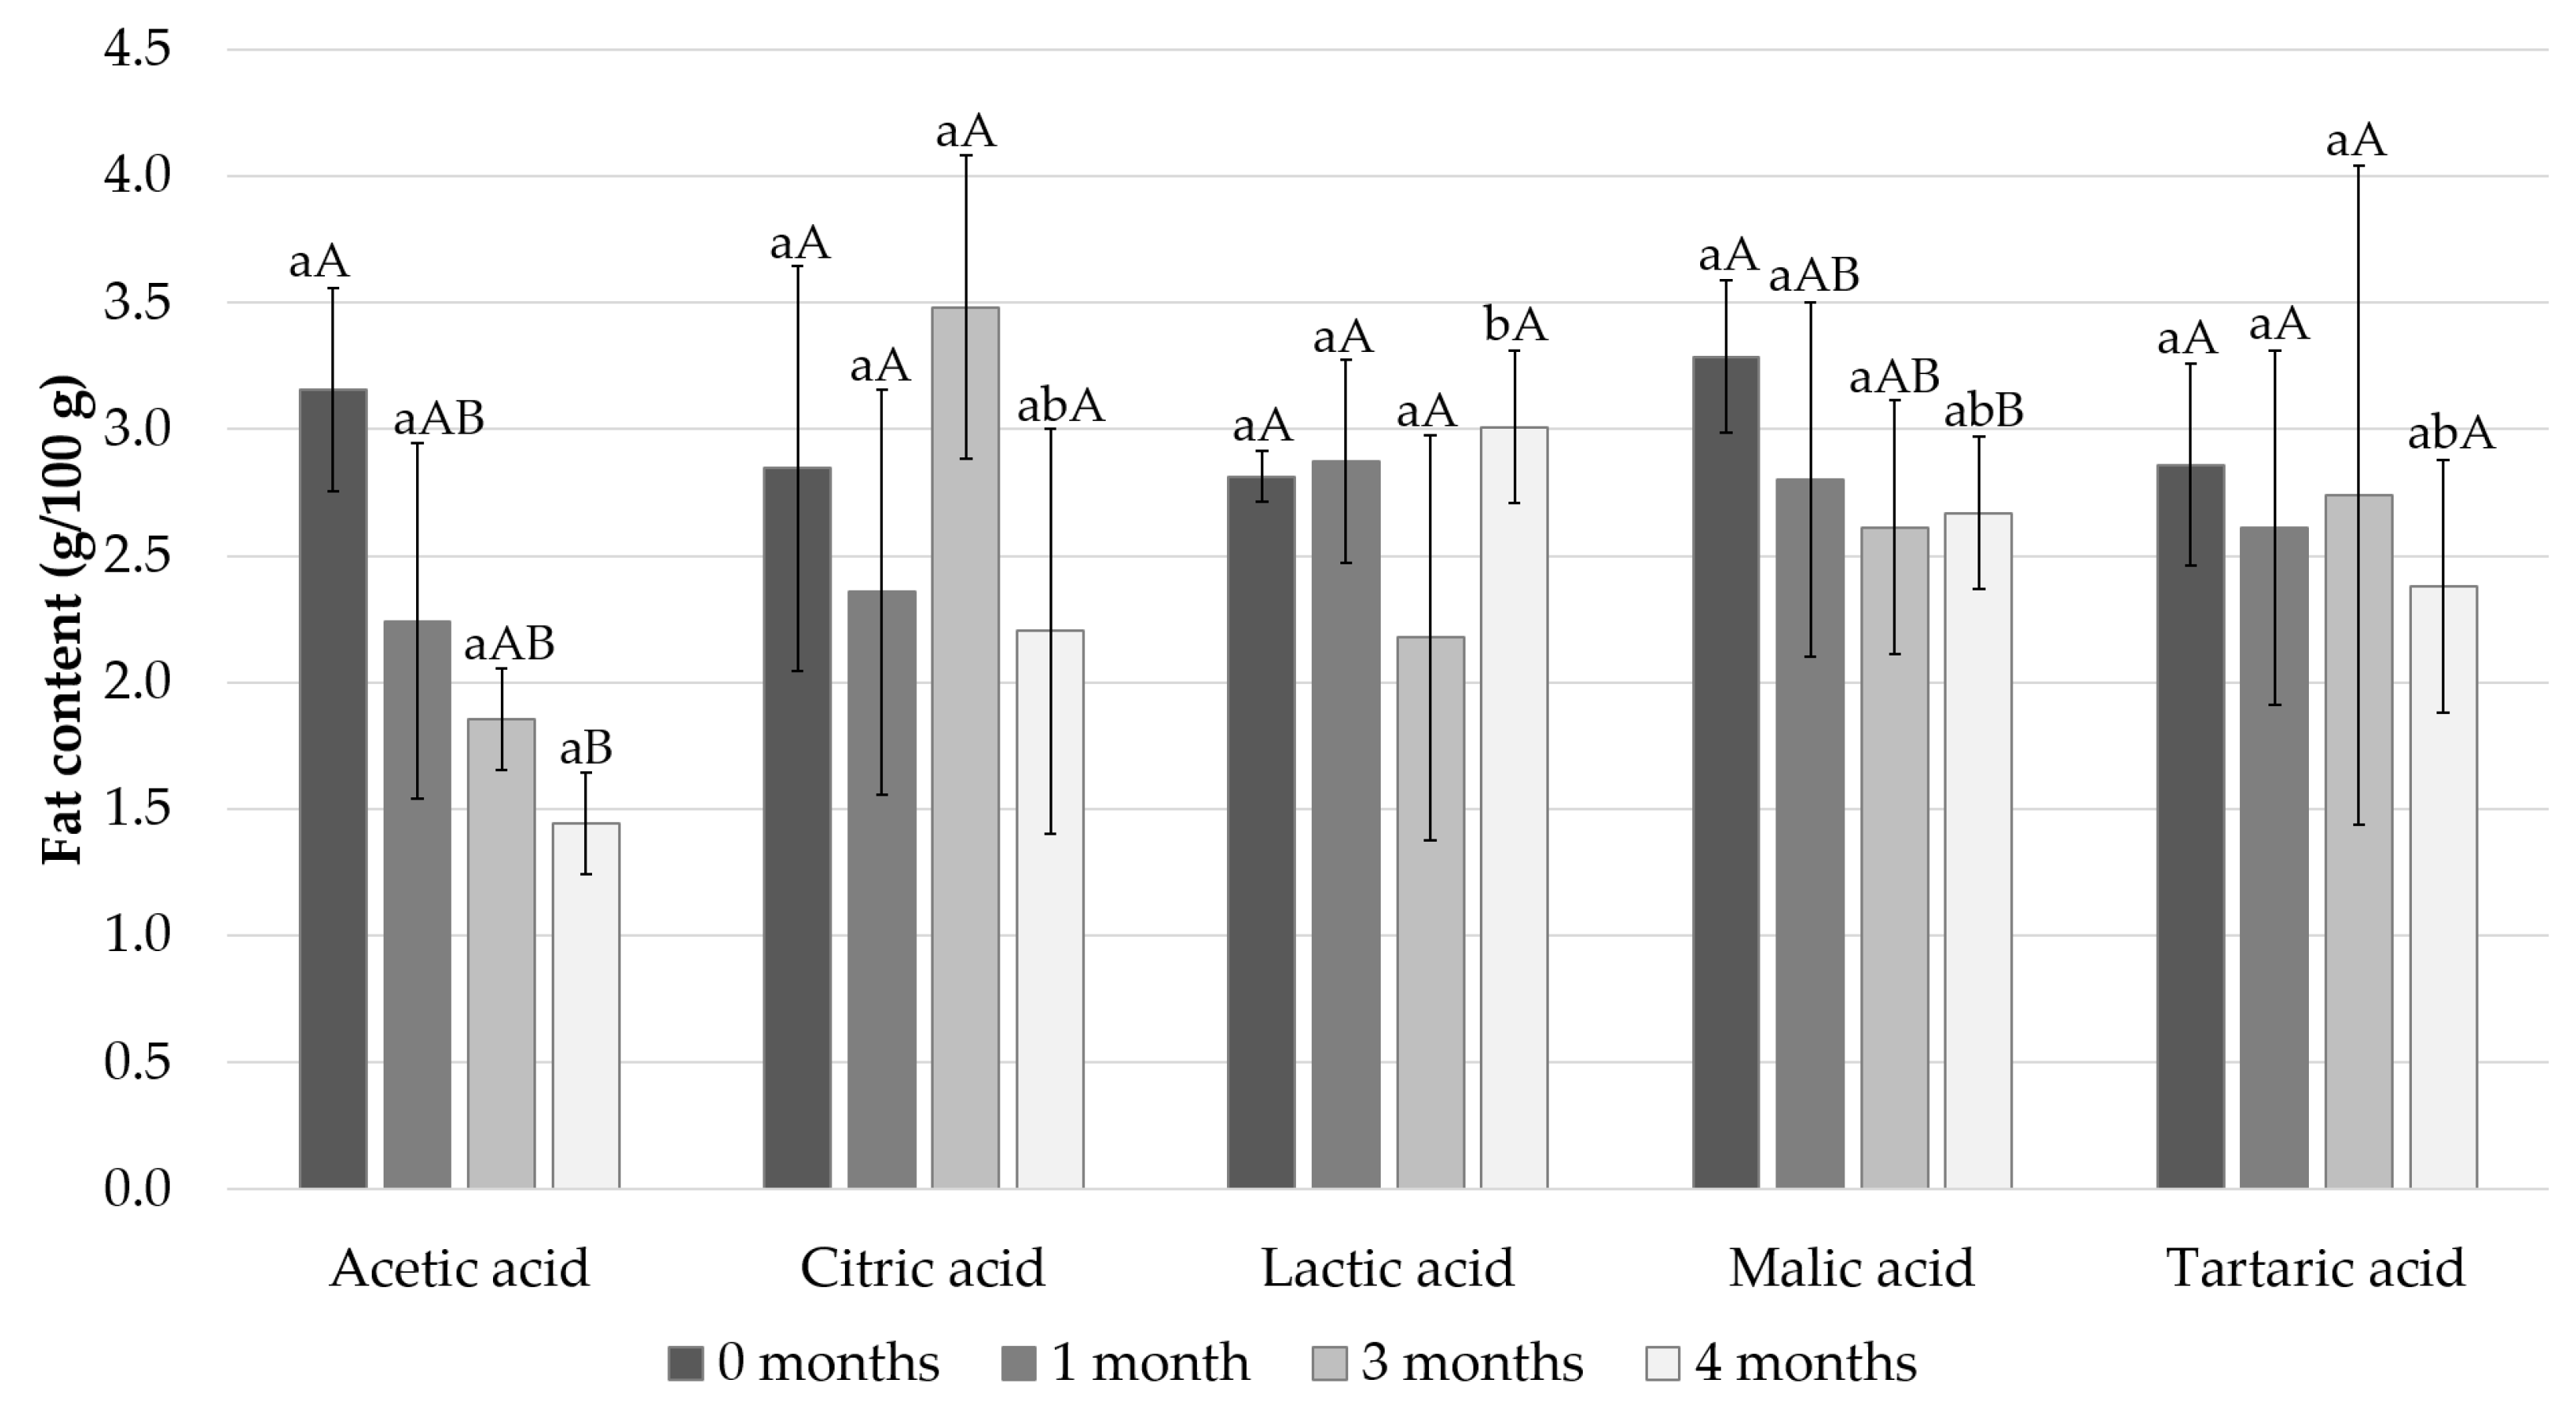
3.3. Composition
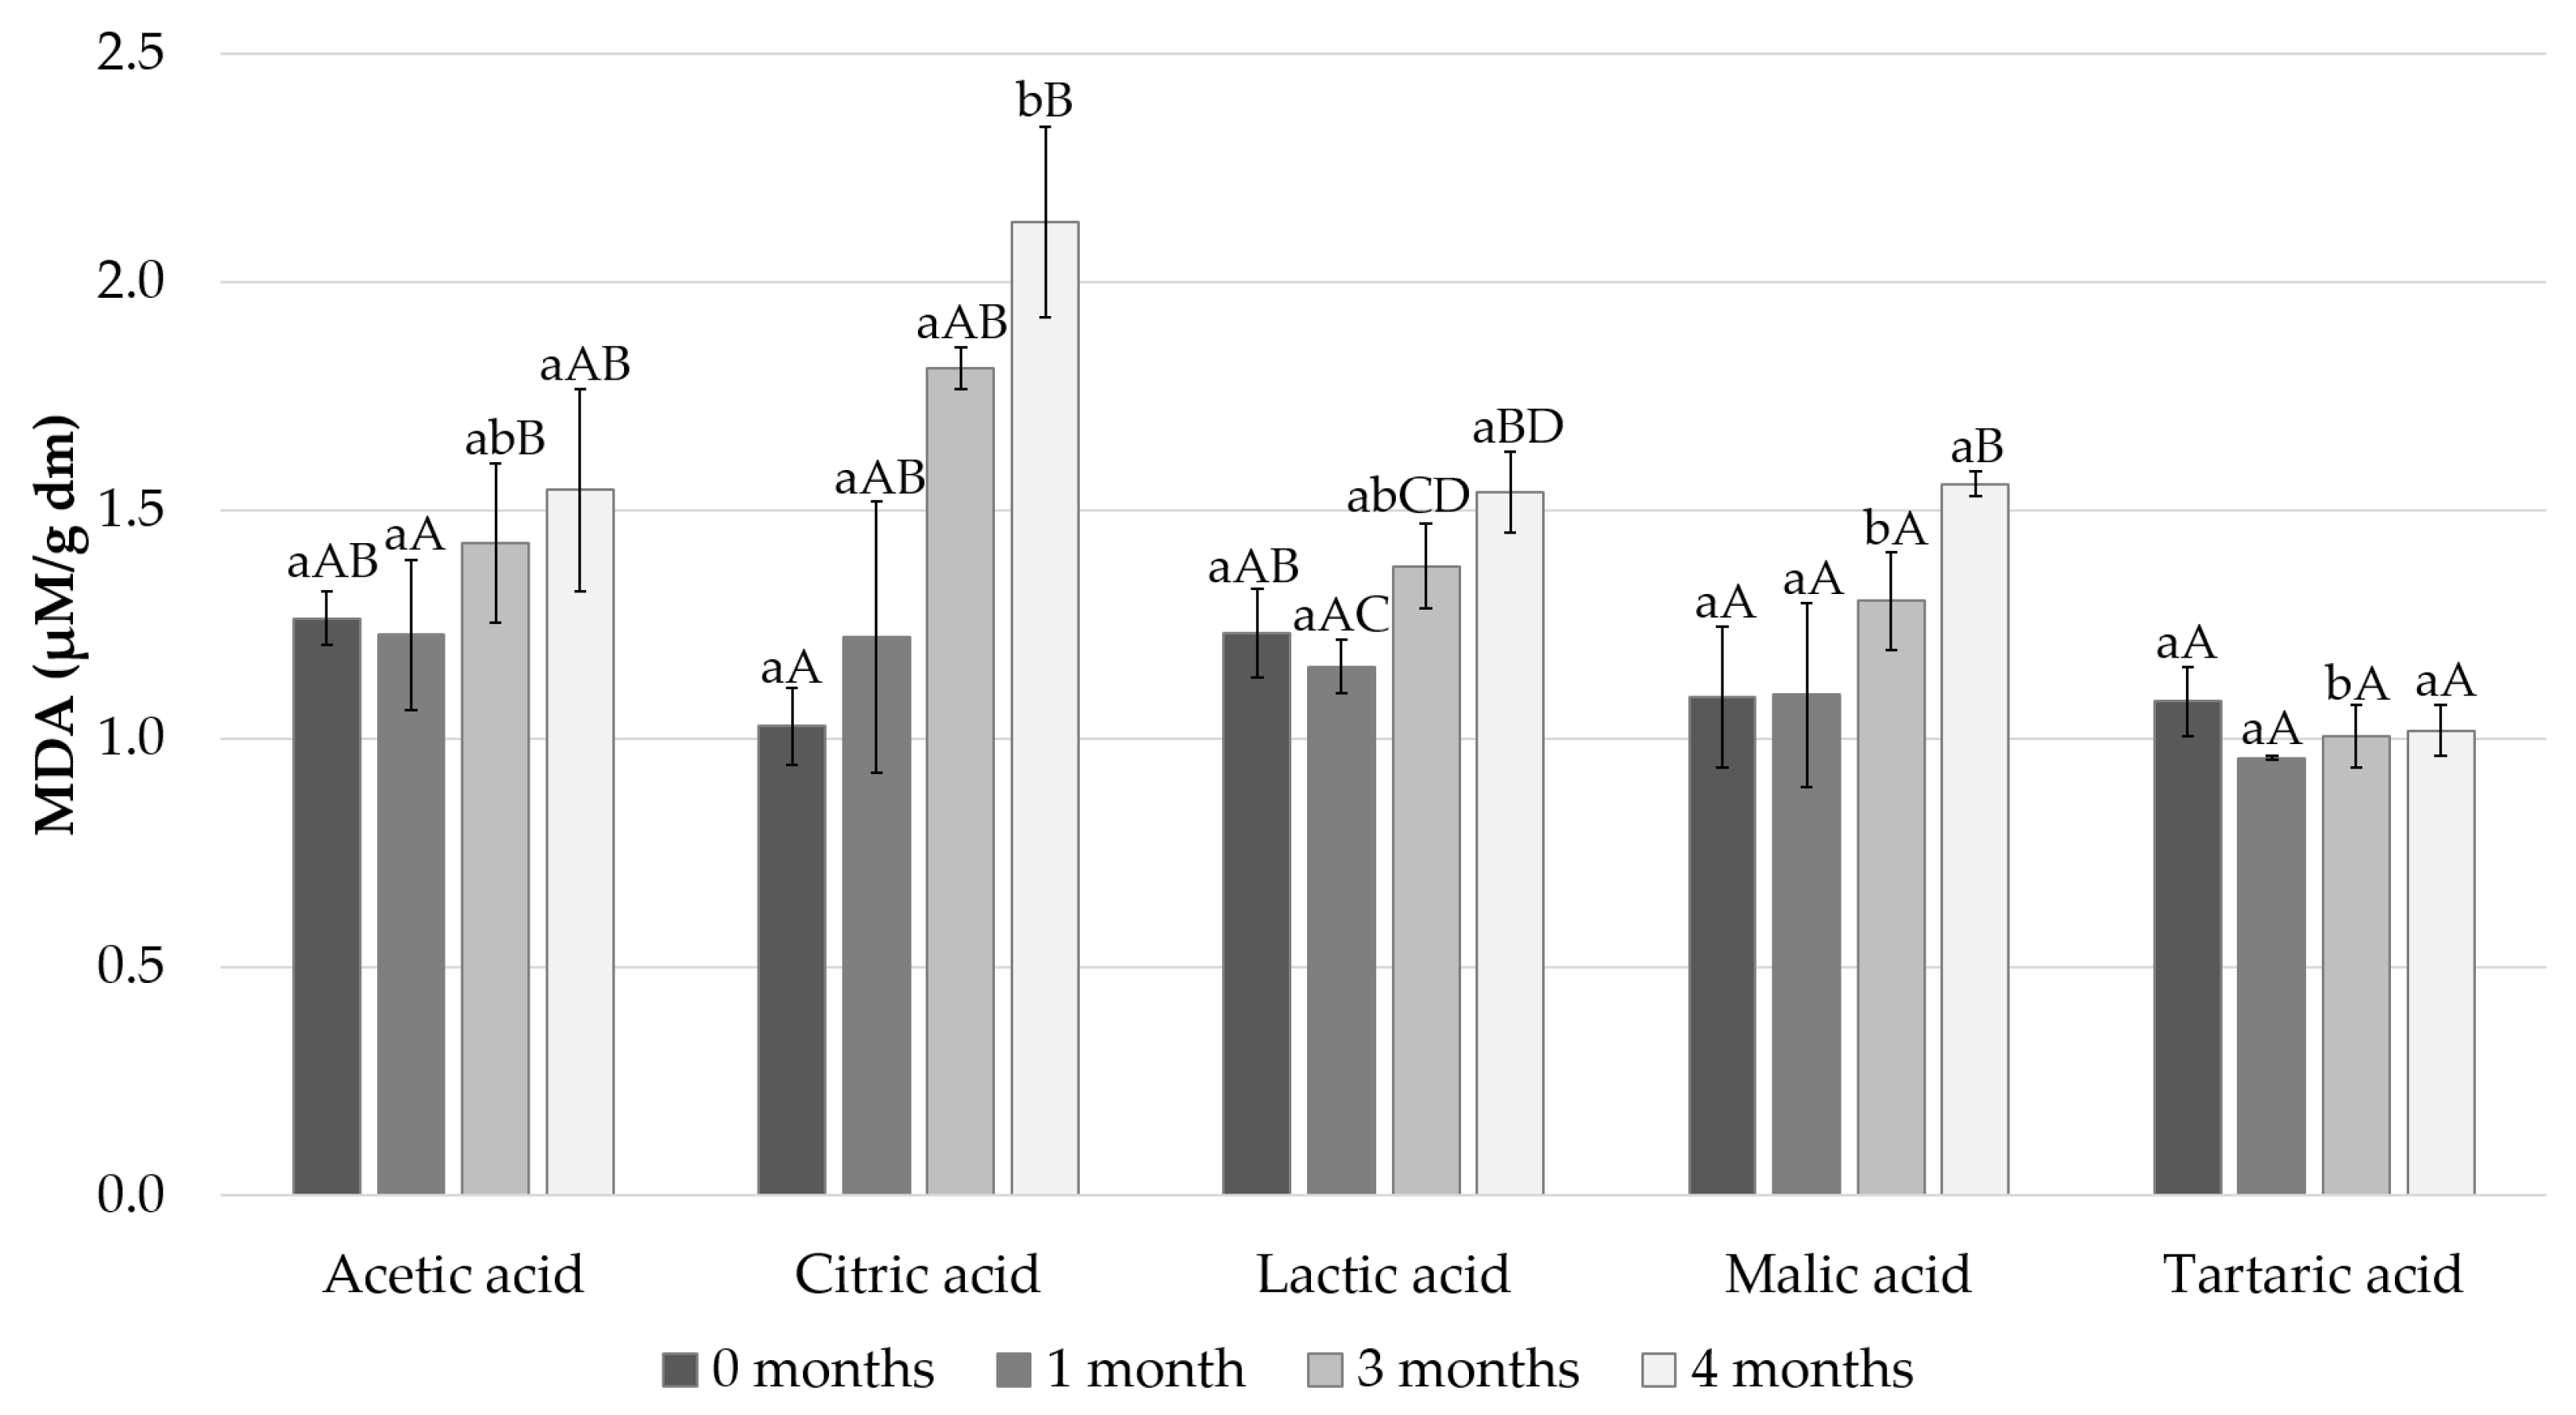
3.4. Lipid Oxidation
3.5. Sensory Profile
4. Discussion
5. Conclusions
Supplementary Materials
Author Contributions
Funding
Institutional Review Board Statement
Informed Consent Statement
Data Availability Statement
Acknowledgments
Conflicts of Interest
References
- Belitz, H.D.; Grosch, W.; Schieberle, P. Food Chemistry, 4th ed.; Springer: Berlin/Heidelberg, Germany, 2009; ISBN 9783540699330. [Google Scholar]
- The European Union One Health 2019 Zoonoses Report; European Food Safety Authority; European Centre for Disease Prevention and Control, 2021.
- Jami, M.; Ghanbari, M.; Zunabovic, M.; Domig, K.J.; Kneifel, W. Listeria monocytogenes in Aquatic Food Products—A Review. Compr. Rev. Food Sci. Food Saf. 2014, 13, 798–813. [Google Scholar] [CrossRef]
- Bergis, H.; Bonanno, L.; Asséré, A.; Lombard, B.; Polet, M.; Andersen, J.K. EURL Lm Technical Guidance Document on Challenge Tests and Durability Studies for Assessing Shelf-Life of Ready-to-Eat Foods Related to Listeria Monocytogenes. Maisons-Alfort, France, 24 August 2021. [Google Scholar]
- Cheng, C.; Yang, Y.; Dong, Z.; Wang, X.; Fang, C.; Yang, M.; Sun, J.; Xiao, L.; Fang, W.; Song, H. Listeria monocytogenes Varies Among Strains to Maintain Intracellular pH Homeostasis Under Stresses by Different Acids as Analyzed by a High-Throughput Microplate-Based Fluorometr. Front. Microbiol. 2015, 6, 15. [Google Scholar] [CrossRef] [PubMed]
- Andrés-Bello, A.; Barreto-Palacios, V.; García-Segovia, P.; Mir-Bel, J.; Martínez-Monzó, J. Effect of pH on Color and Texture of Food Products. Food Eng. Rev. 2013, 5, 158–170. [Google Scholar] [CrossRef]
- Ertbjerg, P.; Mielche, M.M.; Larsen, L.M.; Møller, A.J. Relationship Between Proteolytic Changes and Tenderness in Prerigor Lactic Acid Marinated Beef. J. Sci. Food Agric. 1999, 79, 970–978. [Google Scholar] [CrossRef]
- Damodaran, S.; Parkin, K.L. Fennema’s Food Chemistry, 5th ed.; Kirk, L., Ed.; CRC Press: Boca Raton, FL, USA, 2017; ISBN 1-5231-1785-0. [Google Scholar]
- Burke, R.M.; Monahan, F.J. The Tenderisation of Shin Beef Using a Citrus Juice Marinade. Meat Sci. 2003, 63, 161–168. [Google Scholar] [CrossRef]
- Szymczak, M.; Kołakowski, E.; Felisiak, K. Effect of Addition of Different Acetic Acid Concentrations on the Quality of Marinated Herring. J. Aquat. Food Prod. Technol. 2015, 24, 566–581. [Google Scholar] [CrossRef]
- Topuz, O.K. Effects of Marinating Time, Acetic Acid and Salt Concentrations on the Quality of Little Tunny Fish (Euthynnus alletteratus) Fillet. J. Food Processing Preserv. 2016, 40, 1154–1163. [Google Scholar] [CrossRef]
- Szymczak, M.; Kołakowski, E. Losses of Nitrogen Fractions from Herring to Brine During Marinating. Food Chem. 2012, 132, 237–243. [Google Scholar] [CrossRef]
- Ahmed, Z.; Donkor, O.; Street, W.A.; Vasiljevic, T. Calpains- and Cathepsins-Induced Myofibrillar Changes in Post-Mortem Fish: Impact on Structural Softening and Release of Bioactive Peptides. Trends Food Sci. Technol. 2015, 45, 130–146. [Google Scholar] [CrossRef]
- Fusek, M.; Mares, M.; Vetvicka, V. Cathepsin, D. Handbook of Proteolytic Enzymes; Rawlings, N.D., Salvesen, G., Eds.; Academic Press: Cambridge, MA, USA, 2013; Volume 1, pp. 54–63. ISBN 9780123822192. [Google Scholar]
- Wang, P.A.; Stenvik, J.; Larsen, R.; Maehre, H.; Olsen, R.L. Cathepsin D from Atlantic Cod (Gadus morhua L.) Liver. Isolation and Comparative Studies. Comp. Biochem. Physiol. 2007, 147, 504–511. [Google Scholar] [CrossRef][Green Version]
- Szymczak, M.; Lepczyński, A. Occurrence of Aspartyl Proteases in Brine After Herring Marinating. Food Chem. 2016, 194, 470–475. [Google Scholar] [CrossRef] [PubMed]
- Richards, M.P.; Modra, A.M.; Li, R. Role of Deoxyhemoglobin in Lipid Oxidation of Washed Cod Muscle Mediated by Trout, Poultry and Beef Hemoglobins. Meat Sci. 2002, 62, 157–163. [Google Scholar] [CrossRef]
- Damerau, A.; Kakko, T.; Tian, Y.; Tuomasjukka, S.; Sandell, M.; Hopia, A.; Yang, B. Effect of Supercritical CO2 Plant Extract and Berry Press Cakes on Stability and Consumer Acceptance of Frozen Baltic Herring (Clupea harengus membras) Mince. Food Chem. 2020, 332, 127396. [Google Scholar] [CrossRef]
- Aitta, E.; Marsol-Vall, A.; Damerau, A.; Yang, B. Enzyme-Assisted Extraction of Fish Oil from Whole Fish and By-Products of Baltic Herring (Clupea harengus membras). Foods 2021, 10, 1811. [Google Scholar] [CrossRef] [PubMed]
- Ke, S.; Huang, Y.; Decker, E.A.; Hultin, H.O. Impact of Citric Acid on the Tenderness, Microstructure and Oxidative Stability of Beef Muscle. Meat Sci. 2009, 82, 113–118. [Google Scholar] [CrossRef]
- Pourashouri, P.; Shabanpour, B.; Aubourg, S.P.; Rohi, J.D.; Shabani, A. An Investigation of Rancidity Inhibition During Frozen Storage of Wels Catfish (Silurus glanis) Fillets by Previous Ascorbic and Citric Acid Treatment. Int. J. Food Sci. Technol. 2009, 44, 1503–1509. [Google Scholar] [CrossRef]
- Kawai, M.; Sekine-Hayakawa, Y.; Okiyama, A.; Ninomiya, Y. Gustatory Sensation of L- and D-Amino Acids in Humans. Amino Acids 2012, 43, 2349–2358. [Google Scholar] [CrossRef] [PubMed]
- Demirok, E.; Kolsarici, N.; Çelik, S.; Doğan, Z.; Hamdan, S.; Öztürk, F. Proteolytic and Sensory Changes During Marination of Rainbow Trout (Oncorhynchus mykiss) Flesh in Pomegranate Juice. J. Aquat. Food Prod. Technol. 2014, 23, 621–632. [Google Scholar] [CrossRef]
- Šimat, V.; Mićunović, A.; Bogdanović, T.; Listeš, I.; Generalić Mekinić, I.; Hamed, I.; Skroza, D. The Impact of Lemon Juice on the Marination of Anchovy (Engraulis encrasicolus): Chemical, Microbiological and Sensory Changes. Ital. J. Food Sci. 2019, 31, 604–617. [Google Scholar] [CrossRef]
- Babikova, J.; Hoeche, U.; Boyd, J.; Noci, F. Nutritional, Physical, Microbiological, and Sensory Properties of Marinated Irish Sprat. Int. J. Gastron. Food Sci. 2020, 22, 100277. [Google Scholar] [CrossRef]
- Nielsen, D.; Hyldig, G.; Nielsen, H.H.; Nielsen, J. Sensory Properties of Marinated Herring (Clupea harengus)—Influence of Fishing Ground and Season. J. Aquat. Food Prod. Technol. 2004, 13, 3–24. [Google Scholar] [CrossRef]
- Nielsen, D.; Hyldig, G.; Nielsen, J.; Nielsen, H.H. Sensory Properties of Marinated Herring (Clupea harengus) Processed from Raw Material from Commercial Landings. J. Sci. Food Agric. 2005, 85, 127–134. [Google Scholar] [CrossRef]
- SFS-EN ISO 11290-1:2017: En. Available online: https://sales.sfs.fi/fi/index/tuotteet/SFS/CENISO/ID2/1/515736.html.stx (accessed on 2 February 2022).
- Mäkinen, S.; Hellström, J.; Mäki, M.; Korpinen, R.; Mattila, P.H. Bilberry and Sea Buckthorn Leaves and Their Subcritical Water Extracts Prevent Lipid Oxidation in Meat Products. Foods 2020, 9, 265. [Google Scholar] [CrossRef] [PubMed]
- Parisi, S. Oxidative Stability and Shelf Life of Foods Containing Oils and Fats. Anal. Bioanal. Chem. 2016, 408, 7549–7550. [Google Scholar] [CrossRef]
- Ricke, S.C. Perspectives on the Use of Organic Acids and Short Chain Fatty Acids as Antimicrobials. Poult. Sci. 2003, 82, 632–639. [Google Scholar] [CrossRef]
- Castellini, M.A.; Somero, G.N. Buffering Capacity of Vertebrate Muscle: Correlations with Potentials for Anaerobic Function. J. Comp. Physiol. 1981, 143, 191–198. [Google Scholar] [CrossRef]
- Gallart-Jornet, L.; Barat, J.M.; Rustad, T.; Erikson, U.; Escriche, I.; Fito, P. A Comparative Study of Brine Salting of Atlantic Cod (Gadus morhua) and Atlantic Salmon (Salmo salar). J. Food Eng. 2007, 79, 261–270. [Google Scholar] [CrossRef]
- Thorarinsdottir, K.A.; Arason, S.; Sigurgisladottir, S.; Gunnlaugsson, V.N.; Johannsdottir, J.; Tornberg, E. The Effects of Salt-Curing and Salting Procedures on the Microstructure of Cod (Gadus morhua) Muscle. Food Chem. 2011, 126, 109–115. [Google Scholar] [CrossRef]
- Erikson, U.; Veliyulin, E.; Singstad, T.E.; Aursand, M. Salting and Desalting of Fresh and Frozen-Thawed Cod (Gadus morhua) Fillets: A Comparative Study Using 23Na NMR, 23Na MRI, Low-Field 1H NMR, and Physicochemical Analytical Methods. J. Food Sci. 2004, 69, 107–114. [Google Scholar] [CrossRef]
- McLay, R.; Pirie, R. Development of Marinated Herring. Int. J. Food Sci. Technol. 1971, 6, 29–38. [Google Scholar] [CrossRef]
- Halamíčková, A.; Malota, L. Muscle Thiobarbituric Acid Reactive Substance of the Atlantic Herring (Clupea harengus) in Marinades Collected in the Market Network. Acta Vet. Brno 2010, 79, 329–333. [Google Scholar] [CrossRef][Green Version]
- Larsson, K.; Almgren, A.; Undeland, I. Hemoglobin-Mediated Lipid Oxidation and Compositional Characteristics of Washed Fish Mince Model Systems Made from Cod (Gadus morhua), Herring (Clupea harengus), and Salmon (Salmo salar) Muscle. J. Agric. Food Chem. 2007, 55, 9027–9035. [Google Scholar] [CrossRef] [PubMed]
- Refsgaard, H.H.F.; Brockhoff, P.B.; Jensen, B. Sensory and Chemical Changes in Farmed Atlantic Salmon (Salmo solar) during Frozen Storage. J. Agric. Food Chem. 1998, 46, 3473–3479. [Google Scholar] [CrossRef]


| Acid | Concentration in Pickling Solution (g/L) | Concentration in Marinade Solution (g/L) | pH of Pickling Solution | pH at the End of Pickling |
|---|---|---|---|---|
| Acetic acid | 50.0 | 0.67 | 2.40 ± 0.00 | 3.85 ± 0.01 |
| Citric acid | 20.0 | 0.17 | 1.90 ± 0.01 | 3.63 ± 0.01 |
| Lactic acid | 20.0 | 0.16 | 2.10 ± 0.01 | 3.56 ± 0.01 |
| Malic acid | 20.0 | 0.14 | 2.03 ± 0.01 | 3.53 ± 0.01 |
| Tartaric acid | 21.5 | 0.11 | 1.78 ± 0.01 | 3.24 ± 0.01 |
| Sensory Properties | Attribute | Reference Sample (Intensity) |
|---|---|---|
| Odor | Total intensity | Verbal instructions |
| Sweet | Felix American pickled cucumber (5) | |
| Vinegar | 1.25% (v/v) acetic acid (5) | |
| Fish | Verbal instructions | |
| Stuffy | Verbal instructions | |
| Rancid | Verbal instructions | |
| Metallic 1 | Verbal instructions | |
| Texture | Crumbly | Pirkka salad cheese, lactose free (9) |
| Moistness | Pirkka salad cheese, lactose free (3) | |
| Taste | Total intensity | Verbal instructions |
| Sweet | 2.0% (w/v) sucrose (5) | |
| Salty | 0.2% (w/v) NaCl (5) | |
| Umami | 0.1% and 0.2% (w/v) L-Glutamic acid monosodium salt monohydrate (5 and 8, respectively) 2 | |
| Sour | 0.04% (w/v) citric acid (5) | |
| Bitter | 0.04% (w/v) caffeine (6) | |
| Flavor | Vinegar | 0.63% (v/v) acetic acid (6) |
| Fish | Verbal instructions | |
| Stuffy | Verbal instructions | |
| Rancid | Verbal instructions | |
| Metallic | Verbal instructions |
| Acid | 0 Months | 1 Month | 3 Months | 4 Months |
|---|---|---|---|---|
| Acetic acid | 1.00 | <1.00 | n.d. 1 | <1.00 |
| Citric acid | 2.58 | 1.00 | n.d. 1 | 1.00 |
| Lactic acid | 2.01 | 1.40 | n.d. 1 | 1.40 |
| Malic acid | 1.85 | 1.30 | n.d. 1 | 1.30 |
| Tartaric acid | 1.48 | <1.00 | n.d. 1 | <1.00 |
| Acid | 0 Months | 1 Month | 3 Months | 4 Months |
|---|---|---|---|---|
| Acetic acid | 3.78 ± 0.06 abA | 3.83 ± 0.03 abA | 3.91 ± 0.03 abA | 3.80 ± 0.08 Aa |
| Citric acid | 4.02 ± 0.04 Ca | 4.13 ± 0.05 Cb | 4.14 ± 0.08 Cb | 4.19 ± 0.12 Cab |
| Lactic acid | 3.96 ± 0.02 Ca | 3.98 ± 0.06 bcA | 4.12 ± 0.04 Cb | 4.09 ± 0.11 bcAB |
| Malic acid | 3.87 ± 0.01 Ba | 3.86 ± 0.09 abA | 4.02 ± 0.05 bcB | 3.93 ± 0.04 abAB |
| Tartaric acid | 3.68 ± 0.09 Aa | 3.79 ± 0.17 Aab | 3.92 ± 0.18 Ab | 3.87 ± 0.12 Ab |
| Attribute 1 | Months | Acetic Acid | Citric Acid | Lactic Acid | Malic Acid | Tartaric Acid |
|---|---|---|---|---|---|---|
| O_total | 0 | 7.4 ± 1.8 aA | 4.6 ± 1.8 bA | 5.4 ± 1.5 bA | 4.8 ± 1.5 bA | 5.7 ± 1.7 bA |
| 1 | 8.4 ± 0.9 aB | 4.7 ± 1.5 bA | 5.5 ± 1.6 bcA | 5.4 ± 1.1 bcA | 6.0 ± 1.5 cA | |
| 4 | 8.1 ± 1.4 aAB | 4.9 ± 1.4 bA | 5.5 ± 1.7 bA | 5.0 ± 1.6 bA | 5.7 ± 1.3 bA | |
| O_sweet | 0 | 2.4 ± 1.5 aA | 1.9 ± 1.5 aA | 1.7 ± 1.2 aA | 1.6 ± 1.5 aA | 1.8 ± 1.5 aA |
| 1 | 2.3 ± 1.2 aA | 1.9 ± 1.3 aA | 2.0 ± 1.6 aA | 2.1 ± 1.6 aA | 1.9 ± 1.8 aA | |
| 4 | 2.9 ± 2.2 aA | 2.2 ± 1.4 aA | 2.4 ± 1.7 aA | 2.1 ± 1.7 aA | 2.7 ± 1.5 aA | |
| O_vinegar | 0 | 6.7 ± 2.8 aA | 2.0 ± 2.0 bA | 2.0 ± 2.4 bA | 1.9 ± 1.9 bA | 1.9 ± 1.9 bA |
| 1 | 8.1 ± 1.2 aB | 1.6 ± 1.3 bA | 2.0 ± 1.7 bA | 2.4 ± 1.8 bA | 2.5 ± 2.2 bA | |
| 4 | 8.6 ± 1.0 aAB | 3.0 ± 2.1 bA | 3.7 ± 2.3 bA | 2.7 ± 2.2 bA | 3.2 ± 2.2 bA | |
| O_fish | 0 | 3.1 ± 2.0 aA | 3.4 ± 2.2 aA | 4.2 ± 2.2 aA | 4.3 ± 2.2 aA | 4.6 ± 2.5 aA |
| 1 | 2.7 ± 1.4 aA | 3.5 ± 1.9 abA | 4.3 ± 1.6 bA | 4.0 ± 1.5 bA | 4.3 ± 1.5 bA | |
| 4 | 2.5 ± 1.6 aA | 4.1 ± 1.7 bA | 4.8 ± 1.8 bA | 4.9 ± 1.6 bA | 5.0 ± 1.6 bA | |
| O_stuffy | 0 | 1.3 ± 1.8 aA | 2.0 ± 2.3 aA | 1.7 ± 2.3 aA | 1.7 ± 2.0 aA | 2.0 ± 2.2 aA |
| 1 | 0.4 ± 0.6 aA | 2.1 ± 1.9 bA | 1.7 ± 1.5 bA | 1.2 ± 1.1 bA | 1.8 ± 1.6 bA | |
| 4 | 1.2 ± 1.5 aA | 2.1 ± 1.7 aA | 2.2 ± 1.8 aA | 1.8 ± 1.5 aA | 2.0 ± 1.3 aA | |
| O_rancid | 0 | 0.9 ± 2.1 aA | 1.7 ± 2.4 aA | 1.7 ± 2.6 aA | 2.1 ± 2.6 aA | 2.2 ± 2.9 aA |
| 1 | 1.2 ± 2.3 aA | 2.3 ± 2.5 aA | 2.4 ± 2.4 aA | 2.0 ± 2.2 aA | 2.3 ± 2.3 aA | |
| 4 | 0.5 ± 1.1 aA | 2.0 ± 2.5 aA | 1.7 ± 1.7 aA | 1.7 ± 1.9 aA | 2.0 ± 2.2 aA | |
| O_metallic | 1 | 0.8 ± 0.9 aA | 1.3 ± 1.2 aA | 1.1 ± 1.2 aA | 1.6 ± 1.1 aA | 1.8 ± 1.5 aA |
| 4 | 1.6 ± 1.8 aA | 1.9 ± 1.7 aA | 2.2 ± 2.0 aB | 2.1 ± 1.9 aA | 2.0 ± 1.1 aA | |
| Tx_crumbly | 0 | 8.0 ± 1.9 aA | 5.4 ± 1.9 bA | 6.2 ± 1.9 bA | 6.3 ± 1.8 bA | 6.4 ± 1.8 bA |
| 1 | 9.4 ± 0.9 aB | 7.5 ± 1.7 bcB | 7.5 ± 1.6 bcB | 7.2 ± 1.6 bA | 8.4 ± 1.1 cB | |
| 4 | 9.9 ± 0.3 aC | 9.3 ± 0.7 bC | 9.4 ± 1.1 abC | 8.8 ± 1.2 bB | 9.2 ± 1.1 abB | |
| Tx_moistness | 0 | 7.0 ± 1.3 aA | 5.4 ± 1.4 bA | 5.1 ± 1.4 bA | 5.7 ± 1.4 bA | 5.4 ± 1.5 bA |
| 1 | 7.3 ± 1.8 aA | 5.8 ± 1.5 bA | 5.5 ± 1.5 bAB | 5.8 ± 1.1 bA | 6.4 ± 1.7 abB | |
| 4 | 7.7 ± 2.0 aA | 6.6 ± 2.0 aA | 6.6 ± 1.9 aB | 6.3 ± 2.0 aA | 6.2 ± 1.9 aAB | |
| T_total | 0 | 8.7 ± 0.5 aA | 5.7 ± 1.2 bA | 5.7 ± 1.1 bA | 6.1 ± 0.9 bA | 6.2 ± 1.0 bA |
| 1 | 9.0 ± 0.5 aAB | 5.8 ± 1.0 bA | 6.0 ± 1.1 bA | 5.6 ± 1.2 bA | 6.2 ±1.4 bAB | |
| 4 | 9.3 ± 0.7 aB | 6.6 ± 1.2 bB | 6.5 ± 1.2 bA | 6.0 ± 1.6 bA | 7.0 ± 1.3 bB | |
| T_sweet | 0 | 4.1 ± 2.3 aA | 5.2 ± 2.1 aA | 5.4 ± 2.0 aA | 5.1 ± 1.9 aA | 5.4 ± 2.3 aA |
| 1 | 3.2 ± 2.1 aA | 5.0 ± 2.2 aA | 4.4 ± 2.2 aA | 4.9 ± 2.1 aA | 4.9 ± 2.4 aA | |
| 4 | 4.7 ± 2.3 aA | 6.2 ± 2.1 aA | 6.2 ± 2.0 aA | 6.1 ± 2.0 aA | 6.1 ± 2.4 aA | |
| T_salt | 0 | 1.9 ± 1.7 aA | 1.9 ± 1.5 aA | 1.9 ± 1.9 aAB | 2.0 ± 1.6 aA | 2.0 ± 1.7 aA |
| 1 | 1.9 ± 2.1 aA | 1.6 ± 1.5 aA | 1.5 ± 1.5 aA | 1.9 ± 1.9 aA | 1.8 ± 1.9 aA | |
| 4 | 2.5 ± 2.6 aA | 3.0 ± 2.5 aA | 3.1 ± 2.3 aB | 3.0 ± 2.3 aA | 3.1 ± 2.3 aA | |
| T_umami | 0 | 0.8 ± 1.3 aA | 1.4 ± 1.6 aA | 1.4 ± 1.6 aA | 1.4 ± 1.5 aA | 1.1 ± 1.3 aA |
| 1 | 1.0 ± 1.4 aA | 1.2 ± 1.4 aA | 1.5 ± 1.7 aA | 1.3 ± 1.3 aA | 1.8 ± 1.8 aA | |
| 4 | 0.7 ± 1.0 aA | 1.0 ± 1.1 aA | 1.4 ± 1.3 aA | 1.3 ± 1.4 aA | 1.1 ± 1.2 aA | |
| T_sour | 0 | 6.3 ± 1.3 aA | 3.0 ±1.3 bAB | 2.9 ± 1.3 bA | 3.2 ± 1.6 bA | 3.6 ± 1.5 bA |
| 1 | 6.9 ± 1.5 aA | 2.7 ± 1.5 bA | 2.8 ± 1.4 bA | 3.0 ± 1.2 bA | 3.5 ± 1.3 bA | |
| 4 | 7.6 ± 1.1 aB | 4.1 ± 2.1 bB | 4.0 ± 2.1 bA | 4.2 ± 2.1 bA | 5.3 ± 2.1 bB | |
| T_bitter | 0 | 1.2 ± 1.3 aA | 0.9 ± 2.1 aA | 0.8 ± 1.9 aA | 0.9 ± 1.9 aA | 1.2 ± 1.9 aA |
| 1 | 1.8 ± 0.9 aA | 1.6 ± 2.1 aA | 2.0 ± 1.5 aAB | 1.1 ± 1.7 aA | 1.8 ± 2.1 aA | |
| 4 | 1.5 ± 1.0 aA | 1.9 ± 2.2 aA | 2.6 ± 2.2 aB | 1.7 ± 1.9 aA | 2.5 ± 1.9 aA | |
| F_vinegar | 0 | 8.0 ± 1.1 aA | 3.4 ± 1.1 bA | 2.7 ± 1.5 bAB | 3.9 ± 1.3 bA | 3.8 ± 1.5 bA |
| 1 | 8.5 ± 1.7 aA | 2.9 ± 1.6 bA | 2.3 ± 1.8 bA | 3.3 ± 1.1 bA | 3.7 ± 1.5 bA | |
| 4 | 9.0 ± 1.5 aA | 3.9 ± 2.2 bA | 4.2 ± 2.5 bB | 3.6 ± 1.4 bA | 5.1 ± 2.1 bA | |
| F_fish | 0 | 3.2 ± 1.5 aA | 4.6 ± 1.7 bA | 4.7 ± 1.7 bA | 4.8 ± 1.8 bA | 4.8 ± 2.0 bA |
| 1 | 2.8 ± 1.4 aA | 4.2 ± 1.6 bA | 4.2 ± 1.7 bA | 4.3 ± 1.5 bA | 4.3 ± 1.8 bA | |
| 4 | 2.9 ± 1.4 aA | 4.8 ± 1.3 bA | 5.1 ± 1.6 bA | 5.0 ± 1.3 bA | 4.8 ± 1.4 bA | |
| F_stuffy | 0 | 0.6 ± 1.3 aA | 1.0 ± 1.5 aA | 0.9 ± 1.6 aA | 1.4 ± 2.2 aA | 1.1 ± 1.4 aA |
| 1 | 0.7 ± 1.2 aA | 1.2 ± 1.8 aA | 1.5 ± 1.2 aA | 1.1 ± 1.8 aA | 1.7 ± 2.4 aAB | |
| 4 | 0.7 ± 1.2 aA | 1.8 ± 1.8 abA | 2.1 ± 2.0 abA | 1.4 ± 1.4 abA | 2.7 ± 2.1 bB | |
| F_rancid | 0 | 0.5 ± 1.5 aA | 1.6 ± 2.3 aA | 1.7 ± 2.5 aA | 1.2 ± 2.1 aA | 2.1 ± 3.0 aA |
| 1 | 1.2 ± 2.0 aA | 1.5 ± 2.0 aA | 1.9 ± 2.2 aA | 1.9 ± 2.2 aA | 2.1 ± 2.2 aA | |
| 4 | 1.1 ± 1.3 aA | 1.7 ± 1.8 aA | 2.5 ± 2.0 aA | 1.5 ± 1.8 aA | 2.6 ± 2.2 aA | |
| F_metallic | 0 | 1.0 ± 1.3 aA | 1.4 ± 1.4 abA | 1.9 ± 1.9 abA | 2.1 ± 2.0 abA | 2.4 ± 1.8 bA |
| 1 | 1.4 ± 1.2 aB | 1.9 ± 1.5 abA | 2.7 ± 1.8 bA | 1.9 ± 1.6 abA | 2.7 ± 1.6 bAB | |
| 4 | 2.7 ± 1.9 abB | 2.9 ± 1.8 abB | 3.8 ± 1.8 abB | 2.6 ± 1.8 aA | 4.1 ± 1.8 bB |
Publisher’s Note: MDPI stays neutral with regard to jurisdictional claims in published maps and institutional affiliations. |
© 2022 by the authors. Licensee MDPI, Basel, Switzerland. This article is an open access article distributed under the terms and conditions of the Creative Commons Attribution (CC BY) license (https://creativecommons.org/licenses/by/4.0/).
Share and Cite
Logrén, N.; Hiidenhovi, J.; Kakko, T.; Välimaa, A.-L.; Mäkinen, S.; Rintala, N.; Mattila, P.; Yang, B.; Hopia, A. Effects of Weak Acids on the Microbiological, Nutritional and Sensory Quality of Baltic Herring (Clupea harengus membras). Foods 2022, 11, 1717. https://doi.org/10.3390/foods11121717
Logrén N, Hiidenhovi J, Kakko T, Välimaa A-L, Mäkinen S, Rintala N, Mattila P, Yang B, Hopia A. Effects of Weak Acids on the Microbiological, Nutritional and Sensory Quality of Baltic Herring (Clupea harengus membras). Foods. 2022; 11(12):1717. https://doi.org/10.3390/foods11121717
Chicago/Turabian StyleLogrén, Nora, Jaakko Hiidenhovi, Tanja Kakko, Anna-Liisa Välimaa, Sari Mäkinen, Nanna Rintala, Pirjo Mattila, Baoru Yang, and Anu Hopia. 2022. "Effects of Weak Acids on the Microbiological, Nutritional and Sensory Quality of Baltic Herring (Clupea harengus membras)" Foods 11, no. 12: 1717. https://doi.org/10.3390/foods11121717
APA StyleLogrén, N., Hiidenhovi, J., Kakko, T., Välimaa, A.-L., Mäkinen, S., Rintala, N., Mattila, P., Yang, B., & Hopia, A. (2022). Effects of Weak Acids on the Microbiological, Nutritional and Sensory Quality of Baltic Herring (Clupea harengus membras). Foods, 11(12), 1717. https://doi.org/10.3390/foods11121717