Abstract
This paper reports the synthesis of Fe-titanate nanotubes by means of the conventional ion-exchange method with iron nitrate solutions. As the iron-rich nanotubes were found to contain the catalyst precursor intrinsically dispersed in their structures, the unprecedented possibility of using this kind of materials for building carbon nanostructures, firmly attached at the surface of the forming TiO2 nanoparticles, was verified. The catalytic decomposition of ethylene, used as a carbon source, was performed at a relatively high temperature (750 °C) when the nanotubes undergo an irreversible phase transformation to form anatase and rutile nanoparticles. Due to the different amounts of Fe ions in the nanotubes, distinct types of carbon/TiO2 hybrid interfaces were formed, ranging from amorphous (lower Fe3+ concentration) to the more crystalline graphitic domains (higher Fe3+ concentrations), as documented by the microstructure of the treated samples. The present approach is of potential interest for (photo)catalytic and energy conversion/transport applications.
Keywords:
Fe-titanate nanotubes; TiO2; Hybrid interfaces; catalysis; UV–Vis spectroscopy; XRD analysis; TEM 1. Introduction
The families of one-dimensional (1D) and two-dimensional (2D) nanomaterials have grown noticeably since the discoveries of carbon nanotubes (1991) and of graphene (2004). These 1D/2D nanostructures have opened new perspectives due to their unique properties, which are very different from that of the three-dimensional counterpart [1,2] and to the fact that such nanostructures can be assembled to form composites, hybrids, and van der Waals heterostructures [3,4,5,6,7]. The possibility of building or assembling carbon allotropes and carbon analogues at the surface of another inorganic system, like TiO2 [8,9,10,11,12], provides the opportunity for building interfaces, matching phases with different properties, thus creating domains with predetermined characteristics, but exhibiting new functionalities.
On the other hand, a plethora of opportunities is also available when layered titanates (2D) and/or titanate nanotubes (1D) are taken into consideration [3,13,14]. The formation of anatase nanotubes, obtained from the hydrothermal reaction of TiO2 nanoparticles and NaOH, was initially described by Kasuga et al. [15,16]. Through systematic structural analyses of samples, before and after HCl washing, subsequent studies suggested different structures for the hydrothermally formed nanotubes, including: H2Ti3O7 [17], H2Ti4O9·xH2O [18], H2Ti2O4(OH)2 nanotubes [19], and today the consensus of opinion is that the fabricated nanotubes are made of layered titanate or lepidocrocite-type (HxTi2−x/4⎕x/4O4·H2O, where ⎕ indicates a vacancy) structures. Both titanate nanotubes, trititanate and lepidocrocite-type, have multilayered structures with walls separated by 0.7–0.8 nm, where H+ are located and can be exchanged with cations [20]. The trititanate nanotubes are composed of steps of corrugated layers, while the lepidocrocite-type is made of a more regular and flat surface, consisting of a continuous and planar 2D array [20]. The reason for investigating these TiO2-based tubular structures comes from their physical and chemical properties which area combination of the distinctive characteristics of the more conventional TiO2 particles (i.e., wide-bandgap, semiconductor-type character) with those of layered titanates (i.e., ion-exchange, proton conductivity) and/or of nanotubes (i.e., small tubular cavities, high surface area and porosity properties).
Hence, such materials have a variety of properties and make these nanomaterials promising for a large variety of applications [20,21]. In particular, catalysis [22], photocatalysis [23], electrochemistry (i.e., anode materials for high-power lithium-ion battery and water splitting) [24], confinement of molecules and nanomedicine [20,21,25] are documented in the literature for titanate nanotubes (TNTs).
The ion-exchange property of TNTs offers another prospect, that is, the opportunity to substitute counterions (Na+, H+, etc.) with other cations, including alkaline ions (Li+, Na+, K+, Rb+, Cs+) [20], transition (Co2+, Ni2+, Fe3+, Cu2+, Zn2+, Cd2+) [20,26,27] and noble metals (Au, Pt, Pd, Ru, Ag) [28,29]. Along with the iron titanate nanotubes, the literature is moderately limited [9,21,26,27,30,31,32,33,34,35,36,37,38]. Attention has been focused on the electrochemistry [32,38], photocatalysis [31,33,36,37], molecular segregation [27], optical and magnetic properties [21,26,27,31,33] of Fe-titanates. Notwithstanding research and development efforts into the properties of Fe-titanate nanotubes, including the intrinsic ability of iron when present in titanate nanotubes in building carbon domains via catalytic decomposition from light carbon feedstocks, have not been widely explored so far.
In this work, Fe-titanate nanotubes were used as a support to decompose a carbon source (ethylene) at the surface of anatase and rutile nanoparticles under formation, where Fe is expected to play a role as a catalyst. Moreover, by controlling the catalyst content, when the nucleation of larger catalyst particles is promoted, curved graphitic domains are formed. This approach presents the unprecedented possibility of building carbon systems, from amorphous patches to more graphitic domains, firmly attached at the surface of TiO2.
2. Results and Discussion
2.1. UV–Vis and FTIR Spectroscopies of Fe (III)-Exchanged Titanate Nanotubes
UV–Vis spectroscopy is a fundamental technique for the characterization of transition-metal ions that allows distinguishing highly dispersed cations on/in a solid matrix from more isolated species. Spectral features (intensity, position and shape of bands) can reveal the nature (i.e., symmetry, oxidation state) and the aggregation state of metal ions. Along with the oxidation and coordination states, accurate details are usually given for the d–d transition bands. Such transitions can be assumed as fingerprints for cations having a well-defined oxidation state in the tetrahedral and octahedral coordination, according to Ligand Field Theory (i.e., transitions of e− within orbitals placed on a central ion). Unfortunately, for Fe cations the explanation is not straightforward due to the fact that: (i) iron in the d5 configuration (Fe3+) has very weak transitions (forbidden by the Laporte rule); (ii) ligand-to-metal CT transitions in the tetrahedral and octahedral coordination give bands with similar positions, as documented in the controversial literature on this matter. However, the degree of clustering of Fe cations may be semi-empirically estimated from the UV–Vis features, as the bands are red shifted by increasing the degree of nuclearity [39]. The literature on this subject is well documented by studies on Fe–zeolites (e.g., ZSM-5, beta structures), in which the evolution of Fe species in the UV–Vis spectra, from the more isolated to polynuclear and oxide, is shown [39].
In this context, diffuse reflectance (DR) UV–Vis spectroscopy is adopted here to investigate the nature of the Fe cations on/in titanate nanotubes (HTITs) by using different precursor concentrations (0.001 M, 0.0025 M and 0.01 M). Figure 1 shows the DR UV–Vis spectra obtained on the HTITs before and after ion-exchange in ethanol and the subsequent filtering and drying steps.
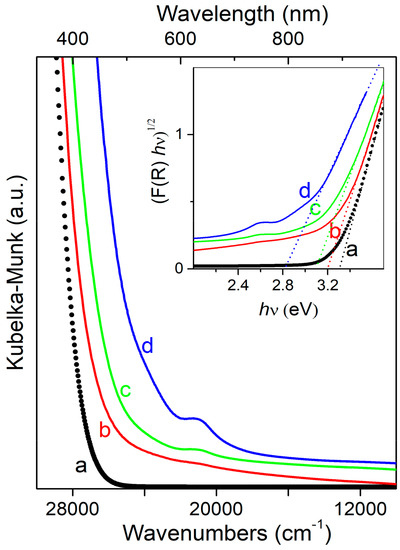
Figure 1.
Diffuse reflectance UV–Vis spectra of: (a) hydrogen titanate nanotubes and the same nanotubes after ion exchange from Fe(NO3)3 solutions; (b) 0.001 M; (c) 0.0025 M and (d) 0.01 M. In the inset the relationship between (F(R) hν)1/2 and the photon energy is illustrated.
The spectrum of hydrogen titanate nanotubes (spectrum a), is composed of a strong absorption edge located at ~28,000 cm−1 (~357 nm), becoming dominated by the more complex envelope of absorptions in the 28,000–10,000 cm−1 range at the increasing concentrations of the Fe(NO3)3 solutions (b, c and d spectra). More precisely, the spectra are constituted by a first strong absorption extending up to ~25,000 cm−1 (500 nm), with a weak shoulder at about 24,000 cm−1 (417 nm), an absorption band centered at ~21,000 cm−1 and a wider tail up to 10,000 cm−1 (1000 nm). All these spectral features, ascribed to nucleation centers (i.e., formation of larger aggregates), develop at the increasing Fe (III) solution concentrations. Hence, the formation of oxide species (those at lower energy) and polymeric Fe species (band at ~21,000 cm−1) is inferred. Other features at lower energy can be plausibly ascribed to dinuclear Fe (III) species (28,000–29,000 cm−1) and more isolated Fe cations (tetrahedral coordination), but a more detailed description of Fe species is very difficult here due to the presence of the absorption edge of the titanate nanotubes obscuring the 46,000–33,000 cm−1 range, where ligand-to-metal CT transitions of Fe (III) in the octahedral coordination with oxygens, are found [40].
In the inset of Figure 1, (αhν)1/2 is plotted versus the energy for the indirect transitions as obtained by the Tauc plot relation (Tauc and Davis–Mott model):
where h is the Planck’s constant, ν is the wavenumber, α = absorption coefficient, A is a constant and Eg is the optical band gap (in eV) for direct (n = ½) or indirect (n = 2) transitions, respectively. By assuming F(R) is proportional to the absorption coefficient α, it is clearly shown in this plot that the incorporation of iron into the structure of the nanotube alters its lattice and electronic structure. In more detail, by extrapolating the linear portion of the (F(R) × hν)1/2 curves vs. the photon energy hν, the reduction in the energy bandgap from hydrogen titanate nanotubes (3.3 eV) is well illustrated for the Fe-titanate sample series. By increasing the Fe3+ content the value of the bandgap energy progressively decreases from 3.2 eV (curve b: sample ion-exchanged with 0.001 M Fe(NO3)3 solution) to 3.1 eV and 2.8 eV (curve c and curve d: samples ion-exchanged with 0.0025 M and 0.01 M solutions of Fe3+). The decrease in the energy bandgap may be ascribed to the progressive doping iron ions that can form dopant levels near the valence band of the titanate nanotubes.
(hν α)1/n = A(hν – Eg)
In conclusion, the UV–Vis spectra of our Fe-TIT samples are similar to those shown for the iron-silicalite, zeolitic structures and mesoporous frameworks [39].
FTIR spectra of the hydrogen titanate nanotubes and of the Fe-TITs#0.01 (exchanged with 0.01 M Fe3+) are shown in Figure 2.
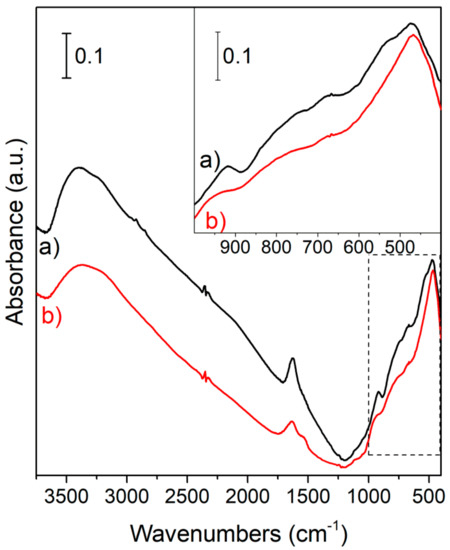
Figure 2.
FTIR spectra of hydrogen titanate nanotubes (a) before and (b) after ion-exchange with Fe(NO3)3 0.01M solution (Fe-TIT#01). In the inset, the two spectra are shown and compared in the 1000–400 cm−1 range.
In Figure 2, the bands in the 3600–3000 cm−1 and 1690–1550 cm−1 intervals (spectrum a) are assigned to stretching and bending vibrations of the –OH groups, respectively, interacting through hydrogen bonds, while those in the 1000–400 cm−1 region (inset of Figure 2) are assigned to Ti–O surface and Ti–O–Ti broad phonon bands due to TO vibrational modes [41]. Additionally, the intense band centered at 490 cm−1 can be attributed to Ti–O–Ti skeletal modes of the interconnected octahedra forming the TNT walls [41]. In the Fe-titanate sample (spectrum b) an additional peak at about 950 cm−1 can be attributed to the Fe–O stretching mode. However, the general erosion of the wide absorption observed in the 880–550 cm−1 interval can be explained with the Fe-doping that causes interruptions of the Ti–O–Ti bond linkage [27].
2.2. Morphology, Structure and Chemical Composition of Fe-Titanate Nanotubes
The chemical composition, morphology and structure of the hydrogen titanate nanotubes were investigated before and after the ion-exchange with the Fe(NO3)3 solutions. The results are reported in Figure 3.
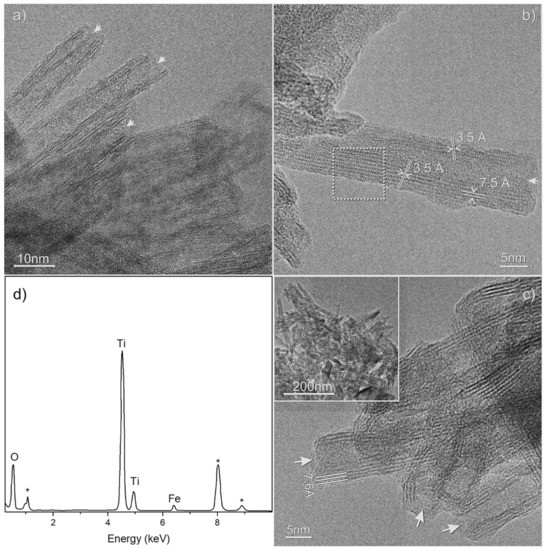
Figure 3.
HRTEM images of: (a,b) hydrogen titanate nanotubes; (c) the same nanotubes after ion exchange with Fe(NO3)3 (0.0025 M), and (d) the related EDAX spectrum. Cavities of the nanotubes are evidenced by the arrows in a–c).
The prepared hydrogen titanate nanotubes are constituted by well-shaped and elongated nanostructures 7–10 nm in diameter and several hundred nanometers in length with an internal cavity (Figure 3a). The nanotubes have a multiwalled structure with walls ~7.5 Å spaced, which are parallel to the axis of the nanotube. A second family of fringes ~3.5 Å spaced can be observed at about 74° (Figure 3b). The observed crystal features are in agreement with a lepidocrocite-type titanate structure. The Fe-TIT sample (exchanged with 0.0025 as a molar solution) shows tubular multiwalled nanostructures a few hundred nanometers in length, open-endings, outer and inner diameters of 7–10 nm and of 3–4 nm, respectively (inset of Figure 3c). The walls are ~7.6 Å spaced and the different wall thicknesses, as shown on the different wall sides (Figure 3c), suggest that they are formed through scrolling-up of 1 L sheets, as reported in other studies [13,34]. EDAX spectrum, taken for the Fe-titanate nanotubes shown in Figure 3c, reveals that Fe is present in the structure of the nanotubes (Figure 3d), but no Fe-containing nanoparticles or clusters were imaged by the TEM observations of several nanotubes.
This fact is in agreement with the Fe doping in substitutional positions of the lattice [31] observed at low Fe contents, which does not affect the interlayer distance of the walls [20]. Despite the fact that the substitution of Ti4+ with Fe3+ ions [31,34] or of the hydrated iron complexes of [FexII(OH)2x−1(OH2)]+ [32], have been shown at low Fe3+ concentrations, the presence of isolated FexOy clusters in our samples escaping from the TEM detection could not be ruled out for the more concentrated Fe-TIT sample, based on the previously discussed UV–Vis spectra.
The Fe contents, as obtained from EDAX spectra of the different Fe-titanate nanotubes, are summarized in Table 1. Although EDAX analysis is only semi-quantitative, it is worth noting that different Fe compositions (~ 0.4 wt %, 1 wt % and 3 wt %) were found for the Fe-titanate nanotubes ion-exchanged with the different concentrations (0.001 M, 0.0025 M and 0.01 M, respectively) of FeNO3.

Table 1.
Fe wt % of hydrogen titanate nanotubes after the ion-exchange with Fe(NO3)3 solutions.
2.3. Catalytic Decomposition of C2H4 on Fe-Titanate Nanotubes at 750 °C: XRD and TEM Analyses
XRD patterns of Fe-titanate nanotubes, ion-exchanged with different Fe(NO3)3 concentrations (0.001 M, 0.0025M and 0.01M), are reported after thermal decomposition of C2H4 at 750 °C for 1′ (Figure 4).
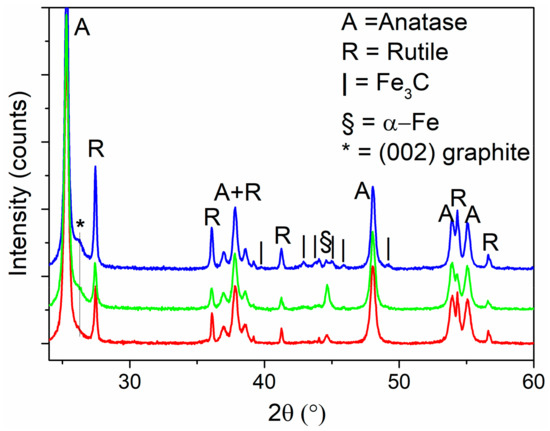
Figure 4.
XRD patterns after thermal decomposition of C2H4 at 750 °C for 1′ of Fe-titanate nanotubes prepared from different Fe(NO3)3 concentrations: 0.001 M (red curve), 0.0025 M (green curve) and 0.01 M (blue curve). XRD peak positions of anatase (PDF card n. #21-1272), Rutile (PDF card n. #21-1276), cementite: Fe3C (PDF card n. #35-0772), ferrite: α-Fe (bcc-phased Fe, PDF card n. #060696) and of (002) planes of the graphite, are reported for comparison.
From this figure, it is clear that the Fe-titanate nanotubes undergo an irreversible phase transformation to form anatase and rutile nanoparticles during the thermal treatments.
More specifically, XRD peaks at 2θ ≈ 25.3°, 36.9°, 37.8°, 48.0°, 53.9°, 55.1° can undoubtedly be assigned to (101), (103), (004), (200), (105) (211) diffraction planes of anatase (PDF card n. #21-1272) and those at 2θ ≈ 27.4°, 36.1°, 39.2°, 41.2°, 44.0°, 54.3° to (110), (101), (200), (112), (210) and (211) diffraction planes of rutile (PDF card n. #21-1276). Besides these remarkable features, minor XRD peaks located at 2θ ≈ 26.4° and at 2θ ≈ 43.0°, 43.7°, 45.0°, 45.9°, 49.0° can be assigned to (002) and at (211), 102), (031), (112), (211) diffraction planes of the hexagonal graphite (data not shown for the sake of brevity) and cementite (PDF card n. #35-0772), respectively. Finally, the XRD peak at 2θ ≈ 44.7° responds to the (110) planes of ferrite (α-Fe, bcc-phased Fe, PDF card n. #06-0696). All these minor features reveal the role played by the Fe catalyst in assembling carbon domains (from amorphous to the more crystalline) via the decomposition of C2H4. Ethylene is known in catalysis not only for the catalytic polymerization/oligomerization [42], but also for the formation of carbon nanostructures, including single-walled carbon nanotubes (SWCNTs) [43], multi-walled carbon nanotubes (MWCNTs) [44], graphene [45], and curved graphitic domains [46].
To gain more insight into the structure and morphology of samples after being contacted with C2H4 at 750 °C, TEM images were acquired. The morphological properties of Fe-TITs obtained from the 0.001M solution of Fe(NO3)3 and treated at 750 °C are shown in Figure 5a.
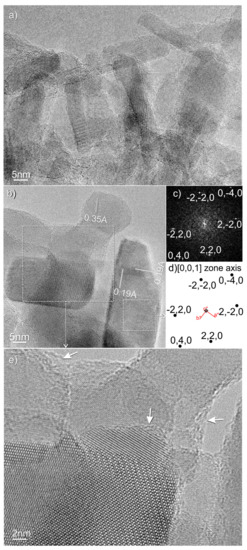
Figure 5.
(a,b) HRTEM images of Fe-titanate nanotubes (prepared from Fe(NO3)3 0.001 M) after thermal decomposition of C2H4 at 750 °C for 1′; (c) experimental FFT image of the nanoparticle selected in (b); which is oriented along the [001] zone axis and (d) the related simulated SAED pattern of the selected area in (d); The arrows in (e) highlight the carbon-decorated TiO2 nanoparticle edges.
HRTEM images reveal that elongated (or rod-like) nanoparticles with sizes of 10–30 nm are formed and that such nanocrystals expose fully decorated edges, but nothing more can be inferred at this magnification level. At this point, from a chemical point of view it is important to recall the fact that titanate nanostructures are thermodynamically metastable phases forming TiO2 polymorphs under thermal treatment (with the release of H2O), while from a morphological viewpoint the disappearance of the internal cavity is accompanied by the formation of rod-like nanostructures having a size very close to the external diameter of the initial nanotubes [20,47].
In Figure 5b the amorphous nature of this thin film, covering anatase nanoparticles, is illustrated. Furthermore, an anatase nanocrystal, oriented along the [001] zone axis (see fast-Fourier transform: FFT, and the simulated SAED pattern in Figure 5c,d, respectively), is shown in this figure. Other nanocrystals, exposing fringes 0.35 Å spaced, are associated with (101) planes of anatase.
Finally, the amorphous nature of the thin film at the surface of the nanocrystals is shown (Figure 5e) in a selected region (of Figure 5b).
The situation is completely different if TEM images of Fe-TITs, obtained from the more concentrated solutions of Fe(NO3)3 (0.0025 M and 0.01 M) are taken into consideration (Figure 6a–d, respectively).
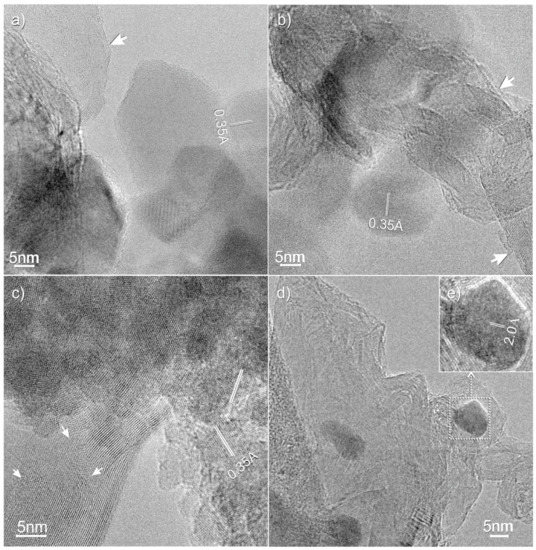
Figure 6.
HRTEM images of Fe-titanate nanotubes prepared from: (a,b) 0.0025 M, (c,d) 0.01 M Fe(NO3)3 solutions; (e) high-resolution image of the region selected in (d), after the thermal decomposition of C2H4 at 750 °C for 1′. The arrows highlight the graphitic domains at the interface with TiO2 nanoparticles (a–c) and carbon-encapsulated nanoparticles (d).
In this figure, the higher crystallinity of carbon (i.e., graphitic stacking) is well documented by regular or more curved structures (see arrows in Figure 6a,c), whose stacking numbers, symmetry and quantities increase with the increase in the amount of nanotube-supported catalyst (higher for titanate nanotubes ion-exchanged with iron nitrate 0.01 M). In the same images, the presence of anatase nanocrystals is evidenced by the regularly 0.35 Å spaced fringes, while the role played by the catalyst in forming graphitic structures is illustrated in Figure 6d, where carbon-encapsulated nanoparticles (see arrows in panel d) have spacing, measured between the adjacent lattice fringes of 2.0 Å, which is in good agreement with the spacing determined from XRD measurements for (110) planes of ferrite (α-Fe).
The yields of carbon have been obtained from the weight loss of the TGA curves for the samples contacted with C2H4 for 1 min (Figure 7).
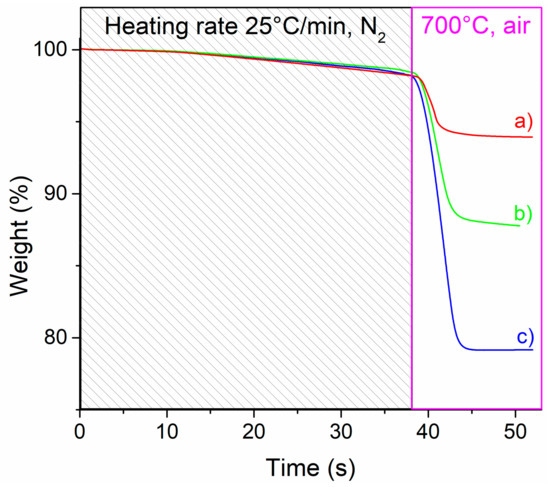
Figure 7.
TGA curves obtained from a two-step measurement (heating under N2, and oxidation in air at 700 °C) for the Fe-TITs contacted with C2H4 at 750 °C for 1′: (a) about 0.4 wt %; (b) 2 wt %, and (c) 3 wt % of Fe, respectively.
From this figure, it is clear that the catalyst content (see Table 1) plays a key role in the production of carbons occurring at the surface of the thermally treated Fe-TITs. From a quantitative viewpoint the carbon quantity has been calculated to be ~5 wt %, ~11 wt % and ~21 wt % (for Fe-TITs with about 0.4 wt %, 2 wt % and 3 wt % of Fe, respectively).
These C/TiO2-based hybrid structures show magnetic properties when an external magnet is used more than two years after the preparation (Figure 8 and Supplementary Materials), thus testifying to the good stability to oxidation in air of the encapsulated metal catalyst.
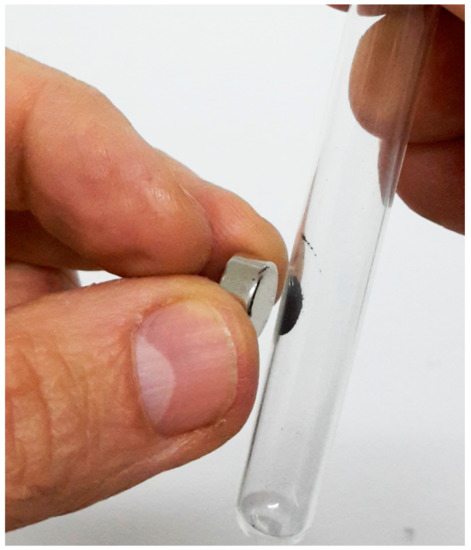
Figure 8.
Picture showing the macroscopic magnetic properties of C/TiO2 hybrid material coming from the titanate nanotubes ion-exchanged with 0.01 M Fe(NO3)3 solution and then thermally treated for 1’ at 750 °C with C2H4.
The magnetic character, together with semiconducting properties of C/TiO2, may find application in the photodegradation of pollutants [48,49] due to the easier recovery of the photocatalyst from the solution. Moreover, C-TiO2 interfaces have been shown to be effective in building functional systems for energy conversion applications [50].
3. Experimental Methods
3.1. Synthesis of Materials
Titanate nanotubes were prepared following the procedure described in a previous work [28]. Briefly, TiO2 anatase (Sigma-Aldrich, Milan, Italy) was used as a precursor material and treated with a NaOH solution (10 M) in a PTFE autoclave for 18 h at 150 °C. The as-obtained sodium titanate nanotubes, washed several times by using distilled water and filtered to remove the excess of reactants, were then treated with HCl (0.1 M) for 5 h under stirring. The obtained material was washed, filtered and dried at 120 °C to obtain protonated titanate nanotubes (hereafter H-TITs). Thereafter, H-TITs were treated with Fe(NO3)3∙9H2O in ethanol solutions (0.001 M, 0.0025 M and 0.01 M) for 20 h. The as-obtained samples (hereafter Fe-TIT) were then filtered with EtOH several times, to remove the excessive Fe(NO3)3 and dried at 80 °C. Fe-TIT samples were inserted in a quartz tube reactor and thermally treated adopting the following steps: (i) a ramp from RT to 750 °C (heating rate: 15 °C/min) under N2 flow (0.5 L/min); (ii) reaction with a C2H2/H2 gas mixture (4:1) at 750 °C for 1 min.
3.2. Characterization of Materials
Materials were investigated by UV–Vis spectroscopy (Cary 5000 spectrometer equipped with a reflectance sphere, Varian Inc., Palo Alto, CA, USA), FTIR spectroscopy (Bruker IFS-22 spectrometer having a DTGS detector, Bruker, Billerica, MA, USA), scanning electron microscopy (SEM) (Zeiss Evo 50 instrument equipped with an energy dispersive X-ray (EDAX) detector, Zeiss, Oberkochen, German), transmission electron microscopy (TEM) (3010- UHR instrument operating at 300 kV, JEOL Ltd., Tokyo, Japan), X-ray diffraction (XRD) analysis (PANalytical PW3050/60 X’Pert PRO MPD diffractometer, working with a Ni-filtered Cu anode, Almelo, The Netherland). Zone axis and 3D reciprocal lattices were simulated by means of CaRIne Crystallography 3.1 software (Senlis, France). Thermogravimetric analysis (TGA) (Q600, TA instruments, New Castle, USA) was performed in order to quantify the carbon content after the reaction with C2H2.
4. Conclusions
The preparation of Fe-titanate nanotubes from hydrogen titanate and Fe(NO3)3 solutions by means of the ion-exchange method is reported. As the Fe-rich titanate nanotubes contain the catalyst precursor intrinsically dispersed in their structures, the unprecedented possibility of this kind of system of building carbon nanostructures, firmly attached at the surface of the forming TiO2 nanoparticles was verified. The catalytic decomposition of ethylene, used as a carbon source, was performed at a relatively high temperature (750 °C), at which the titanate nanotubes undergo an irreversible phase transformation into anatase and rutile nanoparticles. Due to the different amounts of Fe ions, different types of carbon/TiO2 hybrid interfaces were obtained, ranging from amorphous (lower Fe3+ concentration) to the more crystalline graphitic domains (higher Fe3+ concentration), as documented by the microstructure of the treated samples. The present approach is of potential interest for (photo)catalytic and energy conversion/transport applications.
Supplementary Materials
The following are available online at http://www.mdpi.com/2304-6740/6/2/55/s1, Video S1: Macroscopic magnetic properties of C/TiO2 hybrid material.
Author Contributions
S.C., M.M.R., F.C. and D.S. conceived, designed and performed the experiments and characterizations, analyzing the data; F.C. wrote the paper, D.S. contributed to the final editing of the manuscript. All authors read and approved the paper.
Acknowledgments
This work was supported by MIUR (Ministero dell’Istruzione, dell’Università e della Ricerca), INSTM Consorzio and NIS (Nanostructured Interfaces and Surfaces) interdepartmental centre of University of Torino. The authors thank Dr. M. C. Valsania for the precious support in TEM experiments.
Conflicts of Interest
The authors declare no conflict of interest.
References
- Novoselov, K.S.; Mishchenko, A.; Carvalho, A.; Castro Neto, A.H. 2D materials and Van der waals heterostructures. Science 2016, 353, aac9439. [Google Scholar] [CrossRef] [PubMed]
- Zhang, Q.; Huang, J.Q.; Qian, W.Z.; Zhang, Y.Y.; Fei Wei, F. The road for nanomaterials industry: A review of carbon nanotube production, post-treatment, and bulk applications for composites and energy storage. Small 2013, 9, 1237–1265. [Google Scholar] [CrossRef] [PubMed]
- Wang, W.; Wang, Z.; Liu, J.; Zhang, Z.; Sun, L. Single-step one-pot synthesis of graphene foam/TiO2 nanosheet hybrids for effective water treatment. Sci. Rep. 2017, 7, 43755. [Google Scholar] [CrossRef] [PubMed]
- Cravanzola, S.; Jain, S.M.; Cesano, F.; Damin, A.; Scarano, D. Development of a multifunctional TiO2/MWCNT hybrid composite grafted on a stainless steel grating. RSC Adv. 2015, 5, 103255–103264. [Google Scholar] [CrossRef]
- Cravanzola, S.; Cesano, F.; Magnacca, G.; Zecchina, A.; Scarano, D. Designing rGO/MoS2 hybrid nanostructures for photocatalytic applications. RSC Adv. 2016, 6, 59001–59008. [Google Scholar] [CrossRef]
- Bubnova, O. 2D materials: Hybrid interfaces. Nat. Nanotechnol. 2016, 16, 497–503. [Google Scholar] [CrossRef]
- Badhulika, S.; Terse-Thakoor, T.; Villarreal, C.; Mulchandani, A. Graphene hybrids: Synthesis strategies and applications in sensors and sensitized solar cells. Front. Chem. 2015, 3, 38. [Google Scholar] [CrossRef] [PubMed]
- Cravanzola, S.; Sarro, M.; Cesano, F.; Calza, P.; Scarano, D. Few-layer MoS2 nanodomains decorating TiO2 nanoparticles: A case study for the photodegradation of carbamazepine. Nanomaterials 2018, 8, 207. [Google Scholar] [CrossRef] [PubMed]
- Lu, J.; Deng, C.; Zhang, X.; Yang, P. Synthesis of Fe3O4/graphene/TiO2 composites for the highly selective enrichment of phosphopeptides from biological samples. ACS Appl. Mater. Interfaces 2013, 5, 7330–7334. [Google Scholar] [CrossRef] [PubMed]
- Cravanzola, S.; Cesano, F.; Gaziano, F.; Scarano, D. Carbon domains on MoS2/TiO2 system via acetylene polymerization: Synthesis, structure and surface properties. Front. Chem. 2017, 91. [Google Scholar] [CrossRef] [PubMed]
- Cesano, F.; Pellerej, D.; Scarano, D.; Ricchiardi, G.; Zecchina, A. Radially organized pillars of TiO2 nanoparticles: Synthesis, characterization and photocatalytic tests. J. Photochem. Photobiol. A Chem. 2012, 242, 51–58. [Google Scholar] [CrossRef]
- Cesano, F.; Bertarione, S.; Damin, A.; Agostini, G.; Usseglio, S.; Vitillo, J.G.; Lamberti, C.; Spoto, G.; Scarano, D.; Zecchina, A. Oriented TiO2 nanostructured pillar arrays: Synthesis and characterization. Adv. Mater. 2008, 20, 3342–3348. [Google Scholar] [CrossRef]
- Cravanzola, S.; Muscuso, L.; Cesano, F.; Agostini, G.; Damin, A.; Scarano, D.; Zecchina, A. MoS2 nanoparticles decorating titanate-nanotube surfaces: Combined microscopy, spectroscopy and catalytic studies. Langmuir 2015, 31, 5469–5478. [Google Scholar] [CrossRef] [PubMed]
- Yao, Z.; Xia, X.; Zhong, Y.; Wang, Y.; Zhang, B.; Xie, D.; Wang, X.; Tu, J.; Huang, Y. Hybrid vertical graphene/lithium titanate–CNTs arrays for lithium ion storage with extraordinary performance. J. Mater. Chem. A 2017, 5, 8916–8921. [Google Scholar] [CrossRef]
- Kasuga, T.; Hiramatsu, M.; Hoson, A.; Sekino, T.; Niihara, K. Titania nanotubes prepared by chemical processing. Adv. Mater. 1999, 11, 1307–1311. [Google Scholar] [CrossRef]
- Kasuga, T.; Hiramatsu, M.; Hoson, A.; Sekino, T.; Niihara, K. Formation of titanium oxide nanotube. Langmuir 1998, 14, 3160–3163. [Google Scholar] [CrossRef]
- Chen, Q.; Zhou, W.; Du, G.; Peng, L.-M. Trititanate nanotubes made via a single alkali treatment. Adv. Mater. 2002, 14, 1208–1211. [Google Scholar] [CrossRef]
- Nakahira, A.; Kato, W.; Tamai, M.; Isshiki, T.; Nishio, K.; Aritani, H. Synthesis of nanotube from a layered H2Ti4O9 H2O in a hydrothermal treatment using various titania sources. J. Mater. Sci. 2004, 39, 4239–4245. [Google Scholar] [CrossRef]
- Yang, J.; Jin, Z.; Wang, X.; Li, W.; Zhang, J.; Zhang, S.; Guo, X.; Zhang, Z. Study on composition, structure and formation process of nanotube Na2Ti2O4(OH)2. Dalton Trans. 2003, 20, 3898–3901. [Google Scholar] [CrossRef]
- Bavykin, D.V.; Friedrich, J.M.; Walsh, F.C. Protonated titanates and TiO2 nanostructured materials: Synthesis, properties, and applications. Adv. Mater. 2006, 18, 2807–2824. [Google Scholar] [CrossRef]
- Chen, Q.; Peng, L. Structure and applications of titanate and related nanostructures. Int. J. Nanotechnol. 2007, 4, 44–65. [Google Scholar] [CrossRef]
- Khawaji, M.; Chadwick, D. Au-Pd bimetallic nanoparticles immobilised on titanate nanotubes: A highly active catalyst for selective oxidation. ChemCatChem 2017, 9, 4353–4363. [Google Scholar] [CrossRef]
- Nguyen, N.H.; Bai, H. Photocatalytic removal of NO and NO2 using titania nanotubes synthesized by hydrothermal method. J. Environ. Sci. 2014, 26, 1180–1187. [Google Scholar] [CrossRef]
- Zhang, H.; Kim, J.H.; Kim, J.H.; Lee, J.S. Engineering highly ordered iron titanate nanotube array photoanodes for enhanced solar water splitting activity. Adv. Funct. Mater. 2017, 27, 1702428. [Google Scholar] [CrossRef]
- Julien Boudon, J.; Papa, A.L.; Paris, J.; Millot, N. Titanate nanotubes as a versatile platform for nanomedicine. In Nanomedicine; Seifalian, A., De Mel, A., Kalaskar, D.M., Eds.; One Central Press: Cheshire, UK, 2014; pp. 405–429. [Google Scholar]
- Wang, M.; Song, G.; Li, J.; Miao, L.; Zhang, B. Direct hydrothermal synthesis and magnetic property of titanate nanotubes doped magnetic metal ions. J. Univ. Sci. Technol. Beijing 2008, 15, 644–648. [Google Scholar] [CrossRef]
- Dai, L.; Zheng, J.; Wang, L. Fabrication of titanate nanotubes/iron oxide magnetic composite for the high efficient capture of radionuclides: A case investigation of 109Cd (II). J. Radioanal. Nucl. Chem. 2013, 298, 1947–1956. [Google Scholar] [CrossRef]
- Cesano, F.; Bertarione, S.; Uddin, M.J.; Agostini, G.; Scarano, D.; Zecchina, A. Designing TiO2 based nanostructures by control of surface morphology of pure and silver loaded titanate nanotubes. J. Phys. Chem. C 2010, 114, 169–178. [Google Scholar] [CrossRef]
- Walsh, F.C.; Bavykin, D.V.; Torrente-Murciano, L.; Lapkin, A.A.; Cressey, B.A. Synthesis of novel composite materials via the deposition of precious metals onto protonated titanate (TiO2) nanotubes. Trans. Inst. Metal Finish. 2006, 86, 293–299. [Google Scholar] [CrossRef]
- Fu, G.; Wei, G.; Yang, Y.; Xiang, W.C.; Qiao, N. Facile synthesis of Fe-doped titanate nanotubes with enhanced photocatalytic activity for castor oil oxidation. J. Nanomater. 2013, 2013, 1–4. [Google Scholar] [CrossRef]
- Han, W.Q.; Wen, W.; Yi, D.; Liu, Z.; Maye, M.M.; Lewis, L.; Hanson, J.; Gang, O. Fe-doped trititanate nanotubes: Formation, optical and magnetic properties, and catalytic applications. J. Phys. Chem. C 2007, 111, 14339–14342. [Google Scholar] [CrossRef]
- Jang, J.S.; Kim, D.H.; Choi, S.H.; Jang, J.W.; Kim, H.G.; Lee, J.S. In-situ synthesis, local structure, photoelectrochemical property of Fe-intercalated titanate nanotube. Int. J. Hydrog. Energy 2012, 37, 11081–11089. [Google Scholar] [CrossRef]
- Morín, M.E.Z.; Torres-Martínez, L.; Sanchez-Martínez, D.; Gómez-Solís, C. Photocatalytic performance of titanates with formula MTiO3 (M = Fe, Ni, and Co) synthesized by solvo-combustion method. Mater. Res. 2017, 20, 1322–1331. [Google Scholar] [CrossRef]
- Pang, Y.L.; Abdullah, Z.A. Effect of low Fe3+ doping on characteristics, sonocatalytic activity and reusability of TiO2 nanotubes catalysts for removal of rhodamine b from water. J. Hazard. Mater. 2012, 235–236, 326–335. [Google Scholar] [CrossRef] [PubMed]
- Yu, J.; Xiang, Q.; Zhou, M. Preparation, characterization and visible-light-driven photocatalytic activity of Fe-doped titania nanorods and first-principles study for electronic structures. Appl. Catal. B Environ. 2009, 90, 595–602. [Google Scholar] [CrossRef]
- Zhang, K.Z.; Lin, B.Z.; Chen, Y.L.; Xu, B.H.; Pian, X.T.; Kuang, J.D.; Li, B. Fe-doped and ZnO-pillared titanates as visible-light-driven photocatalysts. J. Colloid Interface Sci. 2011, 358, 360–368. [Google Scholar] [CrossRef] [PubMed]
- Yuan, R.; Zhou, B.; Hua, D.; Shi, C. Effect of metal ion-doping on characteristics and photocatalytic activity of TiO2 nanotubes for removal of humic acid from water. Front. Environ. Sci. Eng. 2015, 9, 850–860. [Google Scholar] [CrossRef]
- Wang, Y.-X.; Xie, J.; Cao, G.-S.; Zhu, T.-J.; Zhao, X.-B. Electrochemical performance of TiO2/carbon nanotubes nanocomposite prepared by an in situ route for Li-ion batteries. J. Mater. Res. 2012, 27, 417–423. [Google Scholar] [CrossRef]
- Čapek, L.; Kreibich, V.; Dědeček, J.; Grygar, T.; Wichterlova, B.; Sobalìk, Z.; Martens, J.A.; Brosius, R.; Tokarová, V. Analysis of Fe species in zeolites by UV–Vis–NIR, IR spectra and voltammetry. Effect of preparation, Fe loading and zeolite type. Microporous Mesoporous Mater. 2005, 80, 279–289. [Google Scholar] [CrossRef]
- Lopez, L.; de Laat, J.; Legube, B. Charge transfer of iron (III) monomeric and oligomeric aqua hydroxo complexes: Semiempirical investigation into photoactivity. Inorg. Chem. 2002, 41, 2505–2517. [Google Scholar] [CrossRef]
- Muniyappan, S.; Solaiyammal, T.; Sudhakar, K.; Karthigeyan, A.; Murugakoothan, P. Conventional hydrothermal synthesis of titanate nanotubes: Systematic discussions on structural, optical, thermal and morphological properties. Mod. Electron. Mater. 2017, 3, 174–178. [Google Scholar] [CrossRef]
- Groppo, E.; Lamberti, C.; Cesano, F.; Zecchina, A. On the fraction of Cr-II sites involved in the C2H4 polymerization on the Cr/SIO2 Phillips catalyst: A quantification by FTIR spectroscopy. PCCP 2006, 8, 2453–2456. [Google Scholar] [CrossRef] [PubMed]
- Jain, S.M.; Cesano, F.; Scarano, D.; Edvinsson, T. Resonance Raman and IR spectroscopy of aligned carbon nanotube arrays with extremely narrow diameters prepared with molecular catalysts on steel substrates. PCCP 2017, 19, 30667–30674. [Google Scholar] [CrossRef] [PubMed]
- Cesano, F.; Bertarione, S.; Scarano, D.; Zecchina, A. Connecting carbon fibers by means of catalytically grown nanofilaments: Formation of carbon–carbon composites. Chem. Mater. 2005, 17, 5119–5123. [Google Scholar] [CrossRef]
- Cabrero-Vilatela, A.; Weatherup, R.S.; Braeuninger-Weimer, P.; Caneva, S.; Hofmann, S. Towards a general growth model for graphene CVD on transition metal catalysts. Nanoscale 2016, 8, 2149–2158. [Google Scholar] [CrossRef] [PubMed]
- Cesano, F.; Rahman, M.M.; Bardelli, F.; Damin, A.; Scarano, D. Magnetic hybrid carbon via graphitization of polystyrene-co-divinylbenzene: Morphology, structure and adsorption properties. Chem. Select 2016, 1, 2536–2541. [Google Scholar] [CrossRef]
- Morgado, E.; de Abreu, M.A.S.; Pravia, O.R.C.; Marinkovic, B.A.; Jardim, P.M.; Rizzo, F.C.; Araújo, A.S. A study on the structure and thermal stability of titanate nanotubes as a function of sodium content. Solid State Sci. 2006, 8, 888–900. [Google Scholar] [CrossRef]
- Cesano, F.; Fenoglio, G.; Carlos, L.; Nisticò, R. One-step synthesis of magnetic chitosan polymer composite films. Appl. Surf. Sci. 2015, 345, 175–181. [Google Scholar] [CrossRef]
- Shrestha, N.K.; Macak, J.M.; Schmidt-Stein, F.; Hahn, R.; Mierke, C.T.; Fabry, B.; Schmuki, P. Magnetically guided titania nanotubes for site-selective photocatalysis and drug release. Angew. Chem. 2009, 121, 987–990. [Google Scholar] [CrossRef]
- Uddin, M.J.; Daramola, D.E.; Velasquez, E.; Dickens, T.J.; Yan, J.; Hammel, E.; Cesano, F.; Okoli, O.I. A high efficiency 3D photovoltaic microwire with carbon nanotubes (CNT)-quantum dot (QD) hybrid interface. Phys. Status Solidi RRL 2014, 8, 898–903. [Google Scholar] [CrossRef]
© 2018 by the authors. Licensee MDPI, Basel, Switzerland. This article is an open access article distributed under the terms and conditions of the Creative Commons Attribution (CC BY) license (http://creativecommons.org/licenses/by/4.0/).