Abstract
Iodine is produced through nuclear fission reactions in nuclear reactors. Understanding the electrochemistry of iodine species is crucial for reprocessing used nuclear fuels via molten salt electrolysis, deploying next-generation molten salt nuclear reactors, and developing iodide-based molten salt batteries. Cyclic voltammetry (CV) was conducted in LiCl-KCl eutectic molten salts at 450, 500, and 550 °C, both with and without the addition of KI as an iodine source. Based on the CV results, the diffusivities of iodide and triiodide species, as well as the activation energies for diffusion, were determined. Additionally, formal potentials of various iodide and interhalogen complexes were derived, allowing for the calculation of the stability constants for halide exchange reactions. The diffusivities of iodide ranged from 0.14 to 6.9 × 10⁻⁷ cm2/s, while those of triiodide were roughly an order of magnitude lower. Increasing the KI content from 1 wt% to 5 wt% reduced the diffusion coefficient, whereas increasing temperature, as expected, boosted diffusivity. The activation energy for iodide diffusion in LiCl-KCl increased from 46.5 kJ/mol to 112 kJ/mol as KI concentration rose from 1 wt% to 5 wt%.
1. Introduction
1.1. Applications of Iodine Systems
A nuclear fission reaction produces various isotopes of iodine and other fission products. These fission products are contained within the nuclear fuel cladding. During reprocessing of the used nuclear fuel, a significant fraction of iodine (78.9 mg/g of heavy metal) is retained in the molten salt as iodide (), such as , , , , , and 3HI [1]. The accumulation of iodide species can significantly affect the performance of electrorefiners used for actinide recovery. In molten salt reactors (MSRs) fueled by actinide salts, the fate of iodine as a fission product remains unclear [2]. Understanding the redox chemistry and speciation of iodine as a fission product in molten salts is necessary to evaluate its transport in MSRs. The electrochemistry of the iodine/iodide couple has been extensively studied in both aqueous and non-aqueous conditions due to its applications in dye-sensitized solar cells (DSSCs) [3,4,5,6,7,8,9,10], aqueous ion batteries [11,12], and synthetic chemistry [13]. The electrochemical behavior of iodide/triiodide in ionic liquids has been actively investigated for solar cell applications, such as DSSCs [14] and perovskite solar cells (PSCs) [15]. However, only very limited work has been reported in high-temperature molten salts [16,17,18,19,20,21,22]. Iodide-based molten salts have been identified as potential alternatives for thermal batteries due to their low melting points and high conductivities [23,24,25].
1.2. Electrochemistry of Iodine/Iodide and Polyhalide Systems
The redox process occurs as a single-step reaction in a neat aqueous medium. When nucleophilic species such as chlorides are present in the medium, the oxidation of is affected by the stabilization of the electrophilic and redox products [6]. Interhalogen compounds such as , , and are formed during the oxidation of iodide in the aqueous solution [26]. Therefore, the formation of interhalogen complex ions is anticipated in the pyroprocessing of used nuclear fuels and molten salt reactor operating conditions. eutectic salt is widely used in the pyroprocessing of used nuclear fuels [27]. Fluoride-based salts (such as ) or chloride-based salts () are used in molten salt reactors [28]. Therefore, it is important to understand the speciation of iodide in combination with other halides in the carrier salt. The redox reactions involving different iodine and chlorine species are compiled here based on the published literature [6,29,30].
The redox reactions of iodide are given as:
The equilibrium constants of the trihalide species in water and methanol were determined using spectroscopic and potentiometric techniques [30]. The structures of the trihalides are considered to be linear with the central atom of a higher atomic number [31]. For example, will have a linear arrangement of . In this study, the equilibrium constants for various trihalide reactions involving iodide and chloride species will be determined from cyclic voltammetric data using the relations outlined in Appendix A. Cyclic voltammetry was performed according to the standard procedure reported in the literature [32]. Additionally, electrochemical reactions of iodide/triiodide species in the molten eutectic will be examined at 450–550 °C. Evaluating these parameters will help optimize the performance of electrorefiners for reprocessed nuclear fuels. Understanding trihalide interactions will also improve the efficiency of molten salt nuclear reactors, where iodide buildup as a fission product is expected. These findings could also be used to design improved molten salt thermal batteries.
2. Results and Discussion
Figure 1a–c show the open circuit potentials (OCP) of the tungsten working electrode in 1–5 wt% containing eutectic at 450, 500, and 550 °C, respectively. The OCP of the tungsten electrode shifted positively with increasing addition at 450–550 °C. The OCP is a mixed potential of the following anodic and cathodic half-cell reactions shown in (4) and (5), respectively.
where represents halides such as and . Impurities such as oxygen and moisture (even at concentrations below 10 ppm) could also contribute to the cathodic reactions as given in (6) to (8) [33,34].
It was reported that the polarization of tungsten in the molten salt at 650 °C exhibited a ‘passivation-like’ behavior, in which the current density did not change with increasing anodic polarization [35].


Figure 1.
Open circuit potentials (OCP) of tungsten electrode in LiCl-KCl eutectic molten salt with addition of 1–5 wt% KI at different temperatures (a) 450 °C, (b) 500 °C, and (c) 550 °C.
Figure 1.
Open circuit potentials (OCP) of tungsten electrode in LiCl-KCl eutectic molten salt with addition of 1–5 wt% KI at different temperatures (a) 450 °C, (b) 500 °C, and (c) 550 °C.
A similar behavior could also be observed in the eutectic at 450–550 °C. The OCP would shift to more positive values if the ‘passivation’ current density decreased for a given cathodic half-cell reaction. Also, the OCP would increase when the Tafel slope of the cathodic reaction decreased or when the exchange current density for the cathodic reaction increased. The increase in the concentration would increase the exchange current density () by following the relation [36]:
where = number of electrons, = Faraday’s constant, = rate constant, and is bulk concentration of in the molten salt. An increase in the value would shift the Tafel plots of the redox reactions to higher current densities, allowing the OCP to increase with increasing concentration. The change in the OCP could also be attributed to iodide chemisorption at the electrode surface. If the chemisorbed iodide layer shows passivation-like behavior, the OCP would shift to a more positive value. Generally, chemisorption, which is exothermic, displays a bell-shaped temperature dependence: it initially increases with temperature due to the activation energy barrier and then decreases beyond a certain temperature because of increased vibrational energy. The higher (less negative) OCP observed at 500 °C may be due to enhanced chemisorption of iodide. Chemisorption decreased as the temperature rose to 550 °C, reaching the same level observed at 450 °C, since OCP values were almost similar at both temperatures. The unstable OCP at 2 wt% at 500 °C may be due to transient iodide chemisorption on the electrode surface. However, this explanation requires validation through additional experiments and detailed analysis, which are beyond the scope of this study.
Figure 2a–d show the EIS results of tungsten electrode at open circuit potentials in eutectic with and without the addition of 1–5 wt% at 450–550 °C. Figure 2a shows the Bode plots of the tungsten working electrode in at different temperatures without addition. The impedance moduli decreased with increasing temperature, which could be attributed to higher ion diffusivity at higher temperatures, driven by lower viscosity. The phase angles varied with frequency, and the peak values were about −70°, indicating a leaky capacitance behavior at 450 °C and 500 °C. The frequency at which the phase angle peak occurred increased with increasing temperature (1.5 Hz at 450 °C to 25 Hz at 500 °C), indicating a decrease in the time constant due to the reduced resistance or capacitance. The variation in the phase angle as a function of temperature follows the trend of the impedance modulus. Figure 2b–d illustrate the Bode plots at 450, 500, and 550 °C for three additions.
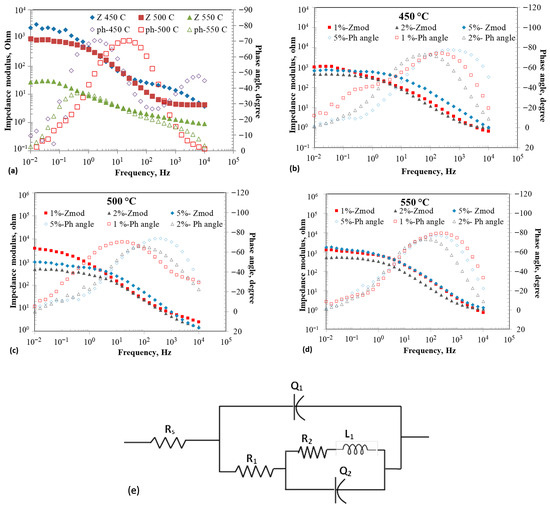
Figure 2.
Electrochemical impedance spectroscopy (EIS) results at OCP of tungsten electrode in eutectic molten salt with addition of 0–5 wt% at different temperatures; (a) 0% at different temperatures, (b) 1–5 wt% at 450 °C, (c) 1–5 wt% at 500 °C, (d) 1–5 wt% at 550 °C, and (e) Electrical equivalent circuit.
The increasing concentration decreased impedance at all temperatures. The effect of temperature between 450 and 550 °C was less pronounced on the impedance for a given concentration of . The impedance profiles showed two time constants, in general. Various electrical equivalent circuits have been proposed in the literature to describe the impedance behavior of molten salts [36,37,38]. Vandarkuzhali et al. [37] proposed an equivalent electrical circuit (EEC) consisting of parallel RC elements with a Warburg component to describe the impedance behavior of tungsten electrode in eutectic containing at 425–525 °C.
Yoon et al. [38] proposed an EEC consisting of two parallel RC loops connected in series to describe the impedance behavior of couple in at 400–550 °C. An equivalent circuit used to model the porous film was proposed, with an additional Warburg element to describe the impedance behavior of the system in at 450–500 °C [39]. An EEC consisting of two parallel RC loops, each with a Warburg element, was used by Cohen et al. to describe the impedance behavior of various molten salts at 700–800 °C [40]. The EIS spectra collected at OCP conditions could be fitted with the EEC model shown in Table 1, yielding a goodness-of-fit (χ2) value smaller than . The rationale for conducting EIS measurements at OCP is to understand the structural characteristics of the molten salts, with and without iodide addition. The physical and electrical properties of molten salt systems depend on the structures and interactions of their constituents. The structural arrangements that are present in molten salts can be viewed as intermediates between discrete chemical bonds and periodic crystalline lattices [41]. The inter-atomic interactions determine the local ordering of the molten salt. The structural characteristics of the molten salt significantly influence the electrochemical properties. The ion size and type in a molten salt system, such as , would affect the electrochemical stability. The ordering and structure of the melt could be described in terms of entropy. The entropy () of the electrolysis of the melt can be determined using the relation [40,42]:
where = number of electrons and = change in electrochemical window with temperature. In this study, the electrochemical window at 450 °C was 3.68 V, at 500 °C was 3.6 V, and at 550 °C was 3.52 V. Therefore, was about −0.0016 V/K, and the entropy change = −308.75 J/K mol. The negative entropy indicates an increase in disorder.

Table 1.
Fitted parameters of the EIS data at OCP of tungsten electrode in eutectic with 0–5 wt% at different temperatures.
Generally, an increase in the entropy was observed with an increase in the anion size of unary molten salts [43]. The electrolysis potential turns out to be more anodic as the anion size increases due to weaker Coulombic interaction between the anion–cation pairs, as well as increased repulsion between the larger anions [44]. When two types of cations are present in a molten salt with different sizes and charge densities, an asymmetric polarization of the anions is anticipated, which may affect the electrostatic stability of the mixture. When two different types of anions, such as chloride and iodide, are present along with different cations, the asymmetric polarizations of the ions and their effect on the physical and electrochemical properties are not well documented.
The proposed EEC model is similar to that proposed by Yoon et al. [38] wherein the Warburg component is replaced with an inductor to represent the adsorption behavior. The resistor represents the electrolyte resistance, represents the charge transfer resistance, and is a constant phase element (CPE) that represents the double-layer capacitance at the electrode/electrolyte interface. The relation gives the CPE: , where , frequency, and the exponent ‘’ represents the surface heterogeneity or continuously distributed time constants for charge transfer when [45]. A loop with an inductor in series with is introduced within the loop to represent the adsorption of ions due to the surface roughness of the working electrode, which is similar to that of a porous film model [45]. The is associated with charge transfer resistance due to adsorbates, similar to the resistance of a coil winding in an inductor. The impedance of an inductor increases with an increase in frequency, while the impedance of a capacitor decreases with an increase in frequency.
Table 1 summarizes the individual component values of the EECs at various temperatures and additions. The solution resistance ranged from 0.54 to 1.2 ohms under the tested conditions. A clear, linear trend was not observed when considering the combined effects of addition and temperature on solution resistance despite tripling the number of experiments. The solution resistance increased with rising temperature at 5 wt% addition but decreased at other concentrations. The charge transfer resistance () generally decreased with higher temperature for a given concentration, except at 5 wt% . Interestingly, addition increased the charge transfer resistance compared with the absence of . The , related to inductance, was expected to increase with the magnitude of . However, there was no direct correlation between and in the data, indicating that the adsorbates did not affect the charge transfer resistance in a straightforward linear manner. decreased with temperature for 0% and 2 wt% additions but increased with temperature for 1 and 5 wt% additions. The and values for without increased with temperature, with values being larger than . Similar trends for , , , and were reported by other researchers [38,40]. Overall, adding reduced the double-layer capacitance, , at all concentrations and temperatures compared to the 0% solution. This decrease in capacitance may be related to the larger size of ions, which have a lower charge carrier density than ions. A similar effect was observed when the cation size increased in the molten salt [40].
An increase in capacitance behavior was observed in the melt without addition, which could be explained by a decrease in electrostatic interactions between anions and cations, thereby facilitating the formation of a double-layered structure [46,47]. Conversely, adding iodide increased the randomness of electrostatic interactions, resulting in no clear trend in capacitance with temperature, especially with 1 and 2 wt% additions. However, 5 wt% addition decreased the values relative to 0 wt% , while capacitance increased with increasing temperature. A similar pattern was observed for the values. The magnitude of generally decreased with addition but increased with temperature at a fixed level. Overall, the addition of negatively impacted the electrochemical properties by promoting disorder, raising charge transfer resistance, and reducing capacitance and inductance.
Figure 3a–d illustrate the cyclic voltammograms of containing different additions at various temperatures. Figure 3a shows the full window CV of eutectic without any addition at three different temperatures: 450, 500, and 550 °C. The CV results of 0% show redox peaks associated with lithium reduction and oxidation at around −2.4 VAg/AgCl and chlorine evolution at +1.1 VAg/AgCl. No other redox peaks are observed. Increasing the temperature decreases the stability window of the eutectic mixture by about 40 mV per 50 °C rise. Figure 3b displays the CV results of eutectic with 1–10 wt% addition at 450 °C. In addition to the reduction/oxidation peaks of lithium and chlorine evolution, redox waves linked to iodine species are observed. Details on these redox reactions will be discussed based on CV results carried out within narrow potential windows. Figure 3c,d show the full window CV results of eutectic with 1–10 wt% at 500 and 550 °C, respectively. The addition of decreases the reduction and oxidation current density of lithium. Interestingly, no direct correlation between the reductions in current densities and concentration is evident. This suggests that the decrease in lithium redox current densities could be due to iodide ion adsorption on the working electrode, blocking sites for lithium reduction. Likely, the adsorption sites of iodide on the working electrode saturate below 1 wt% , which explains the lack of significant differences in lithium reduction currents beyond 1 wt% . Furthermore, addition affects the chlorine evolution reaction by forming interhalide complexes, as discussed earlier.
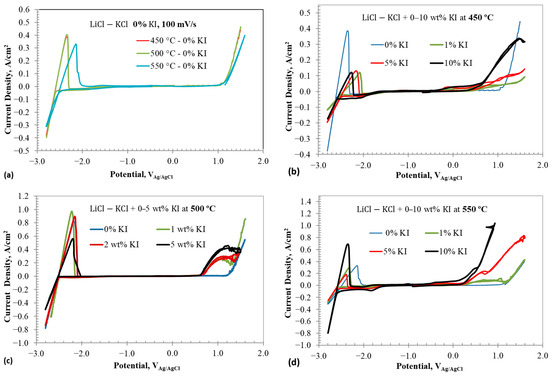
Figure 3.
Cyclic voltammograms in eutectic molten salt with addition of 0–10 wt% at different temperatures using tungsten wire as working electrode; (a) 0% at different temperatures, (b) 0–10% at 450 °C, (c) 0 and 2 wt% at 500 °C, and (d) 0–10 wt% at 550 °C. Scan rate is 100 mV/s.
Figure 4a–c show the CV of different additions from OCP to 0.55 V at 450 °C. The CVs show a prominent peak at 450 °C for 1 and 2 wt% , whereas two peaks are observed for 5 wt% . The potential window was selected in such a way that there was no iodine evolution, so that the reversibility of iodide to triiodide and vice versa can be studied closely. The first peak in the oxidation of iodide was due to iodide to triiodide transformation.
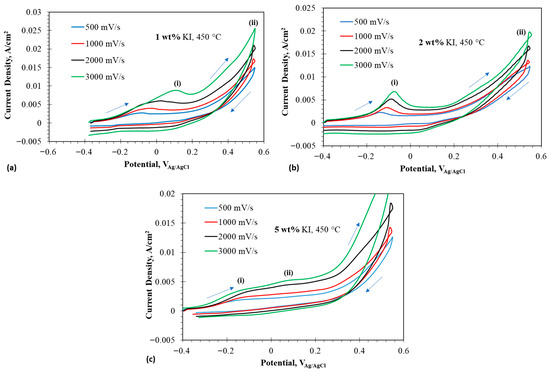
Figure 4.
Cyclic voltammograms at anodic potentials in eutectic molten salt with addition of 1–5 wt% at 450 °C using tungsten wire as working electrode; (a) 1 wt% addition at 450 °C, (b) 2 wt% at 450 °C, and (c) 5 wt% at 450 °C. The arrows indicate the scan direction.
Oxidation of iodide to triiodide is easier, because it involves less electron transfer and requires less energy. So, the peak (i) in case of 1 wt% at 450 °C is denoted by the following equation:
The presence of a crossover point around 0.55 V was noted, which signified the formation of an extra layer on the electrode for a very short span of potential, which could represent the formation of an intermediate anion of dichloroiodide and is given by the following equation:
The above reaction shows that iodide did not oxidize to triiodide but reacted with the adsorbed chloride anions, forming the interhalide anion dichloromonoiodide. The formation of implied oxidation of to . This interhalide anion reacted with the remaining iodide ions to form triiodide during the reverse scan. The following equation represents this process:
A peak during reverse scan was recorded around −0.03 V, which represents the formation of iodide from the triiodide present on the surface of the electrode and is denoted by the following equation:
The 5 wt% followed a slightly different oxidation route compared to 1 and 2 wt% at 450 °C. Peak (i) in case of 5 wt% represents the oxidation of iodide to triiodide as shown by Equation (2). But an additional peak was observed at a lower potential, which could be attributed to the formation of interhalide species shown by the following equation:
The above reaction implied that stabilized by forming a complex ion, thereby promoting the oxidation of at a less noble potential [6]. No crossover point was observed at 0.55 V for the high scan rate, as the species did not have time to react to form additional interhalide species. The crossover point was clearly seen at lower scan rates. The oxidation reaction could be represented by the equation below:
No visible peak was observed during the reverse scan, suggesting no electrochemical reaction occurred. But the occurrence of a chemical reaction during the reverse scan could be represented by the following reaction:
2.1. Cyclic Voltammetry in Anodic Direction: OCP to 0.55 V at 500 °C
Small window CVs of 1, 2, and 5 wt% at 500 °C are given in Figure 5a–c. Compared to 1, 2, and 5 wt% at 450 °C, a prominent peak was observed in reverse scan direction, which represented an electrochemical reaction occurring during the reduction process. The first peak observed in 1 wt% represented the oxidation of iodide to triiodide given by Equation (2). The current density appears to increase above 0.2 V, indicating the formation of the interhalide species , as given by Equation (13). The peak at 0.3 V represents the reaction (A8). Similar behaviors are observed in 2 and 5 wt% at 500 °C.
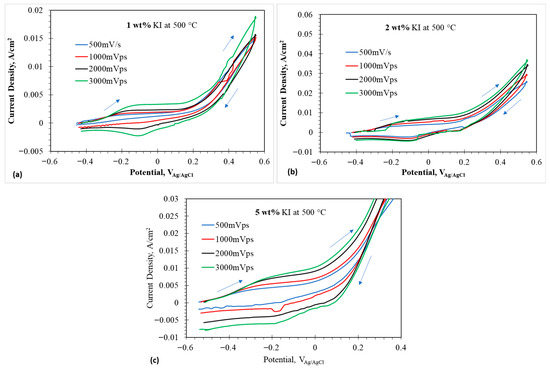
Figure 5.
Cyclic voltammograms at anodic potentials in eutectic molten salt with addition of 1–5 wt% at 500 °C using tungsten wire as working electrode; (a) 1 wt% addition at 500 °C, (b) 2 wt% at 500 °C, and (c) 5 wt% at 500 °C. The arrows indicate the scan direction.
2.2. Cyclic Voltammetry in Anodic Direction: OCP to 0.55 V at 550 °C
Figure 6a–c illustrate the CV of eutectic with 1, 2, and 5 wt% at 550 °C, respectively. with 1 and 2 wt% additions shows two distinct peaks of oxidizing to at lower potentials and oxidizing to either or at higher potentials. The peaks in the reverse scan could be assigned to the reduction reactions of the anodic products. The 5 wt% addition exhibited an additional peak of further oxidation of or to . As discussed earlier, the formation of implied the oxidation of iodide species to and the strongly electrophilic complexed with the nucleophilic .
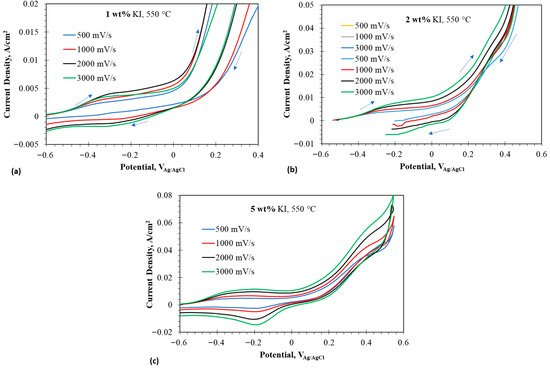
Figure 6.
Cyclic voltammograms at anodic potentials in eutectic molten salt with addition of 1–5 wt% at 550 °C using tungsten wire as working electrode; (a) 1 wt% addition at 550 °C, (b) 2 wt% at 550 °C, and (c) 5 wt% at 550 °C. The arrows indicate the scan direction.
Overall, the iodide addition to the molten eutectic salt decreased the redox current densities of the lithium. The presence of chloride affected the redox conditions of the iodide/iodine system. During the anodic sweep of the potential scan, iodide was oxidized to triiodide. The triiodide either oxidized further to iodine or reacted with chloride to form an oxidized interhalogen complex of at a lower potential. The boiling point of iodine is 184.3 °C. Therefore, iodine available in free form evolved as a purple gas. Iodine evolution was observed when the content exceeded 5 wt%. Continuation of the anodic sweep oxidized the to another interhalogen complex . Semi-integral voltammograms can be used to analyze the formation of interhalogen complexes.
Figure 7 shows the semi-integral voltammograms of the select CVs presented in Figure 4, Figure 5 and Figure 6. The semi-integral values () can be given by the relation [48]:
If the semi-integral reaches a limit value, , by plateauing, the diffusivity of the redox active species can be determined directly from the semi-integral value using the relation [48]:
Furthermore, the breaks observed in the semi-integral plots signify different electrochemical events from which the potentials of such electrochemical reactions can be estimated.


Figure 7.
Semi-integral voltammograms at anodic potentials in eutectic molten salt with addition of 1–5 wt% at 450 and 550 °C using tungsten wire as working electrode; (a) 1 wt% addition at 450 °C at different scan rates, (b) at 0.5 V/s with 1–5 wt% at 450 °C, (c) 5 wt% at 550 °C at different scan rates, and (d) at 0.5 V/s with 1–5 wt% addition at 550 °C.
2.3. Diffusivity Calculation for Iodide for with 1,2 and 5 wt% at 450, 500, and 550 °C
The diffusion coefficient of the iodide species can be obtained from the slope of the line resulting from plotting peak current densities as a function of the square root of the scan rate, as depicted in Figure 8. The diffusivity of iodide species can be evaluated from the peak current densities of the CV using the relation given in (18) for quasi-reversible conditions of the soluble-soluble redox species [49]:
where is the peak cathodic current (A), is the electrode area (cm2), is the bulk concentration of the active species (mol cm−3), is the diffusion coefficient (cm2 s−1), is the scan rate (Vs−1), α is the charge transfer coefficient, and is the number of electrons transferred. The value of can be obtained from the relationship [50]:
where is the peak potential, and is the potential when the current is half of the peak current.
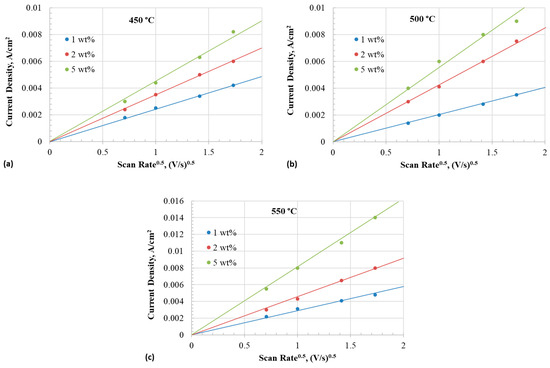
Figure 8.
Anodic peak current density of iodide to triiodide reaction as a function of square root of scan rate at different temperatures with 1–5 wt% iodide addition in eutectic. (a) 450 °C, (b) 500 °C, and (c) 550 °C.
Table 2 summarizes the values of obtained at different temperatures. Diffusion coefficient is calculated by plugging in the values in Equation (18).
Table 2.
Values of at different temperatures.
Table 3 (Part (a)) presents the diffusion coefficient of iodide in different concentrations and temperatures. The diffusivity of iodide increased with temperature across all concentrations. The diffusion coefficient of iodide decreased as the concentration increased. The diffusivity of iodide was in the range of 0.14–6.9 × 10⁻⁷ cm2/s across all the concentrations in the temperature range of 450–550 °C. Bentley et al. [4] reported a diffusivity value of 2.2 × 10⁻⁸ cm2/s for iodide in an ionic liquid containing 43.9 mM (from ) in a mixture of and (2:1 mol ratio). Rogers et al. [51,52] reported a diffusion coefficient of 6.6 × 10⁻⁷ cm2/s at 298 K for and 1.55 × 10⁻⁷ cm2/s for in ionic liquid. Therefore, it is inferred that the diffusivity of iodide in the eutectic melt is similar to that in the room temperature ionic liquids.
Table 3.
(a) Diffusion coefficient of iodide () in eutectic melt at different temperatures. (b) Diffusion coefficient of triiodide ) in eutectic melt at different temperatures.
Table 3 (Part (b)) summarizes the diffusion coefficients of triiodide. The diffusivity of triiodide was estimated from the current peaks in the reverse scan during CV. The diffusivity values of triiodide also exhibited a similar trend to those of iodide. The diffusivity increased with the temperature but decreased with the content. However, the diffusivity values were about an order of magnitude smaller than that of iodide. The lower diffusivity could be attributed to the linear structure ) of the triiodide. The bond lengths of triiodide in methanol were unequal (309 and 296 pm) with an angle of 152°, and the negative charge was highly localized on the terminal iodine atom of the longer bond [53]. The structure of triiodide in the molten chloride may be different. If the charge distribution and bond lengths of were not symmetric, the diffusivity could be slower.
The decrease in the diffusion coefficient of iodide with the increase in the content could generally be attributed to three factors, such as (i) the decrease in mean free path of ions due to increased concentration, (ii) increase in the viscosity, and (iii) asymmetric electric fields due to different ionic radii [54,55,56,57]. The viscosity of molten halide salts is related to the halo acidity (lower concentration of free halides). An increase in halo acidity leads to lower diffusivity due to cluster formation (coordinancy) and bridging solvent phenomena [58]. The ionic radii of , , , and are 0.060, 0.137, 0.181, and 0.22 nm, respectively [59]. The large difference in ionic radii introduced a significant asymmetry in the electric field, leading to being more closely bound to than to . Furthermore, iodide diffusivity is also influenced by the tendency for cluster formation. The availability of free iodide ions is determined by the cluster formation or coordination number (CN) of the cation in the molten salt. The coordination number of the cation is determined by its polarization power, which is calculated from its charge density. The polarizing powers of and in molten salt were reported as 0.53 and 1.73 e Å−2 [60]. The high polarizing power of indicates that anions will be more attracted to than to . The low polarizing power of the salt cations favors lower coordination numbers, leading to more free halide ions. The type of anions influences the coordination and stability of the cations. The ionic radius of iodide is larger than that of chloride. Based on the lower ratio of ionic radii of the ions (), a lower CN is expected for iodide ions for a given cation. At lower concentrations, the iodide ions would partially replace the chloride ions without affecting the CN. As iodide concentration increases, clusters composed solely of iodide anions with low coordination numbers could form, thereby reducing diffusivity.
2.4. Activation Energy Calculation
Activation energies of the diffusion of iodide and triiodide were calculated from the slopes of the Arrhenius plots between inverse temperatures and diffusion coefficients, as illustrated in Figure 9a,b. The activation energy values are listed in Table 4. The activation energy generally increased with the iodide content. The reported activation energies for cation diffusion in molten chloride varied from 25 to 40 kJ/mol [61,62]. The higher activation energy observed in this study could be associated with a lower diffusion coefficient.
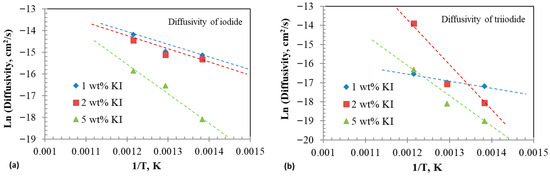
Figure 9.
Arrhenius plots of diffusivity at different additions. (a) Diffusivities of iodide () and (b) diffusivities of triiodide ().
Table 4.
Activation energy for diffusivities of iodide and triiodide in eutectic melt.
2.5. Formal Potentials and Equilibrium Constants
Formal potential () is the measured potential of the half-cell, which incorporates the standard potential () and the activity coefficients of the redox species [42]. The standard potential of a redox system can be determined by plotting the formal potentials as a function of ionic strength and extrapolating the formal potential to zero ionic strength where the activity coefficients approach unity [42]. The formal potential of the redox couple, for example, , can be expressed in terms of the mid-wave potential measured from the CV results and diffusivities of the redox species using the relation given in (20) [7]:
where , Ep, ox and Ep, red are the oxidation and reduction peak potentials, respectively.
Table 5 lists the formal potentials of different reduction reactions involving iodide and chloride ions in the eutectic at various temperatures, estimated from cyclic voltammograms. The redox potential of chlorine in neat (without ) was found to be 1.114 V at 450 °C and approximately 1.134 V at 500 and 550 °C.
Table 5.
Formal potentials of different reactions in -containing eutectic at 450 and 550 °C.
However, the chlorine evolution potential shifted to more positive values with the addition of to the system, as observed in Figure 10. The positive shift in the chlorine evolution potential with addition could be attributed to the formation of interhalogen complexes. The reverse scan of the CV in Figure 10 shows crossover potentials. The first crossover in 1 wt% occurred at 1.3 V, and the second crossover occurred at 1.047 V. The increase in content shifted the crossover potentials to more positive values at 1.48 and 1.14 V, respectively. The current values also increased. These observations indicated that these crossovers are related to iodine species participating in electron-transfer and chemical (EC) reactions. Duran-Klie et al. [19] observed a similar crossover behavior in -containing molten fluoride salt and attributed it to the formation of gaseous species. During the forward scan, at potentials nobler than 0.7 V, iodine oxidizes to I+ and chemically combines with to form . Iodine monochloride () can react with another chloride ion to form an interhalogen complex . Another pathway for the formation of was via oxidation of , as shown in reaction (A8), which could occur at a slightly higher potential for formation. The formal potentials of the reactions were calculated from the peak and crossover potentials.
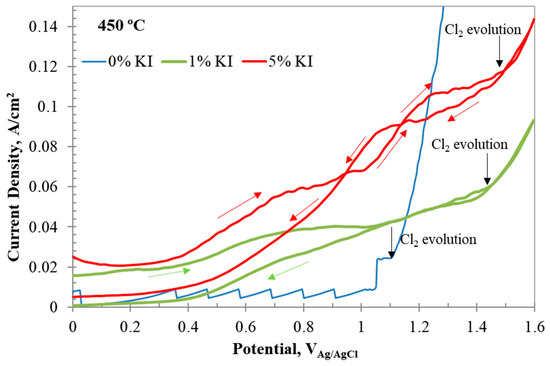
Figure 10.
CV results of with 0, 1, and 5 wt% addition at 450 °C, revealing the formation of interhalogen complexes. The red arrows indicate scan direction. The black arrows indicate the starting potential of chlorine evolution. The arrows indicate the scan direction.
Table 6 lists the equilibrium constants for the reactions described in the Introduction and Appendix A. The stability constant of reaction (19) was reported to be very high in methanol and ionic liquids without chloride addition [4,5,6]. In this work, the stability constant for iodide/triiodide formation was much lower than the equilibrium constants of interhalogen complex formation.
Table 6.
Equilibrium constants of iodide and inter-halogen species in at 450, 500, and 550 °C.
The molten salt containing up to 5 wt% exhibited a greater preference for the formation of interhalide complexes than iodine evolution. In the molten salt battery system operating at 110 °C, the half-cell cathode reactions involve oxidation of despite the presence of chlorides. No interhalide formation has been reported [21]. Similarly, no interhalide formation was reported in the melt at 700 °C during the CV experiments [22]. On the other hand, Duran-Klie et al. [19] reported the formation of volatile at a higher potential than the potential of formation. The CV results in molten salt with up to 5 wt% addition predominantly showed formation of and complex species. The evolution of volatile was noticeable only when the content exceeded 10 wt%. These observations indicated that, at lower concentrations in the chloride melt, interhalide complex formation was preferred over iodine formation due to the formation of mixed chloride–iodide clusters. At higher contents, formation could be preferred due to the availability of free ions in the melt or cluster formation entirely by the ions.
It should be noted that the reported equilibrium constants were calculated from CV results and were not supported by analytical methods such as photo-spectroscopy. Furthermore, the iodide concentration was taken from the initial salt preparation. The concentration of the individual interhalogen complex was not analytically determined. The evaporation losses of iodine during the CV increased to more than 20% when the concentration exceeded 5 wt%. Therefore, the results for additions above 5 wt% were not considered in the analyses. It was reported that the addition of 10 wt% marginally decreased the liquidus temperature to 348.5 °C compared to the eutectic point of at 352 °C [20]. Furthermore, and reportedly formed a solid solution up to 25 wt% , indicating good stability. However, during cyclic voltammetry, a 10 wt% electrolyte showed significant iodine volatilization. When the content was 5 wt%, the maximum iodide loss after multiple CV experiments was 4.8% at 550 °C. As the concentration decreased over time during the experiments, the maximum error in the diffusivity calculations was 9.5%. The maximum losses measured with 1 wt% and 2 wt% additions were 2.2% and 3.7%, leading to errors of 4.5% and 7.3%, respectively.
In real-life service conditions for used-fuel pyroprocessing and molten-salt reactors, speciation of iodide and associated chemical kinetics is affected by radiation-induced radicals. The ionizing radiation interacts with the molten salt to form transient excess electrons and halide radicals (X*) [63]. The iodide ions could combine with the radiolysis products and produce the interhalogen/polyhalide complexes via the reactions [2]:
The speculated increased reactivity of transient excess electrons produced by radiolysis has recently been modeled by Nguyen et al. in a molten salt [64]. Their model indicated that the excess charge resided in the singly occupied molecular orbital (SOMO), which has a distinct and well-separated energy. The transient excess electrons, their solvation as , and associate reaction pathways would significantly increase the kinetics of potential formation of interhalogen complexes and volatile compounds such as .
3. Materials and Methods
Cyclic voltammetry (CV) was performed in the eutectic melt at 450–550 °C, both with and without the addition of 1–10 wt% . The eutectic salt (44 wt% and 56 wt% ) was purchased from Sigma Aldrich (St. Louis, MO, USA) and used as received. Ultra-dry KI (99.998% purity by metal basis) was obtained from Alfa Aesar (Thermo Fisher Scientific, Waltham, MA, USA) and used without further purification. The eutectic + mixture was melted, held at 450 °C for 30 min, then solidified and remelted in a glassy carbon crucible under inert, dry conditions inside a glove box (M.Braun Inc., Stratham, NH, USA). The pre-melted and solidified salt disks were used for the electrochemical tests.
A three-electrode setup was used for the electrochemical tests. The working electrode was a 2 mm diameter tungsten rod (99.95%, Thermo Fisher Scientific, Waltham, MA, USA). The counter electrode was a 4 mm diameter glassy carbon rod. The reference electrode was prepared in-house. A silver wire (1 mm diameter) was coated with an layer by anodization in a saturated solution at 5 V for 20 min. The anodized wire was dried at 120 °C for 12 h. The -coated silver wire was immersed in a eutectic salt containing 1 wt% inside a 4 mm inner diameter Pyrex tube. The end of the Pyrex tube was thinned to approximately 0.2 mm by grinding with emery paper. The thinned end of the tube ensured the necessary ionic conductivity. All experiments were conducted in a glovebox filled with ultra-high-purity (UHP) argon, with oxygen and moisture levels maintained below 10 ppm.
The CV was performed in the anodic direction from open-circuit potential (OCP) to 1.5 VAg/AgCl at scan rates ranging from 25 mV/s to 3000 mV/s. Three cycles were carried out at each condition, and the final cycle is reported. Anodic scans were conducted over a narrow potential window between OCP and 0.55 VAg/AgCl to better resolve the redox reaction of the couple, as well as over a broader potential window from OCP to +1.6 VAg/AgCl to observe other oxidation reactions, including chlorine evolution. Cathodic CV scans were performed from OCP to −2.8 VAg/AgCl at different scan rates. Electrochemical impedance spectroscopy (EIS) was carried out at OCP and at various potentials where anodic and cathodic current peaks appeared, under potentiostatic conditions by superimposing an AC signal of 10 mV and scanning the frequency from 10 kHz to 0.1 Hz. All electrochemical tests were duplicated or triplicated to ensure reproducibility, and the average values are presented.
The procedure described by Marsden and Pesic [32] was followed after each experiment to clean the working electrode. Anodic potential (0.0 V vs. ) was applied for 120 s to remove the material coated on the working electrode during the cathodic cycle. After this anodic polarization, the system was left under open circuit conditions for another 120 s to allow relaxation of concentration gradients or electrode polarization. The immersed surface area of the working electrode was calculated using geometric relations based on the measurements of the electrode’s immersed length and diameter after the electrochemical tests with a micrometer.
4. Conclusions
Cyclic voltammetry studies were performed in eutectic molten salt with and without the addition of 1–5 wt% at 450–550 °C using a tungsten working electrode. The following conclusions are drawn from the CV results:
The iodide complexed with chloride forms several intermediate trihalide ions and results in multiple complex electrochemical pathways for oxidation and reduction. The oxidation of iodide followed the order with increase in the anodic potential: .
The diffusion coefficient of iodide in melt was similar to that of in room-temperature ionic liquids. The diffusivity of iodide was in the range of 0.14–6.9 × 10⁻⁷ cm2/s. The diffusivity decreased with the iodide concentration and increased with the temperature. The activation energy of the diffusion of iodide was in the range of 42–112 kJ/mol.
The diffusion coefficient of triiodide was about an order of magnitude lower than that of iodide. The lower value was attributed to the triiodide anion’s larger linear structure, with a probable asymmetric charge distribution and asymmetric bond lengths.
The interhalogen complex (iodo-chloride) formation showed higher stability constants than that of iodide/triiodide formation.
Author Contributions
Conceptualization, K.S.R. and V.U.; methodology, N.S.; software, K.B.; validation, N.S. and K.S.R.; formal analysis, N.S. and K.S.R.; investigation, N.S.; resources, K.S.R. and V.U.; data curation, N.S.; writing—original draft preparation, N.S.; writing—review and editing, K.S.R. and V.U.; visualization, K.B.; supervision, K.S.R.; project administration, K.S.R. and V.U.; funding acquisition, K.S.R. and V.U. All authors have read and agreed to the published version of the manuscript.
Funding
The authors acknowledge financial support received from the U.S. Department of Energy, NEUP, through a research grant, contract number DE-NE0008695.
Institutional Review Board Statement
Not applicable.
Informed Consent Statement
Not applicable.
Data Availability Statement
The original contributions presented in this study are included in the article. Further inquiries can be directed to the corresponding author.
Conflicts of Interest
The authors declare no conflicts of interest.
Abbreviations
The following abbreviations are used in this manuscript:
| Ag/AgCl | silver/silver chloride (reference electrode) |
| CV | cyclic voltammetry |
| EEC | equivalent electrical circuit |
| EIS | electrochemical impedance spectroscopy |
| MSR(s) | molten salt reactor(s) |
| OCP | open circuit potential |
| SKU | stock keeping unit (product identifier) |
| UHP | ultra-high-purity (argon atmosphere) |
| χ2 | goodness-of-fit parameter |
Appendix A
The appendix lists all the electrochemical reactions and describes the methodologies considered to evaluate the equilibrium constants from the redox potentials. For completeness, the reactions that appeared in the main text are repeated with different numbers.
The redox reactions of iodide are given as:
The electrochemical parameters of the following trihalide reactions will be evaluated in this study:
In this reaction, the oxidation state of I− changes from −1 to +1 [30]. The equilibrium constant for the reaction (A4) is given as:
To determine , the associated reaction steps must be considered as detailed below.
The equilibrium constant of reaction (A5), , is given as:
Subtracting (A8) from (A7) and rearranging leads to reaction (9) as:
The equilibrium constant of reaction (A9), , is given as:
The equilibrium constant, , can be evaluated by considering the redox potentials of the reactions (A7) and (A8) using the relations and , which translates to Equation (A10):
To determine , the following two redox reactions are considered:
Subtracting (A11) from (A8) and rearranging leads to reaction (A12) as:
Reaction (A12) is twice that of reaction (A5) and therefore . The equilibrium constant can be evaluated from the redox potentials of reactions (A8) and (A11) using the relation (A13) given as:
When the equilibrium constants and are determined from reactions (A13) and (A10), respectively, the equilibrium constant can be calculated using the relation:
Another possible halide exchange reaction could be:
The equilibrium constant for the reaction (A15) is given as:
The equilibrium constant can be determined by combining the following redox reactions (A7) and (A1):
Subtracting (A7) from (A1) and rearranging leads to reaction (A15), and the equilibrium constant can be determined using the relation (A16), given as:
Let us consider another trihalide reaction, given as:
The equilibrium constant for the reaction (A17) is given as:
The equilibrium constant can be calculated using the relation:
It is well documented that is a Lewis base and is a Lewis acid [4,5,6,7]. Therefore, these species combine homogeneously and form a complex polyhalide anion, given as:
The equilibrium constant for the reaction (A19) is given as:
Reaction (A19) can be obtained by subtracting reaction (A1) from (A3) and rearranging as reaction (A20):
The reaction (A20) is twice that of reaction (A19). The equilibrium constant can be obtained from the redox reactions of (A3) and (A1):
The equilibrium constant for the trihalide reaction (A6) is given as:
can be calculated using the relation:
Another iodide/triiodide halide exchange reaction is:
The equilibrium constant for reaction (A23) is given as:
can be calculated by considering the following redox reactions:
Subtracting reaction (A2) from reaction (A24) and rearranging the reaction, we can calculate the using relation (A25):
Another iodide and chlorine interaction reaction, different from that of (A15) is given as:
The equilibrium constant of reaction (A26) is given as:
The equilibrium constant can be evaluated by considering the following redox reactions:
Subtracting reaction (A2) from reaction (A7) and rearranging the reaction, we can calculate the using relation (A27):
References
- Steven, M.F. Summary of Iodine Partitioning in EBR-II Fuel, Internal Report; Idaho National Laboratory: Idaho Falls, ID, USA, 2016; SMF-001-16.
- Conrad, J.K.; Iwamatsu, K.; Woods, M.E.; Gakhar, R.; Layne, B.; Cook, A.R.; Horne, G.P. Impact of Iodide Ions on the Speciation of Radiolytic Transients in Molten LiCl-KCl Eutectic Salt Mixtures. Phys. Chem. Chem. Phys. 2023, 25, 169–1617. [Google Scholar] [CrossRef]
- O’Regan, B.; Grätzel, M. A Low-Cost, High-Efficiency Solar Cell Based on Dye-Sensitized Colloidal TiO2 Films. Nature 1991, 353, 737–740. [Google Scholar] [CrossRef]
- Bentley, C.L.; Bond, A.M.; Hollenkamp, A.F.; Mahon, P.J.; Zhang, J. Unexpected Complexity in the Electro-Oxidation of Iodide on Gold in the Ionic Liquid 1-Ethyl-3-Methylimidazolium Bis(Trifluoromethanesulfonyl)Imide. Anal. Chem. 2013, 85, 11319–11325. [Google Scholar] [CrossRef] [PubMed]
- Bentley, C.L.; Bond, A.M.; Hollenkamp, A.F.; Mahon, P.J.; Zhang, J. Concentration and Electrode Material Dependence of the Voltammetric Response of Iodide on Platinum, Glassy Carbon and Boron-Doped Diamond in the Room Temperature Ionic Liquid 1-Ethyl-3-Methylimidazolium Bis(Trifluoromethanesulfonyl)Imide. Electrochim. Acta 2013, 109, 554–561. [Google Scholar] [CrossRef]
- Bentley, C.L.; Bond, A.M.; Hollenkamp, A.F.; Mahon, P.J.; Zhang, J. Electrochemistry of Iodide, Iodine, and Iodine Monochloride in Chloride Containing Nonhaloaluminate Ionic Liquids. Anal. Chem. 2016, 88, 1915–1921. [Google Scholar] [CrossRef]
- Bentley, C.L.; Bond, A.M.; Hollenkamp, A.F.; Mahon, P.J.; Zhang, J. Voltammetric Determination of the Iodide/Iodine Formal Potential and Triiodide Stability Constant in Conventional and Ionic Liquid Media. J. Phys. Chem. C 2015, 119, 22392–22403. [Google Scholar] [CrossRef]
- Grossi, J.; Kohanoff, J.J.; English, N.J.; Bringa, E.M.; Del Pópolo, M.G. On the Mechanism of the Iodide–Triiodide Exchange Reaction in a Solid-State Ionic Liquid. J. Phys. Chem. B 2017, 121, 6436–6441. [Google Scholar] [CrossRef] [PubMed]
- Shiga, T.; Kondo, H.; Kato, Y.; Hase, Y. Iodine Mediator with Anomalously High Redox Potential and Its Application to a Catalytic Cycle for Lithium Carbonate Decomposition toward Future Lithium Reproduction. J. Phys. Chem. C 2019, 123, 3944–3950. [Google Scholar] [CrossRef]
- Byrne, A.; Bringa, E.M.; Del Pópolo, M.G.; Kohanoff, J.J.; Galassi, V.; English, N.J. Mechanisms of Iodide–Triiodide Exchange Reactions in Ionic Liquids: A Reactive Molecular-Dynamics Exploration. Int. J. Mol. Sci. 2019, 20, 1123. [Google Scholar] [CrossRef]
- Chen, R. New Redox Chemistries of Halogens in Aqueous Batteries. ChemSusChem 2025, 18, e202401678. [Google Scholar] [CrossRef]
- Guo, Q.; Kim, K.I.; Li, S.; Scida, A.M.; Yu, P.; Sandstrom, S.K.; Zhang, L.; Sun, S.; Jiang, H.; Ni, Q.; et al. Reversible Insertion of I–Cl Interhalogen in a Graphite Cathode for Aqueous Dual-Ion Batteries. ACS Energy Lett. 2021, 6, 459–467. [Google Scholar] [CrossRef]
- Wang, H.; Zhou, F.; Wang, S.; Cai, M.; Zhang, X.; Wang, D.; Guo, Y.; Wu, Y.; Shi, H.; Chen, X.; et al. An Electrochemical Method for the Sustainable Extraction of Iodine and Sodium Alloys. Chem. Eng. J. 2025, 524, 168918. [Google Scholar] [CrossRef]
- Ejigu, A.; Lovelock, K.R.J.; Licence, P.; Walsh, D.A. Iodide/Triiodide Electrochemistry in Ionic Liquids: Effect of Viscosity on Mass Transport, Voltammetry and Scanning Electrochemical Microscopy. Electrochim. Acta 2011, 56, 10313–10320. [Google Scholar] [CrossRef]
- Lebedeva, O.; Kuznetsova, I.; Kultin, D.; Kustov, L. Comparison of the Electrochemical Behavior of Iodide Ion in Hydrophobic/Hydrophilic Ionic Liquids. J. Electrochem. Soc. 2022, 169, 026521. [Google Scholar] [CrossRef]
- Sacchetto, G.A.; Bombi, G.G.; Fiorani, M. Standard Electrode Potentials of the Iodine-Iodide System in Molten (Li,K)NO3. J. Electroanal. Chem. Interfacial Electrochem. 1969, 20, 89–98. [Google Scholar] [CrossRef]
- Lee, R.Y.; Percival, S.J.; Small, L.J. Electrochemical Modeling of Iodide Oxidation in Metal-Halide Molten Salts. J. Electrochem. Soc. 2021, 168, 126511. [Google Scholar] [CrossRef]
- Ge, J.; Wang, Y.; Chesser, R.; Zhang, J. Electrochemical Behavior and Separation of Iodide in Molten LiF-NaF-KF Melt. J. Nucl. Mater. 2020, 542, 152468. [Google Scholar] [CrossRef]
- Durán-Klie, G.; Rodrigues, D.; Delpech, S. Electrochemical Behavior of Iodide Ions in Molten Fluoride Salts. Electrochim. Acta 2023, 445, 142019. [Google Scholar] [CrossRef]
- del Rocío Rodríguez-Laguna, M.; Garcia, R.H.L.; Yoo, T.S.; Anderson, S.T.; Horne, G.P.; Gakhar, R. Effect of Iodides on Thermal Behavior and Phase Partitioning in LiCl-KCl. J. Mol. Liq. 2025, 418, 126706. [Google Scholar] [CrossRef]
- Dixon, C.M.; Aziziha, M.; Mofrad, A.; Palma, J.P.S.; Booth, R.E.; Manissery, A.P.; Wilson, J.A.; Loye, H.C.; Tisdale, H.B.; Schorne-Pinto, J.; et al. Thermodynamic Assessment of the Li, Na, K, Cs | F, I Reciprocal Salt for MSR Applications. J. Chem. Thermodyn. 2025, 211, 107548. [Google Scholar] [CrossRef]
- Percival, S.J.; Small, L.J.; Spoerke, E.D. Electrochemistry of the NaI-AlCl3 Molten Salt System for Use as Catholyte in Sodium Metal Batteries. J. Electrochem. Soc. 2018, 165, A3531. [Google Scholar] [CrossRef]
- Masset, P. Iodide-Based Electrolytes: A Promising Alternative for Thermal Batteries. J. Power Sources 2006, 160, 688–697. [Google Scholar] [CrossRef]
- Gross, M.M.; Percival, S.J.; Lee, R.Y.; Peretti, A.S.; Spoerke, E.D.; Small, L.J. A High-Voltage, Low-Temperature Molten Sodium Battery Enabled by Metal Halide Catholyte Chemistry. Cell Rep. Phys. Sci. 2021, 2, 100489. [Google Scholar] [CrossRef]
- Maraschky, A.M.; Percival, S.J.; Lee, R.Y.; Meyerson, M.L.; Peretti, A.S.; Spoerke, E.D.; Small, L.J. Electrode Blocking Due to Redox Reactions in Aluminum Chloride-Sodium Iodide Molten Salts. J. Electrochem. Soc. 2023, 170, 066504. [Google Scholar] [CrossRef]
- Dryhurst, G.; Elving, P.J. Electrooxidation of Halides at Pyrolytic Graphite Electrode in Aqueous and Acetonitrile Solutions. Anal. Chem. 1967, 39, 606–615. [Google Scholar] [CrossRef]
- Im, K.; Lee, M.; Woo, S.M. Technical Overview of Pyro-Processing and Policy Considerations. Korean J. Chem. Eng. 2024, 41, 2881–2899. [Google Scholar] [CrossRef]
- Mausolff, Z.; DeHart, M.; Goluoglu, S. Design and Assessment of a Molten Chloride Fast Reactor. Nucl. Eng. Des. 2021, 379, 111181. [Google Scholar] [CrossRef]
- Popov, A.I.; Geske, D.H. Studies on the Chemistry of Halogen and of Polyhalides. XVI. Voltammetry of Bromine and Interhalogen Species in Acetonitrile. J. Am. Chem. Soc. 1958, 80, 5346–5349. [Google Scholar] [CrossRef]
- Olsson, L.F. Halide-Exchange Reactions of Mixed Chloro-Bromo-Iodo Trihalides. 1. Equilibria in the Chloro-Iodo System. Inorg. Chem. 1985, 24, 1398–1405. [Google Scholar] [CrossRef]
- Bailar, J.C.; Emeléus, H.J.; Nyholm, R.; Trotman-Dickenson, A.F. Comprehensive Inorganic Chemistry; Bailar, J.C., Emeléus, H.J., Nyholm, R., Trotman-Dickenson, A.F., Eds.; Pergamon Press: Oxford, UK, 1973; Volume 2, ISBN 008017275X. [Google Scholar]
- Marsden, K.C.; Pesic, B. Evaluation of the Electrochemical Behavior of CeCl3 in Molten LiCl-KCl Eutectic Utilizing Metallic Ce as an Anode. J. Electrochem. Soc. 2011, 158, F111. [Google Scholar] [CrossRef]
- Pizzini, S.; Morlotti, R. Oxygen and Hydrogen Electrodes in Molten Fluorides. Electrochim. Acta 1965, 10, 1033–1041. [Google Scholar] [CrossRef]
- Kanzaki, Y.; Takahashi, M. Kinetics of the Electrode Reaction of the Tris(Ethylenediamine)Cobalt(III)/(II) System at a Mercury Electrode. Electroanal. Chem. Interfacial Electrochem. 1975, 58, 349–356. [Google Scholar] [CrossRef]
- Misra, M.; Raja, K.S.; Ruppert, J. Electrochemical Corrosion Behavior of Refractory Metals in LiCl-Li2O Molten Salt. ECS Trans. 2010, 33, 181. [Google Scholar] [CrossRef]
- Gileadi, E. Physical Electrochemistry: Fundamentals, Techniques and Applications; Wiley-VCH: Weinheim, Germany, 2011; ISBN 9783527319701. [Google Scholar]
- Vandarkuzhali, S.; Gogoi, N.; Ghosh, S.; Prabhakara Reddy, B.; Nagarajan, K. Electrochemical Behaviour of LaCl3 at Tungsten and Aluminium Cathodes in LiCl–KCl Eutectic Melt. Electrochim. Acta 2012, 59, 245–255. [Google Scholar] [CrossRef]
- Yoon, D.; Pormatikul, J.; Shaltry, M.; Phongikaroon, S.; Allahar, K. Determination of Kinetic Properties of Sm(III)/Sm(II) Reaction in LiCl–KCl Molten Salt Using Cyclic Voltammetry and Electrochemical Impedance Spectroscopy. J. Radioanal. Nucl. Chem. 2019, 322, 1031–1037. [Google Scholar] [CrossRef]
- Yoon, D.; Phongikaroon, S. Measurement and Analysis of Exchange Current Density for U/U3+ Reaction in LiCl-KCl Eutectic Salt via Various Electrochemical Techniques. Electrochim. Acta 2017, 227, 170–179. [Google Scholar] [CrossRef]
- Cohen, Y.S.; Gabay, Y.; Cohen, Y. Temperature-Dependent Impedance Spectroscopy of Molten Alkali-Halide Salt Binary Mixtures. ECS Electrochem. Lett. 2015, 4, H1. [Google Scholar] [CrossRef]
- Martin, J.D.; Goettler, S.J.; Fosseé, N.; Iton, L. Designing Intermediate-Range Order in Amorphous Materials. Nature 2002, 419, 381–384. [Google Scholar] [CrossRef]
- Bard, A.J. Electrochemical Methods: Fundamentals and Applications, 3rd ed.; Faulkner, L.R., White, H.S., Eds.; John Wiley & Sons: Hoboken, NJ, USA, 2022; ISBN 9781119334064. [Google Scholar]
- Chemla, M.; Okada, I. Ionic Mobilities of Monovalent Cations in Molten Salt Mixtures. Electrochim. Acta 1990, 35, 1761–1776. [Google Scholar] [CrossRef]
- Delimarskiĩ, I.K. Electrochemistry of Fused Salts; Markov, B.F., Ed.; Sigma Press: Washington, DC, USA, 1961. [Google Scholar]
- Orazem, M.E.; Tribollet, B. Electrochemical Impedance Spectroscopy, 1st ed.; The Electrochemical Society Series; Wiley: Hoboken, NJ, USA, 2008; Volume 48, ISBN 9780470041406. [Google Scholar]
- Lockett, V.; Sedev, R.; Ralston, J.; Horne, M.; Rodopoulos, T. Differential Capacitance of the Electrical Double Layer in Imidazolium-Based Ionic Liquids: Influence of Potential, Cation Size, and Temperature. J. Phys. Chem. C 2008, 112, 7486–7495. [Google Scholar] [CrossRef]
- Dokashenko, S.I.; Stepanov, V.P. The Structure of the Electric Double Layer on Liquid Metal Electrodes in Individual Alkali Metal Halide Melts. Ehlektrokhimiya 1993, 29, 1301–1305. [Google Scholar]
- Mahon, P.J.; Oldham, K.B. Semioperations and Convolutions in Voltammetry. ChemElectroChem 2018, 5, 839–848. [Google Scholar] [CrossRef]
- Houam, S.; Affoune, A.M.; Atek, I.; Kesri, F.; Saad Guermeche, R.; Chelaghmia, M.L.; Nacef, M.; Khelifi, O.; Banks, C.E. Determination of the Standard Rate Constant for Soluble-Soluble Quasi-Reversible Electrochemical Systems by Linear Sweep Voltammetry: Application to the Electrochemical Oxidation on Screen-Printed Graphite Electrodes. Electrochim. Acta 2023, 449, 142200. [Google Scholar] [CrossRef]
- Compton, R.G. Understanding Voltammetry, 2nd ed.; Banks, C.E., Ed.; Imperial College Press: London, UK, 2011; ISBN 1848165862. [Google Scholar]
- Rogers, E.I.; Streeter, I.; Aldous, L.; Hardacre, C.; Compton, R.G. Electrode Kinetics and Mechanism of Iodine Reduction in the Room-Temperature Ionic Liquid [C4mim][NTf2]. J. Phys. Chem. C 2008, 112, 10976–10981. [Google Scholar] [CrossRef]
- Rogers, E.I.; Silvester, D.S.; Aldous, L.; Hardacre, C.; Compton, R.G. Electrooxidation of the Iodides [C4mim]I, LiI, NaI, KI, RbI, and CsI in the Room Temperature Ionic Liquid [C4mim][NTf2]. J. Phys. Chem. C 2008, 112, 6551–6557. [Google Scholar] [CrossRef]
- Heo, J.; Kim, J.G.; Choi, E.H.; Ki, H.; Ahn, D.S.; Kim, J.; Lee, S.; Ihee, H. Determining the Charge Distribution and the Direction of Bond Cleavage with Femtosecond Anisotropic X-Ray Liquidography. Nat. Commun. 2022, 13, 522. [Google Scholar] [CrossRef]
- Okada, I. The Chemla Effect ---from the Separation of Isotopes to the Modeling of Binary Ionic Liquids. J. Mol. Liq. 1999, 83, 5–22. [Google Scholar] [CrossRef]
- Takagi, R.; Shimotake, H.; Jensen, K.J. Determination of Internal Cation Mobilities in the Molten System (Li-K)Cl at 723 K. J. Electrochem. Soc. 1984, 131, 1280. [Google Scholar] [CrossRef]
- Kamiyama, T.; Fukase, A.; Asahi, N.; Nakamura, Y. Ionic Transport Properties in the Molten LiCl-LiI System. J. Mol. Liq. 1999, 83, 51–56. [Google Scholar] [CrossRef]
- Varanasi, S.R.; Yashonath, S. Variation of Diffusivity with the Cation Radii in Molten Salts of Superionic Conductors Containing Iodine Anion: A Molecular Dynamics Study. J. Chem. Sci. 2012, 124, 159–166. [Google Scholar] [CrossRef]
- Kergoat, M.; Gibilaro, M.; Massot, L.; Chamelot, P. Generalized Method for Determining Fluoroacidity by Electrochemical Diffusion Coefficient Measurement (Application to HfF4). Electrochim. Acta 2015, 176, 265–269. [Google Scholar] [CrossRef]
- Shannon, R.D. Revised Effective Ionic Radii and Systematic Studies of Interatomic Distances in Halides and Chalcogenides. Acta Crystallogr. 1976, 32, 751–767. [Google Scholar] [CrossRef]
- Liu, Y.; Topsakal, M.; Zheng, K.; Betancourt, L.E.; Woods, M.; Roy, S.; Patra, N.; Leshchev, D.; Halstenberg, P.; Maltsev, D.S.; et al. Correlative Analysis of Ni(II) Coordination States in Molten Salts Using a Combination of X-Ray and Optical Spectroscopies and Simulations. Chem. Sci. 2025, 16, 10414–10423. [Google Scholar] [CrossRef] [PubMed]
- Castrillejo, Y.; Hernández, P.; Rodriguez, J.A.; Vega, M.; Barrado, E. Electrochemistry of Scandium in the Eutectic LiCl–KCl. Electrochim. Acta 2012, 71, 166–172. [Google Scholar] [CrossRef]
- Zhao, J.; Liu, Z.; Lu, G. Electrochemical Evaluation of Fe2+ Ions in MgCl2−NaCl−KCl Melt. Trans. Nonferrous Met. Soc. China 2025, 35, 1704–1712. [Google Scholar] [CrossRef]
- Hagiwara, H.; Sawamura, S.; Sumiyoshi, T.; Katayama, M. Pulse Radiolysis Study of Transient Species in LiCl-KCl Melt. International Journal of Radiation Applications and Instrumentation. Part C. Radiat. Phys. Chem. 1987, 30, 141–144. [Google Scholar] [CrossRef]
- Nguyen, H.H.; Bryantsev, V.S.; Margulis, C.J. Are High-Temperature Molten Salts Reactive with Excess Electrons? Case of ZnCl2. J. Phys. Chem. B 2023, 127, 9155–9164. [Google Scholar] [CrossRef]


Disclaimer/Publisher’s Note: The statements, opinions and data contained in all publications are solely those of the individual author(s) and contributor(s) and not of MDPI and/or the editor(s). MDPI and/or the editor(s) disclaim responsibility for any injury to people or property resulting from any ideas, methods, instructions or products referred to in the content. |
© 2026 by the authors. Licensee MDPI, Basel, Switzerland. This article is an open access article distributed under the terms and conditions of the Creative Commons Attribution (CC BY) license.