Abstract
The “shuttle effect” caused by the shuttling of soluble long-chain polysulfides between the anode and cathode electrodes has persistently hindered lithium–sulfur batteries (LSBs) from achieving stable and high-capacity performance. Numerous materials have been explored to mitigate the adverse effects of this phenomenon, among which metal oxides and metal sulfides are regarded as promising solutions due to their strong adsorption capability toward lithium polysulfides (LiPSs). However, the poor electrical conductivity of the metal oxides and sulfides, coupled with their inherent morphological limitations, makes it challenging to sustainably suppress LiPS shuttling. In this study, we designed a heterostructured catalyst composed of a metal oxide–metal sulfide heterostructure integrated with carbon nanotubes (CNTs). This design addresses the low conductivity issue of metal oxides/sulfides while optimizing the material’s morphology, enabling persistent LiPSs adsorption. Furthermore, the composite successfully facilitates three-dimensional (3D) Li2S deposition. The assembled battery exhibits stable and high-capacity performance, delivering an initial discharge capacity of 622.45 mAh g−1 at 2C and retaining 569.5 mAh g−1 after 350 cycles, demonstrating exceptional cycling stability.
1. Introduction
With the continuous advancement of energy storage technologies, batteries have found widespread applications in electronic devices such as smartphones and laptops, as well as in the rapidly growing electric vehicle industry. As batteries become indispensable in daily life and industrial production, the demand for high-performance, environmentally friendly energy storage solutions has surged. Lithium–sulfur batteries (LSBs) have attracted significant attention due to their high theoretical capacity (1675 mAh g−1), exceptional energy density (2600 Wh kg−1), and eco-friendly reaction products [1,2,3].
The cathode host materials in LSBs play a pivotal role in supporting sulfur, the primary active material, which makes them a critical research focus for industrial-scale LSB development. Current research on LSB cathodes primarily targets three key challenges [4,5]: (1) suppressing the “shuttle effect”; (2) mitigating the volume expansion of polysulfides; and (3) improving the conductivity of reaction products. The “shuttle effect” arises from the migration of lithium polysulfides (LiPSs) to the anode, leading to irreversible reactions and loss of the active materials. Meanwhile, the significant volume expansion of polysulfides compared to sulfur can destabilize the cathode structure, while the insulating nature of Li2S reduces the active material utilization [6,7,8]. Catalysts have been considered as an effective approach to mitigate the “shuttle effect.” By accelerating the reactions in LSBs, the overall transport of LiPSs to the anode side can be significantly reduced. Additionally, the 3D morphology of Li2S deposition increases the contact area with the electrolyte, ensuring that the surface of the conductive electrode remains available for repeated charge/discharge cycles without excessive resistance [9]. Catalysts have been considered an effective method to resolve the “shuttle effect”. As the reaction of the Li-S battery accelerates, the total amount of LiPSs transport to the anode side can be significantly reduced. Therefore, the catalyst ability is of crucial importance for achieving long-cycle, high-capacity Li-S batteries. The mechanisms behind this phenomenon are of crucial importance. As for conventional 2D morphology Li2S deposition, the Li2S tends to form along the electrode/electrolyte interface, during which the formation has to overcome huge interfacial impedance, slowing the kinetics and hence hampering the battery rate capability [10].
Numerous studies have searched for solutions to these issues, such as employing metal sulfides and oxides as the sulfur host materials. These materials enhance battery performance through strong LiPSs adsorption and catalytic effects. Notably, heterostructured materials exhibit superior LiPSs adsorption and catalytic activity compared to their single-component counterparts. For instance, Li et al. [11] developed a NiS2/CoS2 catalyst for separator modification, effectively alleviating the “shuttle effect” and improving LiPSs conversion efficiency. The assembled battery delivered a remarkable capacity of 901.7 mAh g−1 at 1C and maintained stability over 300 cycles. Similarly, Liu et al. [12] designed a yolk-shell Fe3O4/FeP@C heterostructure, which revealed the relationship between catalytic activity and spin-state configuration. The modified separator enabled Li||S pouch cells to achieve an initial capacity of 928.5 mAh g−1 at 0.1C, while Li||Li symmetric cells achieved stable cycling for 4000 h. Zhu et al. [13] reported a Cu3P/Cu2O/PC composite as the cathode host, which significantly promoted the redox kinetics, yielding a high capacity of 1254.3 mAh g−1 at 0.2C. However, the poor conductivity and morphological constraints of these materials limit their practical applications in LSBs.
In this work, we synthesized a ZnS/CeO2@CNT heterostructure catalyst as a sulfur host material for LSBs. The composite exhibits exceptional LiPSs adsorption and catalytic performance. The CNTs framework provides high conductivity and a microporous sponge-like structure, effectively guiding the deposition of Li2S into a favorable 3D morphology. The assembled LSBs achieved an initial capacity of 1451.7 mAh g−1 at 0.1C and 622.45 mAh g−1 at 2C, with a capacity retention of 91.5% after 350 cycles (equivalent to a minimal decay rate of 0.024% per cycle).
2. Results and Discussion
Figure 1a shows the X-ray diffraction (XRD) pattern of the ZnS/CeO2@CNT sample. In the 2θ range of 5–15°, distinct characteristic peaks are observed. For the reference material ZnS/CeO2, similar features can also be found, while ZnS/CeO2@CNT with the presence of carbon nanotubes (CNTs) maintains these characteristics. The diffraction peaks correspond well to the standard reference patterns of ZnS (PDF#01-077-2100) and CeO2 (PDF#97-4018-0851), with characteristic peaks marked in different colors. Notably, all characteristic peaks of CeO2 including (111), (200), (311), (222), and (400) overlap with the ZnS diffraction peaks, while the remaining peaks are exclusively attributed to ZnS [14]. The XRD analysis preliminarily confirmed the coexistence of CNTs, ZnS, and CeO2 in the material. X-ray photoelectron spectroscopy (XPS) further elucidated the material’s composition and chemical states. Figure 1b displays the high-resolution C 1s spectrum, where peaks at 284.80 eV, 287.31 eV, and 289.80 eV correspond to C=C, C-N, and O-C=O bonds, respectively. The presence of C-N bonds results from the nitrogen doping during synthesis under N2 atmosphere. The Ce 3d spectrum (Figure 1c) exhibits six peaks confirming the +4 oxidation state of Ce. The O 1s spectrum (Figure 1d) shows peaks at 529.90 eV (Ce-O) and 532.20 eV (C=O), respectively. In the S 2p spectrum (Figure 1e), the peak at 161.83 eV corresponds to Zn-S bonds. The Zn 2p line (Figure 1f) reveals peaks at 1022.56 eV (Zn 2p3/2) and 1046.85 eV (Zn 2p1/2), indicating the Zn2+ state. Collectively, the XRD and XPS analyses conclusively demonstrate the successful synthesis of the ZnS/CeO2@CNT composite [15].
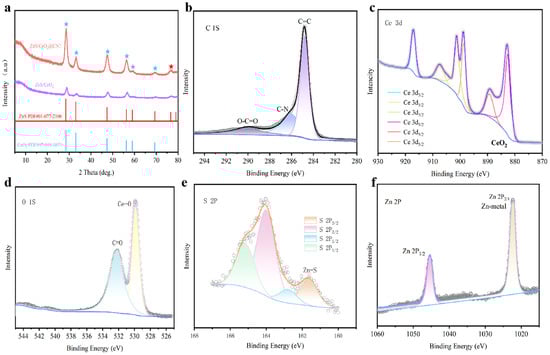
Figure 1.
(a) XRD pattern of ZnS/CeO2@CNT material (red stars are the diffraction peak of ZnS and blue stars are the CeO2) and XPS spectra of ZnS/CeO2@CNT material: (b) C 1S, (c) Ce 3d, (d) O 1S, (e) S 2P, (f) Zn 2P.
Figure 2a shows the scanning electron microscopy (SEM) image of ZnS/CeO2@CNT, revealing a sponge-like microporous structure formed by the aggregation of CNTs with linear morphology. In contrast, the reference material ZnS/CeO2 (Figure 2b) exhibits distinct spherical particles with significant interparticle voids. The transmission electron microscopy (TEM) analysis (Figure 2c) clearly demonstrates the tubular structure of the CNTs, with ZnS/CeO2 nanoparticles uniformly distributed on the CNT surface. The high-resolution TEM (Figure 2d) displays lattice fringes corresponding to interplanar spacings of d(222) = 0.328 nm, d(400) = 0.366 nm, d(620) = 0.589 nm, and d(331) = 0.389–0.395 nm. The (222) and (400) planes are shared by both ZnS and CeO2 phases, while the (331) and (620) planes are unique to ZnS, confirming the formation of ZnS/CeO2 heterojunctions at the interface regions (blue circles) and throughout the material. Energy-dispersive X-ray spectroscopy (EDS) mapping (Figure 2e) demonstrated a homogeneous distribution of Ce, C, O, and S elements, consistent with the uniform coating of ZnS/CeO2 on CNTs observed in TEM. Quantitative analysis revealed the following composition: Ce: 38.80 wt% (6.92 at%), C: 17.02 wt% (35.43 at%), O: 31.59 wt% (49.37 at%), and S: 8.71 wt% (6.79 at%). The reference ZnS/CeO2 material shows similar elemental distribution patterns (Figure S1), confirming the structural homogeneity of both samples. These results collectively verify the successful construction of the ZnS/CeO2@CNT heterostructure with well-distributed active components on the conductive CNT network [16].
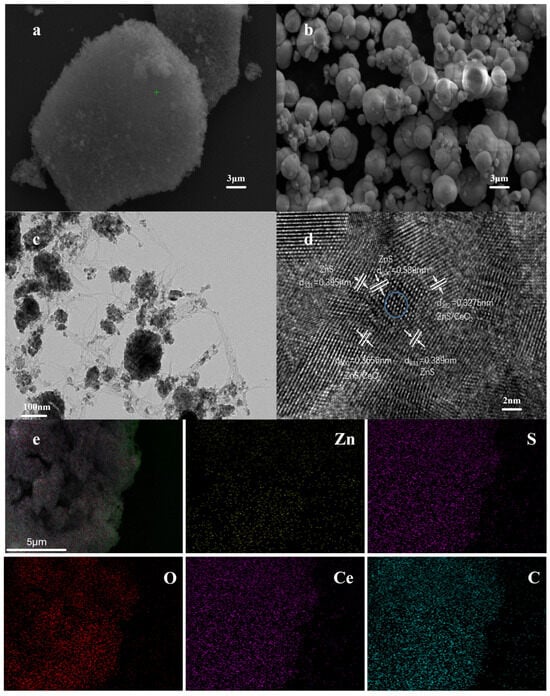
Figure 2.
(a) SEM image of ZnS/CeO2@CNT; (b) SEM scanning image of ZnS/CeO2; (c) TEM image of ZnS/CeO2@CNT; (d) TEM lattice fringe of ZnS/CeO2@CNT, the blue circled area is the heterostructure of ZnS/CeO2; (e) EDS spectrum of ZnS/CeO2@CNT.
To investigate the electrocatalytic performance of the synthesized material as the cathode host for LSBs, cyclic voltammetry (CV) measurements were systematically conducted on the coin-type cells. Figure 3a presents the CV profiles of the ZnS/CeO2@CNT cathode material at various scan rates, exhibiting two distinct reduction peaks (Peak 1 and Peak 2) that correspond to the electrochemical reduction processes of S8 to Li2S4 and subsequent conversion to Li2S, respectively. The oxidation peak (Peak 3) represents the reverse reactions from Li2S to long-chain polysulfides during the charging process. Comparative analysis of the CV curves reveals that the ZnS/CeO2@CNT composite demonstrates significantly enhanced catalytic activity across all redox processes, particularly at the rate-limiting steps (Peak 2 for discharge and Peak 3 for charge), as evidenced by the substantially higher peak current densities, which markedly increases the integrated peak areas. In addition, the well-defined peak shapes indicate improved reaction kinetics. In contrast, the control material ZnS/CeO2 exhibits irregular CV profiles suggesting parasitic side reactions, drastically reduced current response, and poor peak resolution, confirming its inadequacy as a sulfur host material. The linear correlation between the peak currents and square roots of scan rates was quantitatively analyzed (Figure 3d–f) via Randles–Sevcik equation analysis [17,18,19], where IP represents the peak current, n is the number of transferred electrons, A is the area of the electrode sheet, v is the scanning rate of the cyclic voltammetry, CLi is the concentration of lithium ions, and DLi+ is the diffusion coefficient of lithium ions:
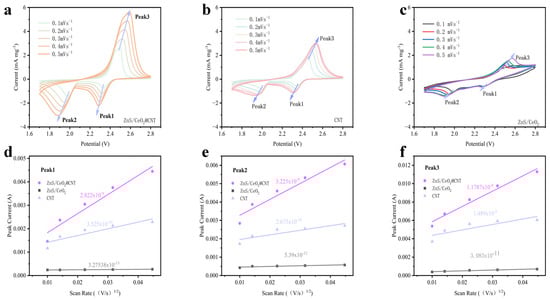
Figure 3.
CV tests of coin-type half-cells with different materials as sulfur host materials: (a) ZnS/CeO2@CNT, (b) CNT, (c) ZnS/CeO2. Linear fitting of current at different peaks and the square root of scan rate for different materials: (d) Peak 1, (e) Peak 2, and (f) Peak 3.
The lithium-ion diffusion coefficients were determined as follows: DLi1+ = 2.822 × 10⁻⁹ cm2 s−1 (S8→Li2S4), DLi2+ = 3.225 × 10⁻⁹ cm2 s−1 (Li2S4→Li2S), and DLi3+ = 1.179 × 10⁻⁹ cm2 s−1 (Li2S→S8). These superior diffusion kinetics, exceeding those of the control materials by an order of magnitude, demonstrate the composite’s exceptional capability to facilitate lithium-ion transport during redox processes, thereby validating its effectiveness as high-performance sulfur host material for advanced LSBs.
To further investigate the catalytic properties of the materials, we conducted systematic electrochemical impedance spectroscopy (EIS) measurements. As shown in the Nyquist plot (Figure 4a), the ZnS/CeO2@CNT composite demonstrates superior impedance characteristics: the most forward-shifted starting point in the high-frequency region indicates the lowest contact resistance; while the smallest semicircle diameter in the mid-frequency region reveals minimal charge transfer resistance and interfacial impedance. Furthermore, the steepest slope in the low-frequency region of the ZnS/CeO2@CNT spectrum suggests significantly enhanced lithium-ion diffusion capability compared to the control materials, which aligns well with the previously calculated lithium-ion diffusion coefficients [20,21].
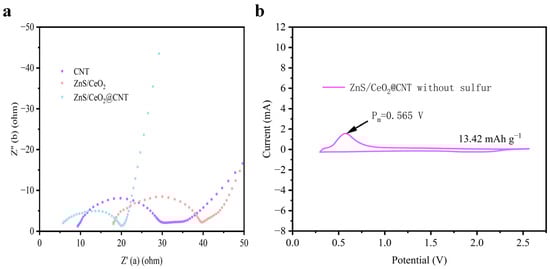
Figure 4.
(a) Nyquist plot of EIS test for different materials; (b) CV curve of ZnS/CeO2@CNT material without adding sublimated sulfur in the range of 0-3 V.
The EIS spectra of the contrast materials ZnS/CeO2 and CNT exhibit additional impedance features in the mid-frequency region. This phenomenon arises from their tendency to form unfavorable structures for Li2S deposition when serving as the cathode host materials in LSBs, leading to agglomeration of insoluble and insulating LiPSs and consequent increases in the electrode/electrolyte interfacial impedance. In contrast, the ZnS/CeO2@CNT composite, with its spherical ZnS/CeO2 functional groups uniformly grown on acid-treated CNTs possessing abundant active sites, maintains a more homogeneous pore size distribution. This unique architecture effectively prevents the particle agglomeration and the formation of unfavorable morphologies for Li2S deposition, thereby achieving significantly reduced interfacial impedance [22].
Considering the potential capacity contribution from sulfur elements in metal sulfides, we fabricated cathodes without active sulfur material and performed CV tests in lithium-ion coin-type half-cells. The results (Figure 4b) show a distinct oxidation peak at 0.565 V, indicating irreversible electrochemical reactions. However, since this potential lies outside the operational voltage window of LSBs (1.7–2.8 V), these side reactions do not interfere with normal charge/discharge processes. Quantitative analysis reveals that ZnS/CeO2@CNT contributes only 13.42 mAh g−1 within the 0–3 V range, accounting for a negligible 0.8% of the LSBs’ theoretical capacity (1675 mAh g−1), confirming its minimal impact on the actual battery performance [22,23].
To gain deeper insights into the relationship between Li2S deposition behavior and the host materials, we conducted chronoamperometry tests on coin-type half-cells using different host materials. As shown in Figure 5a–c, after nonlinear fitting analysis, the Li2S deposition capacity contributions were quantified as 379.5 mAh g−1 for ZnS/CeO2@CNT, 103.2 mAh g−1 for ZnS/CeO2, and 74.6 mAh g−1 for CNT, demonstrating the superior capability of ZnS/CeO2@CNT in facilitating Li2S deposition. Normalized i-t curves were further analyzed by comparison with Bewick–Fleischman–Thirsk (BFT) and Scharifker–Hills (SH) models [10,24], where tm and jm are the values of the peak points, while t and j are the values of the instantaneous points:
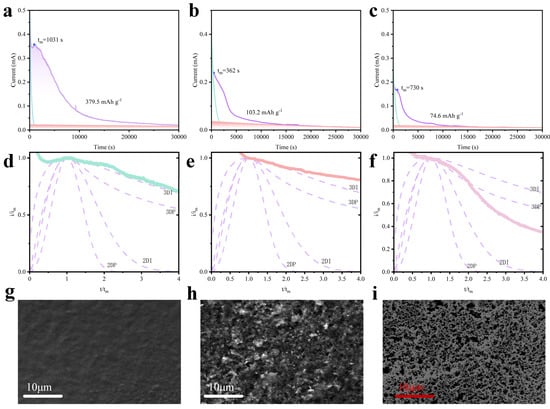
Figure 5.
Nonlinear fitting plot of i-t curves obtained when different materials are used as sulfur host materials for lithium–sulfur coin-type half-cells (purple area is the capacity contribution of Li2S4 converting into Li2S; orange area representing the reduction of Li2S6; the green area representing the reduction of Li2S8.): (a) ZnS/CeO2@CNT, (c) ZnS/CeO2, and (e) CNT; comparison of deposition morphologies obtained from i-t curves (purple line is the standardized BFT and SH models, representing different Li2S morphology 3DI, 3DP, 2DI and 2DP.): (b) modified i-t curve of ZnS/CeO2@CNT (green), (d) modified i-t curve of ZnS/CeO2 (orange), and (f) modified i-t curve of CNT (pink). SEM images of electrodes after initial discharge: (g) ZnS/CeO2@CNT, (h) ZnS/CeO2, and (i) CNT.
The results reveal distinct deposition morphologies: ZnS/CeO2@CNT precisely follows the 3D instantaneous (3DI) growth model throughout the deposition process, while ZnS/CeO2 initially exhibits 3DI behavior but gradually deviates to non-ideal deposition patterns; CNT-hosted deposition shows intermediate characteristics between 2D instantaneous (2DI) and 3D progressive (3DP) growth modes. This divergence stems from the fundamental material properties, as ZnS/CeO2@CNT and CNT represent two distinct categories, polar and non-polar materials, respectively. In polar materials, Li2S deposition initiates at polar sites, forming droplet-like regions enriched with LiPSs. Subsequent conversion within these droplets enables vertical growth, yielding 3D Li2S morphologies. Conversely, non-polar materials predominantly undergo direct Li2S formation or conversion from LiPSs, resulting in surface-preferred 2D deposition due to the absence of polar sites. Detailed examination shows that ZnS/CeO2, as a polar material, initially follows 3DI deposition. However, as Li2S progressively covers polar sites (Figure 5e,h, SEM), the material’s LiPS adsorption capacity diminishes, leading to incomplete subsequent deposition and formation of densely packed Li2S aggregates. These insulating layers not only hinder further LiPS conversion during discharge but also impede complete oxidative recovery during charging. CNTs, being non-polar, demonstrate weak LiPS adsorption and lack specific nucleation sites, resulting in extensive surface Li2S coverage (Figure 5f,i, SEM image) that severely restricts the charge transfer due to its insulating nature. In contrast, ZnS/CeO2@CNT enables internal 3D Li2S deposition within the electrode’s microporous structure (Figure 5d,g, SEM image), with minimal surface Li2S accumulation. The exceptional performance of ZnS/CeO2@CNT arises from synergistic effects: ZnS/CeO2 provides active polar sites for LiPSs adsorption and conversion, while the CNTs framework ensures uniform dispersion of active components, maintains structural integrity, and enhances electrical conductivity. This unique architecture exposes abundant persistent active sites that continuously adsorb LiPSs and facilitate internal 3D morphological Li2S deposition, while the conductive CNTs network promotes efficient charge transfer throughout the electrode, collectively contributing to the material’s outstanding electrochemical performance [25,26,27]. In addition, we also conducted lean electrolyte condition tests, where the 3D morphology Li2S can be clearly observed on the surface of the electrode (Figure S2).
These experimental results demonstrate that the ZnS/CeO2@CNT composite exhibits excellent catalytic activity, superior polysulfide adsorption capability, and effective induction of 3DI Li2S deposition when employed as the cathode host for LSBs. To further validate its performance superiority, we conducted comprehensive battery performance evaluations. As shown in Figure 6a, the ZnS/CeO2@CNT-based cathode delivers remarkable discharge capacities of 1451.7 mAh g−1 at 0.1C (approaching 86.7% of the theoretical capacity of 1675 mAh g−1), 1288.2 mAh g−1 at 0.2C, 978.16 mAh g−1 at 0.5C, and 855.71 mAh g−1 at 1C. Comparative analysis at 0.2C (Figure 6c) reveals the superior initial capacity of ZnS/CeO2@CNT (1304.31 mAh g−1) over ZnS/CeO2 (1250.36 mAh g−1) and CNT (1097.82 mAh g−1). The long-term cycling stability at 1C (Figure 6d) demonstrates outstanding capacity retention. The ZnS/CeO2@CNT cell maintains 806.07 mAh g−1 after 100 cycles, significantly outperforming ZnS/CeO2 (429.53 mAh g−1) and CNT (550.73 mAh g−1). We also conducted the cyclical stability test under an S loading of 4 mg cm−2, during which the ZnS/CeO2@CNT cell showed an initial capacity at 597.51 mAh g−1, and after 50 cycles, the capacity remained at 565.25 mAh g−1. As for CNT and ZnS/CeO2, the capacity was lower than 450 mAh g−1 (Figure S3). Under high-rate conditions (2C, Figure 6e), the composite achieved an initial capacity of 622.45 mAh g−1 with exceptional cycling stability, retaining 569.55 mAh g−1 after 350 cycles (91.5% capacity retention). Rate capability tests (Figure 6b) highlighted the material’s superior electrochemical stability, as evidenced by the smoother capacity decay profile and remarkable recovery to 1257.24 mAh g−1 when returning to 0.1C after various rate cycles. In contrast, the CNT-based cathode showed significant capacity degradation, dropping from 1212.1 mAh g−1 to 887.41 mAh g−1 under identical testing conditions. This exceptional performance originates from the material’s optimized architecture: the CNT framework creates a microporous sponge-like structure that prevents ZnS/CeO2 agglomeration; uniform dispersion exposes abundant active sites, enhances electrical conductivity and facilitates efficient charge transfer; and the 3D network enables effective polysulfide confinement and promotes favorable Li2S deposition morphology. These synergistic effects collectively contribute to the material’s outstanding electrochemical properties, making ZnS/CeO2@CNT a highly promising cathode host for advanced LSB applications [28,29,30].
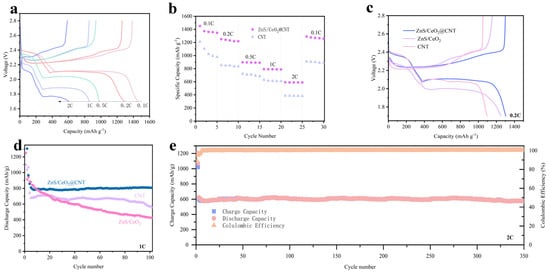
Figure 6.
(a) First charge-discharge curves of ZnS/CeO2@CNT material at different rates; (b) comparison of rate performance between ZnS/CeO2@CNT and CNT materials; (c) First charge-discharge curves of various materials at 0.2C rate, blue for ZnS/CeO2@CNT, purple for ZnS/Ceo2, pink for CNT; (d) discharge cycle performance of various materials at 1C rate, with the first three cycles being activated at 0.2C rate; (e) long-term cycling performance of ZnS/CeO2@CNT material at a high rate of 2C, with the first two cycles being activated at 0.2C.
3. Discussion
This paper introduced a heterostructured catalyst composed of metal oxides and metal sulfides combined with CNTs. The structure of CNTs is utilized to improve the morphology and electrical conductivity of the material, exposing the polar adsorption sites of the material and enabling continuous adsorption of LiPSs. This effectively improves the deposition morphology of Li2S, the impedance of the electrode, and the “shuttle effect” within the battery. The composition of the material was determined to be ZnS/CeO2@CNT through XRD testing. XPS testing further confirmed the composition of the material and the valence states of each element, and it was determined that the composition of the material includes ZnS and CeO2. TEM testing demonstrated the morphology of the material at the microscopic level, further confirming the composition of the material and indicating the formation of a heterostructure between ZnS and CeO2. SEM testing determined the morphology of the material, and EDS testing confirmed the composition and distribution of the elements, showing that ZnS/CeO2 uniformly grows on the CNT structure. CV testing indicated that the experimental material ZnS/CeO2@CNT has strong catalytic ability. The calculation of the lithium-ion diffusion coefficient revealed that the ZnS/CeO2@CNT material promotes the transmission of lithium ions. EIS testing showed that the ZnS/CeO2@CNT material has lower impedance. The chronoamperometry tests demonstrated that ZnS/CeO2@CNT material can form a 3D morphology of Li2S deposition, significantly enhancing the cycling performance of the battery. Through a series of battery performance tests, it was found that the ZnS/CeO2@CNT material can release a high capacity and has strong cycling stability. At a rate of 0.1C, the discharge capacity reached 1451.7 mAh g−1, which is 86.66% of the theoretical capacity of lithium–sulfur batteries (1675 mAh g−1). At a high rate of 2C, the first cycle capacity reached 622.45 mAh g−1, and after 350 cycles, it still maintained a capacity of 569.5 mAh g−1. This paper provides a new idea for the design of cathode electrodes in lithium–sulfur batteries.
4. Materials and Methods
Material synthesis: Firstly, carbon nanotubes (CNT) were placed in a solution with a volume ratio of 1:3 of concentrated sulfuric acid/concentrated nitric acid, and then subjected to 6 h of acid pickling treatment at 80 °C in an oil bath. After pickling and oxidation, the material was washed three times with alcohol and water, respectively, and then placed in an oven for 60 °C for a 12 h drying treatment to obtain CNT-COOH materials with more active sites on the surface.
Then, 0.1 mg of the dried CNT-COOH material was taken and placed in 40 mL of methanol solution for ultrasound treatment until the CNT-COOH material was evenly distributed in the solution (during which methanol solution can be added, if necessary). While stirring the resulting solution on a magnetic stirrer, 0.6 mmol of cerium nitrate and zinc nitrate were added to the solution, and stirred for 2 h to obtain Solution A. Subsequently, 2.4 mmol of 2-Methylimidazole was dissolved in 10 mL of methanol solution to obtain Solution B. Solution A and Solution B were mixed and further stirred for 1 h, and then the solution was transferred to a hydrothermal reactor and reacted at 120 °C for 120 min. After the reaction was completed, the hydrothermal product was centrifuged, washed, and then placed in an oven for 12 h of drying treatment at 60 °C to obtain the precursor. The obtained precursor was mixed with sublimated sulfur in a mass ratio of 1:1 and then subjected to a ball milling treatment for 12 h. After ball milling, the mixed material was transferred to a tube furnace, with nitrogen as the protective gas. The temperature was raised with a heating rate of 3 °C/min to 155 °C and maintained for 2 h, and then further raised to 600 °C with the same heating rate and maintained for another 2 h. After the tube furnace cooled to room temperature, the experimental material ZnS/CeO2@CNT was obtained. The control material ZnS/CeO2 was synthesized in a similar way, without adding CNT. Before being used as the host material for the positive active substance, all materials were washed with a diluted solution of Triton X-100 with a concentration of 1/60 to match the LA binder [31].
Battery assembly: Firstly, the experimental material ZnS/CeO2@CNT was ground with sublimated sulfur in a mass ratio of 1:3 for half an hour, and then thermally treated in a muffle furnace at 155 °C for 6 h to obtain sulfur-coated material. The sulfur-coated material was mixed with conductive agent (Super P) and binder (LA) in a mass ratio of 7:2:1, and appropriate amounts of water and alcohol were added to obtain a mixed slurry. The mixed slurry was then milled for 8 h to obtain a sulfur cathode slurry. Subsequently, the obtained sulfur cathode slurry was evenly coated on a circular aluminum foil with a diameter of 16 mm that had been roughened using a coating machine. After being vacuum-dried at 60 °C for 12 h, the positive electrode plate used in the experiment was obtained. The battery assembly was performed in a glove box in the following order: positive electrode shell, positive electrode plate, separator, electrolyte, lithium sheet, and negative electrode shell. The electrolyte used was a 0.5 M LiCF3SO3 salt dissolved in a solvent of 1,3-dioxolane and diglyme with a volume ratio of 1:1, and contained an additive of 0.5 M LiNO3 [32].
Li2S deposition test: Firstly, Li2S and sublimated sulfur were mixed in a molar ratio of 1:7. Then, 1 M bis(trifluoromethanesulfonyl)imide lithium salt (LITFSI) was added to DOL/DME (1:1) solution. The mixture was stirred at 50 °C for 12 h to prepare the 0.5 M Li2S8 positive electrolyte. Carbon paper was used as the current collector, and ZnS/CeO2@CNT and ZnS/CeO2 slurry were mad separately using the aforementioned methode. After grinding for 12 h, they were applied to the carbon paper. After drying, the positive electrode sheet with a load of about 2.5 mg cm−2 was obtained. Using CR2016 as the battery case, the lithium sheet as the negative electrode, and Celgard 2400 as the separator, the battery was assembled. Then, 25 μL of the 0.5 mL Li2S8 positive electrolyte was added on the positive side, and 25 μL of conventional electrolyte was added on the lithium negative side to prepare the battery for the deposition experiments. Firstly, the battery was discharged continuously to 2.10 V at a current of 0.134 mA in the test system, and then a constant potential discharge at 2.05 V was performed. The cut-off condition was set as a current less than 0.01 mA [33].
Electrochemical measurements: The normal condition for cell tests were 2 mg cm−2, and the E/S ratio was 15 μL/mg. As for the CV tests, the areal mass loading of the electrode was controlled around 1 mg cm−2, while the E/S ratio was 15 μL/mg for the ZnS/CeO2 cell, and 1 mg cm−2 15 μL/mg for both the ZnS/CeO2@CNT cell and CNT cell. For the lean electrolyte test, the mass loading of S was 4 mg cm−2, and the E/S ratio was 5 μL/mg. Galvanostatic charge and discharge tests were conducted on Neware BT-5 within a potential range from 1.7 to 2.8 V. The specific capacity was calculated based on the weight of sulfur in each cell (1 C = 1673 mA g−1). Cyclic voltammetry (CV) and electrochemical impedance spectroscopy (EIS) tests were performed on electrochemical workstations (DONGHUA DH7000C) at room temperature.
Supplementary Materials
The following supporting information can be downloaded at https://www.mdpi.com/article/10.3390/inorganics13060181/s1. Figure S1: EDS spectrum of ZnS/CeO2; Figure S2: SEM of post-cycle ZnS/CeO2@CNT electrode under lean electrolyte condition; Figure S3: high-mass S loading (4 mg) long-term cycling performance under 1C.
Author Contributions
Conceptualization, D.-R.D. and Q.-H.W.; methodology, Y.-L.L.; software, H.H.; validation, Y.-L.L., H.H., W.-Q.L. and C.-W.Z.; formal analysis, Y.-L.L.; investigation, Y.-L.L.; resources, D.-R.D.; data curation, Y.-L.L.; writing—original draft preparation, Y.-L.L.; writing—review and editing, Q.-H.W.; visualization, Y.Z.; supervision, Q.-H.W.; project administration, G.-F.L. and X.-H.F.; funding acquisition, D.-R.D. and Q.-H.W. All authors have read and agreed to the published version of the manuscript.
Funding
This work was financially supported by NSFC (22379051, 22172062) and the Natural Science Foundation of Fujian Province (2024J09043).
Institutional Review Board Statement
Not applicable.
Informed Consent Statement
Not applicable.
Data Availability Statement
The original contributions presented in this study are included in the article/supplementary material. Further inquiries can be directed to the corresponding authors.
Conflicts of Interest
The authors declare no conflicts of interest.
References
- Wang, J.; He, Y.S.; Yang, J. Sulfur-based composite cathode materials for high-energy rechargeable lithium batteries. Adv. Mater. 2015, 27, 569–575. [Google Scholar] [CrossRef] [PubMed]
- She, Z.W.; Sun, Y.; Zhang, Q. Designing high-energy lithium–sulfur batteries. Chem. Soc. Rev. 2016, 45, 5605–5634. [Google Scholar]
- Chen, X.; Hou, T.; Persson, K.A. Combining theory and experiment in lithium–sulfur batteries: Current progress and future perspectives. Mater. Today 2019, 22, 142–158. [Google Scholar] [CrossRef]
- Xue, W.; Shi, Z.; Suo, L.; Wang, C. Intercalation-conversion hybrid cathodes enabling Li–S full-cell architectures with jointly superior gravimetric and volumetric energy densities. Nat. Energy 2019, 4, 374–382. [Google Scholar] [CrossRef]
- Lv, D.; Zheng, J.; Li, Q.; Ferrara, S.; Nie, Z.; Mehdi, L.B. High energy density lithium–sulfur batteries: Challenges of thick sulfur cathodes. Adv. Energy Mater. 2015, 5, 1402290. [Google Scholar] [CrossRef]
- Du, Z.; Chen, X.; Hu, W.; Chuang, C.; Hu, A.; Yan, W. Cobalt in nitrogen-doped graphene as single-atom catalyst for high-sulfur content lithium–sulfur batteries. J. Am. Chem. Soc. 2019, 14, 3977–3985. [Google Scholar] [CrossRef]
- Li, X.Y.; Feng, S.; Zhao, C.X. Regulating lithium salt to inhibit surface gelation on an electrocatalyst for high-energy-density lithium–sulfur batteries. J. Am. Chem. Soc. 2022, 144, 14638–14646. [Google Scholar] [CrossRef]
- Cheng, Q.; Chen, Z.X.; Li, X.Y.; Hou, L.P.; Bi, C.X.; Zhang, X.Q. Constructing a 700 Wh kg−1-level rechargeable lithium-sulfur pouch cell. J. Energy Chem. 2023, 76, 181–186. [Google Scholar] [CrossRef]
- Li, W.; Wang, P.F.; Zhang, M.H.; Pan, H.; He, X.; He, P.; Zhou, H. Functional CNTs@EMIM+-Br− Electrode Enabling Polysulfides Confining and Deposition Regulating for Solid-State Li-Sulfur Battery. Small 2023, 19, 2205809. [Google Scholar] [CrossRef]
- Scharifker, B.; Rugeles, R.; Mozota, J. Electrocrystallization of copper sulphide (CU2S) on copper. Electrochim. Acta 1984, 29, 261–266. [Google Scholar] [CrossRef]
- Ye, X.; Wu, F.; Xue, Z. Accelerated Polysulfide Conversion by Rationally Designed NiS2-CoS2 Heterostructure in Lithium–Sulfur Batteries. Adv. Funct. Mater. 2024, 35, 2417776. [Google Scholar] [CrossRef]
- Wang, Z.; Huang, W.; Wu, H.; Wu, Y.; Shi, K. 3d-Orbital High-Spin Configuration Driven From Electronic Modulation of Fe3O4/FeP Heterostructures Empowering Efficient Electrocatalyst for Lithium– Sulfur Batteries. Adv. Funct. Mater. 2024, 34, 2409303. [Google Scholar] [CrossRef]
- Zhu, J.; Liang, F.; Lin, C.; He, H. Optimizing Electron Modulation Induced by the Interfacial Coupling in Cu3P-Cu2O Heterostructures to Enhance Polysulfide Conversion. Adv. Funct. Mater. 2025, 2425945. [Google Scholar] [CrossRef]
- Xiao, X.; Wang, H.; Urbankowski, P.; Gogotsi, Y. Topochemical synthesis of 2D materials. Chem. Soc. Rev. 2018, 47, 8744–8765. [Google Scholar] [CrossRef]
- Song, Y.; Zhao, W.; Kong, L. Synchronous immobilization and conversion of polysulfides on a VO2–VN binary host targeting high sulfur load Li–S batteries. Energy Environ. Sci. 2018, 11, 2620–2630. [Google Scholar] [CrossRef]
- Yang, W.; Xiao, J.; Ma, Y. Tin intercalated ultrathin MoO3 nanoribbons for advanced lithium–sulfur batteries. Adv. Energy Mater. 2019, 9, 1803137. [Google Scholar] [CrossRef]
- Liu, R.; Cheng, H.; Tai, W. MOF-Enhanced Sulfur-Containing Polymer for Boosting Lithium-Ion Diffusion in Lithium–Sulfur Battery. ACS Sustain. Chem. Eng. 2025, 13, 4108–4119. [Google Scholar] [CrossRef]
- Yi, Y.; Hai, F.; Guo, J. Electrochemical Enhancement of Lithium-Ion Diffusion in Polypyrrole-Modified Sulfurized Polyacrylonitrile Nanotubes for Solid-to-Solid Free-Standing Lithium–Sulfur Cathodes. Small 2023, 19, 2303781. [Google Scholar] [CrossRef]
- Wu, C.C.; Ho, Y.C.; Chung, S.H. A low-self-discharge high-loading polysulfide cathode design for lithium–sulfur cells. J. Mater. Chem. A 2023, 11, 24651–24660. [Google Scholar] [CrossRef]
- Deng, D.R.; Xue, F.; Jia, Y.J. Co4N nanosheet assembled mesoporous sphere as a matrix for ultrahigh sulfur content lithium–sulfur batteries. ACS Nano 2017, 11, 6031–6039. [Google Scholar] [CrossRef]
- Fan, C.Y.; Zheng, Y.P.; Zhang, X.H.; Shi, Y.H.; Liu, S.Y.; Wang, H.C.; Wu, X.L.; Sun, H.Z.; Zhang, J.P. High-performance and lowtemperature lithium–sulfur batteries: Synergism of thermodynamic and kinetic regulation. Adv. Energy Mater. 2018, 8, 1703638. [Google Scholar] [CrossRef]
- Deng, D.R.; Xiong, H.J.; Luo, Y.L. Accelerating the Rate-Determining Steps of Sulfur Conversion Reaction for Lithium-Sulfur Batteries Working at an Ultrawide Temperature Range. Adv. Mater. 2024, 36, 2406135. [Google Scholar] [CrossRef] [PubMed]
- Lu, X.; Zhang, Q.; Wang, J. Highperformance bimetal sulfides for lithium-sulfur batteries. Chem. Eng. J. 2019, 358, 955–961. [Google Scholar] [CrossRef]
- Sun, J.; Liu, Y.; Liu, L. Interface engineering toward expedited Li2S deposition in lithium–sulfur batteries: A critical review. Adv. Mater. 2023, 35, 2211168. [Google Scholar] [CrossRef]
- Xiong, H.J.; Luo, Y.L.; Deng, D.R. In-situ synthesis Fe3C@C/rGO as matrix for high performance lithium-sulfur batteries at room and low temperatures. J. Colloid Interface Sci. 2024, 668, 448–458. [Google Scholar] [CrossRef]
- Deng, D.R.; Yuan, R.M.; Yu, P.K. An Enhanced Electrode via Coupling with a Conducting Molecule to Extend Interfacial Reactions (Adv. Energy Mater. 33/2021). Adv. Energy Mater. 2021, 11, 2101156. [Google Scholar] [CrossRef]
- Deng, D.R.; Cui, X.Y.; Fan, X.X. Integration of adsorption and catalytic active sites in cobalt iron oxide nanorods for an excellent performance Li–S battery with a wide temperature range. Sustain. Energy Fuels 2021, 5, 4284–4288. [Google Scholar] [CrossRef]
- Wei, Z.; Ren, Y.; Sokolowski, J.; Zhu, X.; Wu, G. Mechanistic Understanding of the Role Separators Playing in Advanced LithiumSulfur Batteries. InfoMat 2020, 2, 483–508. [Google Scholar] [CrossRef]
- Zhang, Y.; Zhang, P.; Zhang, S.; Wang, Z.; Li, N.; Silva, S.R.P.; Shao, G. A Flexible Metallic TiC Nanofiber/Vertical Graphene 1D/ 2D Heterostructured as Active Electrocatalyst for Advanced Li-S Batteries. InfoMat 2021, 3, 790–803. [Google Scholar] [CrossRef]
- Li, R.; Peng, H.; Wu, Q. Sandwich-like catalyst–carbon–catalyst trilayer structure as a compact 2D host for highly stable lithium–sulfur batteries. Angew. Chem. Int. Ed. 2020, 59, 12129–12138. [Google Scholar] [CrossRef]
- Xiong, H.-J.; Deng, D.-R.; Luo, Y.-L.; Song, J.-X.; Yan, J.-W.; Cai, S.-L.; Liang, J.; Zhu, C.-W.; Zeng, Y.; Li, G.-F.; et al. Overcoming the Low—Temperature Barrier: Controlling Li2S Deposition and Enhancing Catalysis in Lithium—Sulfur Batteries Using Island—Like Bi2O3 on rGO. Adv. Sci. 2025, 2502045. [Google Scholar] [CrossRef] [PubMed]
- Zhao, M.; Li, B.Q.; Peng, H.J.; Yuan, H.; Wei, J.Y.; Huang, J.Q. Lithium-Sulfur Batteries under Lean Electrolyte Conditions: Challenges and Opportunities. Angew. Chem. Int. Ed. 2020, 59, 12636–12652. [Google Scholar] [CrossRef] [PubMed]
- Yang, J.L.; Cai, D.Q.; Hao, X.G.; Huang, L.; Lin, Q.; Zeng, X.T.; Zhao, S.X.; Lv, W. Rich heterointerfaces enabling rapid polysulfides conversion and regulated Li2S deposition for high-performance lithium–sulfur batteries. ACS Nano 2021, 15, 11491–11500. [Google Scholar] [CrossRef] [PubMed]
Disclaimer/Publisher’s Note: The statements, opinions and data contained in all publications are solely those of the individual author(s) and contributor(s) and not of MDPI and/or the editor(s). MDPI and/or the editor(s) disclaim responsibility for any injury to people or property resulting from any ideas, methods, instructions or products referred to in the content. |
© 2025 by the authors. Licensee MDPI, Basel, Switzerland. This article is an open access article distributed under the terms and conditions of the Creative Commons Attribution (CC BY) license (https://creativecommons.org/licenses/by/4.0/).