Article

Sulfophosphate Glass Doped with Er3+ and TiO2 Nanoparticles: Thermo-Optical Characterization by Photothermal Spectroscopy

1
Optics Lab, The Abdus Salam International Centre for Theoretical Physics, 34151 Trieste, Italy
2
Research Institute for Applied Physics and Astronomy, University of Tabriz, Tabriz 51665-163, Iran
3
School of Electrical, Electronic and Computer Engineering, University of Western Australia, Crawley, WA 6009, Australia
*
Author to whom correspondence should be addressed.
Photonics 2021, 8(4), 115; https://doi.org/10.3390/photonics8040115
Submission received: 24 February 2021 / Revised: 28 March 2021 / Accepted: 6 April 2021 / Published: 8 April 2021
(This article belongs to the Special Issue Photonics, Optics and Laser Technology)

Abstract

:
In this work, time-resolved thermal lens and beam deflection methods were applied to determine the thermo-optical properties of Er3+ doped sulfophosphate glass in which different concentrations of Titanium dioxide (TiO2) nanoparticles (NPs) were embedded. Thermal diffusivity ( D ), thermal conductivity ( κ ), and the temperature coefficient of the optical path length ( d s / d T ) were determined as a function of NPs concentrations. Moreover, the growth of TiO2 NPs inside the amorphous glass matrix was evidenced by Transmission Electron Microscopy (TEM) images as well as through optical effects such as refractive index change of the glass. The outcomes indicated relatively high values for D and κ as well as a low d s / d T as required for most optical components used for laser media. The addition of TiO2 NPs with concentration of dopants up to 0.6 mol% improved the optical properties of the glass samples but did not affect its thermal properties. The results indicate that the enhanced optical and thermal performance of the proposed co-doped glass fits the quality standards for materials used in photonic devices.

1. Introduction

Phosphate based glasses doped with Lanthanide ions (Ln3+) have attracted great interest due to their thermo-optical properties and applicability in the development of photonics devices. These luminescent materials have been used for active media of solid-state lasers, LEDs, solar cells, and other photonics devices [1,2,3,4]. Among them, Erbium ion (Er3+)-doped glasses have been investigated for a wide range of applications including infrared and green solid-state lasers, broadband optical sources, and optical amplifiers [5,6]. Furthermore, Er3+ is a promising candidate for the frequency up-conversion due to its equally spaced long-lived excited states [7,8].
However, the design of optical devices needs quality control over all the physical processes which can affect its behaviour. In particular, the processes related to the nonradiative transitions are emphasized, because they can increase the heat deposited on the material and produce concentration quenching which reduces the inversion density, manifested by a rapid reduction of the fluorescence lifetime and luminescence quantum efficiency [9]. In the case of rare earth ion doping with high concentrations, non-radiative mechanisms of the energy transfer process reduce the lifetime of absorbed light in glass [10,11,12]. It can cause a narrowing of the absorption and emission band of the glass and consequently a luminescence quenching that can limit the use of rare earth ion-doped glasses in photonic applications [13].
Different routes are suggested to overcome the concentration quenching. Embedding metal or semiconductor nanoparticles in different rare earth ion-doped glasses could be offered as an approach to overcome the limitations related to the narrow optical band of rare earth ions at high concentration [14,15]. Over decades, several research efforts have been dedicated for determining the effects of noble metal NPs (Ag and Au) and TiO2 semiconductor on the emission of various rare earth ions [16,17,18,19,20,21,22,23]. All these studies suggested that the metal NPs and TiO2 semiconductors enabled intense local fields in the proximity of the Ln3+s. The subsequent energy transfer between them inside varied glass hosts improved the photoluminescence properties.
As mentioned, the optical properties of the glass materials may be accordingly engineered through the presence of nanoparticles to design a more efficient device. Co-doping with nanostructures has been comprehensively investigated to enhance the luminescent emission of rare earth ion-doped glass matrices [17,18,19]. Besides efficient optical and spectroscopic properties, thermal properties of the composite glass, including thermal conductivity ( κ ), thermal diffusivity ( D ) and and the temperature coefficient of the optical path length ( d s / d T ), may be also modified by NPs co-doping with Ln3+ ions [24,25,26].
Consequently, the measurement of the thermo-optical properties is of utmost importance given that laser-matter interaction results in thermal loading due to the nonradiative transitions which can increase the heat deposited on the material. This, in turn, produces a degradation of material performance. Efficient heat removal and the reduction of the thermal effects that are caused by the temperature gradients across the lasing material are obtainable by increasing the thermal diffusivity and conductivity. In addition, the temperature gradients set up in the material as a result of nonradiative relaxations can produce stress fractures, thus establishing the ultimate limit in average power attainable from the photonic material. Additional effects such as thermal lensing and birefringence adversely affect the beam quality [27]. The characterization of the thermo-optical properties of a material, therefore, is especially important for the optimization of photonic applications such as in high-power lasers, where unwanted thermal effects can cause extreme disruptions in laser action [27].
Because of its high sensitivity, photothermal spectrometry has been extensively used for characterization of a variety of samples [26,27,28,29,30,31]. In the past few years, thermal lens spectroscopy (TLS) as well as beam deflection spectroscopy (BDS) have been applied to evaluate the thermo-optical properties of transparent and opaque materials, including optical glasses [28,29,30].
In this work, the thermo-optical properties of sulfophosphate glass doped with 1mol% Er3+ as a function of the TiO2 concentrations were studied. The thermo-optical properties of the samples were investigated using TLS and BDS techniques. Additional information was obtained by using thermal analysis (DTA), transmission electron microscopy (TEM), and UV-vis spectroscopy.

2. Theory

According to the TL model approach, developed by Shen et al. [31], the TLS signal S(z,t) is defined as the relative change of the light transmission T(z,t) through a small aperture in the presence of the excitation beam and T(0) is its initial value when the excitation beam is off:
S z , t   =   T z , t     T ( 0 ) T ( 0 )
In the situation of a small phase shift (<<0.2) and small aperture radius (<1 mm), the signal can be written as [31]:
S z , t   =   Θ tan 1 4 m ( z ) ν ( z ) t / t c ( z ) 1   +   2 m z   +   ν z 2 2 t / t c z   +   1   +   2 m z 2   +   ν ( z ) 2 ,
where tc is the characteristic time of TL t c   =   ω 0 e 2 / 4 D , and Θ is given by
Θ   =   P e α l λ p κ φ ds dT
In this equation, Pe represents the total excitation light power at the sample, α, d s / d T , and φ are the sample’s absorption coefficient, the temperature coefficient of the optical path, and the non-radiative quantum efficient, respectively. For non-fluorescent samples φ   =   1 and for luminescent samples it is <1.
Parameters κ and D are related through the density and heat capacity,
κ   =   ρ c   . D
The parameter m   =   ω p / ω e 2 indicates the mode-mismatching between the radii of excitation and probe beams and ν(z) is the geometrical factor defined as follows:
ν ( z )   =   z     a p z p   +   z p L     z 1   +   z     a p 2 z p 2 ,
where z is the position of the sample concerning the excitation beam waist. L is the distance from the sample to the detector, a p , z p and λ p are the waist positions, Rayleigh parameter, and wavelength of the probe beam, respectively.
For the particular configuration of well-focused excitation beam and highly collimated probe beam the TL signal, under steady-state condition, reaches its maximum value and the Equation (2) can be expressed by [32]:
S max   =   π 2 Θ .

3. Experimental Part

3.1. Preparation of the Samples

Seven sulfophosphate glass samples coded by PMZExTiO2 with the composition of (60-x) P2O5-20MgO-20ZnSO4.7H2O-1Er2O3- xTiO2 were synthesized by the melt quenching method. Where xTiO2 nanoparticles (x = 0.0, 0.1, 0.2, 0.3, 0.4, 0.5 and 0.6 mol %) were added to the nominal composition and co-doped with the 1mol% rare earth ion Er2O3. The raw powders were first mixed and then were melted in a crucible at 1200 °C for one hour and then were annealed at 300 °C for 3 h. The synthesized glasses were cut and polished for characterization and optical measurements. The energy dispersive X-ray (EDX) spectrum of the glass sample PMZ0.5Er is shown in Figure 1. It indicates the presence of all the elements in the host glass matrix.

3.2. Methodology

The presence of TiO2 NPs inside the glass matrix was demonstrated by operating a Zeiss LEO906 TEM imaging system. To enhance TEM imaging the well-powdered sample was dispersed in methanol using an ultrasonic bath for 15 min. ImageJ software was used to obtain the size distribution of the TiO2 NPs.
The thermal analysis of the prepared glasses was performed using a Pyris Diamond (TG-DTA, Japan) with a rate of 10 °C/min. The samples were heated from room temperature to 900 °C under a N2 atmosphere with a rate of flow of 20 mL/min. UV-Vis-NIR absorption spectra were measured in a range from 330 nm to 1100 nm using a scanning spectrophotometer (model Shimadzu UV-3101 PC). The optical band gap energy was obtained through Tauc’s plots for direct E o p t d i r and indirect E o p t i n d i r transitions using the optical absorption spectra [33]. The refractive indices (n) of the samples were calculated using Dimitrov and Sakka expression [34].
Glass mass density, ρ   g . c m 3 was determined through the Archimedes method using toluene as an immersed medium, where the density of toluene is ρ = 0.8669 g.cm−3. All measurements were performed at room temperature.
For TL measurement we first measure the TLS signal amplitude, followed by the fitting of the corresponding amplitude as a function of time using Equation (2). In the fitting process, Θ and D are considered as adjustable parameters. Utilizing the fitted value of D , we can calculate κ of the measured sample using Equation (4) and the measured glass mass density. Moreover, to determine d s / d T , the maximum TL signal S m a x is first measured for different excitation powers, and then the phase amplitude Θ is calculated using Equation (6). Equation (3) can be normalized with the absorbed power of the excitation beam as follows:
Θ P abs   =   C φ   ,   C   =   1 λ p κ ds dT  
The excitation power absorbed by the sample P a b s   =   P e α l can be obtained directly using the Beer law P a b s   =   P e 1 e x p α l . Finally, by linear fitting of the obtained phase shift versus the absorbed pump power, the slope C is measured from which d s / d T can be obtained.

3.3. Photothermal Spectroscopy Setups

The experimental setup used for TL measurement is shown schematically in Figure 2. The excitation laser (MGL-III-532-100, UltraLasers) emits at 532 nm wavelength and is modulated at 2 Hz using a signal generator (RIGOL DG1022, RIGOL Technologies, Inc., Beaverton, OR 97008, USA). Its output power is regulated by the neutral density filter (NDF) (NDC 50S-3, Thorlabs). The beam is collimated and then focused into a spot of 30 µm diameter in the sample by a set of lenses L3, L4, L5 with 30 mm, 100 mm, 150 mm focal lengths (LB1757-A, LB1676-A, LB1437-A, Thorlabs), respectively. The TL effect is probed by a He-Ne laser (632.8 nm, 3 mW, 05-UR-111, Melles Griot) beam which was collimated to a size of 4 mm in diameter by a set of lenses L1 and L2 with 40 mm and 150 mm focal lengths (LB1757-A, LB1437-A, Thorlabs, respectively). Both beams are directed collinearly through the sample using a set of turning mirrors M1, M2, M3 (BB1-E02, Thorlabs) and a dichroic mirror DM (DMSP605, Thorlabs). The probe beam intensity changes resulting from the TL effect are detected by the Si detector (PDA 36A-EC, Thorlabs) equipped with a 0.5 mm diameter pinhole. The TL signal is recorded directly using a digital oscilloscope (RIGOL DS1102E, RIGOL Technologies, Inc.).
The experimental setup used for BDS is shown schematically in Figure 3. The excitation laser (MGL-III-532-100, UltraLasers) emits at 532 nm wavelength and is modulated at 13 Hz by a signal generator (RIGOL DG1022, RIGOL Technologies, Inc.). The examined sample is illuminated by the intensity-modulated light beam with 50 mW output power which is directed by the turning mirror (M) BB1-E02, Thorlabs) to impinge on the sample perpendicularly to its surface. The beam is collimated and then focused onto a spot of 30 µm diameter in the sample by a set of lenses L4, L5, L6 with 40 mm, 100 mm, 150 mm focal lengths (LB1757-A, LB1676-A, LB1757-A, Thorlabs), respectively. The lens L6 and the mirror M are placed on an XYZ translation stage to move the excitation beam in the y-direction with a 12.5 µm step. The sample is also placed on a 3D translation stage (Thorlabs) to vary its position in x, y, and z-direction and to optimize the experimental configuration. The absorbed energy induces temperature oscillations inside the sample as well as in its surroundings, which are probed by a second laser (He-Ne, 3 mW, 05-UR-111, Melles Griot) emitting at 632.8 nm. This beam is collimated and then focused into a spot of 30 µm diameter over the sample by a set of lenses L1, L2, L3 with 40 mm, 100 mm, 150 mm focal lengths (LB1757-A, LB1676-A, LB1757-A, Thorlabs), respectively. The interaction of the probe beam with the temperature oscillations over the sample results in probe beam deflections, which are detected by a quadrant photodiode (QP) (PDQ80A, Thorlabs) equipped with an interference filter (IF) (632.8 nm CWL, Thorlabs) and connected to the lock-in amplifier (Stanford Research System, Model SR5 10). To optimize the experimental set-up the probe beam is carefully aligned close to the sample surface, just to skim it. There is a linear relation between the phase of the transverse component of the perpendicular deflection and the pump to probe offset y at a given frequency f. D can be calculated from the slope m   =   π f / D [35].

4. Results and Discussion

4.1. Transmission Electron Microscopy (TEM)

TEM imaging was used to confirm the presence of the TiO2 NPs doped in the glass matrix. Figure 4 shows the TEM image of a PMZE0.6T glass sample which reveals the presence of spherical TiO2 NPs. ImageJ software was used to obtain the TiO2 NPs size distribution from the TEM image. The histogram of the size distribution which is presented in the inset of the Figure 4 was fitted with the well-known Gaussian function. The majority of size values are between ~20 to 50 nm in diameter, but there are some NPs also observed with diameters between 60 to 70 nm.

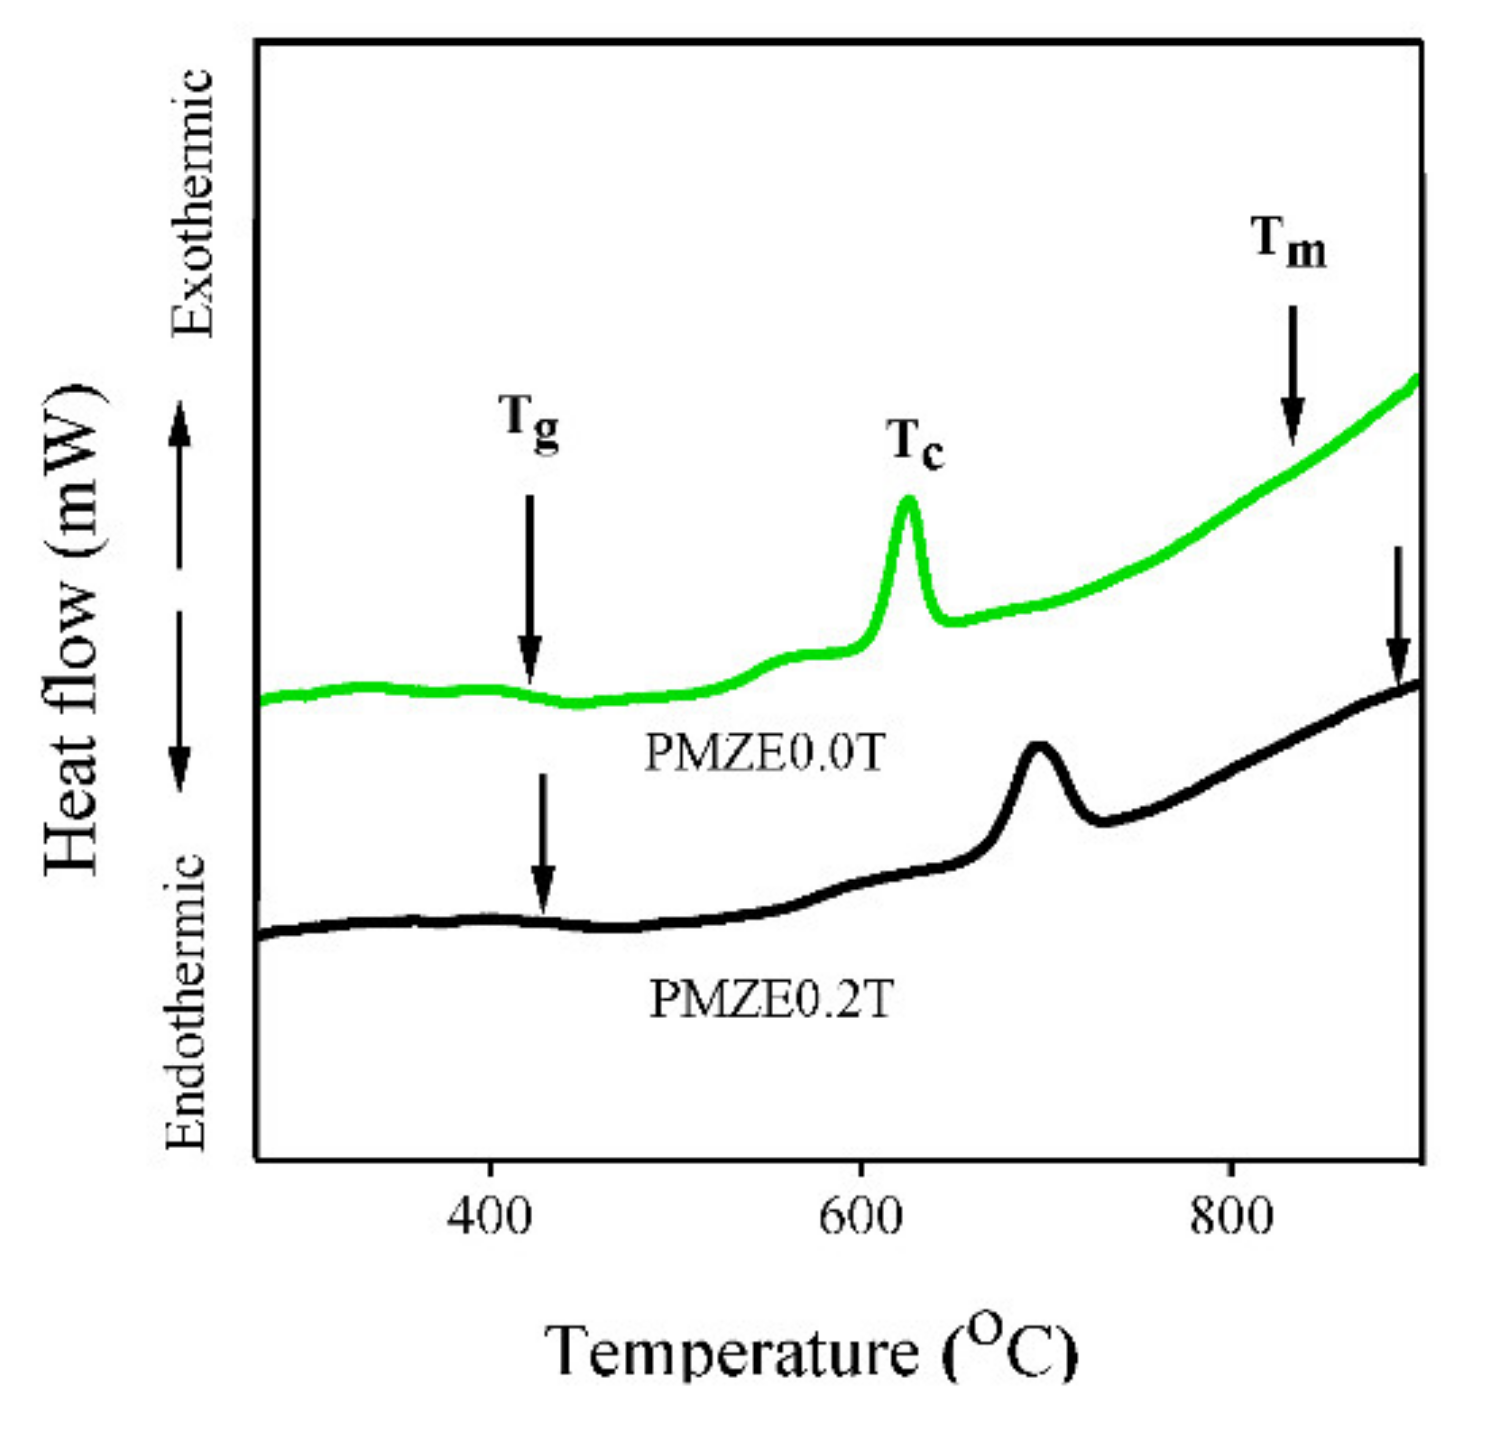
4.2. Thermal Characterization

Figure 5 shows the DTA curve of the studied glasses which compares the glass transition, the crystallization, and the melting temperatures in the presence of TiO2 NPs and without NPs. The observation of a broad endothermic hump corresponds to the glass transition temperature (Tg), the exothermic peak is assigned to the crystallization temperature (Tc), and the other endothermic peak is attributed to the melting temperature (Tm). Previous studies showed that the growth of NPs happens when the glass viscosity attains values sufficient to promote the diffusion of NPs [36,37]. If the annealing temperature is higher than the glass transition temperature, the crystallization may happen during heat treatment. In this study, the temperature of annealing is less than the glass transition temperature (>400 °C) so crystallization does not occur as has been shown by X-Ray Diffraction (XRD) patterns [19].
The results demonstrate that the introduction of TiO2 NPs causes an increase in the temperature of Tg, Tc, and Tm. For instance, Tg was obtained at around 405 °C and 418 °C for glass sample without TiO2 NPs (PMZE0.0T) and glass sample containing 0.2 mol% TiO2 NPs (PMZE0.2T), respectively. In this manner, Tc increased from 625 °C to 696 °C and Tm increased from 840 °C to 898 °C for the sample containing TiO2 NPs. Moreover, the difference between crystallization and transition temperature (Tc − Tg) is 220 °C and 278 °C for glass samples with and without TiO2 NPs, respectively.

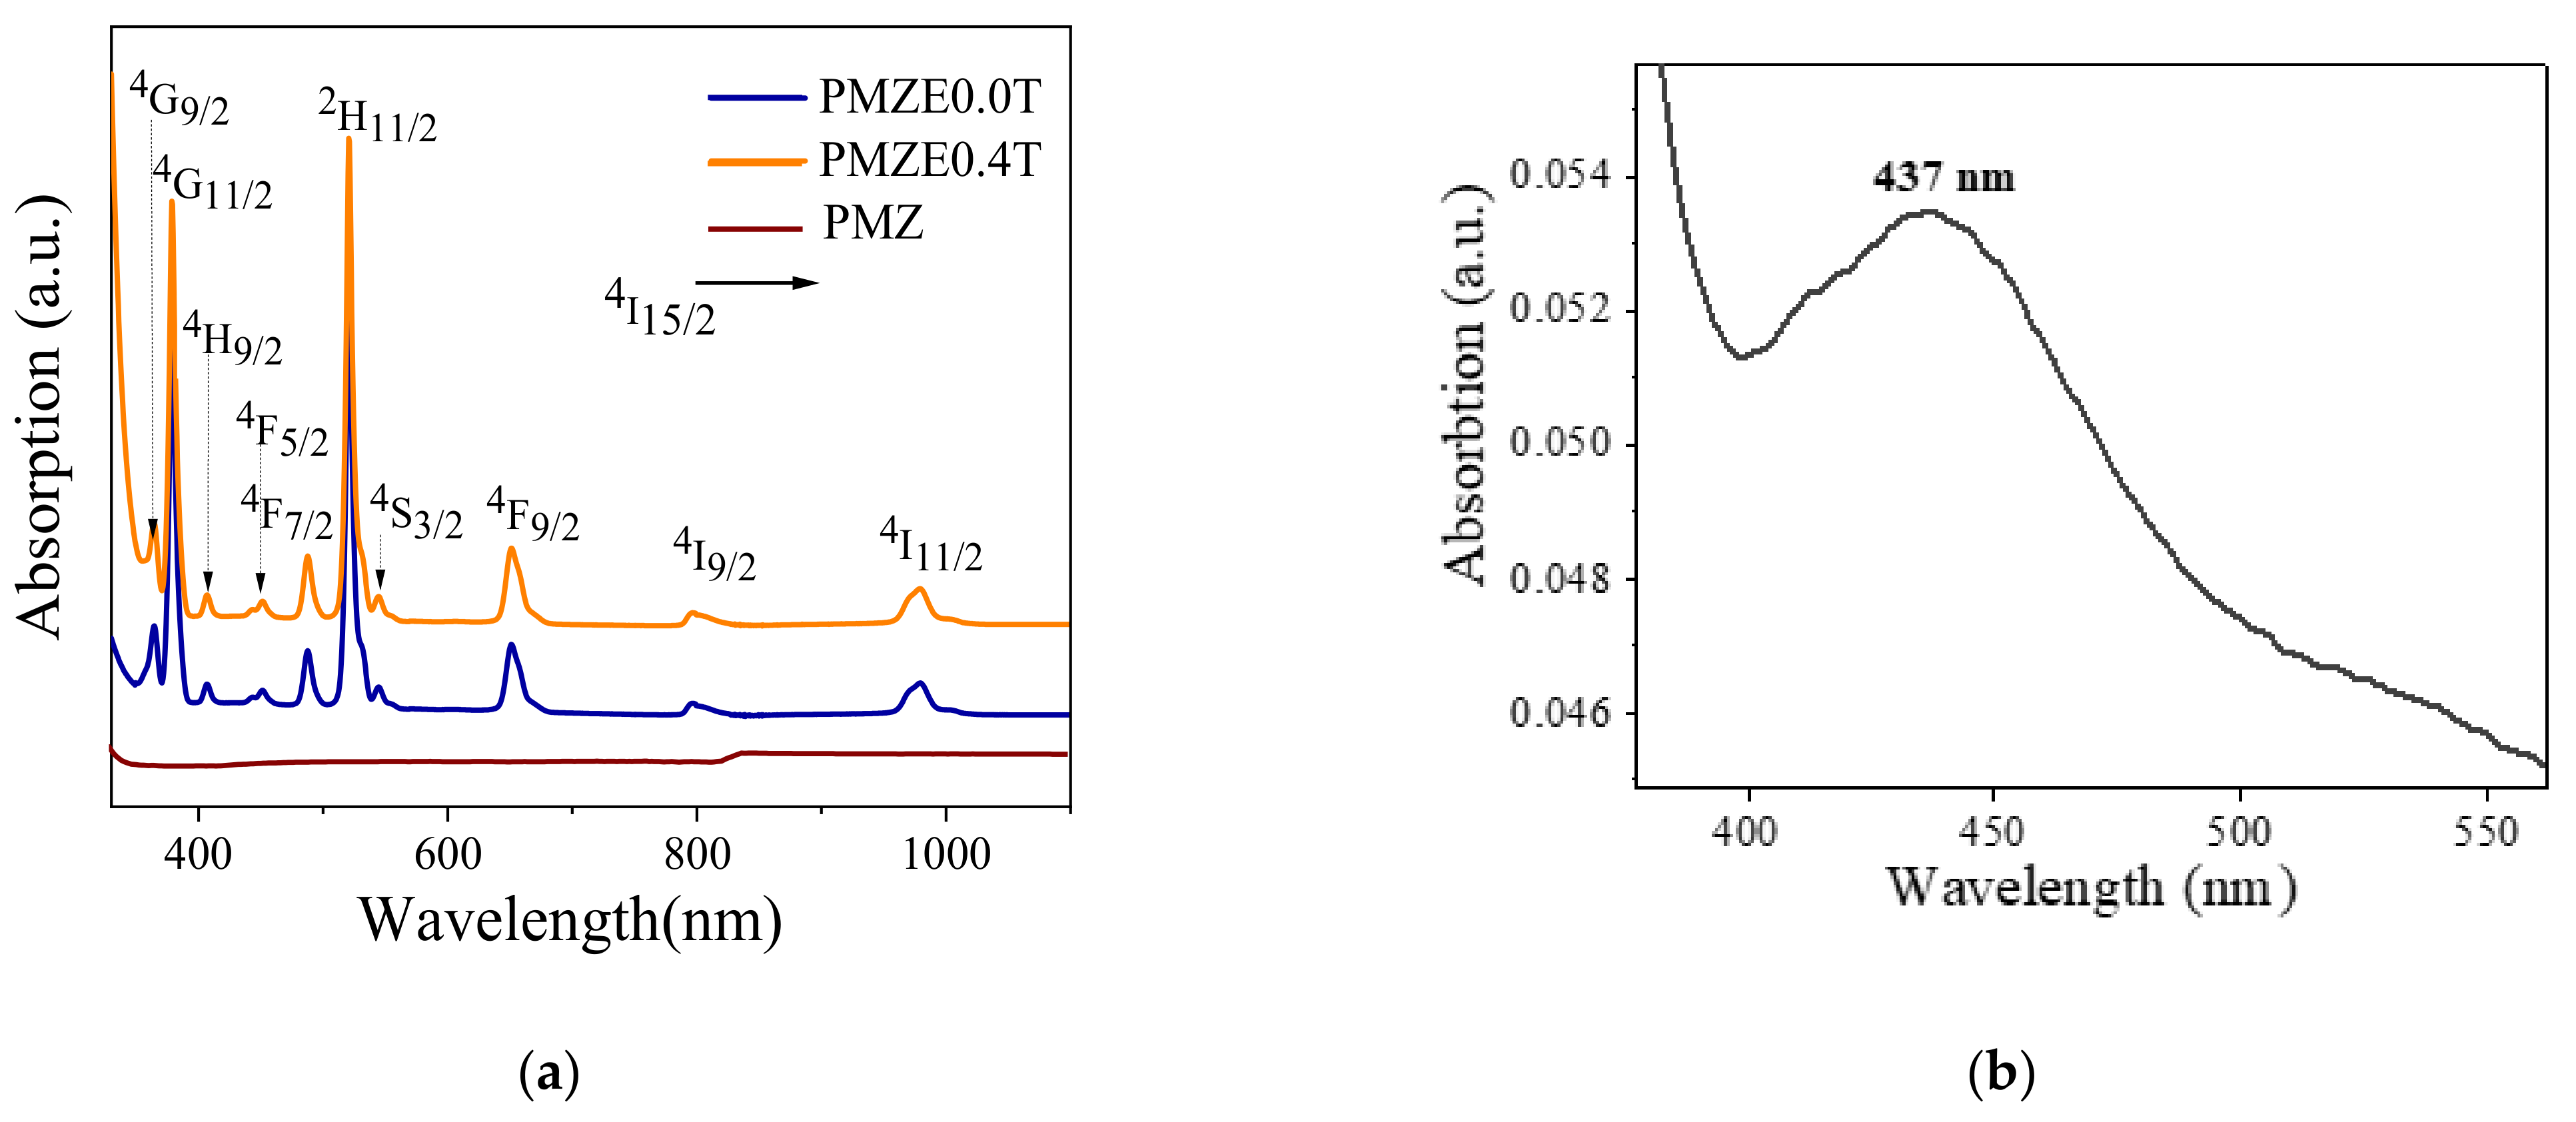
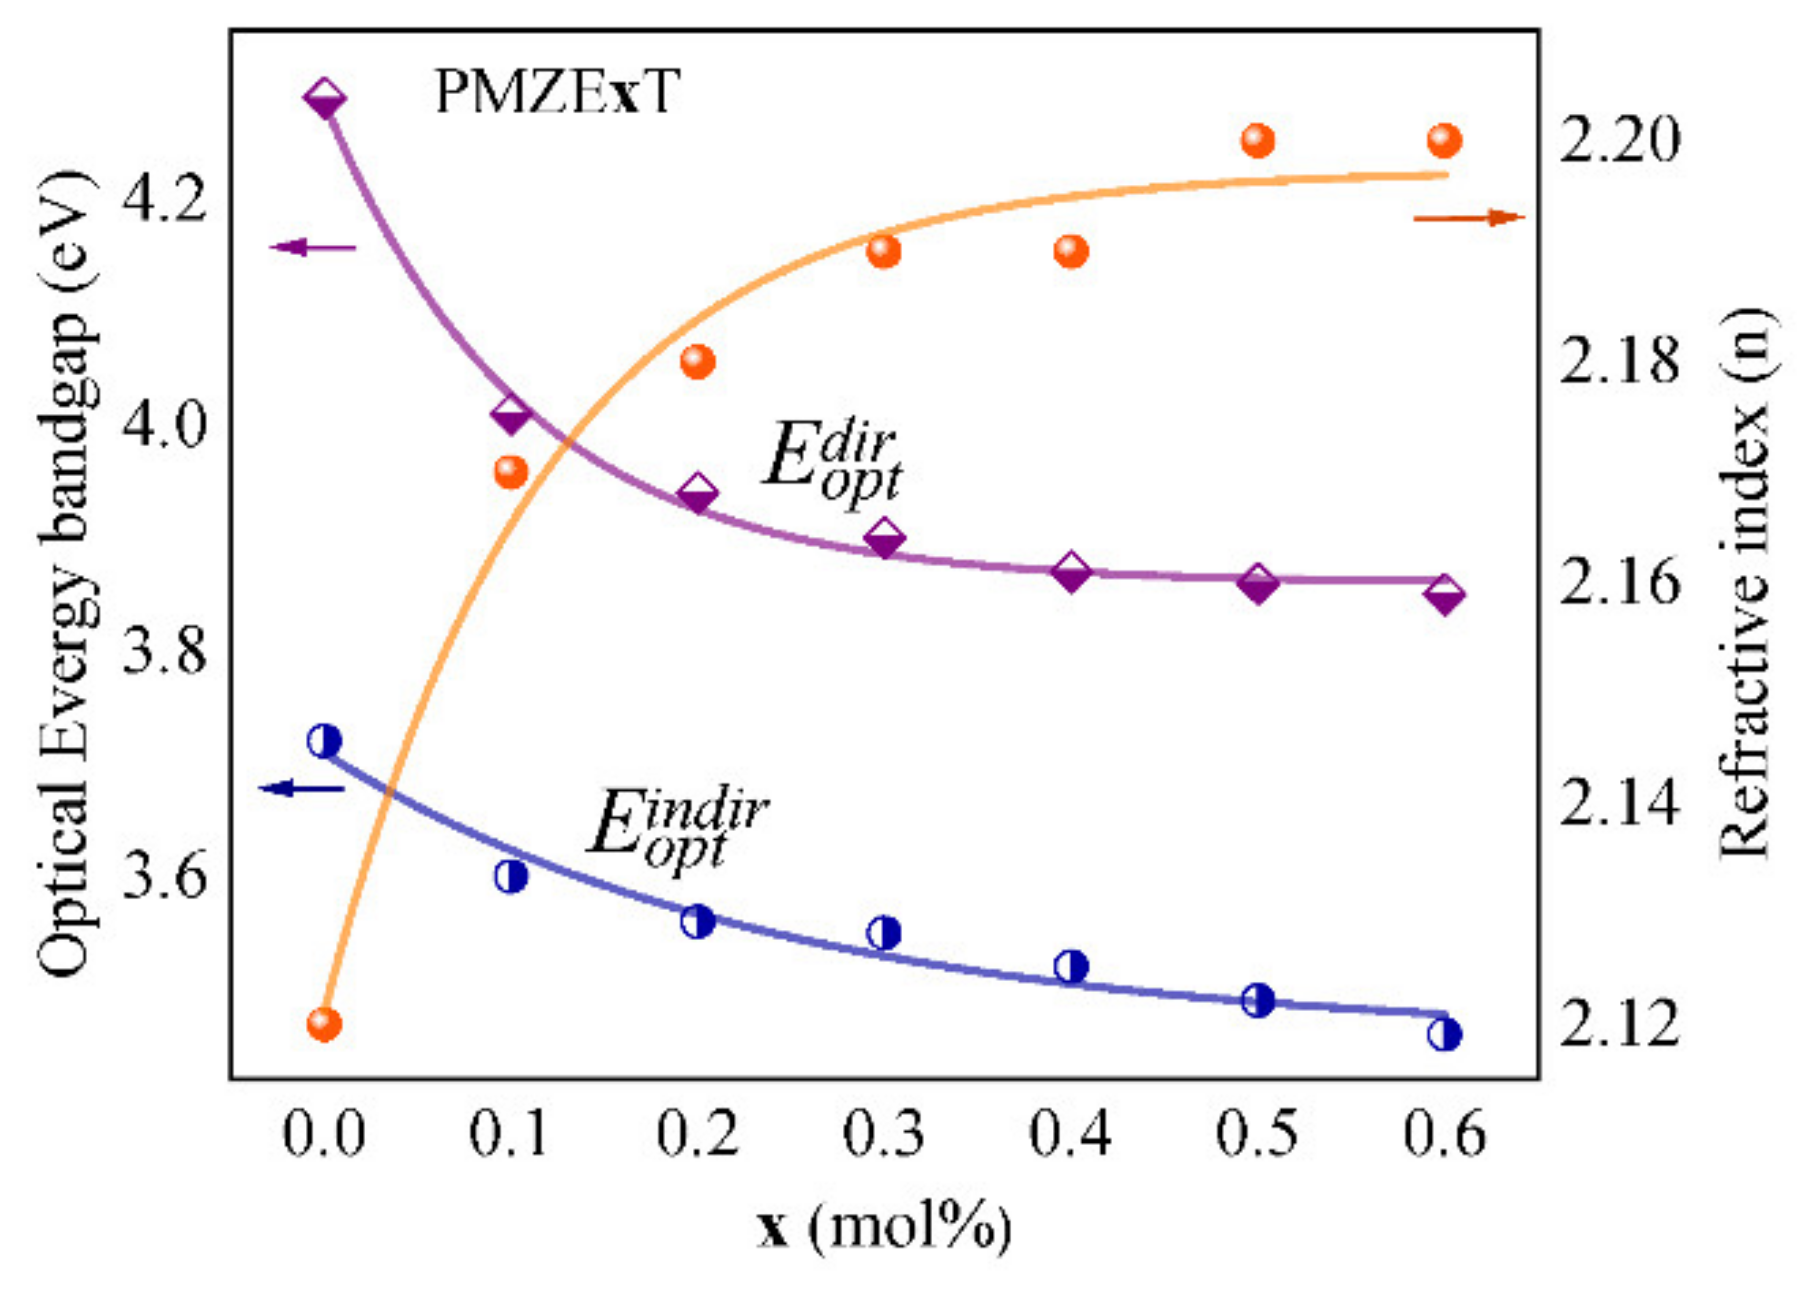
4.3. Optical Properties

Figure 6a,b shows the UV-Vis-NIR absorption spectra of the glass matrix doped with Er3+ (PMZE0.0T) and co-doped with TiO2 NPs (PMZE0.4T) in the range of 330–1100 nm as well as SPR absorption band of TiO2 NPs in glass (PMZ0.4T), respectively. In the absorption measurements the reference sample was the glass matrix without Er3+ or TiO2 NPs We named it as PMZ which it is presented in the Figure 6a. The observed peaks in this range are attributed to the transition of Er3+ ion from the ground state (4I15/2) to the different excited states as presented in the figure. The results demonstrate that co-doping of Er3+-doped glass with TiO2 NPs has no significant effect on the intensity or position of the absorption peaks. The presence of the NPs leads to a surface plasmon resonance (SPR) absorption peak observed around 437 nm. The SPR related effects of TiO2 NPs in the glass matrices have been reported in our previous works [18,19,20].
Optical Band Gap and Refractive Index
Figure 7 shows the optical band gap energies for direct E o p t d i r and indirect E o p t i n d i r transitions as well as refractive index (n) of the samples versus the varied mol% of TiO2 NPs doping into the glass matrix. By addition of TiO2 NPs concentration the optical band gap of the samples was decreased which can be attributed to the formation of more non-bridging oxygen groups than bridging oxygen groups in the glass [38]. The number of localized electrons would be increased as a result of the formation of more non-bridging oxygen groups, and these may behave like donor centres in the glass network, causing redshift of the absorption edge. Therefore, the electron transfer from the valence band to the conduction band may have happened at lower energy as the concentration of TiO2 NPs was increased [38]. The refractive index of the studied glass samples has an incrementing trend by adding TiO2 NPs, as illustrated in the figure.

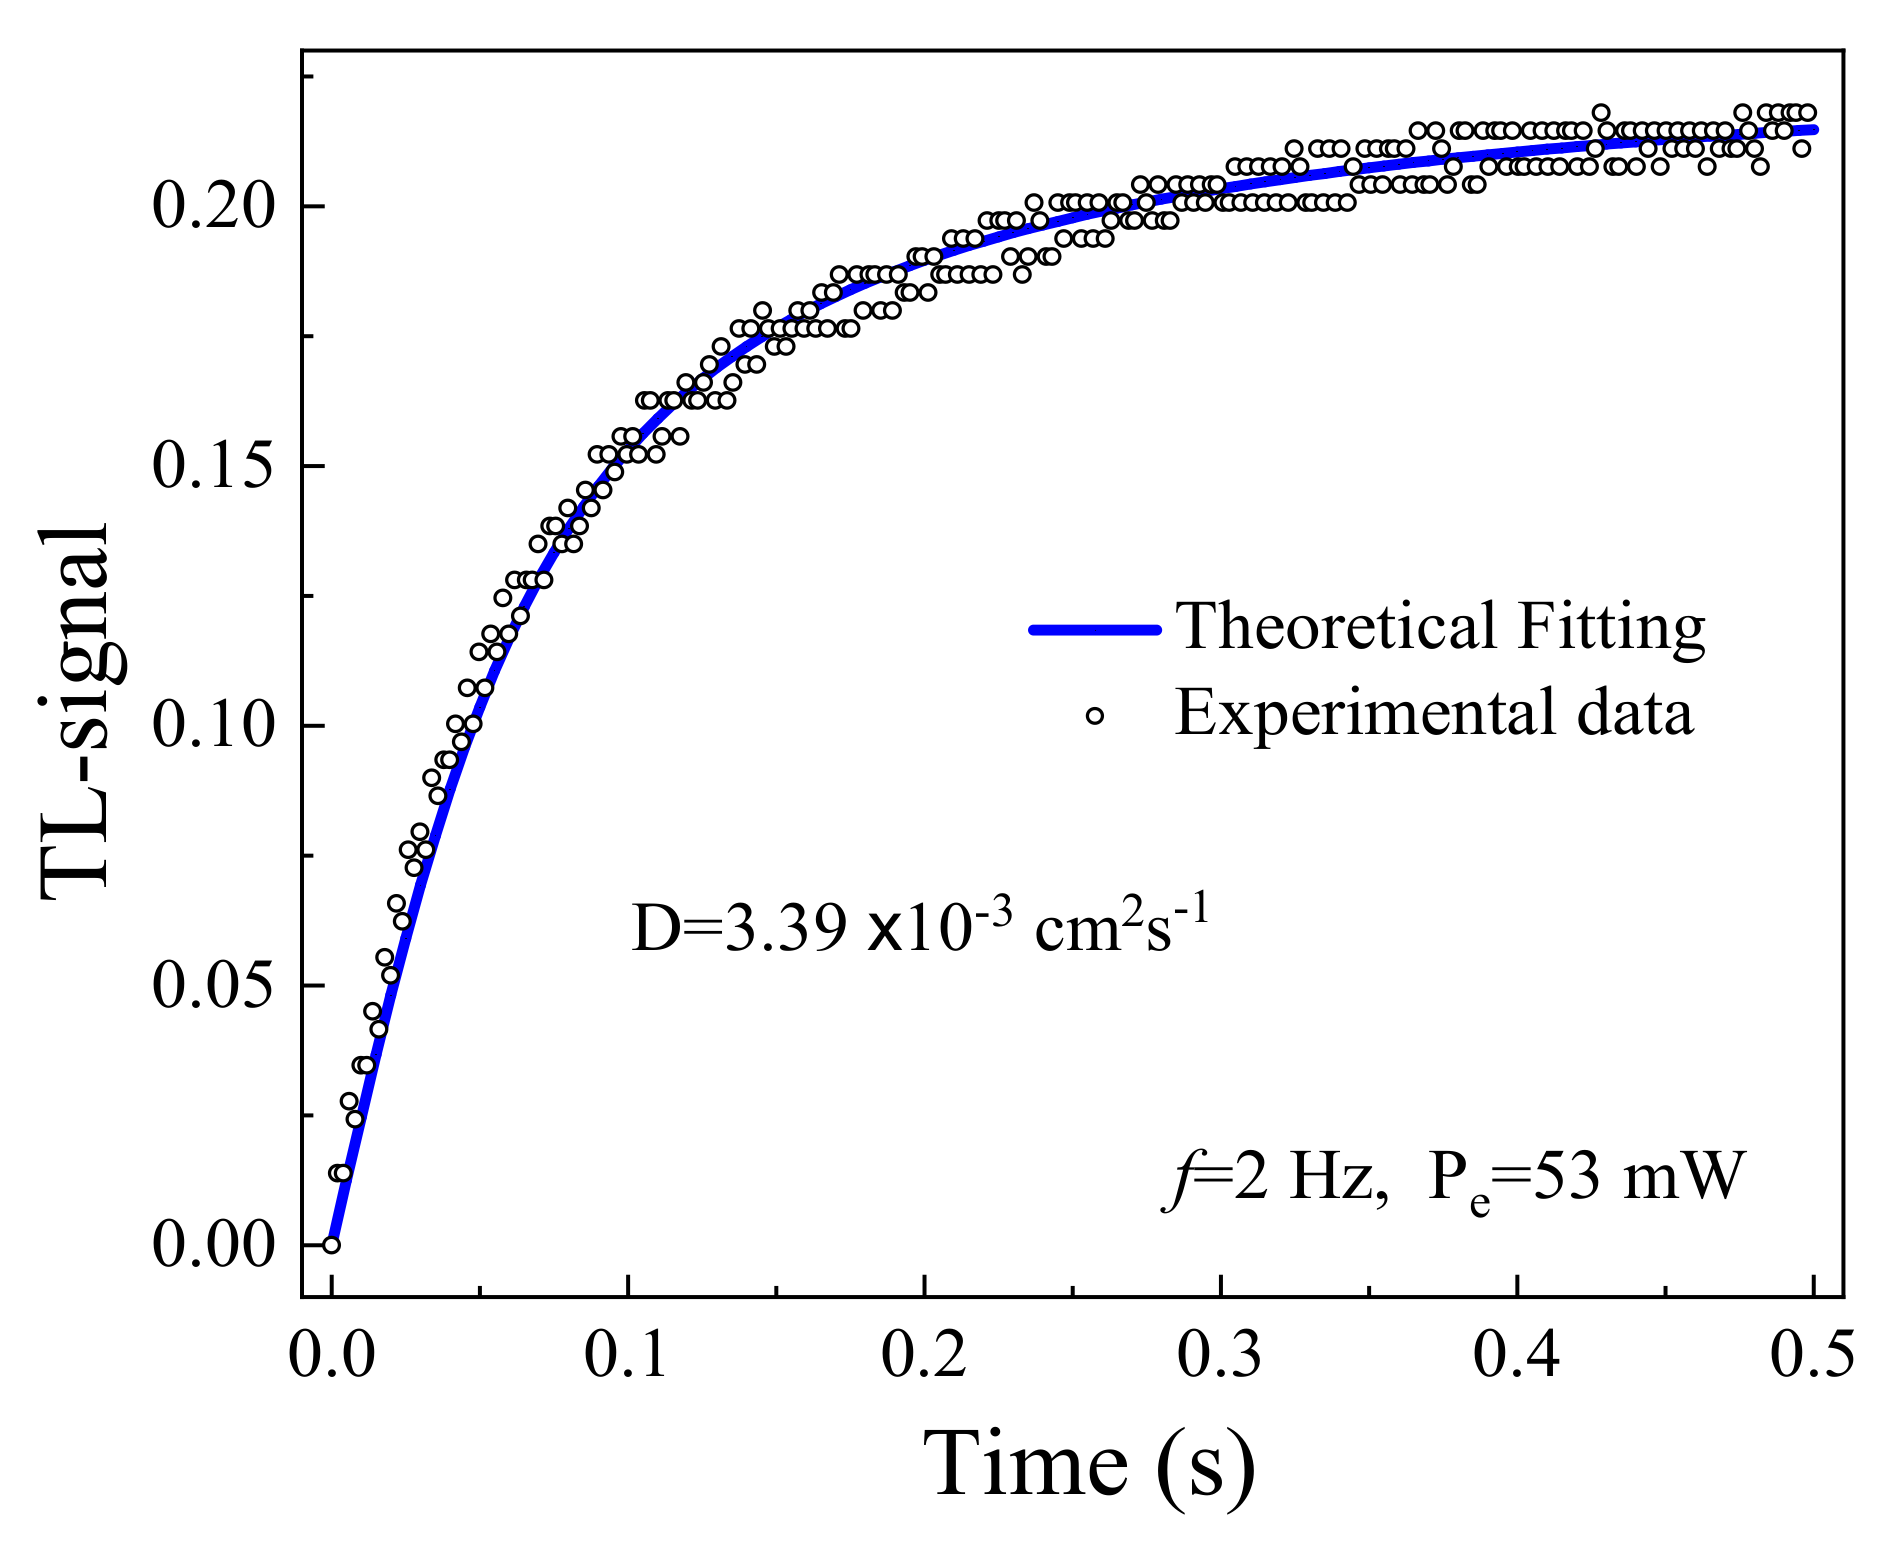
4.4. TLS Measurements

The values for D of the samples were measured using the TLS and BDS. Figure 8 presents the TLS signal as a function of time obtained by irradiating the 0.2 mol % doped glass sample with Pe = 53 mW. In the studied samples, the increase of the TLS signal reveals the convergence of the probe beam as a result of the induced TL effect, so in this material d s / d T   > 0 according to Equation (3). The solid curve in the figure is the best fit to the experimental data (circles) using Equation (2), in which the parameters Θ and D were adjustable and the other variables were assigned well-known experimental values.   D was found directly from the fitting procedure. The BDS slope method was also applied for the measurement of D similarly as shown for PMZE + 0.6TiO2 in Figure 9. The value of D was obtained from the slope [35].
Figure 10 shows the linear behaviour of the phase shift Θ and the absorbed excitation power (Pe), as expected by Equation (3), for the 0.4 mol% doped sample. For that purpose, we fixed the modulation frequency as f = 0.5 Hz to establish a stationary situation where S m a x could be achieved according to Equation (6). The linear trend of phase shift versus the pump beam power was verified for all samples thus demonstrating the validity of Equation (3) and assuring that nonlinear effects such as absorption saturation or Auger upconversion (excited ion-ion energy transfer) were not observed in the investigated pump intensity range [26,39]. From the slope of the plot shown in Figure 10 and using Equation (7), d s / d T was calculated. For the glass samples used here, excited at 532 nm the florescence was negligible, therefore   φ 1 . The reported emission spectrum of the sulfophosphate glass doped by TiO2 NPs illustrates that these glass structures have two main emission peaks at 552 nm and 620 nm under 449 nm excitation wavelength [19].
The same analysis as mentioned above was performed for all samples and the resulting values of D , κ and d s / d T , obtained from three independent measurements, are shown in Table 1. The reported values for D and κ are the average between the results achieved by the two independent techniques. These values slightly increase with concentration of NPs. This result is supported by the fact that the values of D and κ of TiO2 are higher than D and κ in the basic matrix PMZE0.0T. The maximum value of the D for the samples presented in this work is D   =   3.65 × 10 3 c m 2 / s , which represents a relatively high value, as required for applications in high power photonic devices, when compared to other similarly doped phosphate glass samples [40].
In many photonic devices such as laser systems, heat removal is critical to avoid thermal lensing and other deleterious effects on the device application induced by the temperature gradient. The most important physical parameter for heat removal capability of the material is κ which was calculated using the obtained D values of the samples as depicted in Equation (4). In calculations, we used the reported literature value of the heat capacity (c) for the phosphate glass c   =   0.73   J . g 1 . K 1 [40,41], and the measured mass density of the samples using the Archimedes method. The proportionality factor of κ and D , ρ , showed increasing values between 1.95 2.10   J / c m 3 . K versus the concentration of TiO2 NPs. The results indicate that κ also increases with the concentration of NPs giving a maximum value of κ   =   7.66 × 10 3 W / c m . K , as shown in Table 1. The studied glass samples exhibited relatively high values of D and κ as required for applications in high power photonic devices.
The value of C   =   Θ / P a b s   for undoped glass was C   =   4.9   1 / W . This coefficient shows a decrease by adding TiO2 NPs into the glass matrix, as shown in Table 1. The minimum averaged value C   =   5.82 1 / W was obtained for the doped samples. The constant C is a very interesting factor that depends on the glass matrix properties and the ratio between d s / d T and κ . The thermo-optical parameter d s / d T is associated with the deviation of the laser beam inside the material and the thermal lensing effect. This coefficient also decreases with NPs concentration, and thus its minimum value was determined to be d s / d T   =   2.8 × 10 6 1 / K which is a relatively low value when compared to other reported values for ceramics, crystals, and glasses [42]. The decreasing trend of d s / d T in TiO2 doped glass samples confirms that the thermal properties of the glass matrix were improved by the presence of TiO2 NPs. The low d s / d T value together with high κ makes the glass matrix an excellent nearly “athermal” material with potential application in devices that require minimum optical distortion. The properties of some glasses are listed in Table 2 for comparison. It is clear that the values of D and κ are higher compared to other reported values in well-known glasses. Specifically, the glass matrix investigated here shows higher values of D and κ in comparison to nanocrystal doped (PZABP), commercial (LG760) phosphate, and TBZLN glasses. While the obtained value of ds/dT is slightly higher than other compared glasses, it is much smaller than aluminoborate (YAIB) glasses.

5. Conclusions

The effect of doping with TiO2 NPs on the thermo-optical properties of phosphate glass was investigated. TiO2 NPs were inserted in the Er3+ doped sulfophosphate glass matrix and their presence was investigated by TEM and also demonstrated by the changes of the optical band gap and refractive index of the glass samples. The obtained values of D and κ , are relatively high, and d s / d T comparable with other reported values in similar glasses, thus demonstrating that this material can be used for applications in photonic devices. The doped samples demonstrated an increase in the values of D and κ with an increase in the amount of NPs, which is very important for applications where rapid heat removal is important. Finally, the results demonstrate the ability of photothermal spectroscopy, including TLS and BDS techniques, to achieve accurate measurements.

Author Contributions

Conceptualization, Z.E. and H.C.; methodology, H.C.; software, H.C.; validation, Z.E., F.A. and A.A.; formal analysis, Z.E. and H.C.; investigation, Z.E. and H.C.; resources, H.C.; data curation, Z.E. and H.C.; writing—original draft preparation, Z.E.; writing—review and editing, H.C.; supervision, J.N.; funding acquisition, H.C. All authors have read and agreed to the published version of the manuscript.

Funding

This research received no external funding.

Data Availability Statement

Not applicable.

Acknowledgments

Z.E. and H.C. would like to acknowledge the SPIE-ICTP Anchor Research Program funded generously by SPIE, the International Society for Optics and Photonics. We also have benefitted greatly from the support of the TRIL Program of the Abdus Salam International Centre for Theoretical Physics (ICTP).

Conflicts of Interest

Authors declare no conflict of interest.

References

  1. Dousti, M.R.; Raja, J.A. Spectroscopic properties of Tb3+ doped lead zinc phosphate glass for green solid-state laser. J. Non. Cryst. 2015, 420, 21–25. [Google Scholar] [CrossRef]
  2. Jha, K.; Jayasimhadri, M. Structural and emission properties of Eu3+ doped alkaline earth zinc-phosphate glasses for whithe LED applications. J. Am. Ceram. Soc. 2017, 100, 1402–1411. [Google Scholar] [CrossRef]
  3. Shoaib, M.; Chanthima, N.; Rooh, G.; Rajaramakrishna, R.; Kaewkhao, J. Physical and luminescence properties of rare earth doped phosphate glasses for solid state lighting applications. J. Thai Interdiscip. Res. 2019, 14, 20–26. [Google Scholar]
  4. Wang, H.; Batentschuk, M.; Osvet, A.; Pinna, L.; Brabec, C.J. Rare-Earth Ion Doped Up-Conversion Materials for Photovoltaic Applications. Adv. Mater. 2011, 23, 2675–2680. [Google Scholar] [CrossRef] [PubMed]
  5. Peng, Y.-P.; Wang, C.; Yuan, X.; Zhang, L. Er 3+ -doped Oxyfluorogallate Glass for 2.7 µm Solid-State Lasers. J. Lumin. 2015, 172, 331–334. [Google Scholar] [CrossRef]
  6. Tabanli, S.; Eryurek, G. Optical investigation of Er3+ and Er3+/Yb3+ doped zinc-tellurite glass for solid-state lighting and optical thermometry. Sens. Actuators A. Phys. 2018, 285, 448–455. [Google Scholar] [CrossRef]
  7. Taherunnisa, S.K.; KrishnaReddy, D.V.; SambasivaRao, T.; Rudramamba, K.S.; Zhydachevskyy, Y.A.; Suchocki, A.; Piasecki, M.; RamiReddy, M. Effect of up-conversion luminescence in Er 3 + doped phosphate glasses for developing Erbium-Doped Fibre Amplifiers (EDFA) and G-LED’s. Opt. Mater. X 2019, 3, 100034. [Google Scholar]
  8. Hu, F.; Lu, S.; Jiang, Y.; Wei, R.; Guo, H.; Yin, M. Optical thermometry based on up-conversion luminescence behavior in BaGdF 5: Er 3 þ glass ceramics. J. Lumin. 2020, 220, 116971. [Google Scholar] [CrossRef]
  9. The, A.C.; Dipole, M.; Dipole, F.E.; Relaxatio, M.P.; Glasses, B.F. Radiative and Non-Radiative Transitions of Rare-Earth Ions in Glasses in Rare Earths; Springer: Berlin, Germany, 1975; pp. 123–175. [Google Scholar]
  10. Mariselvam, K.; Kumar, R.A.; Rao, V.R. Concentration-dependence and luminescence studies of erbium doped barium lithium fl uoroborate glasses. Opt. Laser Technol. 2019, 118, 37–43. [Google Scholar] [CrossRef]
  11. Zhang, X.; Chen, R.; Wang, P.; Gan, Z.; Zhang, Y.; Jin, H.; Jian, J.; Xu, J. Investigation of energy transfer mechanisms in rare-earth doped amorphous silica films embedded with tin oxide nanocrystals. Opt. Express 2019, 27, 2783–2791. [Google Scholar] [CrossRef]
  12. Huang, F.; Liu, X.; Hu, L.; Chen, D. Spectroscopic properties and energy transfer parameters of Er 3 1-doped fluorozirconate and oxyfluoroaluminate glasses. Sci. Rep. 2014, 4, 1–9. [Google Scholar]
  13. Shen, S.; Jha, A.; Zhang, E.; Wilson, S.J. Compositional effects and spectroscopy of rare earths (Er 3 +, Tm 3 +, and Nd 3 +) in tellurite glasses. C. R. Chim. 2002, 5, 921–938. [Google Scholar] [CrossRef]
  14. Mariano, D.; José, M.; Bell, V. Frequency upconversion in Er 3 + doped PbO–GeO 2 glasses containing metallic nanoparticles. Appl. Phys. Lett. 2007, 90, 8–10. [Google Scholar]
  15. Ghoshal, S.K.; Awang, A.; Sahar, M.R.; Arifin, R. Gold nanoparticles assisted surface enhanced Raman scattering and luminescence of Er 3 þ doped zinc–Sodium tellurite glass. J. Lumin. 2015, 159, 265–273. [Google Scholar] [CrossRef]
  16. Kassab, L.R.; de Almeida, R.; da Silva, D.M.; de Assumpção, T.A.A.; de Assumpção, C.B. Enhanced luminescence of Tb 3 + / Eu 3 + doped tellurium oxide glass containing silver nanostructures. J. Appl. Phys. 2009, 105, 103505. [Google Scholar] [CrossRef] [Green Version]
  17. Ahmadi, F.; Hussin, R.; Ghoshal, S.K. Tailored optical properties of Dy 3 + doped magnesium zinc sulfophosphate glass: Function of silver nanoparticles embedment. J. Non. Cryst. Solids 2018, 499, 131–141. [Google Scholar] [CrossRef]
  18. Ahmadi, F.; Ebrahimpour, Z.; Asgari, A.; Ghoshal, S.K. Insights into spectroscopic aspects of Er 3 + doped sulfophosphate glass embedded with titania nanoparticles. Opt. Mater. 2020, 111, 110650. [Google Scholar]
  19. Ahmadi, F.; Ebrahimpour, Z.; Asgari, A.; El-mallawany, R. Role of silver / titania nanoparticles on optical features of Sm 3 þ doped sulfophosphate glass. Opt. Mater. (Amst.) 2020, 105, 109922. [Google Scholar] [CrossRef]
  20. Ahmadi, F.; Ebrahimpour, Z.; Asgari, A. Titania nanoparticles embedded Er 3 þ -Sm 3 þ co-doped sulfophosphate glass: Judd-Ofelt parameters and spectroscopic properties enhancement. J. Alloys Compd. 2020, 843, 155982. [Google Scholar] [CrossRef]
  21. Kim, J.Y.; Mirzaei, A.; Kim, J.H.; Lee, J.H.; Kim, H.W.; Kim, S.S. Incorporation of metal nanoparticles in soda-lime glass sensors for enhancing selective sensing. Sensors Actuat. B Chem. 2019, 296, 126673. [Google Scholar] [CrossRef]
  22. Garcia, J.A.M.; Bontempo, L.; Gomez-Malagon, L.A.; Kassab, L.R.P. Efficiency boost in Si-based solar cells using tellurite glass cover layer doped with Eu3+ and silver nanoparticles. Opt. Mater. 2019, 88, 155–160. [Google Scholar] [CrossRef]
  23. Taniguchi, M.M.; Marconi, J.D.; Herculano, L.S.; Belançon, M.P. On the prospects of enhance glass-based devices with silver nanoparticles: The case of Pr3+ doped tellurite-tungstate glasses. J. Alloys Compd 2018, 749, 871–877. [Google Scholar] [CrossRef] [Green Version]
  24. Babu, P.; Jin, H.; Kesavulu, C.R.; Hyuk, K.; Jayasankar, C.K. Thermal and optical properties of Er 3 + -doped oxyfluorotellurite glasses. J. Lumin. 2009, 129, 444–448. [Google Scholar] [CrossRef]
  25. Freitas, A.M.; Bell, M.J.V.; Anjos, V.; Pinheiro, A.S.; Dantas, N.O. Thermal Analyzes of Phosphate Glasses doped with Yb 3 + and ZnTe Nanocrystals. J. Lumin. 2015, 169, 353–358. [Google Scholar] [CrossRef]
  26. Gonçalves, T.S.; Santos, J.F.M.; Sciuti, L.F.; Catunda, T.; De Camargo, A.S.S. Thermo-optical spectroscopic investigation of new Nd 3+-doped fluoro aluminophosphate glasses. J. Alloys Compd. 2018, 732, 887–893. [Google Scholar] [CrossRef]
  27. Abella, S.; Itzler, O.N.K.; Erhane, A.M.B.; Avid, D.J.; Pence, S.; Ildren, R.I.P.M. Analysis of a thermal lens in a diamond Raman laser operating at 1. 1 kW output power. Opt. Express 2020, 28, 15232–15239. [Google Scholar]
  28. Cabrera, H.; Matroodi, F.; Cabrera-Díaz, H.D.; Ramírez-Miquet, E.E. Frequency-resolved photothermal lens: An alternative approach for thermal diffusivity measurements in weak absorbing thin samples. Int. J. Heat Mass Transf. 2020, 158, 120036. [Google Scholar] [CrossRef]
  29. Korte, D.; Cabrera, H.; Toro, J.; Gallardo, P.G.; Leal, C.; Villabona, A.; Franko, M. Optimized frequency dependent photothermal beam deflection spectroscopy. Laser Phys. Lett. 2016, 13, 125701. [Google Scholar] [CrossRef] [Green Version]
  30. Lima, S.M.; Catunda, T.; Lebullenger, R.; Hernandes, A.C.; Baesso, M.L.; Bento, A.C.; Miranda, L.C.M. Temperature dependence of thermo-optical properties of fluoride glasses determined by thermal lens spectrometry. Phys. Rev. B 1999, 60, 15173–15178. [Google Scholar] [CrossRef] [Green Version]
  31. Shen, J.; Lowe, R.D.; Snook, R.D. A model for cw laser induced mode-mismatched dual-beam thermal lens spectrometry. Chemical Physics 1992, 165, 385–396. [Google Scholar] [CrossRef]
  32. Marcano, A.; Cabrera, H.; Guerra, M.; Cruz, R.A.; Jacinto, C.; Catunda, T. Optimizing and calibrating a mode-mismatched thermal lens experiment for low absorption measurement. J. Opt. Soc. Am. B 2006, 23, 1408–1413. [Google Scholar] [CrossRef]
  33. Dolgonos, A.; Mason, T.O.; & Poeppelmeier, K.R. Direct optical band gap measurement in polycrystalline semiconductors: A critical look at the Tauc method. J. Solid State Chem. 2016, 240, 43–48. [Google Scholar] [CrossRef] [Green Version]
  34. Dimitrov, V.; Sakka, S. Electronic oxide polarizability and optical basicity of simple oxides. J. Appl. Phys. 1996, 79, 1736–1740. [Google Scholar] [CrossRef]
  35. Salazar, A.; Sánchez-Lavega, A. Thermal diffusivity measurements using linear relations from photothermal wave experiments. Rev. Sci. Instrum. 1994, 65, 2896–2900. [Google Scholar] [CrossRef]
  36. Da, N.; Grassmé, O.; Nielsen, K.H.; Peters, G.; Wondraczek, L. Formation and structure of ionic (Na, Zn) sulfophosphate glasses. J. Non-Cryst. Solids 2011, 357, 10–2202. [Google Scholar] [CrossRef]
  37. Massera, J.; Bourhis, K.; Petit, L.; Couzi, M.; Hupa, L.; Hupa, M.; Videau, J.J.; Cardinal, T. Effect of the glass composition on the chemical durability of zinc-phosphate-based glasses in aqueous solutions. J. Phys. Chem. Solids 2013, 74, 121–127. [Google Scholar] [CrossRef]
  38. Ismail, S.F.; Sahar, M.R.; Ghoshal, S.K. Physical and absorption properties of titanium nanoparticles incorporated into zinc magnesium phosphate glass. Mater. Charact. 2016, 111, 177–182. [Google Scholar] [CrossRef]
  39. Jacinto, T.C.C.; Messias, D.N.; Andrade, A.A.; Lima, S.M.; Baesso, M.L. Thermal lens and Z-scan measurements: Thermal and optical properties of laser glasses–A review. J. Non-Cryst. Solids 2006, 352, 3582–3597. [Google Scholar] [CrossRef]
  40. Messias, D.N.; Jacinto, C.; Bell, M.J.V.; Catunda, T. Thermal and Optical Properties of Yb 3 + -and Nd 3 + -Doped Phosphate Glasses Determined by Thermal Lens Technique. IEEE J. Quantum Electron. 2007, 43, 751–757. [Google Scholar] [CrossRef]
  41. Martins, V.M.; Brasse, G.; Doualan, J.L.; Braud, A.; Camy, P.; Messias, D.N.; Catunda, T.; Moncorgé, R. Thermal conductivity of Nd 3 + and Yb 3 + doped laser materials measured by using the thermal lens technique. Opt. Mater. (Amst.) 2014, 37, 211–213. [Google Scholar] [CrossRef]
  42. Santos, C.N.; Mohr, D.; Silva, W.F.; de Camargo, A.S.S.; Eckert, H.; Vermelho, M.V.D.; Hernandes, A.C.; Ibanez, A.; Jacinto, C. Luminescent and thermo-optical properties of Nd 3 + -doped yttrium aluminoborate laser glasses. J. Appl. Phys. 2009, 106, 023512. [Google Scholar] [CrossRef]
  43. Seshadri, M.; Radha, M.; Daramian, H.; Barbosa, L.C.; Bell, M.J.V.; Anjos, V. Thermal and nonlinear optical properties of Tm 3 + -doped tellurite glasses. J. Therm. Anal. Calorim. 2019, 138, 2971–2978. [Google Scholar] [CrossRef]
Figure 1. EDX Spectrum of PMZ0.5Er glass sample.
Photonics 08 00115 g001
Figure 2. Scheme of the dual-beam mode-mismatched configuration. L1, L2, L3, L4, L5: lenses, M1, M2, M3, M4: turning mirrors, DM: dichroic mirror, NDF: neutral density filter, F: filter.
Photonics 08 00115 g002
Figure 3. Scheme of the BDS configuration. L1, L2, L3, L4, L5, L6: lenses, M: reflecting mirrors, QP: quadrant photodetector, IF: filter.
Photonics 08 00115 g003
Figure 4. TEM image of PMZE0.6T glass sample.
Photonics 08 00115 g004
Figure 5. TA curve for PMZE0.0T and PMZE0.2T.
Photonics 08 00115 g005
Figure 6. (a) Absorption spectra and (b) SPR absorption band of TiO2 NP in PMZ0.4T glass sample.
Photonics 08 00115 g006
Figure 7. Optical energy bandgap for direct and indirect transitions and refractive index (n) as a function of TiO2 NPs concentration.
Photonics 08 00115 g007
Figure 8. TL signal for the PMZE + 0.2 TiO2 sample as function of time.
Photonics 08 00115 g008
Figure 9. Phase of the transverse component of the perpendicular deflection versus the pump to probe offset y for the PMZE + 0.6 TiO2.
Photonics 08 00115 g009
Figure 10. Phase shift ( Θ ) as a function of the absorbed excitation laser power (Pabs) by the PMZE + 0.4 TiO2 sample. The red line is the best linear fitting of the data. All doped samples presented similar graphics.
Photonics 08 00115 g010
Table 1. Thermal properties of the PMZE + xTiO2 samples.
Sample D [ 10 3 cm 2 s 1 ] ρc [ J   cm 3 K 1 ]
(±0.01)
κ [ 10 3 Wcm 1 K 1 ] C = 1 λ p κ . d s d T [ W 1 ] d s / d T [ 10 6   K 1 ]
PMZE0.0T3.10 ± 0.051.956.05 ± 0.369.633.70 ± 0.10
PMZE0.1T3.33 ± 0.051.966.53 ± 0.107.763.20 ± 0.02
PMZE0.2T3.39 ± 0.102.006.78 ± 0.207.843.36 ± 0.05
PMZE0.3T3.54 ± 0.152.037.18 ± 0.306.843.11 ± 0.08
PMZE0.4T3.58 ± 0.162.057.34 ± 0.347.493.51 ± 0.09
PMZE0.5T3.61 ± 0.122.087.51 ± 0.247.203.41 ± 0.08
PMZE0.6T3.65 ± 0.132.107.66 ± 0.265.822.80 ± 0.05
Table 2. Thermo-optical properties of some known glasses.
Glass MatrixDopants D [ 10 3 cm 2 s 1 ] κ [ 10 3 Wcm 1 K 1 ] d s / d T [ 10 6   K 1 ] Reference
PMZ0.6TEr3+ + TiO23.65 ± 0.137.66 ± 0.262.80 ± 0.05Current work
PZABPYb3+ + ZnTe NC2.6 ± 0.33.4 ± 0.41.0 ± 0.6[25]
LG760Nd3+2.65.4-[41]
YAlBNd3+4.110.66.9[42]
TBZLNTm3+3.012.51.5[43]
Publisher’s Note: MDPI stays neutral with regard to jurisdictional claims in published maps and institutional affiliations.

