Abstract
Lately the nonlinear optical third-harmonic generation (THG) microscopy is starting to emerge as a laboratory standard for label-free studies in biological samples. In this study, the THG signals produced from corn starch granules are investigated. In particular, the polarization-dependent THG (P-THG) signals emerging from the outer layer (shell) of the starch granules are compared with the P-THG signals originating from their inner portion (core). By rotating the linear polarization of the excitation beam, two distinct P-THG modulation patterns are revealed within single granules, corresponding to their shells and to their structurally different cores. These patterns are analyzed using a theoretical framework that describes THG from an orthorhombic crystal symmetry, characteristic of corn starch. This allows us to extract point-by-point in the granules the ratios of the susceptibility tensor elements and the average molecular orientations. Then, the anisotropy ratio (AR = /) is defined and used as a quantitative descriptor of the local molecular arrangements. Our results show that the shells and cores exhibit distinct AR values, probing the anisotropy in the molecular arrangements between the two regions. This study establishes P-THG as a powerful contrast mechanism for probing structural anisotropy in biological samples beyond conventional THG intensity-only microscopy.
1. Introduction
Starch is one of the most important polysaccharides and a basic constituent of our everyday diet. It is found in potatoes, wheat, rice and corn, and it is laid down in the form of granules. It consists of two types of molecules, amylose and amylopectin. The extensive degree of crystallinity in starch granules originates from the amylopectin molecules which are oriented radially with their non-reducing chain ends pointing towards the outer surface of the granule. This spherocrystalline assembly, when observed under polarized light, shows a Maltese cross [1]. Furthermore, using a λ/4 waveplate, polarized light shows the positive birefringence which theoretically indicates radial orientation of the principal axis of the crystallites [2]. The crystalline structure of starch varies by botanical origin and falls into three general types: A-type, B-type, and C-type. Corn starches belong to the orthorhombic A-type crystal structure [3,4]. Starch molecules are organized in alternating con-centric crystalline and amorphous domains that form growth rings. The crystalline layer consists of ordered regions composed of double helices formed by short amylopectin branches, most of which are further ordered into structures known as the crystalline lamellae [5]. The outer layer of starch granules (shell) seems to differ from the inner portion (core), although the chemical composition is basically the same. The remnant of this envelope structure, commonly called a “ghost”, has been found to comprise primarily amylopectin (as determined by iodine staining) [6,7]. Techniques like electron microscopy [8], X-ray scattering [9], and nuclear magnetic resonance [10] are used to characterize the structure of starch granules. Optical approaches, like second-harmonic generation (SHG) microscopy, also offer valuable information on the structure of starch granules [11,12,13,14]. Lately, nonlinear optical third-harmonic generation (THG) microscopy has been used to image starch [15,16,17]. In THG, three photons are combined to produce one of triple energy. THG signals are coherent with well-defined polarizations. The power of the THG signals depends on the state of the excitation polarization and the structure of the interacted samples.
In the present study polarization-dependent THG (P-THG) microscopy is performed in corn starch granules. By rotating the direction of the excitation linear polarization, series of images of the granules are acquired, for different directions of polarization. In these P-THG images, the THG signals’ intensity is modulating with the rotation of the polarization, giving rise to characteristic P-THG patterns. Importantly, the THG signals originating from the shell of the granule, modulate in a different manner than those originating from the core of the granule. After a point-by-point analysis, distinct P-THG modulation profiles are revealed. These emerge from different regions of the corn starch granules (i.e., the shell and the core). A theoretical framework is introduced for interpreting P-THG signals originating from an orthorhombic crystal symmetry, characteristic of corn starches. The ratios of the susceptibility tensor elements are extracted, from fits to the P-THG intensity profiles. An anisotropy ratio AR = / is introduced and used as a metric of the molecular arrangement in the granules. Our analysis reveals distinct AR values for the cores and shells, reflecting structural anisotropy on molecular arrangements within single granules.
2. Materials and Methods
2.1. Sample Preparation
The corn starch was purchased from the local food store. It was embedded with distilled water between two 25 mm diameter, No. 0 thickness, microscope cover glasses (Menzel Gläser, Braunschweig, Germany), sealed with grease. The addition of water has significant effect on starch structure. Hydration self-organizes amylopectin molecules in a more uniform spherical granule shape. Specifically, water allows the amylopectin helices to organize side by side in a smectic A-type structure [18].
2.2. Polarization-Dependent THG Microscope
The experimental setup of our custom-build nonlinear microscope is schematically shown in Figure 1 [19]. The excitation source is a femtosecond oscillator (FLINT, Light Conversion) centered at 1030 nm, with repetition rate 80 MHz and pulse duration 50 fs (manufacturer specifications). The output beam is directed into an optical parametric oscillator (OPO) (Levante IR, APE, Berlin, Germany) tuned to emit at 1542 nm for THG excitation. The linear polarization state of the excitation beam is controlled by a half-wave retardation plate (AHWP10M-1600, ThorLabs, Newton, NJ, USA) placed on a motorized rotational stage (8MRU, Standa, Vilnius, Lithuania). The mean polarization extinction ratio of the different linear polarization orientations, calculated using crossed polarization measurements obtained after the objective, was 26:1. Raster-scanning of the beam is performed using a pair of galvanometric mirrors (6215H, Cambridge Technology, Bedford, MA, USA). Using a pair of achromatic doublet lenses (forming a telescope), the beam emerging from the galvanometric mirrors is expanded approximately 7 times in order to fill the back aperture of the objective lens. Exiting the telescope, the beam is reflected on a mirror, at 45° (PFR10-P01, ThorLabs, Newton, NJ, USA), and placed at the motorized turret box of the microscope, just below the objective (Plan-Apochromat 40×/1.3NA, Carl Zeiss, Oberkochen, Germany).
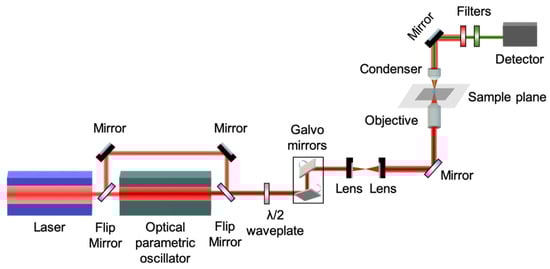
Figure 1.
Schematic representation of the experimental setup for P-THG imaging. It is based on an fs laser beam coupled to a microscope. The fundamental, 1030 nm pulses are converted to 1542 nm, by means of an optical parametric oscillator. Starch granules, excited by this wavelength, generate THG centered at 514 nm. The THG signals are recorded for different directions of the linear polarization of the excitation beam, via a rotating half-wave plate. A pair of galvanometric mirrors enables raster-scanning of the fs beam, obtaining P-THG images of the starch granules, for every direction of polarization.
The THG (at 514 nm wavelength) is collected in the forward direction with a high-numerical aperture condenser lens (achromatic–aplanatic, 1.4 NA, Zeiss, Oberkochen, Germany) and is detected, after passing through a short-pass filter (FES0800, ThorLabs, Newton, NJ, USA) and a band-pass filter (FF01-514/3, Semrock, Rochester, NY, USA), by a photomultiplier tube (H9305-04, Hamamatsu, Bridgewater, NJ, USA). The galvanometric mirrors and the PMT are connected to a connector block (BNC-2110, National Instruments, Austin, TX, USA), which is interfaced to a PC through a DAQ (PCI 6259, National Instruments, Austin, TX, USA). Coordination of PMT recordings with the galvanometric mirrors for the image formation, as well as the movements of all the microscope motors, is carried out using LabView 2013 (National Instruments) software. One image of 500 × 500 pixels (measurements) is recorded in approximately 1 s.
2.3. Theoretical Model of Polarization-Dependent THG in Starch
Starch is a complex microparticle composed of two major constituents, amylose and amylopectin, usually accompanied by water, lipids, phospholipids, soluble and insoluble fiber, and some minerals [3]. Starch molecules are organized in a blocklet level of order and a radial assemble of such blocklets forms the granules [1]. Starch crystallinity is realized by packing of starch molecules in nanocrystalline unit cells (crystallites) inside the blocklets [1].
Using X-ray diffraction techniques, the size of starch unit cells is identified and characterized for the different types of starch. The structure of A-type starches like corn starch is described by an orthorhombic unit cell with parameters a = 11.72 Å, b = 17.71 Å, and c = 10.69 Å [3], where c is along the long axis of the molecules. The parameters of the crystallites are reflected in the susceptibility tensor of THG. In a starch granule, the orderly arranged crystallites determine the polarization dependency of the measured THG signals.
Unlike SHG, THG is allowed in all kinds of material as long as the materials are transparent at the wavelengths involved. However, under a strong focusing condition such as in our experiment, all the THG generated before the focus will be reabsorbed coherently after the focus, due to the Gouy phase shift effect. Therefore, in practice, net THG emission is limited to an interface between two bulk materials that differ in dispersion or in third-order nonlinear susceptibility [20]. This is the reason why we can observe strong THG emission at the interface between starch crystallites and the environment (e.g., water). The abrupt refractive index contrast between the crystallites and the environment at a nanometer scale brakes the Gouy phase shift effect and appreciable THG signals are produced.
To model P-THG in starch granules, two coordinate systems are introduced (Figure 2): the laboratory frame (X-Y-Z), and the sample frame (x-y-z). The laser beam propagates along the laboratory Z-axis, and its electric field is linearly polarized in the X–Y plane. The polarization angle, denoted by α, is defined with respect to the X-axis and is varied systematically during THG intensity measurements.
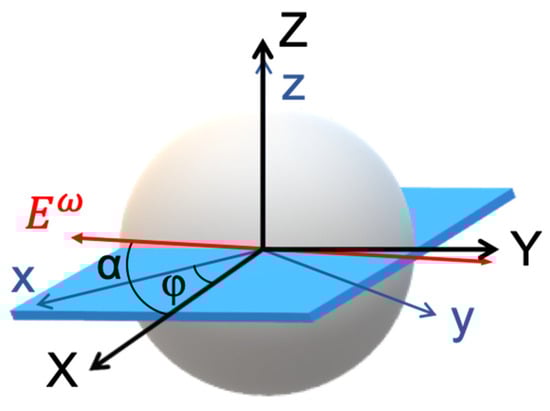
Figure 2.
Coordinate systems used in the theoretical description of polarization-dependent THG in starch granules. The schematic illustrates the relationship between the laboratory coordinate system (X–Y–Z) and the sample coordinate system (x–y–z). At the equatorial plane of the granule, where the molecular axes lie predominantly in the x–y plane, the sample and laboratory coordinate planes (x–y and X–Y, respectively) are considered parallel (z = Z). The excitation electric field is linearly polarized and rotates within the X–Y plane at an angle α relative to the X-axis. The orientation of the sample is defined by the angle φ, representing the rotation of the sample x-axis relative to the lab X-axis. This geometric configuration enables modeling of the P-THG signals in a system with radial molecular organization like in the starch granules.
Based on polarization-dependent SHG studies, starch granules exhibit radial molecular organization in both the shell and the core [11]. An equatorial plane of the granule, where the long axes of the starch molecules predominantly lie in the sample’s x–y plane (because of the radial organization), is considered. At this equator, the sample and laboratory planes are aligned such that z = Z, and the x–y plane of the sample is coplanar with the X–Y plane of the laboratory frame. The orientation of the sample frame with respect to the laboratory frame is defined by an in-plane rotation angle φ between the sample x-axis and the laboratory X-axis. In the sample frame, the incident electric field components are expressed as
where is the amplitude of the incident electric field. Effects such as birefringence and diattenuation due to scattering [21], and axial field components due to tight focusing [22], are neglected in this model for simplicity. The above analytical model assumes a pure transverse excitation field and does not account for the effect of high NA excitation. In [23], an analytical description of the effect of tight focusing in THG signals is presented.
The induced third-order nonlinear polarization () in the sample is governed by a third-order susceptibility tensor [24]. For convenience, the contracted notation is adopted where the index i ∈ {1,2,3} corresponds to x, y, and z, respectively, and the multi-index jkl is mapped to a single index m using standard nonlinear optics conventions [24]:
| jkl | xxx | yyy | zzz | yzz | yyz | xzz | xxz | xyy | xxy | xyz |
| m | 1 | 2 | 3 | 4 | 5 | 6 | 7 | 8 | 9 | 0 |
Because corn starch granules are SHG active (Figure S1), the orthorhombic crystal symmetry (mm2) that allows SHG [24] is chosen. Assuming the orthorhombic (mm2), as appropriate for corn starch [3,4], only a subset of the tensor components are non-zero. Specifically, the following nine elements contribute to the third-order response [19]: , , , , , , , . With these non-zero elements and the field components defined above, the third-order polarization in the sample can be explicitly calculated as a function of the input polarization angle α and the sample orientation φ:
where denotes the permittivity of free space. Substituting Equation (1) into Equation (2), we obtain
Then, in the laboratory coordinate system (X-Y-Z), the third-order polarization can be expressed as
The detected THG is given by
By combining Equations (3)–(5), the expression describing the P-THG response at the equator of a starch granule is derived as follows:
where
This forms the theoretical basis for interpreting the P-THG signal modulations measured experimentally in corn starch granules. Using the above notations, the anisotropy ratio (AR) is defined as follows:
The AR describes the ratio of the contribution of relative to the contribution of to the produced THG signal. This definition of AR has been previously used to characterize the in-plane anisotropy of 2D SnS materials [19]. While SHG originates (in both the shell and the core) from the amylopectin molecules [12], THG originates from crystallites, containing both amylopectin and amylose molecules. Thus, the AR defined above describes different harmonophores than the SHG anisotropy ratio. This is evident in the Supplementary Figure S1, where the contrast between THG and SHG is different for the same granules.
2.4. Arithmetic Simulations of P-THG Modulation
Figure 3 presents simulated polarization-dependent THG intensity profiles based on Equation (6), which models the angular modulation of the THG signal as a function of excitation polarization. These simulations explore the role of free parameters in shaping the modulation patterns observed in starch granules. In Figure 3a, the anisotropy ratio is set to AR = 1.3, and the remaining fitting parameters are fixed as A = 0.55, C = 0.3, and D = 0.4. The modulation curves are computed for sample orientations φ ranging from 0° to 180°, in steps of 20°. In Figure 3b, a different set of parameters is chosen as follows: AR = 1.1, A = 0.7, C = 0.3, and D = 0.5. Importantly, due to the symmetry of the underlying equation, the curves for φ = 0° and φ = 180° are identical in both simulation sets. This suggests that the modulation patterns possess a modulo of 180°. These simulations demonstrate how variations in the anisotropy ratio AR and other fitting parameters control the emergence of distinct modulation profiles, offering a robust means of distinguishing structurally different regions within starch granules.
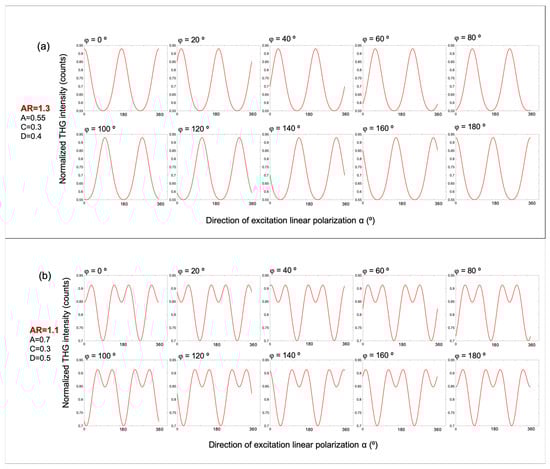
Figure 3.
Simulated polarization-dependent THG intensity profiles based on Equation (6), illustrating the effect of the anisotropy ratio AR and molecular orientation φ. (a) Simulated P-THG modulation curves for an anisotropy ratio AR = 1.3, with fixed parameters A = 0.5, C = 0.3, and D = 0.4. The molecular orientation angle φ varies from 0° to 180°, in 20° increments. (b) Corresponding simulations for AR = 1.1, with A = 0.7, C = 0.3, and D = 0.5. In both panels, the modulation curves for φ = 0° and φ = 180° are identical, reflecting the modulo of 180° in the calculation of angle φ.
To generate a P-THG modulation curve, the free parameters in Equation (6) are set to the following values: AR = 1.27, φ = 2°, A = 0.5, C = 0.5, and D = 0.28, as shown in Figure 4a. Interestingly, a similar modulation profile can be obtained with a different parameter set: AR = 0.79, φ = 92°, A = 0.9, C = 0.2, and D = 0.4 (Figure 4b). Likewise, a different modulation pattern is reproduced in Figure 4c using parameters AR = 1.1, φ = 97°, A = 0.7, C = 0.38, and D = 0.47, which closely resembles the result in Figure 4d, where the values are AR = 0.9, φ = 7°, A = 0.85, C = 0.43, and D = 0.33. These comparisons reveal that the modulation curves remain nearly invariant when φ is shifted by 90° and the anisotropy ratio is simultaneously inverted (i.e., AR→1/AR). This degeneracy suggests that when fitting the experimental data, the iteration algorithm might converge to two different sets of values for the free parameters in Equation (6), that nevertheless describe the same data. To resolve this ambiguity during data fitting, and to obtain comparable values for the free parameters, the criterion AR > 1 is imposed to the fitting algorithm.
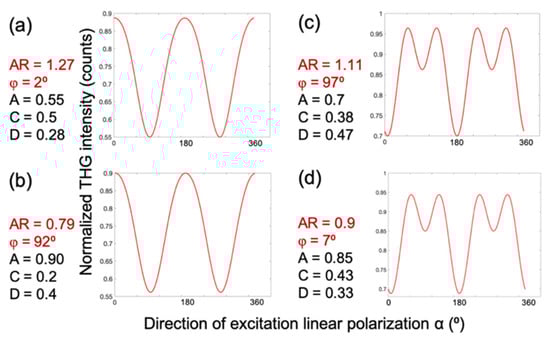
Figure 4.
Two sets of free parameters in Equation (6) describe the same P-THG data. The P-THG modulation curve for (a) molecular angle φ = 2° and AR = 1.27, is similar to the (b) molecular angle φ = 92° and AR = 0.79. The P-THG modulation curve for (c) molecular angle φ = 97° and AR = 1.11 is similar to the (d) molecular angle φ = 7° and AR = 0.9. Consequently, for the same experimentally retrieved P-THG data, the fitting algorithm might provide two different values for φ and AR. In order to solve this ambiguity and to obtain comparable values of the free parameters, we force the algorithm to provide fitting values with AR > 1.
3. Results and Discussion
Figure 5a shows the THG signal intensity from corn starch as a function of excitation laser power, plotted on a double logarithmic scale. The observed slope of approximately three confirms the cubic power-law dependence, characteristic of a third-order nonlinear optical process like THG [24].
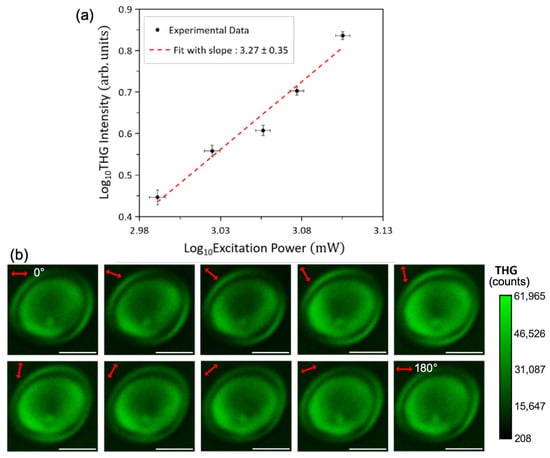
Figure 5.
Power-law dependency of detected signals and P-THG imaging microscopy of starch. (a) Log–log plot of the THG intensity from starch as a function of the incident pump power. Black data points with error bars represent the experimental measurements, while the red dotted line shows the linear fit. The slope of approximately three confirms the third-harmonic generation process. (b) Series of THG images acquired as the excitation linear polarization angle α (indicated by the red double arrow) is rotated from 0° to 180° in 20° increments. It is noted that the image when α is 0° is similar with the image when α is 180°, verifying the modulo of 180° described in the arithmetic simulations. Scale bars: 5 μm.
In Figure 5b, a series of THG images, produced by a corn starch granule, recorded while rotating the excitation linear polarization angle (indicated by the red double-arrow), between 0° and 180° with step 20°, is presented. The images clearly show that the THG signal intensity modulates as a function of the polarization angle . Notably, the image at α = 0° is identical to that at α = 180°, consistent with the modulo of 180° predicted by our simulations (see Figure 3a,b). The THG imaging is performed close to the equator of the granule and both the shell and the core of the granule can be clearly visualized. Importantly, the THG signals originating from the shell of the granule modulate in a different manner than those originating from the core of the granule. This behavior is more clearly demonstrated in Supporting Video S1, which shows 37 THG images acquired as α varies from 0° to 360° in 10° increments. The modulation patterns observed experimentally match well with our numerical simulations (Figure 3a,b), where different parameter sets in Equation (6) yield distinct P-THG modulation profiles.
To investigate this further, in Figure 6a, five points of interest (POIs) are selected in the shell and five POIs in the core of the granule. The POIs are selected by following the radial distribution of the molecules in the upper hemisphere of the granule. The lower hemisphere would provide similar P-THG curves because of the modulo 180° described in Figure 3. In Figure 6b, the P-THG modulations from each POI are presented (angle ϵ [0°, 360°], with a step of 10°). Then, the P-THG experimental data from each POI (Figure 6a) is fitted with Equation (6), using the criterion AR > 1, and the P-THG modulation curves shown in Figure 6b are obtained. The values of the free parameters AR, φ, A, C, and D of Equation (6), after fitting the P-THG experimental data with Equation (6), are presented in Table 1. As seen in Table 1, POIs 1–5, which belong to the shell of the granule, exhibited AR values greater than 1.25 whereas the POIs 6–10, which belong to the core of the granule, exhibited AR values less than 1.25.
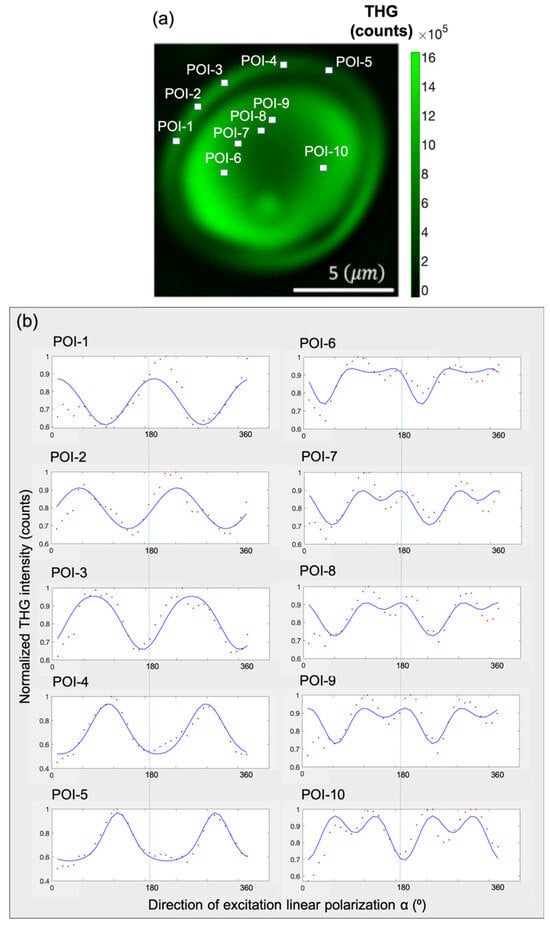
Figure 6.
Experimental P-THG from selected points-of-interest (POIs) and fitting with the model. (a) Composite image formed by summing all the THG images seen in Figure 5b. Five POIs are selected within the shell of the granule and five POIs within its core. (b) P-THG modulation curves for each POI, obtained by fitting the experimental data using Equation (6). The POIs 1–5 (shell), present different AR values from POIs 6–10 (core), highlighting the structural anisotropy between the two regions.

Table 1.
Values of the free parameters AR, φ, A, C, and D, obtained after fitting the experimental P-THG data of the POIs seen in Figure 6a, using Equation (6). The R2 denotes the quality of fitting.
Although fast analysis could be used [25], our analysis was implemented using a slow, iterative, nonlinear least square fitting algorithm written in Python 3.13 (500 iteration per pixel and starting points A = 1, AR = 1, C = 1, D = 1, φ = 90°). For the analysis presented in the Supplementary Materials, an iterative least square fitting algorithm written in MATLAB (the MathWorks Inc. 2019b) was utilized, using 500 iterations per pixel and starting points A = 1, AR = 1, C = 1, D = 1 and φ = 90°. Figure 7a presents a pixel-by-pixel map of the molecular orientation angle φ, obtained by fitting the experimental data from Video S1 using Equation (6). The color scale represents molecular angles from 0° (blue, left side) to 180° (red, right side), illustrating a clockwise evolution of orientation consistent with the rotation of the excitation linear polarization. This continuous color progression across the shell indicates a radial molecular arrangement. Notably, on the right side of the granule, red regions (φ ≈ 180°) are immediately followed by blue regions (φ ≈ 0°). This apparent discontinuity arises from the modulo of 180° in the P-THG signal described in Figure 3a. Since φ and φ + kπ (where k is an integer) produce identical P-THG responses, molecular orientations between 180° and 360° are effectively mapped to the 0–180° range. For example, φ = 190° is equivalent to φ = 10°, and φ = 360° is equivalent to φ = 180°.
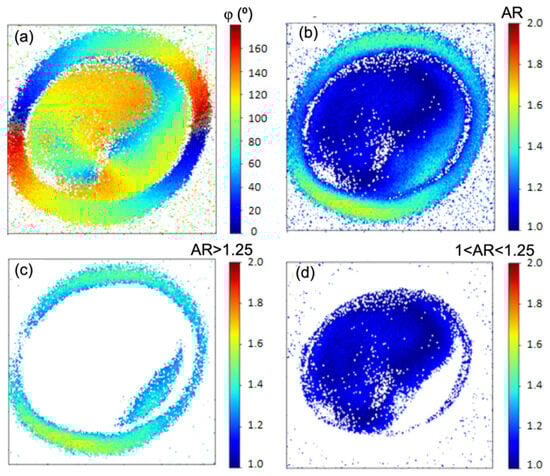
Figure 7.
Pixel-by-pixel mapping of the molecular orientation angle and the anisotropy ratio. (a) Pixel-wise map of the molecular orientation angle φ. The evolution of the colors in the granule shows a radial distribution of the molecular structures. (b) Pixel-wise map of the anisotropy ratio AR. (c) Mapping of regions with AR > 1.25, highlighting the shell of the granule. (d) Mapping of regions with 1 < AR < 1.25 exposes the core of the granule.
Moreover, in Figure 7a, the molecular orientation in the core appears less uniform, likely reflecting deviations from perfect radial molecular arrangement in the granule. Moreover, it is noted that the evolution of the molecular directions in the core has an ~90° shift with the evolution of the molecular directions in the shell. This is the result of the anisotropic P-THG behavior of the granule between the shell and its core.
In Figure 7b where a map of the AR parameter is presented, it is noted that the shell predominantly presents AR values bigger than 1.25, while the core of the granule shows mainly AR < 1.25. In Figure 7c, by selecting pixels with AR > 1.25, the shell of the granule is exposed, while in Figure 7d, for 1 < AR < 1.25, the core of the granule is exposed. In the shell (Figure 7c), the mean of the AR values is <AR> = 1.37, with standard deviation σ = 0.11, while in the core <AR> = 1.14 with σ = 0.06. The <AR> = 1.37 in the shell implies that the contributes 1.37 times more in THG, than the , while the <AR> = 1.14 in the core of the granule implies that the contributes 1.14 times more in THG, than the . Any effect on the calculation of the AR, introduced by the high NA of our excitation objective (NA = 1.3) is minimized by the use of the higher NA = 1.4 collection condenser [26]. While the absolute values of the extracted AR may be influenced by the model simplification, the comparative analysis between shell and core remains valid. Any systematic error introduced by the high-NA focusing affects both regions similarly, as they are imaged under identical optical conditions. Therefore, the relative difference in AR between shell and core is a robust indicator of their relative structural anisotropy. In order to examine the effect of the tilted off the plane molecules in P-THG measurements, we performed P-THG in different z-planes of a granule (Figure S3). It is observed that the mean AR values slightly change between different z-planes. Nevertheless, the shell–core anisotropy contrast is present between different z-planes, because the tilted off plane molecules are affecting the AR values of both the shell and the core of the granule.
In Figure 8 and in Video S2, P-THG imaging is presented in another corn starch granule, yielding similar results with those presented above. Analytically, in Figure 8a, a pixel-wise map of the angle and AR is presented, where in the core, a −90° shift change is applied in the angle and the substitution AR = 1/AR is applied in the AR. This approach is supported by the simulations, as discussed in Figure 4. By comparing Figure 8b showing the angle , with Figure 8c showing −90° in the core, we note that the shift −90° “aligns” the evolution of angles in the core with the evolution of angles in the shell. The new AR values in the core (Figure 8e) are now lower than 1, with mean value 0.88 and standard deviation 0.06. Considering the orthorhombic symmetry of the A-type starch crystallite, the principal axes of its susceptibility tensor are expected to coincide with the unit cell axes (a, b, c). The relative magnitude of the diagonal tensor components along these axes, such as and , is influenced by the structural anisotropy of the unit cell. In our experimental geometry, with the granule’s radial structure aligning the crystallite’s c-axis along our x-direction and the a-axis along y, we find that the ratio of the corresponding unit cell parameters, c/a = 0.91, is in remarkable agreement with the polarization-resolved THG anisotropy ratio <> = 0.88 ± 0.06 retrieved from our measurements. While the observed THG signal originates primarily at the interfaces due to refractive index contrast [20], its polarization dependence is dictated by the anisotropic of the starch crystallites. Therefore, this correlation suggests that the measured THG AR directly probes the structural anisotropy of the underlying nanocrystalline unit cells in the granule’s core. In the shell, the AR values are larger than 1.25 (in both Figure 8f,g); thus, .
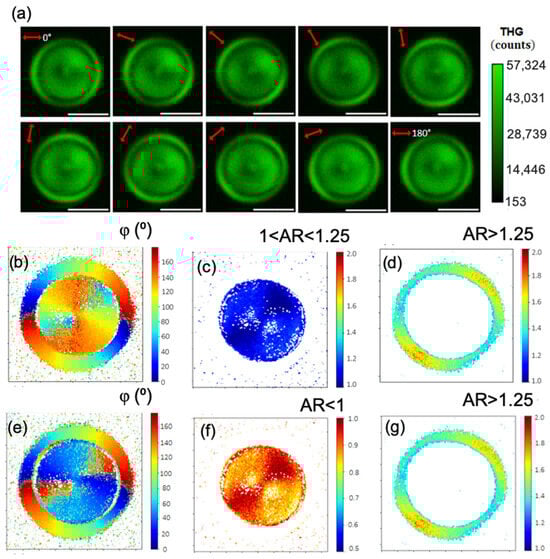
Figure 8.
P-THG analysis of another corn starch granule. (a) Series of THG images acquired as the excitation linear polarization (indicated by the red double arrow) is rotated from 0° to 180° in 20° increments. Scale bars: 5 μm. (b) Mapping of the angle , after pixel-wise fitting of the images seen in Video S2 with Equation (6). (c) Pixel-wise map of the AR. Mapping of regions with 1 < AR < 1.25 highlights the core of the granule. (d) Mapping of regions with AR > 1.25 reveals the shell of the granule. (e) Mapping of the angle , where a −90° shift was applied in the core. This choice of solutions “aligned” the evolution of the angles in the shell with the evolution of the angles in the core. (f) Mapping of the AR after the substitution AR = 1/AR in the core of the granule. (g) In the shell, there is no substitution of AR; consequently, it remains that AR > 1.25.
The crystallites in the shell have dominant (AR > 1) while the crystallites in the core have dominant (AR < 1). There is an interchange of the dominant element contribution in the THG signal between the shell and the core.
In the above examples, the mean AR values in the shells of the granules are different than the mean AR values in the cores. This directly implies that the molecular structure in the shells differs from the molecular structure in the cores of the granules. This is in agreement with [27], where it was demonstrated that smaller blocklets are compacted densely to form the stiffer outer shell, and the larger regular blocklets are packed loosely to form the inner shells in potato starch. It is also in agreement with [28], where it was shown that in rice starch the inner shell blocklets are different from the outer shell blocklets. The fact that the “ghost” envelope structure of granules discussed above, has a different structure than the core [7], is clearly reflected in the AR values of polarization-dependent THG microscopy. Additionally, in the Supplementary Materials, a detailed comparison between P-THG and P-SHG in the same starch granules is presented (Figure S1).
4. Conclusions
In this study, the structural anisotropy between the shell and the core of corn starch granules is probed using P-THG microscopy. By rotating the direction of the excitation linear polarization, the THG signals originating from the shell modulate in a different manner than the THG signals originating from the core of the granules. A theoretical framework is developed, which describes the P-THG using orthorhombic symmetry, characteristic of corn starch. After pixel-by-pixel fitting of the model and rendering of the retrieved molecular angles, the radial distribution of the molecules is revealed. An anisotropy ratio, AR = /, which compares the contribution of the to the THG signals with the contribution of the , is introduced. The structural anisotropy between the shell and the core is reflected in the AR. By segmenting the values of the AR, the shell and core are discriminated, probing their different molecular architecture. This work provides a label-free methodology to identify structural anisotropy in biological samples and demonstrates how P-THG contrast can reveal different molecular arrangements, beyond what is accessible through intensity-only THG microscopy. The P-THG technique offers fertile ground for future studies on the spatial identification of structurally anisotropic domains in other THG-active ensembles of biomolecules or in complex biological systems like tissues, where structural anisotropy may correlate with function or pathology. Variations in the size and orientational order of nanocrystalline domains are expected to provide sharp contrast in P-THG orientations and AR images. A key future advancement will be the fast, large-area acquisition of 3D anisotropy maps, positioning P-THG as a powerful label-free technique for optical characterization.
Supplementary Materials
The following supporting information can be downloaded at https://www.mdpi.com/article/10.3390/photonics13010016/s1; Supplementary Materials document, Video S1: P-THG starch 1; Video S2: P-THG starch 2.
Author Contributions
Conceptualization, S.P.; Methodology, L.M. and S.P.; Software, M.K. and S.P.; Validation, E.S. and S.P.; Formal analysis, M.K. and S.P.; Investigation, M.K., L.M. and S.P.; Resources, L.M., E.S. and S.P.; Data curation, M.K. and S.P.; Writing—original draft, M.K., L.M. and S.P.; Writing—review & editing, M.K., L.M., E.S. and S.P.; Visualization, E.S. and S.P.; Supervision, E.S. and S.P.; Project administration, E.S. and S.P.; Funding acquisition, M.K., E.S. and S.P. All authors have read and agreed to the published version of the manuscript.
Funding
This work was funded by the project MAYA—Project number: 014772. This project is carried out within the framework of the National Recovery and Resilience Plan Greece 2.0, funded by the European Union—NextGenerationEU (Implementation body: HFRI).
Data Availability Statement
Data underlying the results presented in this study are not publicly available at this time but may be obtained from the authors upon reasonable request.
Acknowledgments
Maria Kefalogianni acknowledges the project Brainprecision—TAEDR-0535850. This project is carried out within the framework of the National Recovery and Resilience Plan Greece 2.0, funded by the European Union—NextGenerationEU. Sotiris Psilodimitrakopoulos acknowledges the project MAYA—Project number: 014772. This project is carried out within the framework of the National Recovery and Resilience Plan Greece 2.0, funded by the European Union—NextGenerationEU (Implementation body: HFRI).
Conflicts of Interest
The authors declare no conflicts of interest.
References
- Gallant, D.J.; Bouchet, B.; Baldwin, P.M. Microscopy of starch: Evidence of a new level of granule organization. Carbohydr. Polym. 1997, 32, 177–191. [Google Scholar] [CrossRef]
- Gallant, D.J.; Bouchet, B.; Buleon, A.; Perez, S. Physical characteristics of starch granules and susceptibility to enzymatic degradation. Eur. J. Clin. Nutr. 1992, 46, S3–S16. [Google Scholar] [PubMed]
- Rodriguez-Garcia, M.E.; Hernandez-Landaverde, M.A.; Delgado, J.M.; Ramirez-Gutierrez, C.F.; Ramirez-Cardona, M.; Millan-Malo, B.M.; Londoño-Restrepo, S.M. Crystalline structures of the main components of starch. Curr. Opin. Food Sci. 2021, 37, 107–111. [Google Scholar] [CrossRef]
- Ouyang, Q.; Wang, X.; Xiao, Y.; Luo, F.; Lin, Q.; Ding, Y. Structural changes of A-, B- and C-type starches of corn, potato and pea as influenced by sonication temperature and their relationships with digestibility. Food Chem. 2021, 358, 129858. [Google Scholar] [CrossRef]
- Oostergetel, G.T.; van Bruggen, J.E.F. The crystalline domains in potato starch granules are arranged in a helical fashion. Carbohydr. Polym. 1993, 21, 7–12. [Google Scholar] [CrossRef]
- Prentice, D.R.M.; Stark, J.R.; Gidley, M.J. Granule residues and ‘ghosts’ remaining after heating A-type barley starch granules in water. Carbohydr. Res. 1992, 227, 121–130. [Google Scholar] [CrossRef]
- Obanni, M.; BeMiller, J.N. Ghost microstructures of starch from different botanical sources. Cereal Chem. 1996, 73, 333–337. [Google Scholar]
- de Miranda, J.A.T.; de Carvalho, L.M.J.; de Macedo Vieira, A.C.; Castro, I.M.D. Scanning electron microscopy and crystallinity of starches granules from cowpea, black and carioca beans in raw and cooked forms. Braz. Food Sci. Technol. 2019, 39, 718–724. [Google Scholar] [CrossRef]
- Martínez-Sanz, M.; Gidley, M.J.; Gilbert, E.P. Application of X-ray and neutron small angle scattering techniques to study the hierarchical structure of plant cell walls: A review. Carbohydr. Polym. 2015, 125, 120–134. [Google Scholar] [CrossRef]
- Kovrlija, R.; Rondeau-Mouro, C. Multi-scale NMR and MRI approaches to characterize starchy products. Food Chem. 2017, 236, 2–14. [Google Scholar] [CrossRef] [PubMed]
- Psilodimitrakopoulos, S.; Amat-Roldan, I.; Santos, S.; Mathew, M.; Anisha Thayil, K.N.; Zalvidea, D.; Artigas, D.; Loza-Alvarez, P. Starch granules as a probe for the polarization at the sample plane of a high resolution multiphoton microscope. In Proceedings of the SPIE Photonics West, San Jose, CA, USA, 19–24 January 2008; Volume 6860, p. 68600E. [Google Scholar]
- Psilodimitrakopoulos, S.; Amat-Roldan, I.; Loza-Alvarez, P.; Artigas, D. Estimating the helical pitch angle of amylopectin in Starch using polarization second harmonic generation microscopy. J. Opt. 2010, 12, 084007. [Google Scholar] [CrossRef]
- Psilodimitrakopoulos, S.; Amat-Roldan, I.; Loza-Alvarez, P.; Artigas, D. Effect of molecular organization on the image histograms of polarization SHG microscopy. Biomed. Opt. Express 2012, 3, 2681–2693. [Google Scholar] [CrossRef]
- Cisek, R.; Tokarz, D.; Kontenis, L.; Barzda, V.; Steup, M. Polarimetric second harmonic generation microscopy: An analytical tool for starch bioengineering. Starch-Staerke 2018, 70, 1700031. [Google Scholar] [CrossRef]
- Chouët, A.; Chevallier, S.; Fleurisson, R.; Loisel, C.; Dubreil, L. Label-free fried starchy matrix: Investigation by harmonic generation microscopy. Sensors 2019, 19, 2024. [Google Scholar] [CrossRef]
- Psilodimitrakopoulos, S.; Gavgiotaki, E.; Melessanaki, K.; Tsafas, V.; Filippidis, G. Polarization second harmonic generation discriminates between fresh and aged, starch-based adhesives used in cultural heritage. Microsc. Microanal. 2016, 22, 1072–1083. [Google Scholar] [CrossRef]
- Morizet, J.; Ducourthial, G.; Supatto, W.; Boutillon, A.; Legouis, R.; Schanne-Klein, M.-C.; Stringari, C.; Beaurepaire, E. High-speed polarization-resolved third-harmonic microscopy. Optica 2019, 6, 385–388. [Google Scholar] [CrossRef]
- Waigh, T.A.; Hopkinson, I.; Donald, A.M.; Butler, M.F.; Heidelbach, F.; Riekel, C. Analysis of the native structure of starch granules with X-ray microfocus diffraction. Macromolecules 1997, 30, 3813–3820. [Google Scholar] [CrossRef]
- Maragkakis, G.M.; Psilodimitrakopoulos, S.; Mouchliadis, L.; Sarkar, A.S.; Lemonis, A.; Kioseoglou, G.; Stratakis, E. Anisotropic Third Harmonic Generation in 2D Tin Sulfide. Adv. Opt. Mater. 2024, 12, 2401321. [Google Scholar] [CrossRef]
- Schins, J.M.; Schrama, T.; Squier, J.; Brakenhoff, G.J.; Müller, M. Determination of material properties by use of third-harmonic generation microscopy. J. Opt. Soc. Am. B 2002, 19, 1627–1634. [Google Scholar] [CrossRef]
- Gusachenko, I.; Latour, G.; Schanne-Klein, M.-C. Polarization-resolved second harmonic microscopy in anisotropic thick tissues. Opt. Express 2010, 18, 19339–19352. [Google Scholar] [CrossRef] [PubMed]
- Teulon, C.; Gusachenko, I.; Latour, G.; Schanne-Klein, M.-C. Theoretical, numerical and experimental study of geometrical parameters that affect anisotropy measurements in polarization-resolved SHG microscopy. Opt. Express 2015, 23, 9313–9328. [Google Scholar] [CrossRef]
- Cheng, J.-X.; Xie, X.S. Green’s function formulation for third-harmonic generation microscopy. J. Opt. Soc. Am. B 2002, 19, 1604–1610. [Google Scholar] [CrossRef]
- Boyd, R.W. Nonlinear Optics, 2nd ed.; Elsevier: Amsterdam, The Netherlands, 2003. [Google Scholar]
- Hristu, R.; Fereidouni, F.; Stanciu, S.G.; Eftimie, L.G.; Voinea, O.C.; Rutkauskas, D.; Sironi, L.; Chirico, G.; Tranca, D.E.; Glogojeanu, R.R.; et al. CollagenFitJ, a FIJI plugin for the quantification of collagen in polarization-resolved second harmonic generation image sets. Adv. Photonics Nexus 2025, 4, 037001. [Google Scholar] [CrossRef]
- Sandkuijl, D.; Tuer, A.E.; Tokarz, D.; Sipe, J.E.; Barzda, V. Numerical second- and third-harmonic generation microscopy. J. Opt. Soc. Am. B 2023, 30, 382–395. [Google Scholar] [CrossRef]
- Huang, J.; Wei, N.; Li, H.; Liu, S.; Yang, D. Outer shell, inner blocklets, and granule architecture of potato starch. Carbohydr. Polym. 2014, 103, 355–358. [Google Scholar] [CrossRef]
- Ma, M.; Xu, Z.; Chen, X.; Zhang, C.; Liu, Z.; Cantre, D.; Li, H.; Sui, Z.; Corke, H. Architecture of outer shell and inner blocklets of rice starch granule is related to starch granule-associated proteins. Food Hydrocoll. 2022, 127, 107551. [Google Scholar] [CrossRef]
Disclaimer/Publisher’s Note: The statements, opinions and data contained in all publications are solely those of the individual author(s) and contributor(s) and not of MDPI and/or the editor(s). MDPI and/or the editor(s) disclaim responsibility for any injury to people or property resulting from any ideas, methods, instructions or products referred to in the content. |
© 2025 by the authors. Licensee MDPI, Basel, Switzerland. This article is an open access article distributed under the terms and conditions of the Creative Commons Attribution (CC BY) license.