1. Introduction
In recent years, due to its high transmission rate, strong security, license-free spectrum, and broad bandwidth, FSO technology has seen widespread adoption and rapid development in the field of communications [
1,
2,
3,
4,
5,
6,
7,
8,
9,
10]. As a technology which utilizes optical carriers to transmit data through unguided media [
11], FSO system performance is susceptible to factors such as atmospheric turbulence and pointing errors, leading to random fluctuations in received optical power and consequently degrading the effective SNR of the link [
12,
13,
14]. Among these, atmospheric turbulence—induced by variations in atmospheric pressure and temperature—has a particularly significant impact on system performance [
3,
15].
In FSO systems employing intensity modulation/direct detection (IM/DD) and OOK modulation, turbulence-induced intensity scintillation causes substantial detection errors at the receiver, severely limiting system performance [
16]. Notably, OOK systems often exhibit a BER floor phenomenon, where the BER fails to drop below a certain threshold even at high SNR [
17]. To address this issue, prior studies have proposed maximum likelihood (ML) detection and maximum likelihood sequence detection (MLSD) methods based on channel models and temporal correlation information, with their performance advantages validated through simulations [
16,
18]. However, these schemes require precise channel estimation and face challenges such as high computational complexity and implementation difficulties, which become increasingly critical under the growing demand for high data rates [
19,
20,
21,
22,
23,
24,
25]. In addition, its practical implementation in engineering is very difficult.
Based on the characteristics of adjacent symbol variations for modulation and decision, DMD can be applied to address the BER floor in OOK at high SNR and the engineering challenges of complex modulation [
26]. This paper analyzes the performance of the DMD method under various channel scenarios. Various advantages of DMD are analyzed in our research for practical applications. Our research reveals the intersection point (performance advantage point) in the BER curves of DMD and OOK. Although DMD performs modestly under low-SNR conditions, its performance surpasses the BER floor limitation in high-SNR regions, demonstrating a clear advantage over OOK. Importantly, as the scintillation index increases, this performance advantage point shifts toward lower SNR values. To explain this phenomenon, we carry out theoretical research into SNR variation with scintillation index through analytical and numerical methods. The results validate its effectiveness through experiments and analysis. Additionally, in FSO systems, modulation depth fluctuations significantly impact communication performance [
27,
28,
29,
30], degrading BER in amplitude-modulated systems. The results demonstrate that the proposed DMD exhibits unique advantages, considering the impact of the modulation depth. Even under low-modulation-depth conditions, DMD maintains a significant BER advantage over OOK at high SNR. Our further investigation also shows that in the same environmental conditions, the system performance of DMD improves with increasing symbol rate, especially at high SNR. This characteristic enables DMD to enhance system performance without requiring complex channel state estimation or other adaptive adjustments.
This paper systematically investigates the application of differential modulation and detection techniques in an FSO system. It also identifies the performance advantages of the DMD method compared to the conventional OOK method and provides both theoretical analysis and experimental validation for this phenomenon. The research focuses on three key mechanisms, including the performance advantage point of DMD compared to OOK, the impact of modulation depth on DMD communication performance, and the influence of symbol rate on the system performance of DMD. Also, an experimental investigation is conducted to validate the theoretical analysis.
2. Theoretical Investigation of Differential Modulation and Detection
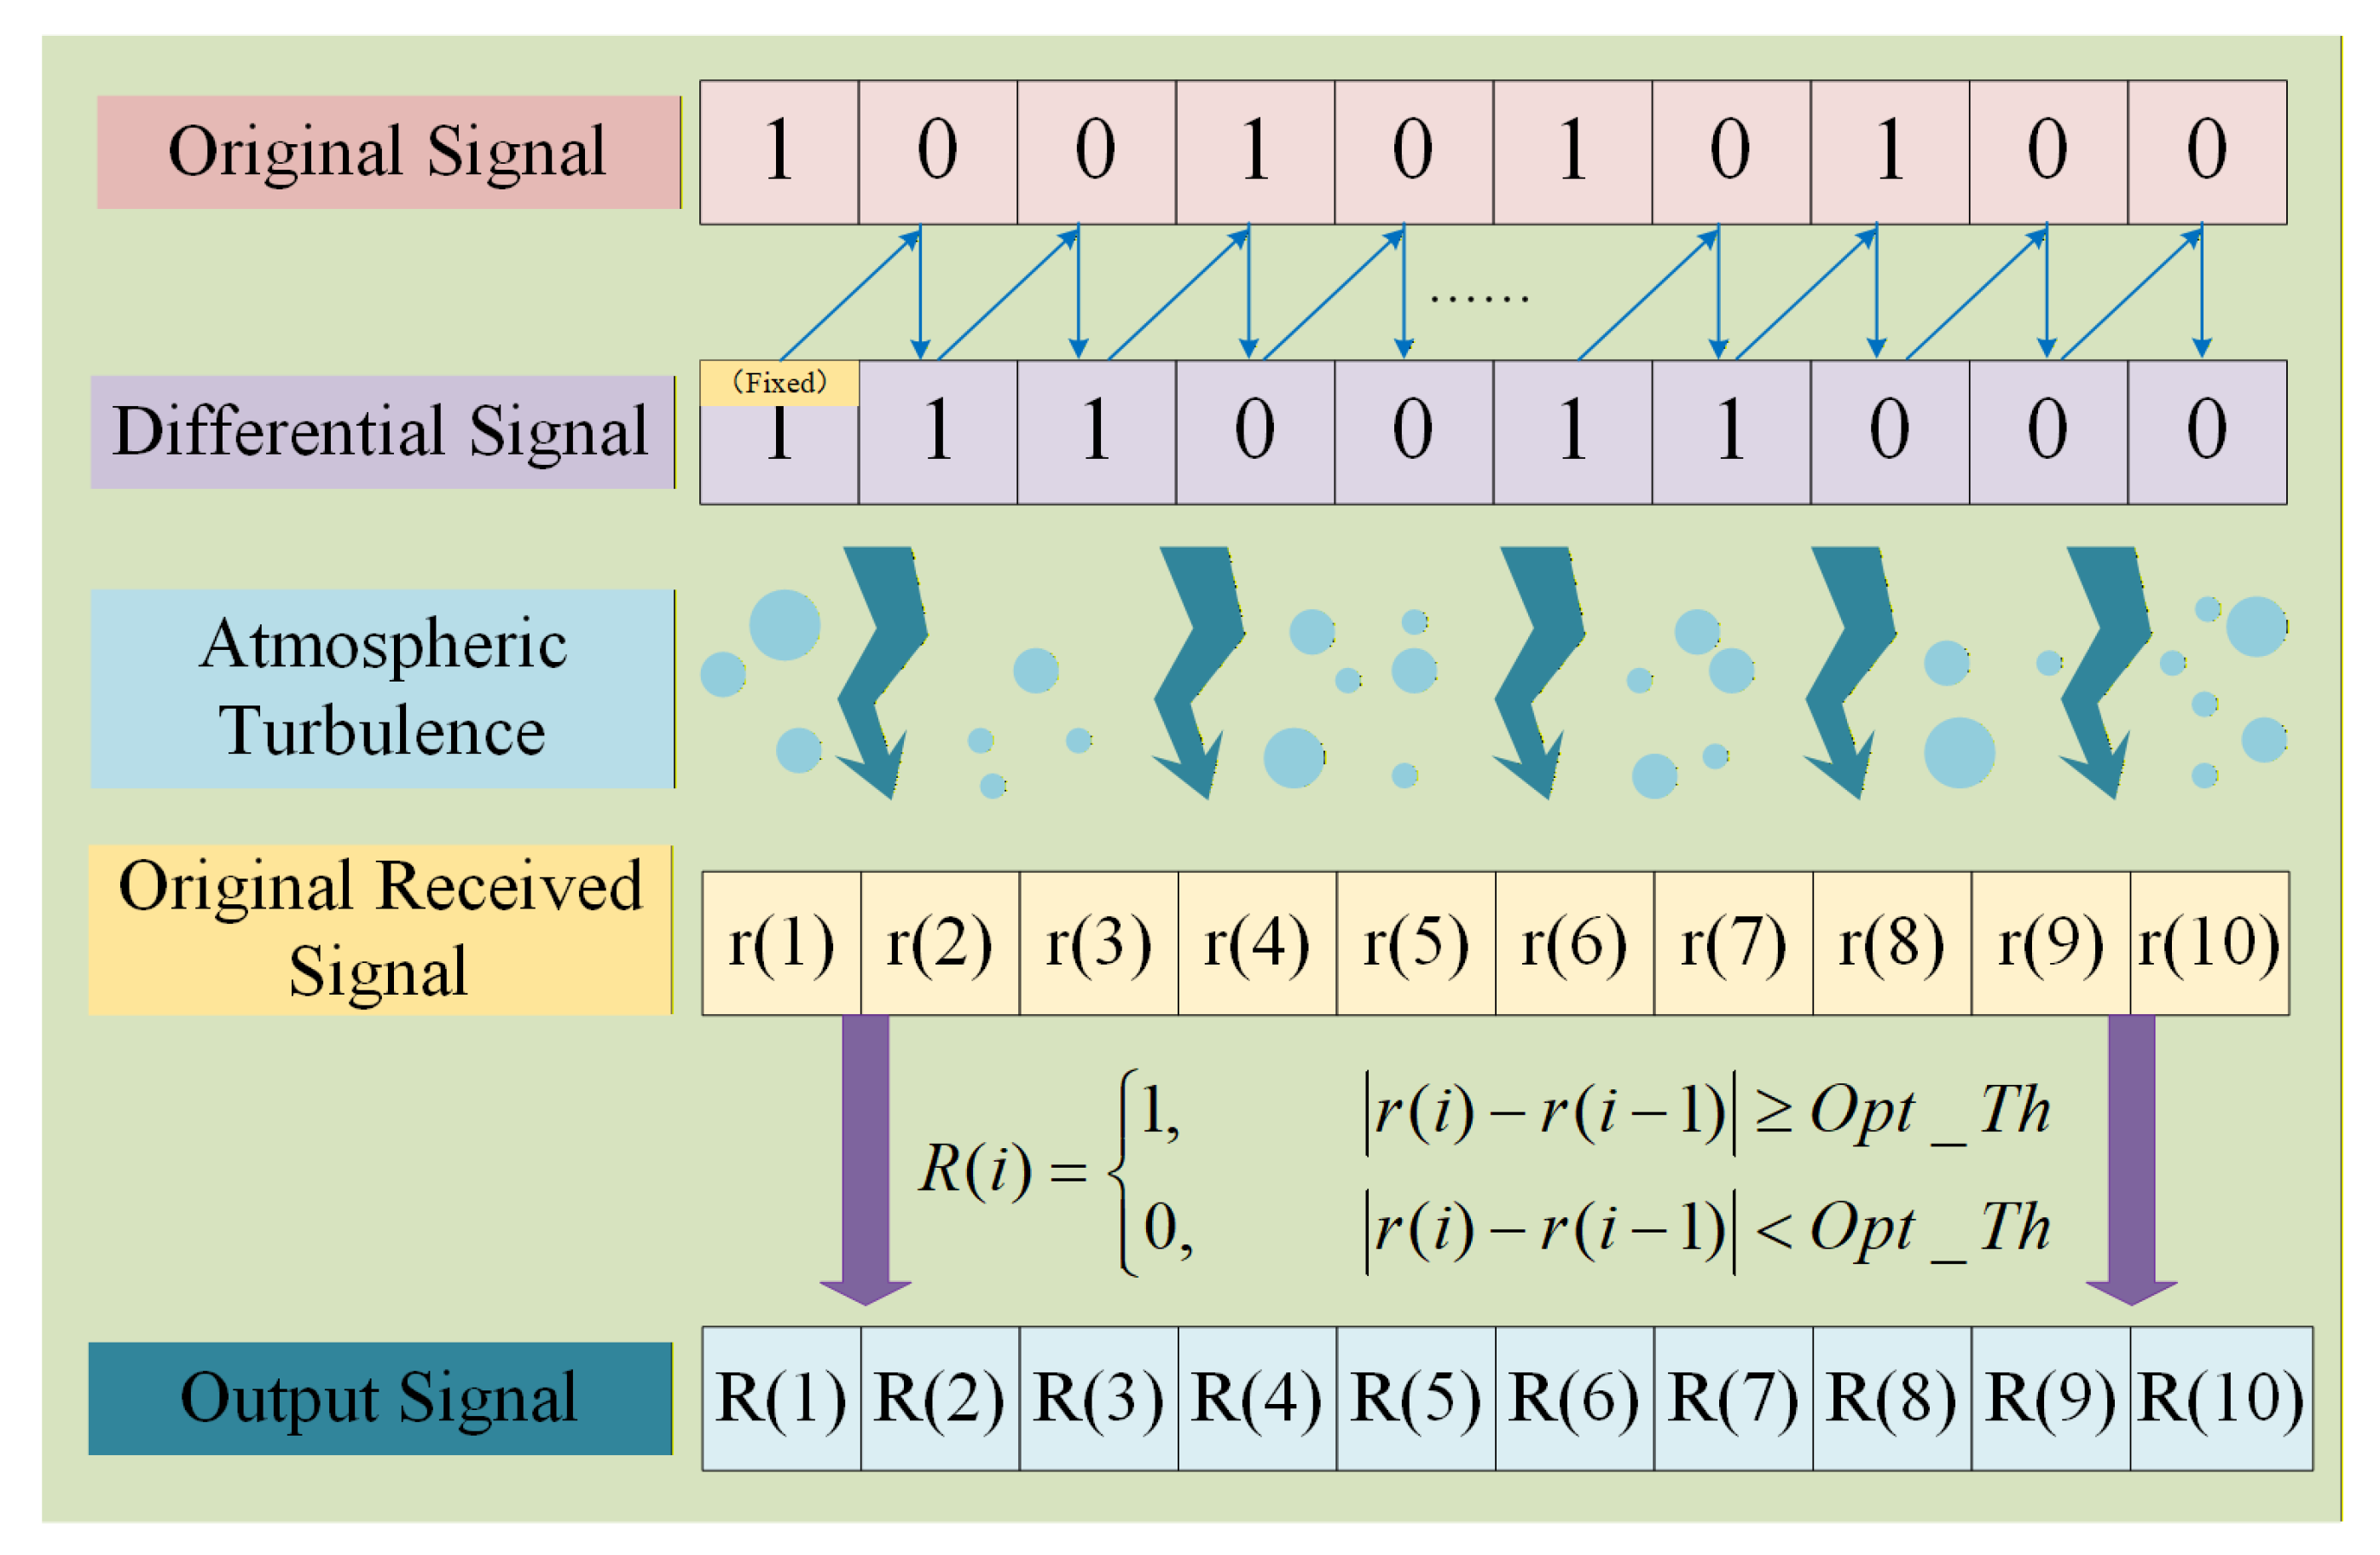
Figure 1 demonstrates the basic working principle of DMD. The original received signal at the receiver can be expressed as
Here, represents the intensity fluctuation and denotes the signal after differential modulation. represents the additive white Gaussian noise (AWGN), which follows a normal distribution with a mean of 0 and variance of . To implement differential detection, we need the current received signal value and its preceding symbol value .
In this study, we assume that the channel is quasi-static. This assumption is derived from our analysis of actual atmospheric turbulence data. From our research, we can observe that atmospheric turbulence has a significant number of low-frequency components, primarily concentrated below 1000 Hz. In the system, the communication rate of the DMD method remains above 20K Hz, which is far greater than 1000 Hz. Therefore, this assumption is reasonably valid. So it stands that
. Therefore, the differential signal can be derived as
At the detection end, the received signal is identified by comparing the difference between two consecutive symbols. If the difference exceeds the decision threshold, it is decided as bit “1”; otherwise, it is decided as bit “0”. At the receiver, the optimal decision threshold
is derived by leveraging channel characteristics. The received signal
is then obtained by comparing the absolute difference between consecutive symbols
with
, as follows:
At the receiver, two types of detection errors may occur:
False “1”: When bit 0 is transmitted but incorrectly decoded as 1.
False “0”: When bit 1 is transmitted but incorrectly decoded as 0.
The corresponding error probabilities are, respectively, expressed as
However, the existence of threshold currents in lasers leads to variations in modulation depth for the DMD in practical experiments. Modulation depth refers to the extent to which the optical intensity of a light signal changes after modulation, compared to its original state. It is generally used to describe the proportion of variation in light intensity. Thus, the expression for modulation depth is . represents the minimum optical intensity during modulation (the low level or ‘0’ of the signal) and can be expressed as . While this has no effect on the transmission of bit “1”, it causes bit “0” to be transformed into “”, which presents the depth of the modulation.
Equation (
7) represents the probability of misjudgment where the transmitted symbol is ‘1’, but it is judged as ‘0’ at the decision stage. Therefore, at the decision instant, the modulation depth has an impact on the symbol ‘0’. Consequently, the aforementioned equation requires modification as follows:
For the analysis of error probability, the following treatments are applied in our research. In this paper, the logarithm of the intensity fluctuation follows a normal distribution with a mean of 1 and variance of
. The intensity fluctuations (due to turbulence) are modeled as a Gamma–Gamma distribution. The atmospheric turbulence channel is modeled as [
31]
is the Gamma function.
is the modified Bessel function of the second kind.
and
are two parameters that characterize the intensity of the scintillation index, defined as [
32].
Here,
represents the scintillation index of atmospheric turbulence. The additive white Gaussian noise (AWGN) is characterized by a zero-mean Gaussian distribution with variance of
. For
, the differential signal
(under the null hypothesis) follows a zero-mean Gaussian distribution with variance
. To express
in Equation (
7) more accurately, it can be rewritten as
. Here,
can be expressed as
.
Therefore,
and
can be further expressed as
When the number of transmitted and received signal symbols is sufficiently large, the probability of erroneous judgment can be equivalently treated as the bit error rate (BER). Therefore, the total BER (probability of erroneous judgment)
P is
Here,
and
represent the probabilities of transmitting the symbol “1” and the symbol “0” in the entire signal, respectively. Since the number of transmitted symbols is sufficiently large, we can assume that
. Therefore, the total bit error rate (or probability of erroneous judgment)
P can be expressed as [
26]
The total bit error rate
P can be regarded as a function of
[
26]. Thus, taking the partial derivative of
P with respect to
, if the partial derivative function
has a zero point (
), this indicates that
has a critical point. Since
is a continuous function, the minimum BER (
) must satisfy
Here, by solving for the zero point of the partial derivative function , the optimal decision threshold can be determined, thereby minimizing the bit error rate.
3. Experimental Setup and Analysis
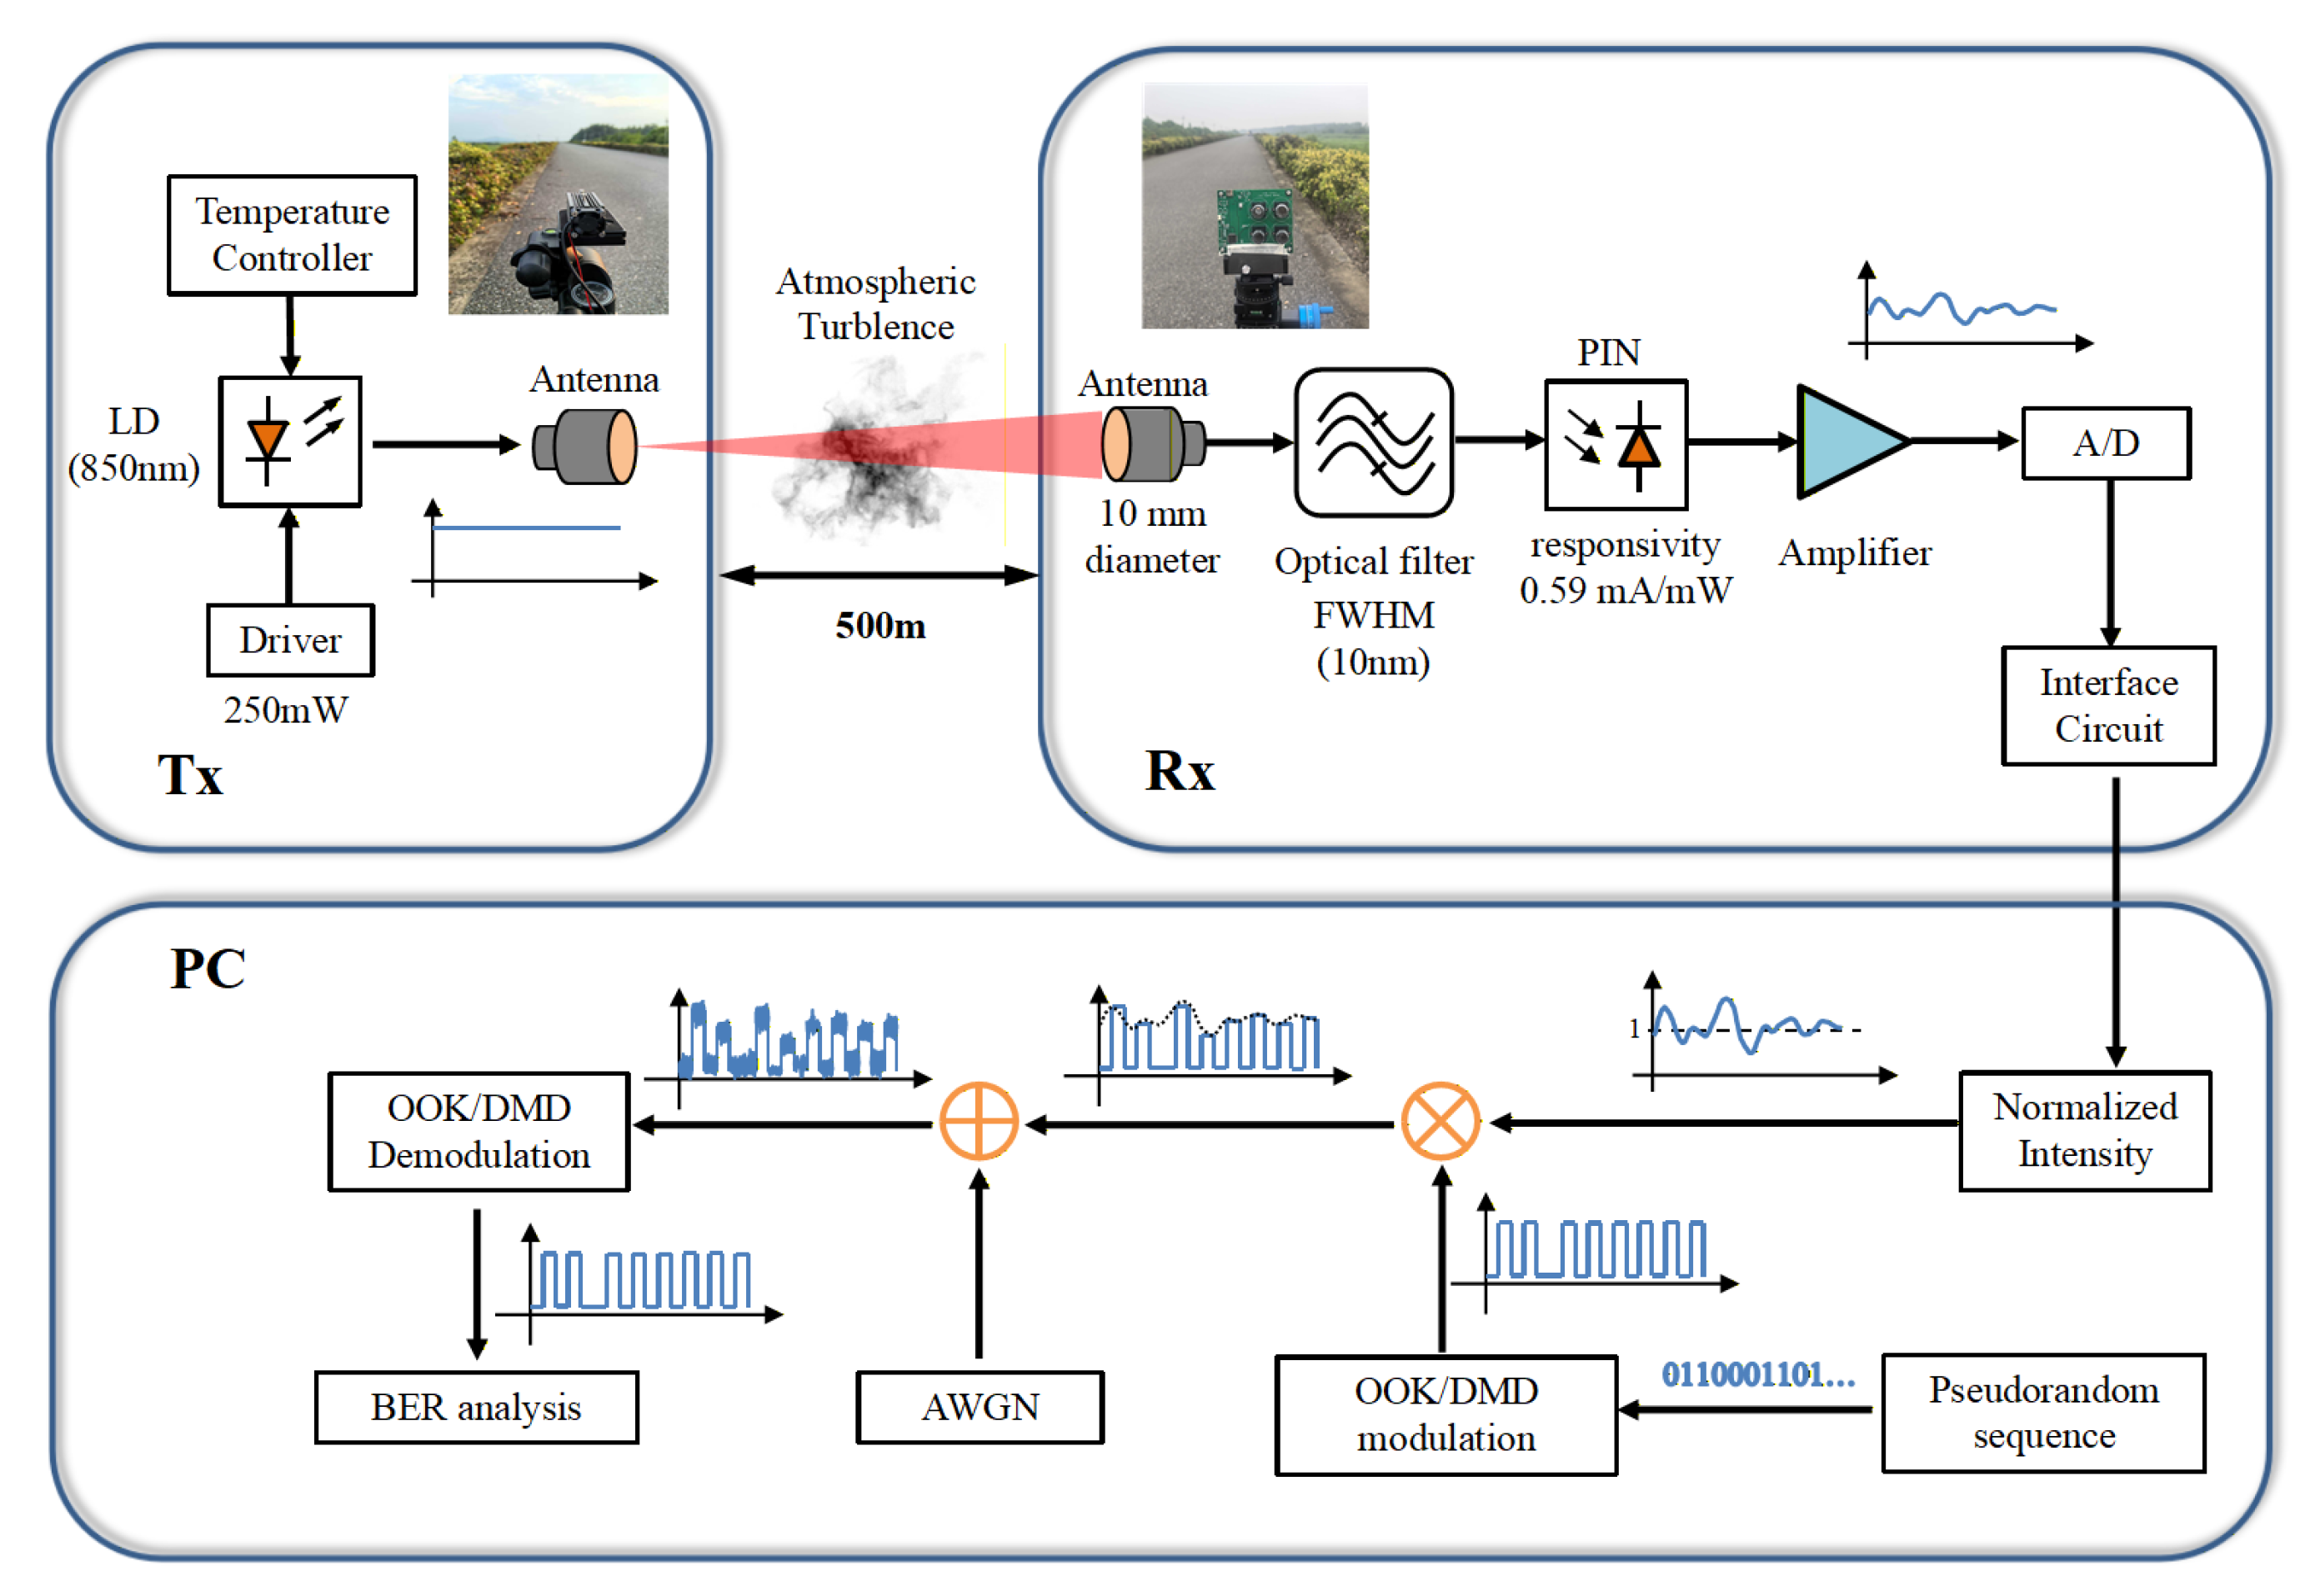
The experimental platform setup is illustrated in
Figure 2. The experiment was conducted in an outdoor environment with a transmission distance of 500 m between the transmitter and the receiver.
The system primarily consists of four components, including the transmitter, the channel, the receiver, and the PC terminal. The transmitter incorporates a power supply and an 850 nm infrared laser source, and the laser source has a transmission power of 250 mW with a beam divergence of 1 mrad. The receiver assembly includes a lens of 10 mm in diameter, an optical filter, a PIN PD with a responsivity of 0.59 mA/mW, an amplifier circuit, an analog-to-digital converter (ADC) module, and an interface circuit. The optical filter is an interference-coated optical filter with a full width at half maximum (FWHM) of 10nm. In addition, the ADC has a resolution of 16 bits.
At the transmitter, the driver provides a current to power the LD and the temperature controller controls the temperature of the laser emission. The optical beam is then transmitted into the atmospheric turbulence channel via the transmitting antenna. At the receiver, the beam is collected and focused onto the PIN by the receiving antenna. The received signal goes through an optical filter and amplifier before being converted into digital electrical signals by the ADC. It is then processed for diversity reception and stored internally. Finally, the signal is transmitted via the interface circuit to a PC-connected laptop.
At the PC terminal, a pseudorandom sequence is transmitted for offline processing and BER statistical analysis. The experimental platform established in this paper can be used to sample the fluctuation of light intensity. Subsequently, the pseudorandom binary sequence (PRBS) is transmitted from the PC side, followed by performance analysis.
This method, using a semi-experimental and semi-simulation approach, allows the flicker index of the environment in which the communication system is located to remain constant, with performance evaluated at equal SNR intervals. At the receiving terminal, the collected data represents the fluctuations of intensity in different weather conditions. In this study, a total of 200 s of intensity fluctuation data were sampled during the experiment. For the purpose of clear presentation in the paper, a two-second segment is extracted and shown. A segment of the normalized data obtained is shown in
Figure 3. On 4 June 2025 and 11 June 2025, data showing the fluctuation of intensity was collected between 14:00 and 20:00 in the afternoon. The experiment was conducted in Longpao Subdistrict, Luhe District, Nanjing City, Jiangsu Province, China (Jiangbei New Area).
In addition, the electrical signals received at the receiver end in this paper can indirectly reflect the power level of the optical signals at the receiver. By measuring the magnitude of the electrical signals at the receiver end, we are able to monitor and collect data in real time, which is beneficial for subsequent analysis.
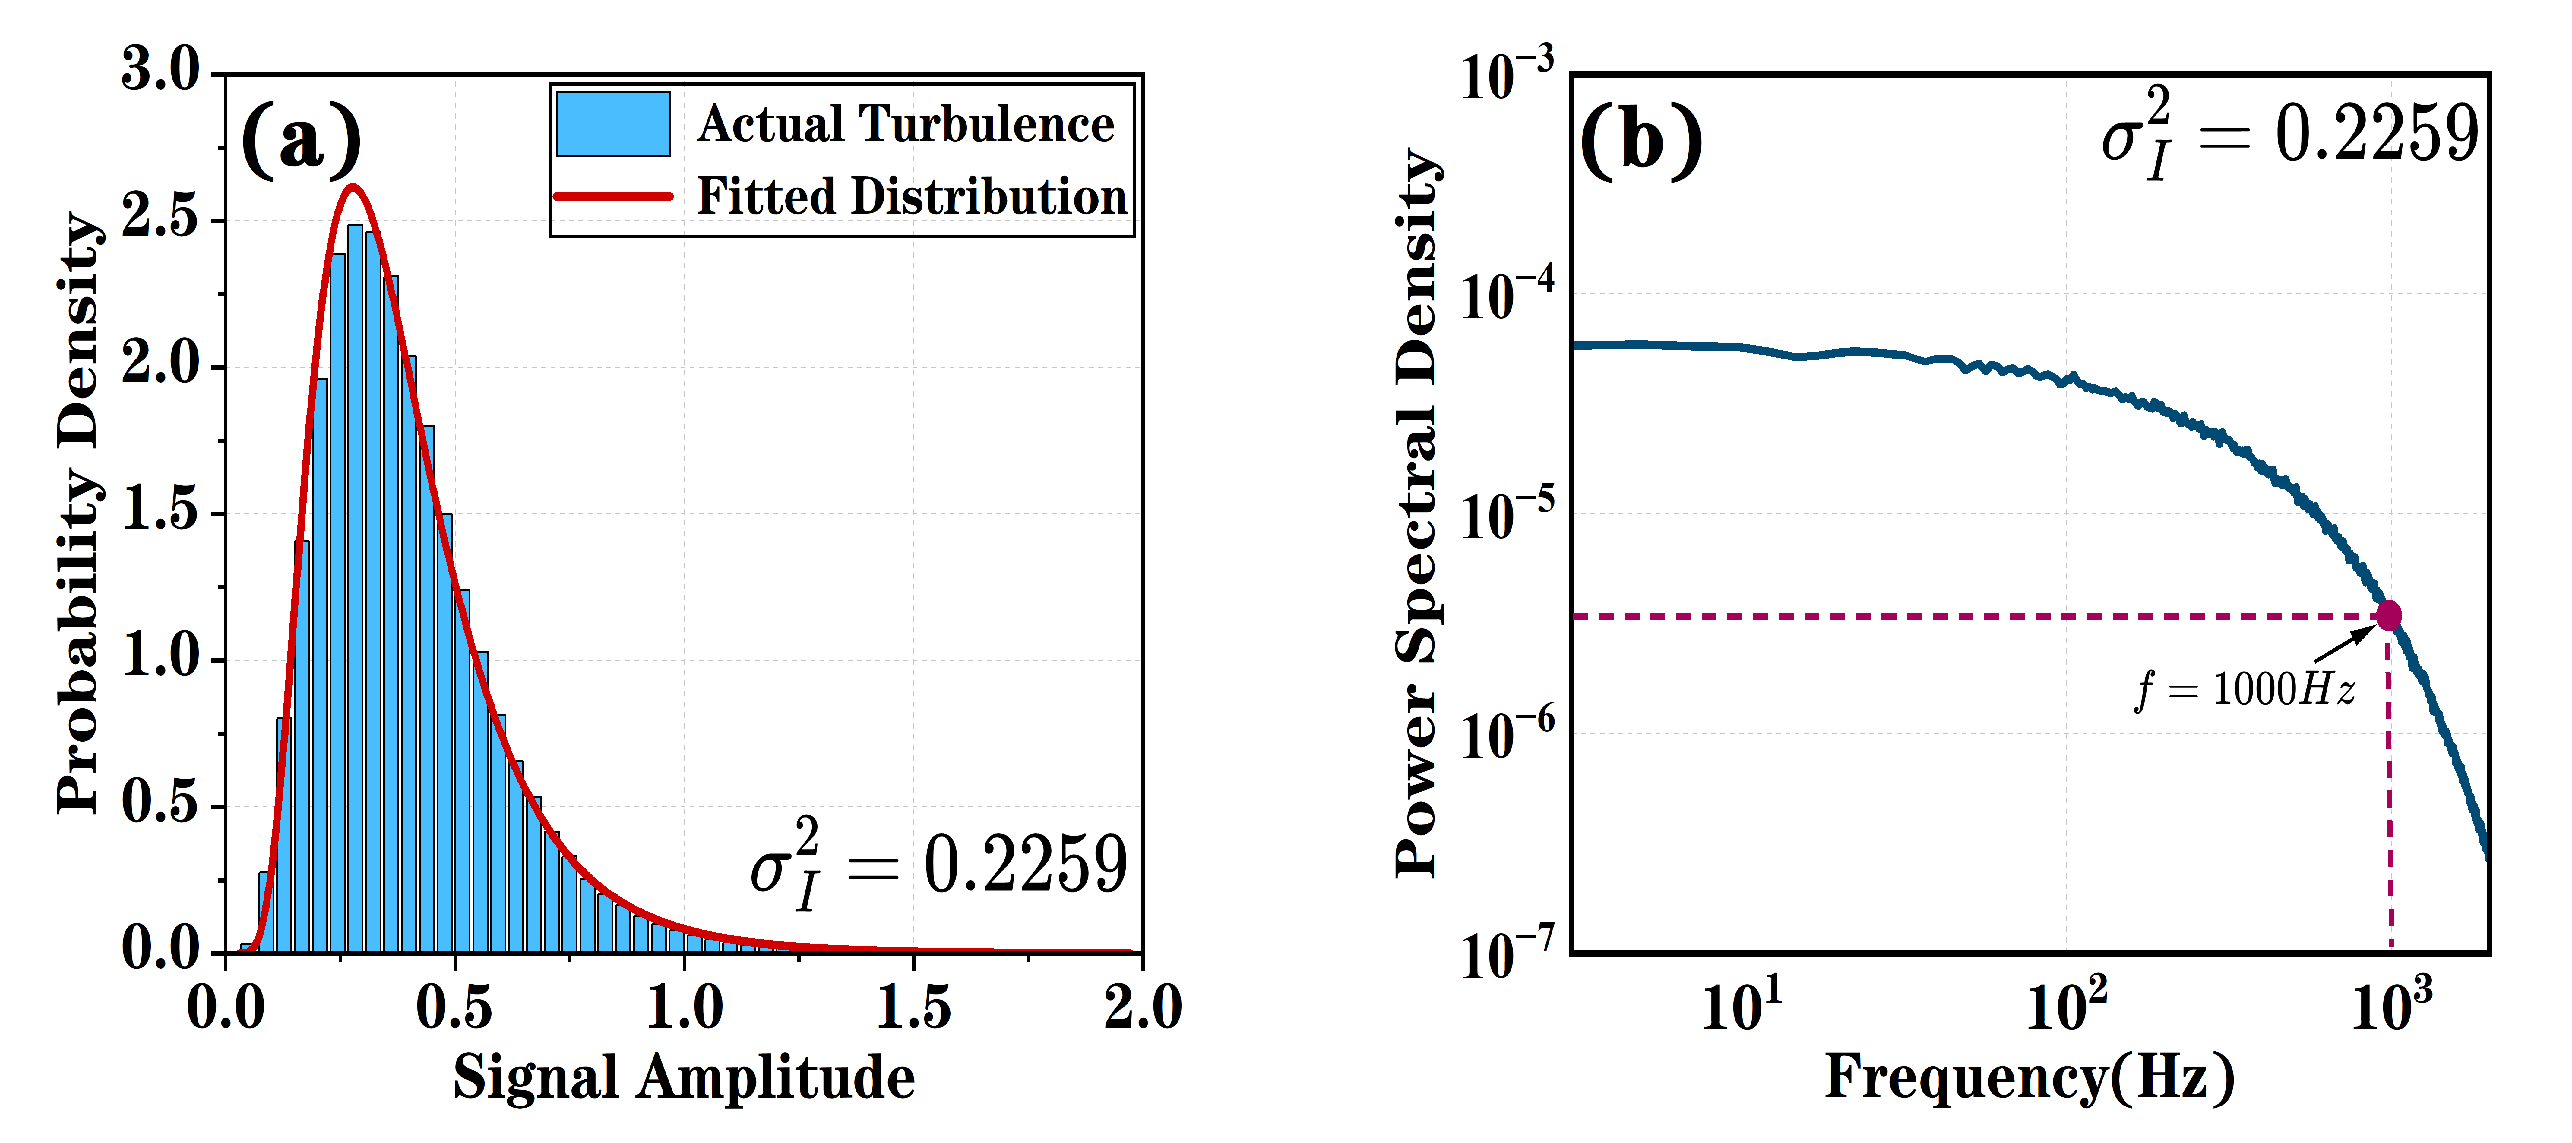
As illustrated in
Figure 4, the scintillation index of 0.2259 yields distinct probability density (PD) and power spectral density (PSD) curves. The turbulence model assumed in the theoretical model of this paper is the Gamma–Gamma distribution model. The experimentally obtained turbulence data in
Figure 4a exhibit conformity with the Gamma–Gamma distribution, which is adopted in our research.
Figure 4b shows the power spectral density of the received power. From
Figure 4b, we can observe that the low-frequency components of the turbulent channel are mainly concentrated below 1000 Hz and are relatively stable, which also indirectly reflects the stability of the turbulent channel.
The PSD estimation method used in this paper is the Welch’s averaged periodogram method. The original signal is divided into multiple segments, with each segment typically having the same length. Then, a window function (such as Hamming or Hanning) is applied to each segment to reduce spectral leakage. Fast Fourier Transform (FFT) is performed on each windowed segment to compute the periodogram of each segment. Finally, the periodograms of all segments are averaged to obtain the final PSD estimate. The advantage of this PSD estimation method lies in the introduction of data segmentation and overlap. By averaging the periodograms of multiple segments, the variance of a single periodogram is significantly reduced, resulting in a smoother PSD estimation. Moreover, it supports the selection of window functions, allowing for flexible trade-offs between spectral resolution and spectral leakage to accommodate different signal characteristics. For research purposes, this method is computationally efficient. The segmented processing reduces the length of individual data segments, thereby lowering the computational complexity of the Fourier transform, making it well-suited to long data sequences.
Figure 4b indicates that the impact of turbulence is primarily concentrated in the low-frequency region. Consequently, the turbulence effect exhibits more pronounced impacts on low-frequency signals.
Based on the experimental results in this paper, it can be observed that atmospheric turbulence contains a significant amount of low-frequency components. Meanwhile, the communication system operates at a symbol rate that is much higher than the frequency of these low-frequency components during turbulence. This difference has relatively little impact on the OOK method. However, the core principle of the DMD method is to detect signal variations based on the difference between the values of consecutive symbols. As a result, the DMD method is better able to capture the changes in atmospheric turbulence at high SNR levels.
4. System Performance and Discussion
4.1. Impact of Atmospheric Turbulence on the System Performance
At the symbol rate of 10Mbps, the BER performance variation corresponding to scintillation index variances of 0.0207 in
Figure 5a, 0.2259 in
Figure 5b, and 0.3730 in
Figure 5c is shown. The theoretical curves in
Figure 5 demonstrate that the theoretical results are in good agreement with the experimental data. As the SNR increases, both DMD as well as OOK reduce the BER of the system. In low-SNR regions, OOK exhibits greater reliability compared to DMD. But DMD exhibits superior BER performance compared to the OOK method in high-SNR regions. In high-SNR regions, DMD can surpass the BER limit of OOK and improve system performance by one to two orders of magnitude.
According to
Figure 5a, we consider a scintillation index of 0.0207 to represent an extremely weak turbulence environment. Under such conditions, when the SNR is below 20 dB, the DMD method shows inferior performance compared to OOK. However, when the SNR is above 20 dB, the DMD method not only surpasses the BER floor of the OOK method but also achieves a BER advantage of two orders of magnitude over the OOK method. The core principle of the DMD method is to detect signal variations based on adjacent symbols, making it more sensitive to turbulence effects, whereas OOK cannot adapt to symbol variations. As a result, the DMD method is better able to capture the changes in atmospheric turbulence in high-SNR regions. In our research, the experiments were conducted repeatedly under the same experimental conditions. Furthermore, the performance comparison between the DMD method and the OOK method was analyzed by scanning at equal SNR intervals to evaluate the BER performance. Therefore, the experimental setup and analysis demonstrate strong rationality and scientific validity.
Although increased atmospheric turbulence intensity reduces system reliability, DMD still demonstrates significant performance advantages. From
Figure 5 it can be observed that as the SNR increases, the BER curves of DMD and OOK intersect (performance advantage point). Moreover, as the scintillation index of atmospheric turbulence increases, this performance advantage point shifts toward lower SNR values. Due to this characteristic, DMD holds strong practical significance for engineering applications.
This paper assumes that the turbulence obeys the Gamma–Gamma distribution model. Therefore, the atmospheric turbulence scintillation index satisfies the following relationship [
33]
At the receiver side, the distribution of the differential detection statistic
can be expressed as
The expansion for BER detection using finite differences, with Hermite high-order expansion correction, is carried out up to the 20th term:
Furthermore,
can be calculated as follows:
The performance advantage point of the DMD and OOK method satisfies the following system of equations:
For convenience in subsequent derivations, the influence of higher-order terms is neglected. High-order Taylor expansion expands
and
at
up to
.
During the derivation process in this paper, the expansion of Equations (22) and (23) was carried out to facilitate the subsequent calculation of the BER. The expansions in Equations (22) and (23) were then used to ultimately derive the relationship between the scintillation index and the shift in the performance advantage point, as expressed in Equation (
26). Moreover, the chosen number of expansion terms facilitates the numerical derivation of the equations.
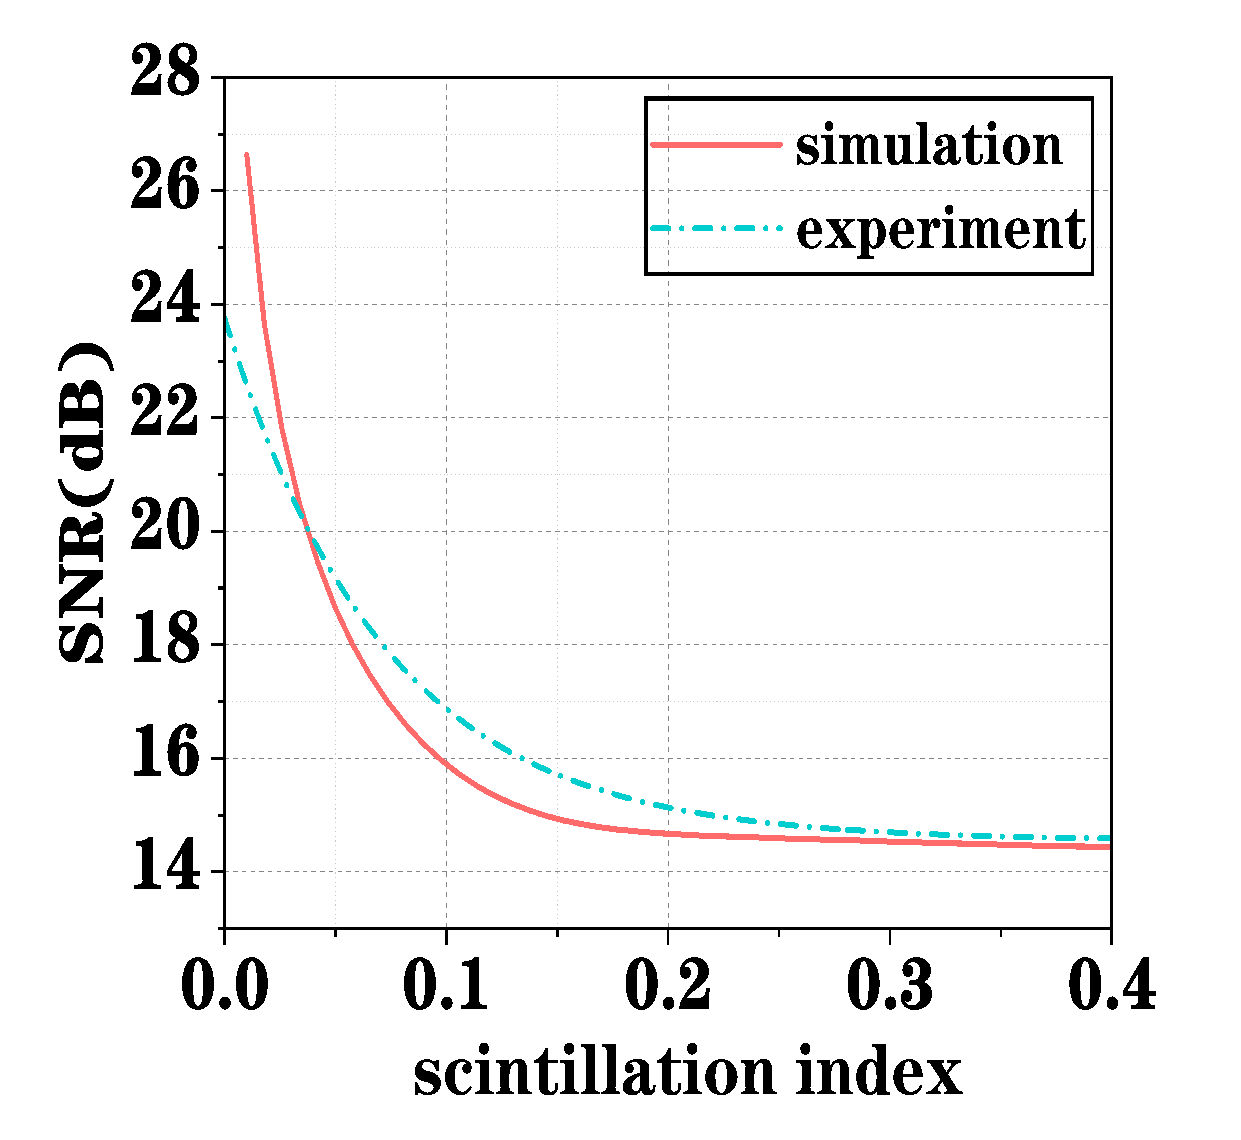
From our research, the theoretical and experimental curves in
Figure 6 demonstrate the rationality of the derivations and also indirectly confirm that the number of expansion terms used in Equations (22) and (23) meets the required accuracy.
As a result, the SNR can be expressed comprehensively as
The SNR can then be substituted into the aforementioned system of equations and expanding yields as follows:
By numerical methods, it is solved as
Through our research, we obtained the theoretical curve of the intersection-point SNR versus atmospheric turbulence scintillation index, and compared it with experimentally measured curves as follows:
As shown in
Figure 6, the intersection points of the BER curves between DMD and OOK vary under different conditions. With the increasing intensity of atmospheric turbulence, the BER curve intersection shifts towards low SNR, demonstrating a trend where a minimum SNR is required for DMD to surpass the BER limit in the OOK system.
Figure 6 reveals good agreement between theoretical derivations and experimental data. This phenomenon arises because DMD employs a differential modulation and detection mechanism based on adjacent symbols, making it more sensitive to turbulence effects, whereas OOK cannot adapt to symbol variations. Consequently, DMD exhibits superior advantages in different turbulent environments.
4.2. Impact of Modulation Depth on System Performance
Modulation depth (MD) fundamentally reflects the control strength of the modulation signal over the carrier [
31]. In the FSO system, since the minimum emission current of the laser is greater than zero at the transmitter side, the transmit power remains above zero even for bit "0", resulting in a modulation depth less than one. In the optical communication system, the influence of modulation depth cannot be ignored, especially in the application of Modulated Retro-Reflector (MRR) technology. Consequently, deviations in modulation depth degrade system performance and increase BER in communication systems.
As shown in
Figure 7, the decreasing modulation depth leads to an increase in BER for both DMD and OOK in FSO systems. With higher SNR, the impact of modulation depth on OOK diminishes and eventually converges to consistent performance. For DMD, however, the influence of modulation depth becomes more pronounced as SNR increases. Nevertheless, variations in modulation depth cannot eliminate the performance superiority of DMD over OOK at high SNR levels. Moreover, larger modulation depth yields more significant performance gains for DMD. This implies that in practical engineering applications, as laser threshold currents continue to decrease and modulation depths increase, the performance advantages of the DMD approach will become even more prominent.
4.3. Impact of Symbol Rate on System Performance
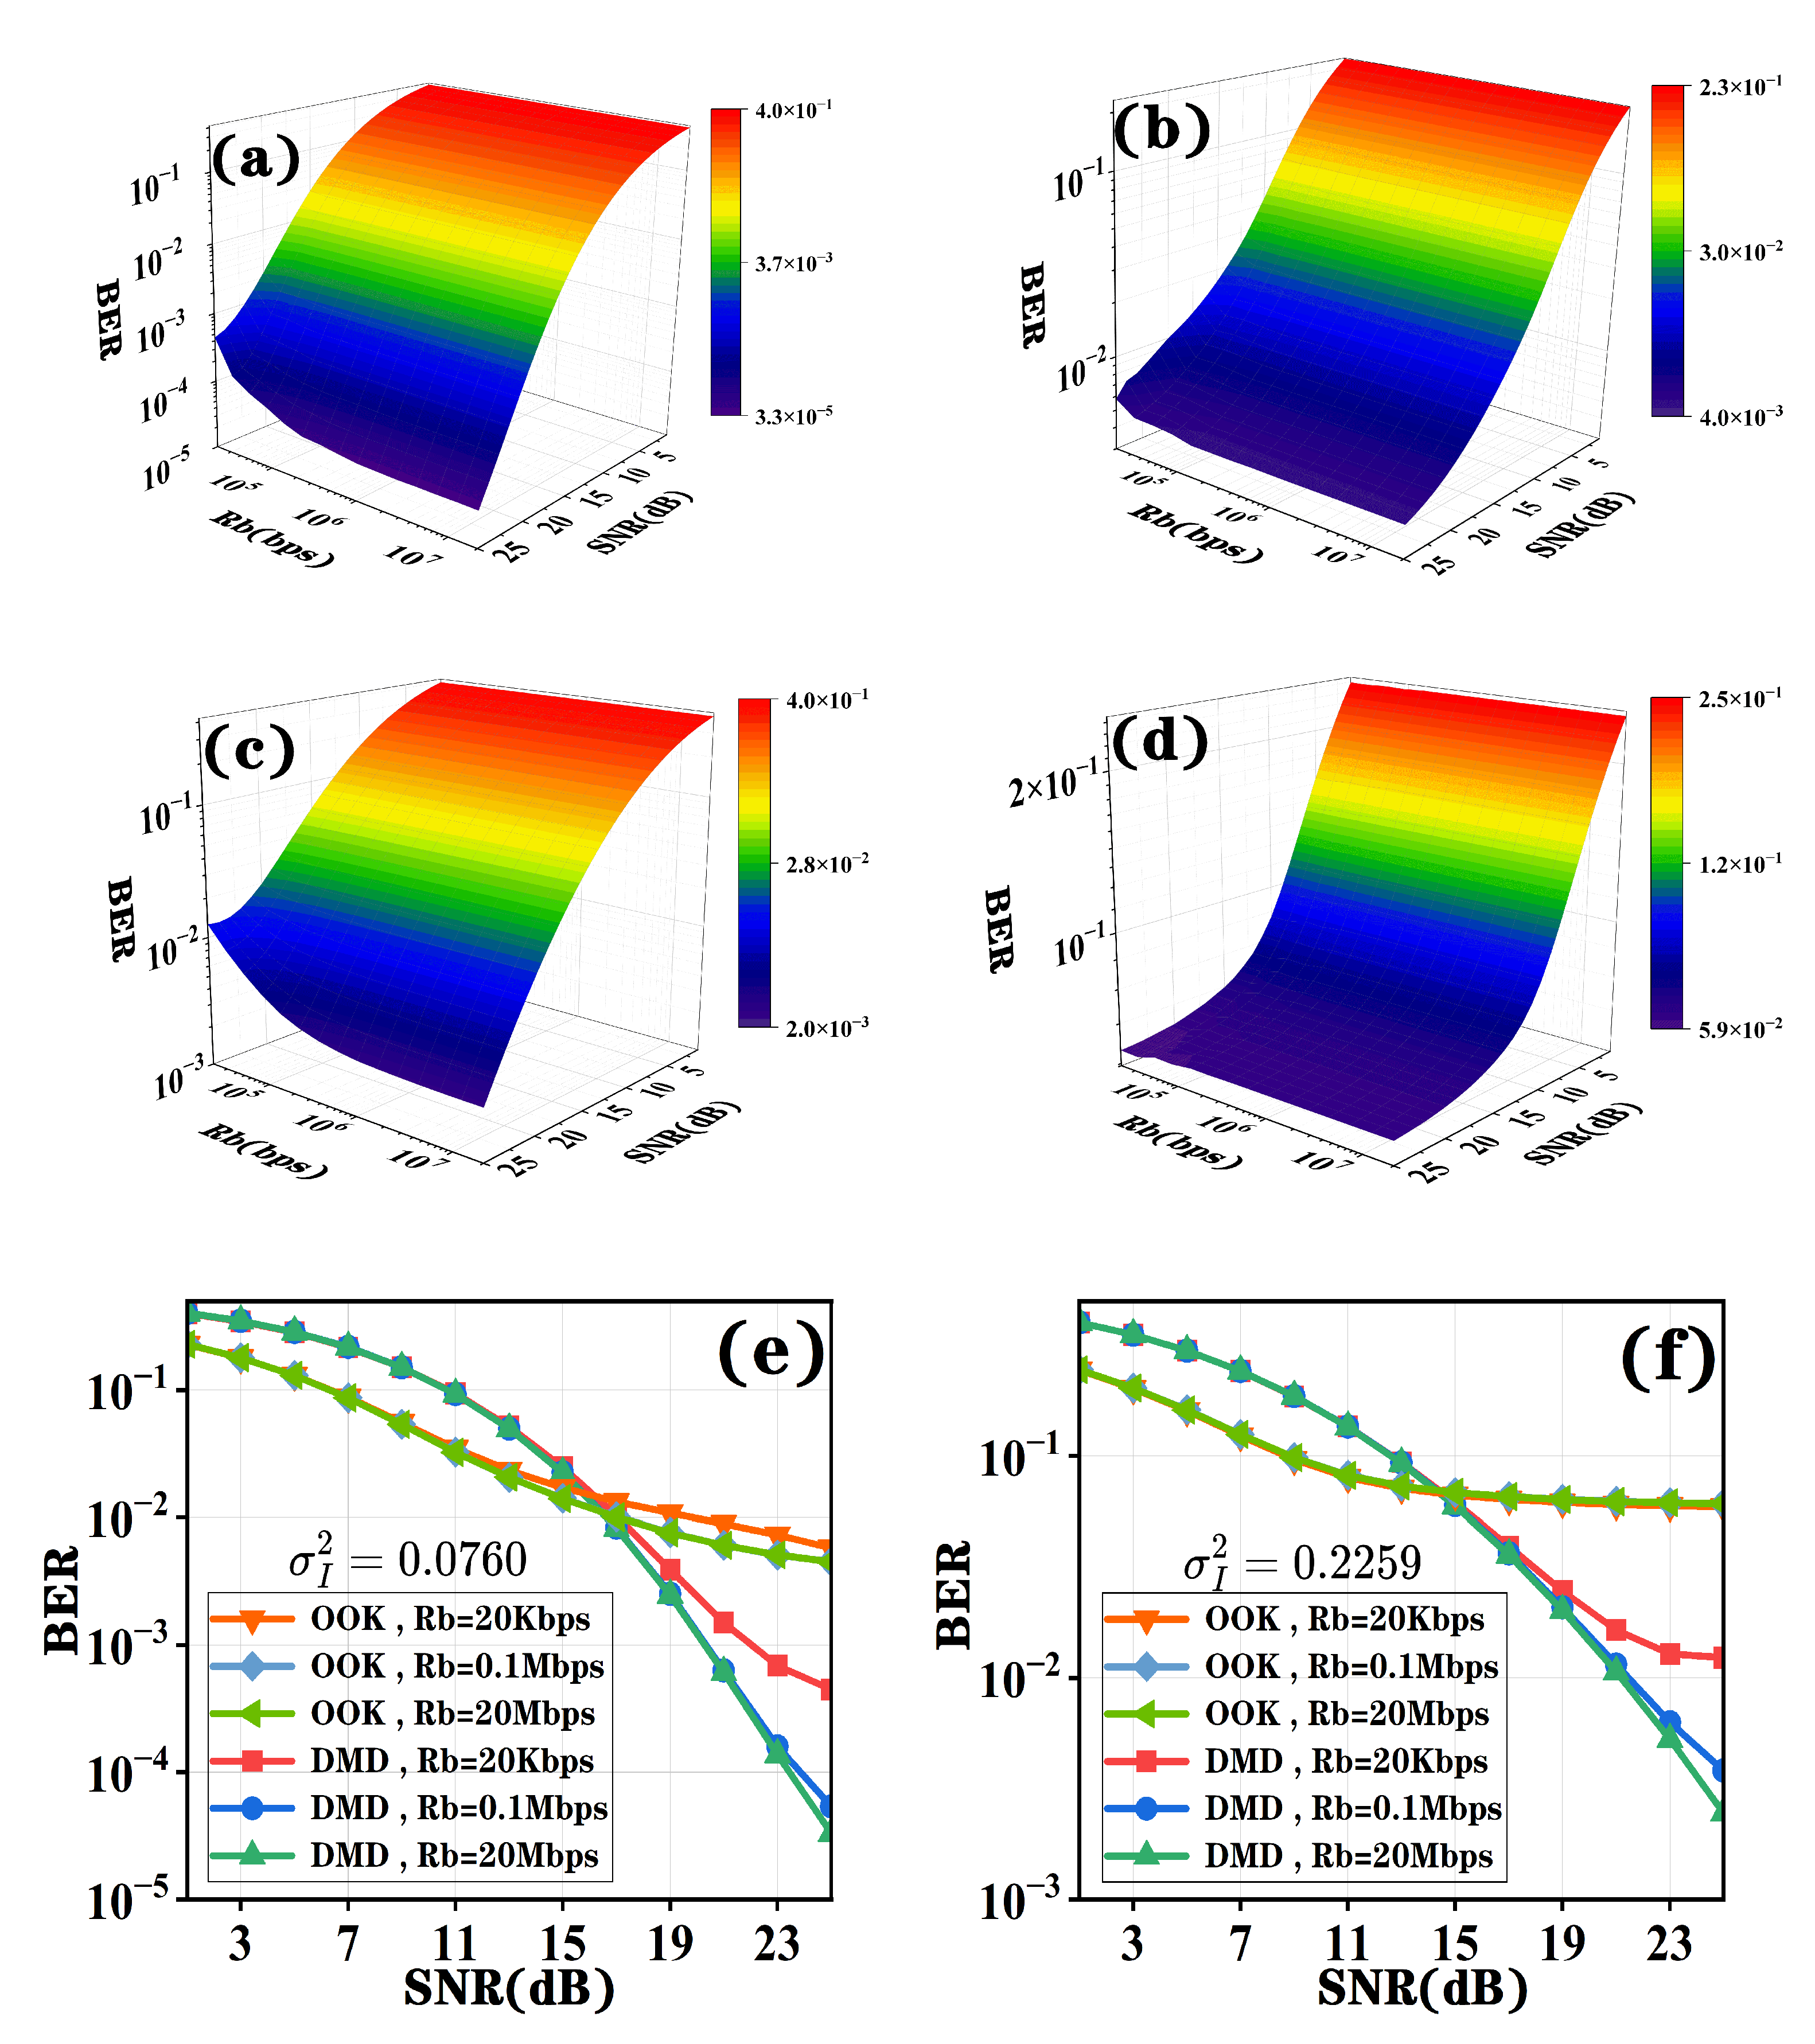
In communication systems, the impact of symbol rate on system performance is also significant. Through our research, we observe that under identical conditions, the system performance of DMD improves as the symbol rate increases. At high SNR levels, its bit error rate exhibits a significant decrease. However, for the OOK detection scheme, the increase in symbol rate does not demonstrate any noticeable change in the system’s BER performance.
From the observations in
Figure 8a–d, we find that as the symbol rate increases, the BER of DMD shows a significant decreasing trend. However, the impact of symbol rate variation on OOK is relatively minor, with almost no change, even at high SNR levels. As shown in
Figure 8e,f, under weak turbulence conditions, when the SNR is 25 dB, the BER of DMD differs by an order of magnitude between symbol rates of 20 Kbps and 20 Mbps. Similarly, under strong turbulence conditions, when the SNR is 25 dB, the BER difference between 20 Kbps and 20 Mbps symbol rates also approaches one order of magnitude. Regardless of turbulence intensity, DMD demonstrates superior performance advantages over OOK at high SNR levels. In contrast, OOK remains insensitive to symbol rate variations, with minimal impact on FSO systems employing OOK, particularly noticeable under high-SNR conditions.
The underlying reason for this phenomenon is the fact that for DMD, the key factor significantly affecting BER is the selection of the optimal fixed detection threshold. The derived optimal threshold is highly sensitive to the difference between adjacent symbols. This means that as the symbol rate increases, the turbulence effects on consecutive symbols within shorter time intervals become smoother and more similar, thereby enhancing the temporal correlation between symbols. The stronger the temporal correlation, the more accurate the determination of the optimal threshold, resulting in lower BER.
Furthermore, according to the PSD curve in
Figure 4, we observe that turbulence effects are primarily concentrated in the low-frequency region and begin to decay rapidly beyond 1 kHz. For FSO systems using OOK, where the symbol rate typically exceeds 20 Kbps, variations in symbol rate have a relatively minor impact on BER. However, since DMD makes a decision on the signal detected at the receiver based on partial channel state information under turbulence, lower symbol rates lead to insufficient channel perception by DMD, consequently resulting in less accurate threshold calculations.
5. Conclusions
In summary, the theoretical and experimental investigation of differential modulation and detection in FSO systems proposed in this paper effectively addresses the reliability issues in optical signal transmission through atmospheric turbulence channels. The results demonstrate that under relatively high-BER conditions, the differential modulation and detection method significantly enhances communication system reliability. Furthermore, through theoretical derivation and experimental analysis, we established a model for performance advantage points and validated it with experiments. To further optimize the DMD model and meet engineering requirements, we introduced the concept of modulation depth and analyzed the performance of DMD under its influence. Finally, to address the impact of signal transmission rate on BER in FSO systems, we experimentally demonstrated that increasing the symbol rate under certain conditions can effectively reduce the BER when using DMD. The results and analysis establish the foundation of the DMD method’s application in engineering work.
Author Contributions
H.Z.: methodology, software, writing—original draft; Z.Y.: investigation, resources, formal analysis, supervision; J.W.: funding acquisition, formal analysis, project administration, writing—review and editing; J.L.: funding acquisition, writing—review and editing; Z.X.: investigation, resources, supervision; J.Z.: investigation, resources, supervision; Y.S.: investigation, resources, supervision. All authors have read and agreed to the published version of the manuscript.
Funding
This work was supported by the National Natural Science Foundation of China (Grant No. 62271502 and No. 62171463) and the Natural Science Foundation of Jiangsu Province (Grant No. BK20231486).
Data Availability Statement
The data that support the findings of this study are available from the corresponding author upon reasonable request.
Conflicts of Interest
The authors declare no conflicts of interest.
References
- Singh, H.; Mittal, N.; Miglani, R.; Singh, H.; Gaba, G.S.; Hedabou, M. Design and analysis of high-speed free space optical (FSO) communication system for supporting fifth generation (5G) data services in diverse geographical locations of India. IEEE Photonics J. 2021, 13, 1–12. [Google Scholar] [CrossRef]
- Ju, C.; Liu, N.; Wang, D.; Wang, D.; Yu, J.; Qiu, Y. Real-time demonstration of two-aperture coherent digital combining free-space optical transmission with a real-valued MIMO adaptive equalizer. Opt. Lett. 2024, 49, 903–906. [Google Scholar] [CrossRef] [PubMed]
- Kaushal, H.; Kaddoum, G. Optical communication in space: Challenges and mitigation techniques. IEEE Commun. Surv. Tutor. 2016, 19, 57–96. [Google Scholar] [CrossRef]
- Kaushal, H.; Jain, V.; Kar, S. Free Space Optical Communication; Springer: Berlin/Heidelberg, Germany, 2017; Volume 60. [Google Scholar]
- Rodewald, D. MRV introduces industry’s first 10G ethernet wireless point-to-point system. MRV Commun. Inc 2008, 2, 394–412. [Google Scholar]
- Boroson, D.M.; Robinson, B.S.; Murphy, D.V.; Burianek, D.A.; Khatri, F.; Kovalik, J.M.; Sodnik, Z.; Cornwell, D.M. Overview and results of the lunar laser communication demonstration. In Proceedings of the Free-Space Laser Communication and Atmospheric Propagation XXVI, San Francisco, CA, USA, 1–6 February 2014; SPIE: Bellingham, WA, USA, 2014; Volume 8971, pp. 213–223. [Google Scholar]
- Fernandes, M.A.; Brandão, B.T.; Georgieva, P.; Monteiro, P.P.; Guiomar, F.P. Adaptive optical beam alignment and link protection switching for 5G-over-FSO. Opt. Express 2021, 29, 20136–20149. [Google Scholar] [CrossRef]
- Mufutau, A.O.; Guiomar, F.P.; Fernandes, M.A.; Lorences-Riesgo, A.; Oliveira, A.; Monteiro, P.P. Demonstration of a hybrid optical fiber–wireless 5G fronthaul coexisting with end-to-end 4G networks. J. Opt. Commun. Netw. 2020, 12, 72–78. [Google Scholar] [CrossRef]
- Demers, F.; Yanikomeroglu, H.; St-Hilaire, M. A survey of opportunities for free space optics in next generation cellular networks. In Proceedings of the 2011 Ninth Annual Communication Networks and Services Research Conference, Ottawa, ON, Canada, 2–5 May 2011; IEEE: New York, NY, USA, 2011; pp. 210–216. [Google Scholar]
- Huang, L.; Liu, S.; Dai, P.; Li, M.; Chang, G.K.; Shi, Y.; Chen, X. Unified performance analysis of hybrid FSO/RF system with diversity combining. J. Light. Technol. 2020, 38, 6788–6800. [Google Scholar] [CrossRef]
- Dohler, M.; Heath, R.W.; Lozano, A.; Papadias, C.B.; Valenzuela, R.A. Is the PHY layer dead? IEEE Commun. Mag. 2011, 49, 159–165. [Google Scholar] [CrossRef]
- Shu, T.; Zou, Y.; Fan, Q.; Mei, T.; Dai, X.; Liu, C.; Cheng, M.; Deng, L.; Yang, Q.; Liu, D. Seamless rate adaptation for wide SNR range in FSO systems based on rate compatible modulation. Opt. Lett. 2024, 49, 4658–4661. [Google Scholar] [CrossRef]
- Guiomar, F.P.; Lorences-Riesgo, A.; Ranzal, D.; Rocco, F.; Sousa, A.N.; Fernandes, M.A.; Brandão, B.T.; Carena, A.; Teixeira, A.L.; Medeiros, M.C.; et al. Adaptive probabilistic shaped modulation for high-capacity free-space optical links. J. Light. Technol. 2020, 38, 6529–6541. [Google Scholar] [CrossRef]
- Ao, X.; Fan, Q.; Zhong, L.; Mei, T.; Wang, Y.; Yang, Q.; Dai, X.; Liu, C.; Cheng, M.; Deng, L.; et al. Real-time experimental demonstration of hybrid FSO/wireless transmission based on coherent detection and delta-sigma modulation. IEEE Photonics J. 2022, 14, 1–8. [Google Scholar] [CrossRef]
- Andrews, L.C.; Phillips, R.L. Laser Beam Propagation through Random Media; SPIE Press: Bellingham, WA, USA, 2005. [Google Scholar]
- Zhu, X.; Kahn, J.M. Free-space optical communication through atmospheric turbulence channels. IEEE Trans. Commun. 2002, 50, 1293–1300. [Google Scholar] [CrossRef]
- Li, J.; Liu, J.Q.; Taylor, D.P. Optical communication using subcarrier PSK intensity modulation through atmospheric turbulence channels. IEEE Trans. Commun. 2007, 55, 1598–1606. [Google Scholar] [CrossRef]
- Gao, R.; Liu, L.; Liu, X.; Lun, H.; Yi, L.; Hu, W.; Zhuge, Q. An overview of ML-based applications for next generation optical networks. Sci. China Inf. Sci. 2020, 63, 160302. [Google Scholar] [CrossRef]
- Alzenad, M.; Shakir, M.Z.; Yanikomeroglu, H.; Alouini, M.S. FSO-based vertical backhaul/fronthaul framework for 5G+ wireless networks. IEEE Commun. Mag. 2018, 56, 218–224. [Google Scholar] [CrossRef]
- Jahid, A.; Alsharif, M.H.; Hall, T.J. A contemporary survey on free space optical communication: Potentials, technical challenges, recent advances and research direction. J. Netw. Comput. Appl. 2022, 200, 103311. [Google Scholar] [CrossRef]
- IEEE 802 LAN/MAN Standards Committee. IEEE Standard for Information technology-Telecommunication and Information Exchange Between Systems-Local and Metropolitan Area Networks-Specific Requirements Part11: Wireless LAN Medium Access Control (MAC) and Physical Layer (PHY) Specifications Amendment1: Radio Resource Measurement of Wireless LANs. 2009. Available online: http://standards.ieee.org/getieee802/download/802.11n-2009.pdf (accessed on 1 November 2025).
- Fatima, K.; Muhammad, S.S.; Leitgeb, E. Adaptive coded modulation for FSO links. In Proceedings of the 2012 8th International Symposium on Communication Systems, Networks & Digital Signal Processing (CSNDSP), Poznan, Poland, 18–20 July 2012; IEEE: New York, NY, USA, 2012; pp. 1–4. [Google Scholar]
- Sun, Z.; Tang, D.; Zuo, W.; Cui, H.; Wu, Z.; Qiao, Y. Triple-convex probabilistic constellation shaping PAM8 in IM/DD system. IEEE Photonics Technol. Lett. 2023, 35, 846–849. [Google Scholar] [CrossRef]
- Bayaki, E.; Schober, R. Performance and design of coherent and differential space-time coded FSO systems. J. Light. Technol. 2012, 30, 1569–1577. [Google Scholar] [CrossRef]
- Lian, K.; Xu, Z.; Qiao, M.; Li, Z.; Wang, J.; Liu, J.; Wang, D. Optical Multi-Path Interference Mitigation for PAM4-IMDD Systems Using Balanced Coding. J. Light. Technol. 2024, 42, 5918–5927. [Google Scholar] [CrossRef]
- Shin, W.H.; Choi, J.Y.; Han, S.K. Fixed threshold on-off keying differential detection for satellite optical communications. Opt. Express 2019, 27, 1590–1596. [Google Scholar] [CrossRef] [PubMed]
- Marks, L.E. Apparent depth of modulation as a function of frequency and amplitude of temporal modulations of luminance. J. Opt. Soc. Am. 1970, 60, 970–977. [Google Scholar] [CrossRef]
- Gao, G.; Chong, S.P.; Sheppard, C.J.; Chen, N. Considerations of aperture configuration in focal modulation microscopy from the standpoint of modulation depth. J. Opt. Soc. Am. A 2011, 28, 496–501. [Google Scholar] [CrossRef] [PubMed]
- Gui, L.; Wu, X.; Yu, B.; Guang, D.; Shi, J.; Zuo, C.; Zhang, W. High-stability PGC demodulation algorithm based on a reference fiber-optic interferometer with insensitivity to phase modulation depth. J. Light. Technol. 2021, 39, 6968–6975. [Google Scholar] [CrossRef]
- Pophillat, L. Optical modulation depth improvement in SCM lightwave systems using a dissymmetrization scheme. IEEE Photonics Technol. Lett. 2002, 6, 750–753. [Google Scholar] [CrossRef]
- Wang, N.; Cheng, J. Moment-based estimation for the shape parameters of the Gamma-Gamma atmospheric turbulence model. Opt. Express 2010, 18, 12824–12831. [Google Scholar] [CrossRef]
- Bhatnagar, M.R.; Ghassemlooy, Z. Performance analysis of gamma–gamma fading FSO MIMO links with pointing errors. J. Light. Technol. 2016, 34, 2158–2169. [Google Scholar] [CrossRef]
- Bykhovsky, D. Simple generation of gamma, gamma–gamma, and K distributions with exponential autocorrelation function. J. Light. Technol. 2016, 34, 2106–2110. [Google Scholar] [CrossRef]
| Disclaimer/Publisher’s Note: The statements, opinions and data contained in all publications are solely those of the individual author(s) and contributor(s) and not of MDPI and/or the editor(s). MDPI and/or the editor(s) disclaim responsibility for any injury to people or property resulting from any ideas, methods, instructions or products referred to in the content. |
© 2025 by the authors. Licensee MDPI, Basel, Switzerland. This article is an open access article distributed under the terms and conditions of the Creative Commons Attribution (CC BY) license (https://creativecommons.org/licenses/by/4.0/).
