Article

The Possible Use of Stable Carbon and Nitrogen Isotope Signal and Spectral Analysis to Identify Habitat Condition of Aquatic Plants

Department of Plant Ecology, Faculty of Biology, University of Gdansk, 80-308 Gdańsk, Poland
Limnol. Rev. 2024, 24(1), 17-29; https://doi.org/10.3390/limnolrev24010002
Submission received: 30 October 2023 / Revised: 27 December 2023 / Accepted: 29 December 2023 / Published: 31 December 2023

Abstract

:
Many macrophyte species exhibit a high degree of plasticity, enabling them to thrive in various aquatic ecosystems. Identifying the growth conditions of individual aquatic plant species during research or specimen collection is not always possible. In many cases, the nature of the planned research does not necessitate recognizing environmental conditions. However, the scope of identifying the habitat parameters of the collections of submerged aquatic plant herbariums provides an opportunity for further research. This paper explores the possibilities of using isotopic signals of plants, supported by spectral analyses of powdered plant materials, to ascertain the environmental conditions from which the samples were collected. The results obtained from the stable carbon and nitrogen isotope compositions (δ13CORG and δ15NORG) and the analysis of spectral spectra via FTIR-ART (Fourier Transform Infrared Spectroscopy with Attenuated Total Reflectance) of plant material (Elodea canadensis Michx. species) collected from various habitat ecosystems, including rivers and both hard- and softwater lakes, exhibited significant distinctions between these habitats. Particularly high values of δ15NORG were recorded in the material from rivers. The stable carbon and nitrogen isotope compositions did not differentiate between the material collected from softwater and hardwater lakes. Nevertheless, when comparing the isotopic findings with the FTIR-ATR spectral analysis focused on identifying characteristic peaks associated with the presence of calcium carbonate, noticeable differences were observed in the presence and intensity of calcium carbonate peaks in the material. These differences were only evident when nondecarbonated plant material from hardwater lakes was used for the FTIR-ATR analysis. To the best of the author’s knowledge, the combination of methods applied in this study to identify the origin of E. canadensis from various freshwater environments is the first application of its kind that could enable the rapid identification of plant material origin. Such identification could prove useful in environmental, ecological, and paleoenvironmental research. The increased knowledge of macrophytes’ δ13CORG and δ15NORG values might also be essential in further tracking accelerated eutrophication based on aquatic vegetation’s isotopic signals. This might be important due to the assumption that the increased rate of eutrophication influences organic matter sedimentation in aquatic ecosystems, especially lakes.

1. Introduction

Understanding the origins of plants within aquatic environments is crucial for interpreting their ecology. Plants represent a diverse spectrum of ecological groups, including emerged and submerged species from various phyla. They might possess specific habitat requirements. Obtaining information about a plant’s origin from a particular aquatic ecosystem holds significant value, especially in light of the rapid decline in overall biodiversity in these ecosystems [1]. This decline encompasses not only the general biodiversity but also that of aquatic plants [2]. Traditionally, the particular aquatic environment type is established based on its morphology, origin, and abiotic features, i.e., different types of lakes, rivers, seas, etc. Moreover, some specific abiotic and biotic parameters are essential to divide them into more specific types of aquatic ecosystems. One of the factors that helps distinguish the accurate types of aquatic ecosystems are, e.g., particular aquatic plants, which occur only in specific conditions, called bioindicators.
However, certain aquatic plants exhibit phenotypic adaptability in response to varying conditions [3,4]. For instance, Nuphar lutea (L.) Sibth. and Sm. produces different types of leaves in fast-flowing rivers, shallow eutrophic lakes, or shallow, softwater lakes [5]. Similarly, Myriophyllum alterniflorum DC., found in a relatively wide range of lake fertility conditions, displays high plasticity in morphological features, as demonstrated by its growth on various substrates [6]. Similarly, several species of the genus Potamogeton (as well as the genus Stuckenia) are characterized by high phenotypic plasticity in response to changing habitat conditions [7]. In these cases, the phenotypic variability of these plants may allow the identification of the specific aquatic environment from which they originate. However, some aquatic plant species have a broad distribution. Those plants exhibit minimal differentiation, making it difficult to determine the type of freshwater ecosystems they come from. An example of such a species is the non-native Elodea canadensis Michx., which has been present in Poland since 1867 [8], inhabiting low-fertility softwater lakes, more fertile hardwater lakes [9], and moderately fertile and slow-flowing rivers [10].
Integrating isotopic analysis and spectral analysis obtained through Fourier Transform Infrared Spectroscopy with Attenuated Total Reflectance (FTIR-ART) may make it feasible to identify the accurate source of plant materials. This is particularly relevant for those gathered from various herbariums lacking information about the specific collection site. It is worth emphasizing that in well-organized herbariums, each herbarium sheet should contain information about the location of collection of each specimen to be included in their collections [11]. However, there may be cases where researchers or herbariums themselves have specimens in their collections, but they lack specific details about their origin. In some cases, the location might be known, but there is no precise information about the aquatic ecosystem.
Analyses of carbon and nitrogen isotope compositions in derived matter (δ13C of organic matter δ13C ORG and δ15N of organic matter δ15N ORG) are often used in studies of freshwater ecosystems [12], where scientists focus on submerged macrophytes [13,14,15,16,17,18,19]. The isotopic information about aquatic plants recorded as δ13CORG and δ15NORG serves various purposes, including characterizing and tracking food webs in aquatic ecosystems [20,21] and determining the source of organic matter deposited in the sediments [22,23,24,25], etc. Essential to the correct interpretation of obtained δ13CORG and δ15NORG values of macrophytes organic matter is the understanding of the complex variables shaping the final analyzed values of δ13CORG and δ15NORG. It is worth mentioning that the main variables shaping the δ13C and δ15N values of aquatic plant’s organic matter are the isotopic values of δ13C of dissolved inorganic carbon (DIC) and δ15N of dissolved inorganic nitrogen (DIN) in water. Also crucial is the vital effect of so-called biosynthesis processes like photosynthesis type and process, growing conditions, light availability, etc. Within complex lake ecosystems, numerous factors contribute to shaping the δ13CDIC and δ15NDIN. These enclose a comprehensive range of factors, including but not limited to water exchange over time, temperature fluctuations, biological activities of organisms inhabiting the investigated water ecosystem, and various other interrelated elements [13,14,15,16,17,18,19]. In the presented study, the focus on shaping the δ13CORG and δ15NORG will be minor due to the need to stress the usefulness of the obtained results for identifying the origin of the analyzed plant material.
Fourier Transform Infrared Spectroscopy (FTIR) is another valuable method that allows us to determine the diversity and characteristics of plant organic matter [26]. This method enables the characterization of organic matter from various sources based on the vibrational intensity of specific chemical bonds [27,28,29] and a wide array of inorganic compounds [30,31,32].
The study hypothesis posits that by analyzing carbon and nitrogen isotopic signals within plant organic matter, combined with FTIR spectral analysis, it becomes feasible to discern the specific type of aquatic ecosystem from which the sampled materials originated. To test this hypothesis, the results of δ13CORG and δ15NORG analyses of total organic matter and FTIR-ATR spectra of organic matter derived from E. canadensis samples in northern Poland were used.

2. Materials and Methods
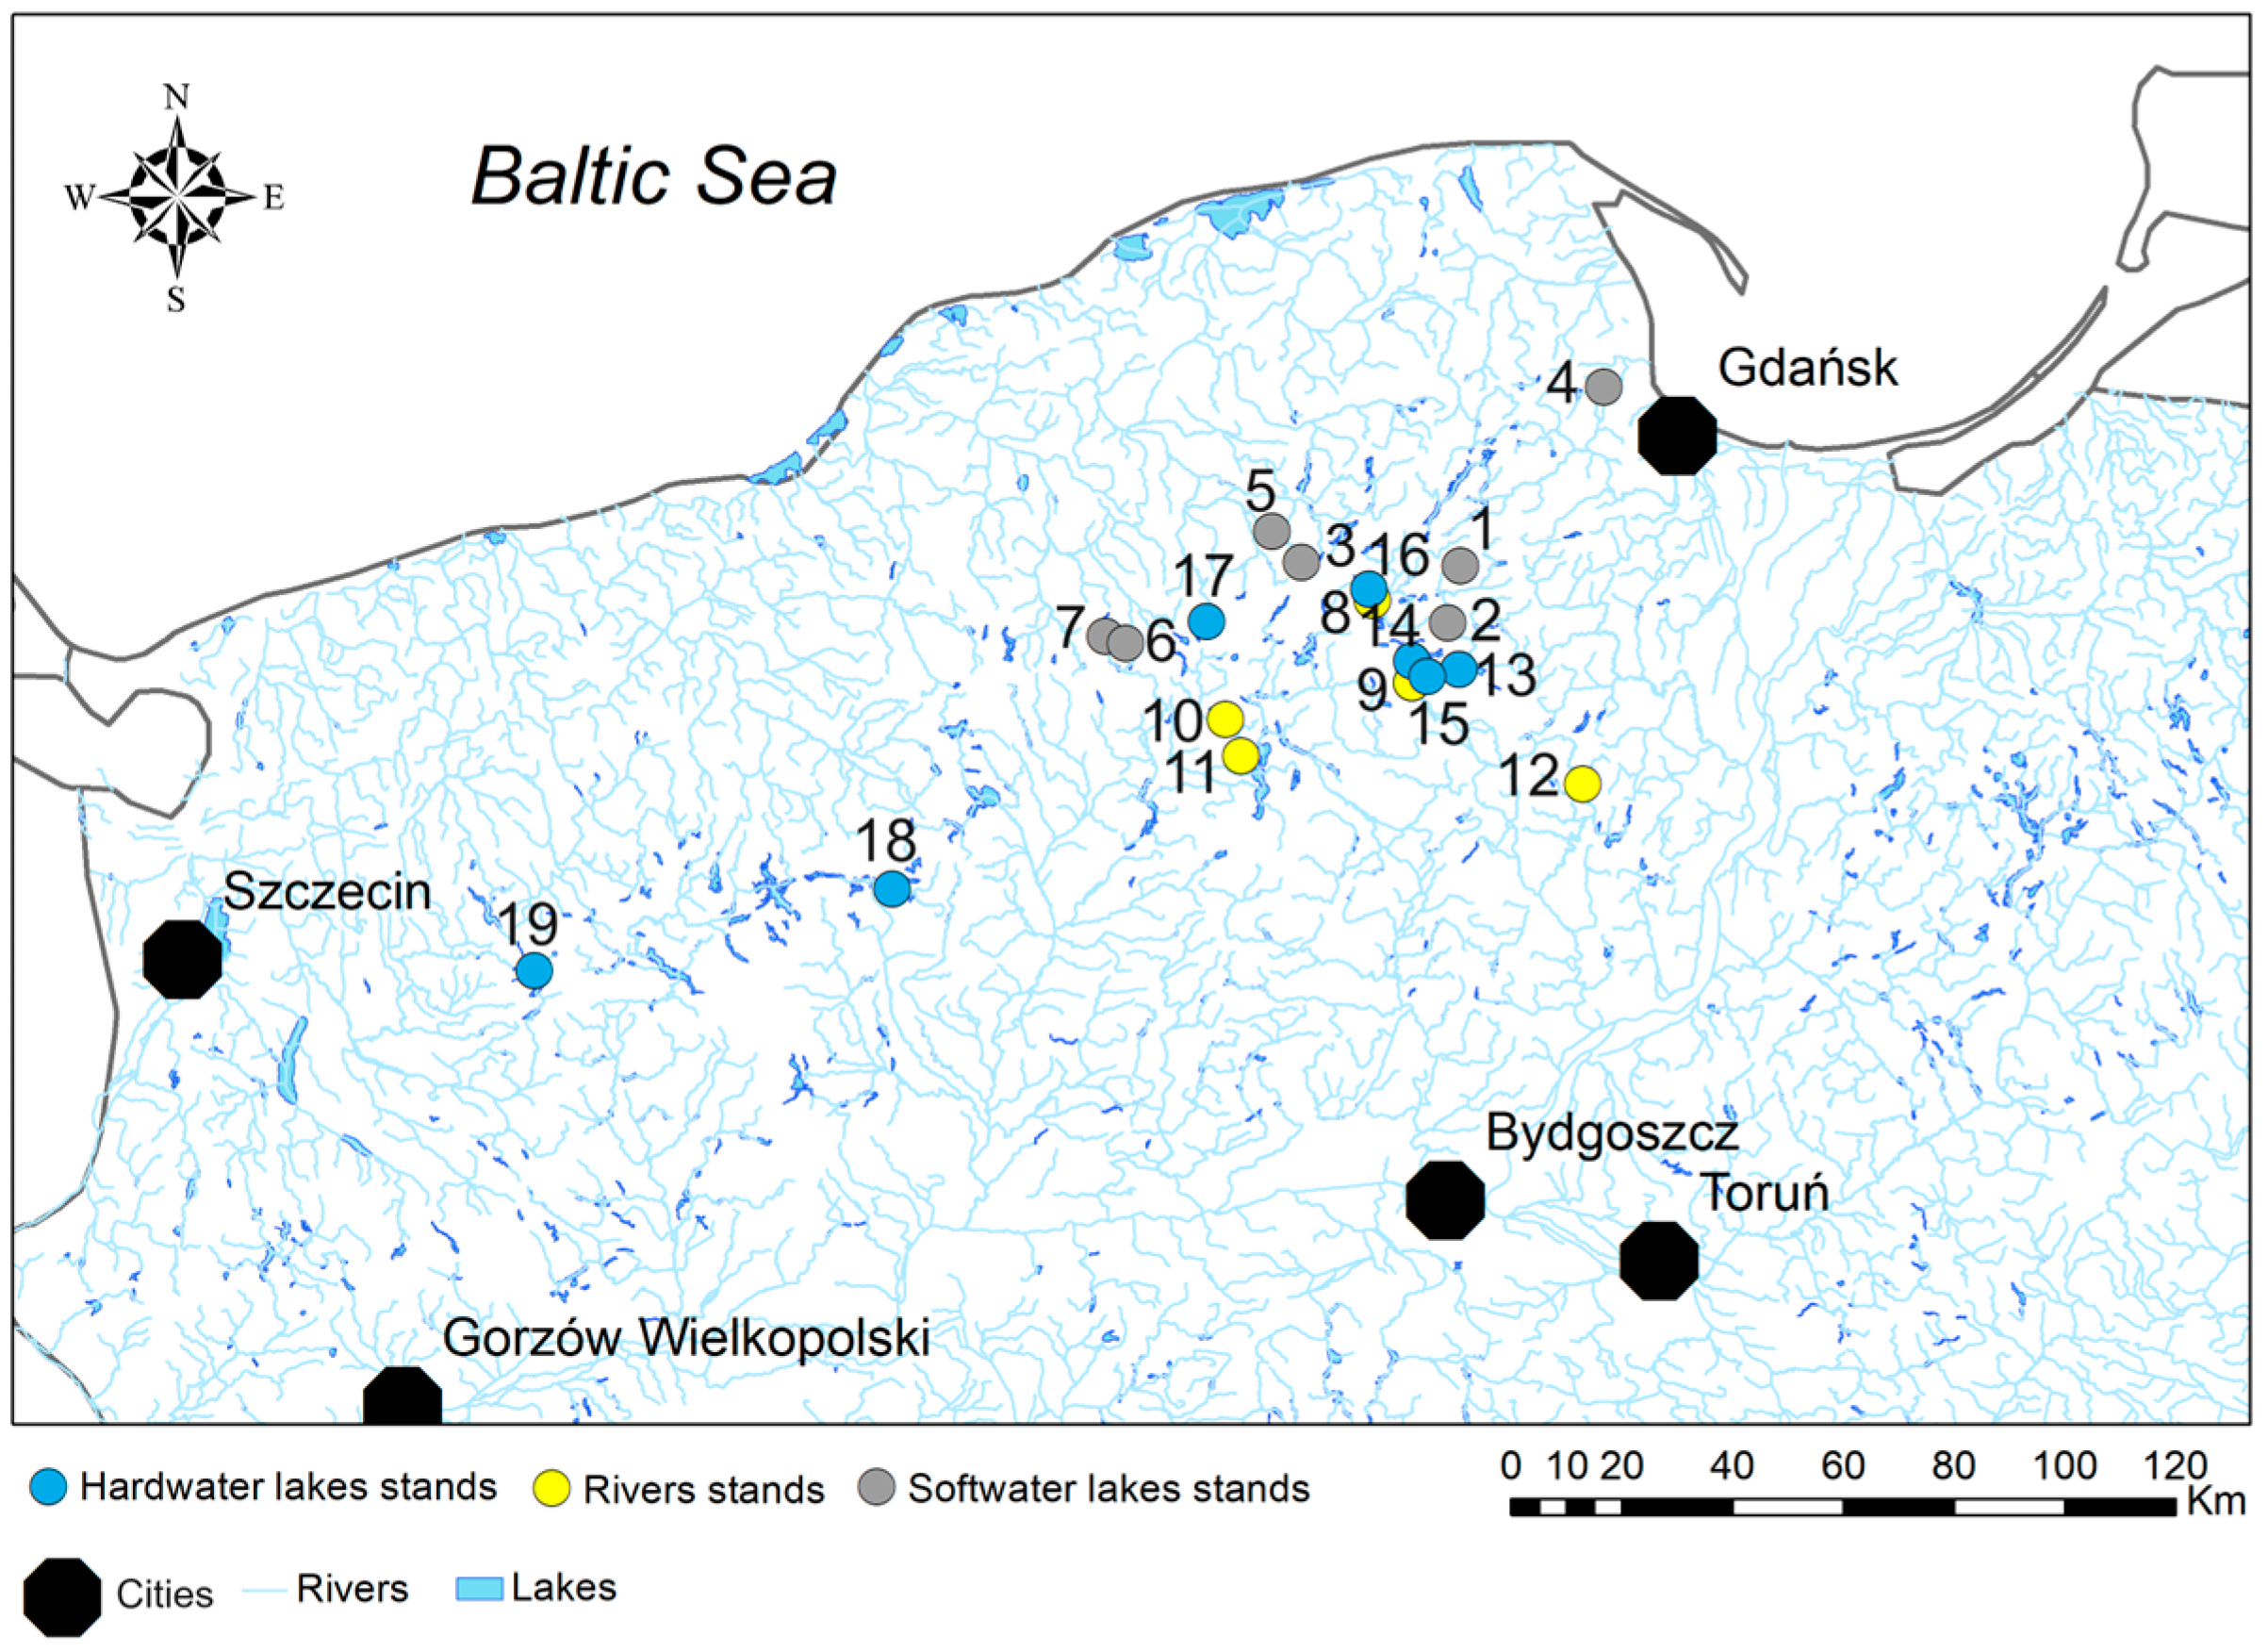
2.1. Study Area

The study focused on conducting field research in northern Poland, specifically examining two types of lakes and rivers as the primary locations of interest. Plant material, comprising an average of 10 specimens of the species E. canadensis from rivers, streams, and hardwater lakes, was collected between 2008 and 2010 at seven research sites located in slow-flowing places along three lowland sandy rivers. An additional seven sites in hardwater lakes provided material for the study. Material from seven softwater lakes was sampled in 2020 (Figure 1, Supplementary Materials Table S1). The classification of softwater lakes followed the recommendation of Murphy [33]. Shortly, the non-degraded softwater lakes are characterized by low Ca2+ concentration (from almost 0 to 15 mg/L) and low conductivity (from about 10 µS cm−1 to no more than 200 µS cm−1). Hardwater lakes are characterized by greater Ca2+ concentrations and higher conductivity.

2.2. Isotope Analyses of E. canadensis Plant Material

The plant material collected was subsequently dried and stored in paper envelopes until 2021 and 2022, when the analyses were performed. The envelopes with the samples in were stored in a warm, rarely used room without sunlight access and low humidity. That preservation condition prevented the samples from being contaminated by fungal communities, which might change the dry samples’ chemical composition [34]. Moreover, before the preparation of the samples for the isotopic analyses, the samples were dried at 60 °C for 48 h again. According to the literature, the drying technique does not influence plants’ δ13C and δ15N results [35]. In addition, the isotopic analyses of herbarium materials are common, and any significant issues other than fungal contaminations due to long-term preservation were not addressed [34,36]. The δ13C and δ15N analyses were carried out at the GISMO Isotope Laboratory at the University of Burgundy in Dijon, France. The dried plants were processed by grinding using a ball mill (MM 400, Retsch, Haan, Germany) or, in cases of limited material, an agate mortar was employed. To remove carbonates, a desiccator method using 37% HCl was applied to the hardwater lake and river samples, generating an acid mist for carbonate reaction. Due to the nonreactivity with HCL during tests, the material from softwater lakes remained nondecarbonated. The final amount obtained after the abovementioned treatments was about 500 mg. For the single analyses, the necessary weight of the samples was about 2 mg. Further details of the method used are outlined in Pronin et al. [14]. Samples prepared using this approach were analyzed on a Flash Smart EA elemental analyzer (Thermo Scientific, Waltham, MA, USA) connected to a mass spectrometer for Delta V stable isotope ratios (Thermo Scientific, USA). Calibration and quality control were performed using the USG40 standard (glutamic acid, δ13C = −26.39‰, δ15N = −4.50‰) and the B2157 standard wheat flour (elemental microanalysis). δ13C and δ15N values are expressed in ‰ relative to the atmospheric standard N2 for nitrogen and V-PDB for carbon. The precision of the analysis was confirmed by the external reproducibility of repeat standard analyses (USG40 and B2157), which were found to be better than ±0.15‰ for δ13C and ±0.20‰ for δ15N (2σ). In this study, the isotopic record is presented as the δ isotopic signature. Its value is determined using the following equation:
δ = R s a m p l e R s t a n d a r d R s t a n d a r d × 1000
where R is 13C/12C for carbon and 15N/14N for nitrogen.
Spectral analyses were performed using the noninvasive FTIR-ATR technique at the Department of Inorganic Chemistry at the Gdańsk University of Technology using the Nicolet iS50 FTIR device from Thermo Fisher Scientific Inc. (Stoughton, MA, USA). The obtained spectra were analyzed using OMNIC 7.3 software (Thermo Fisher Scientific Inc., Stoughton, MA, USA) to identify characteristic regions of vibrations associated with individual chemical bonds that could distinguish the tested materials. For FTIR-ATR analyses of certain samples, especially those from rivers and hardwater lakes, two types of samples were used: decarbonated using the previously described method and nondecarbonated. Unfortunately, nondecarbonated material from rivers and hardwater lakes was used only in a few instances due to its limited quantities (n = 1 for rivers, n = 2 for hardwater lakes). Using the two types of samples described above, the focus of FTIR-ATR spectral analyses was on the 800–1500 cm−1 region where carbonate-related vibrations occur [37].

2.3. Physico-Chemical Analyses of Water from Research Sites

In order to comprehend the environmental conditions of aquatic vegetation habitats, data on physical and chemical parameters were analyzed. The determination of basic physical and chemical parameters of water, including pH, electrolytic conductivity, and the concentration of various forms of inorganic carbon dissolved in water (CO2, HCO3 and CO3−2) using colorimetric titration with appropriate reagents, was conducted directly in the field. Additionally, water samples (0.5 L) were collected for further chemical analyses, examining the concentrations of dissolved organic carbon (DOC) and Ca2+ ions using the methodology outlined by Merdalski et al. [38].

2.4. Statistical Analyses

The data related to the analyzed δ13CORG and δ15NORG values, as well as the physical and chemical variables, were checked for normality of distribution using the Shapiro–Wilk test. The isotope values of E. canadensis and the physical and chemical characteristics of the studied environments did not conform to the normal distribution assumptions. Consequently, nonparametric statistical analyses were employed. Specifically, the Kruskal–Wallis multiple group independent rank test (K–W H) was used. The K–W H analyses were performed to check for the presence or absence of differences in δ13C and δ15N among the studied environments. Furthermore, to illustrate the diversity of the investigated types of freshwater ecosystems with respect to their potential for calcium carbonate precipitation, nonmetric multidimensional scaling nMDS analysis was performed based on several physicochemical water variables. The results of this analysis were supported by the ANOSIM similarity analysis using the Bray–Curtis distance. All of these analyses were carried out using R software, version R.4.2.2 [39], along with the vegan package for nMDS and ANOSIM analysis [40]. The ggplot2 package was used to visualize box plots and nMDS analysis [41]. Subsequently, differences between groups were identified using Dunn’s post hoc test with Bonferroni correction after establishing statistically significant differences via the K–W H test, facilitated by the R package Dunn’s test [42].

3. Results

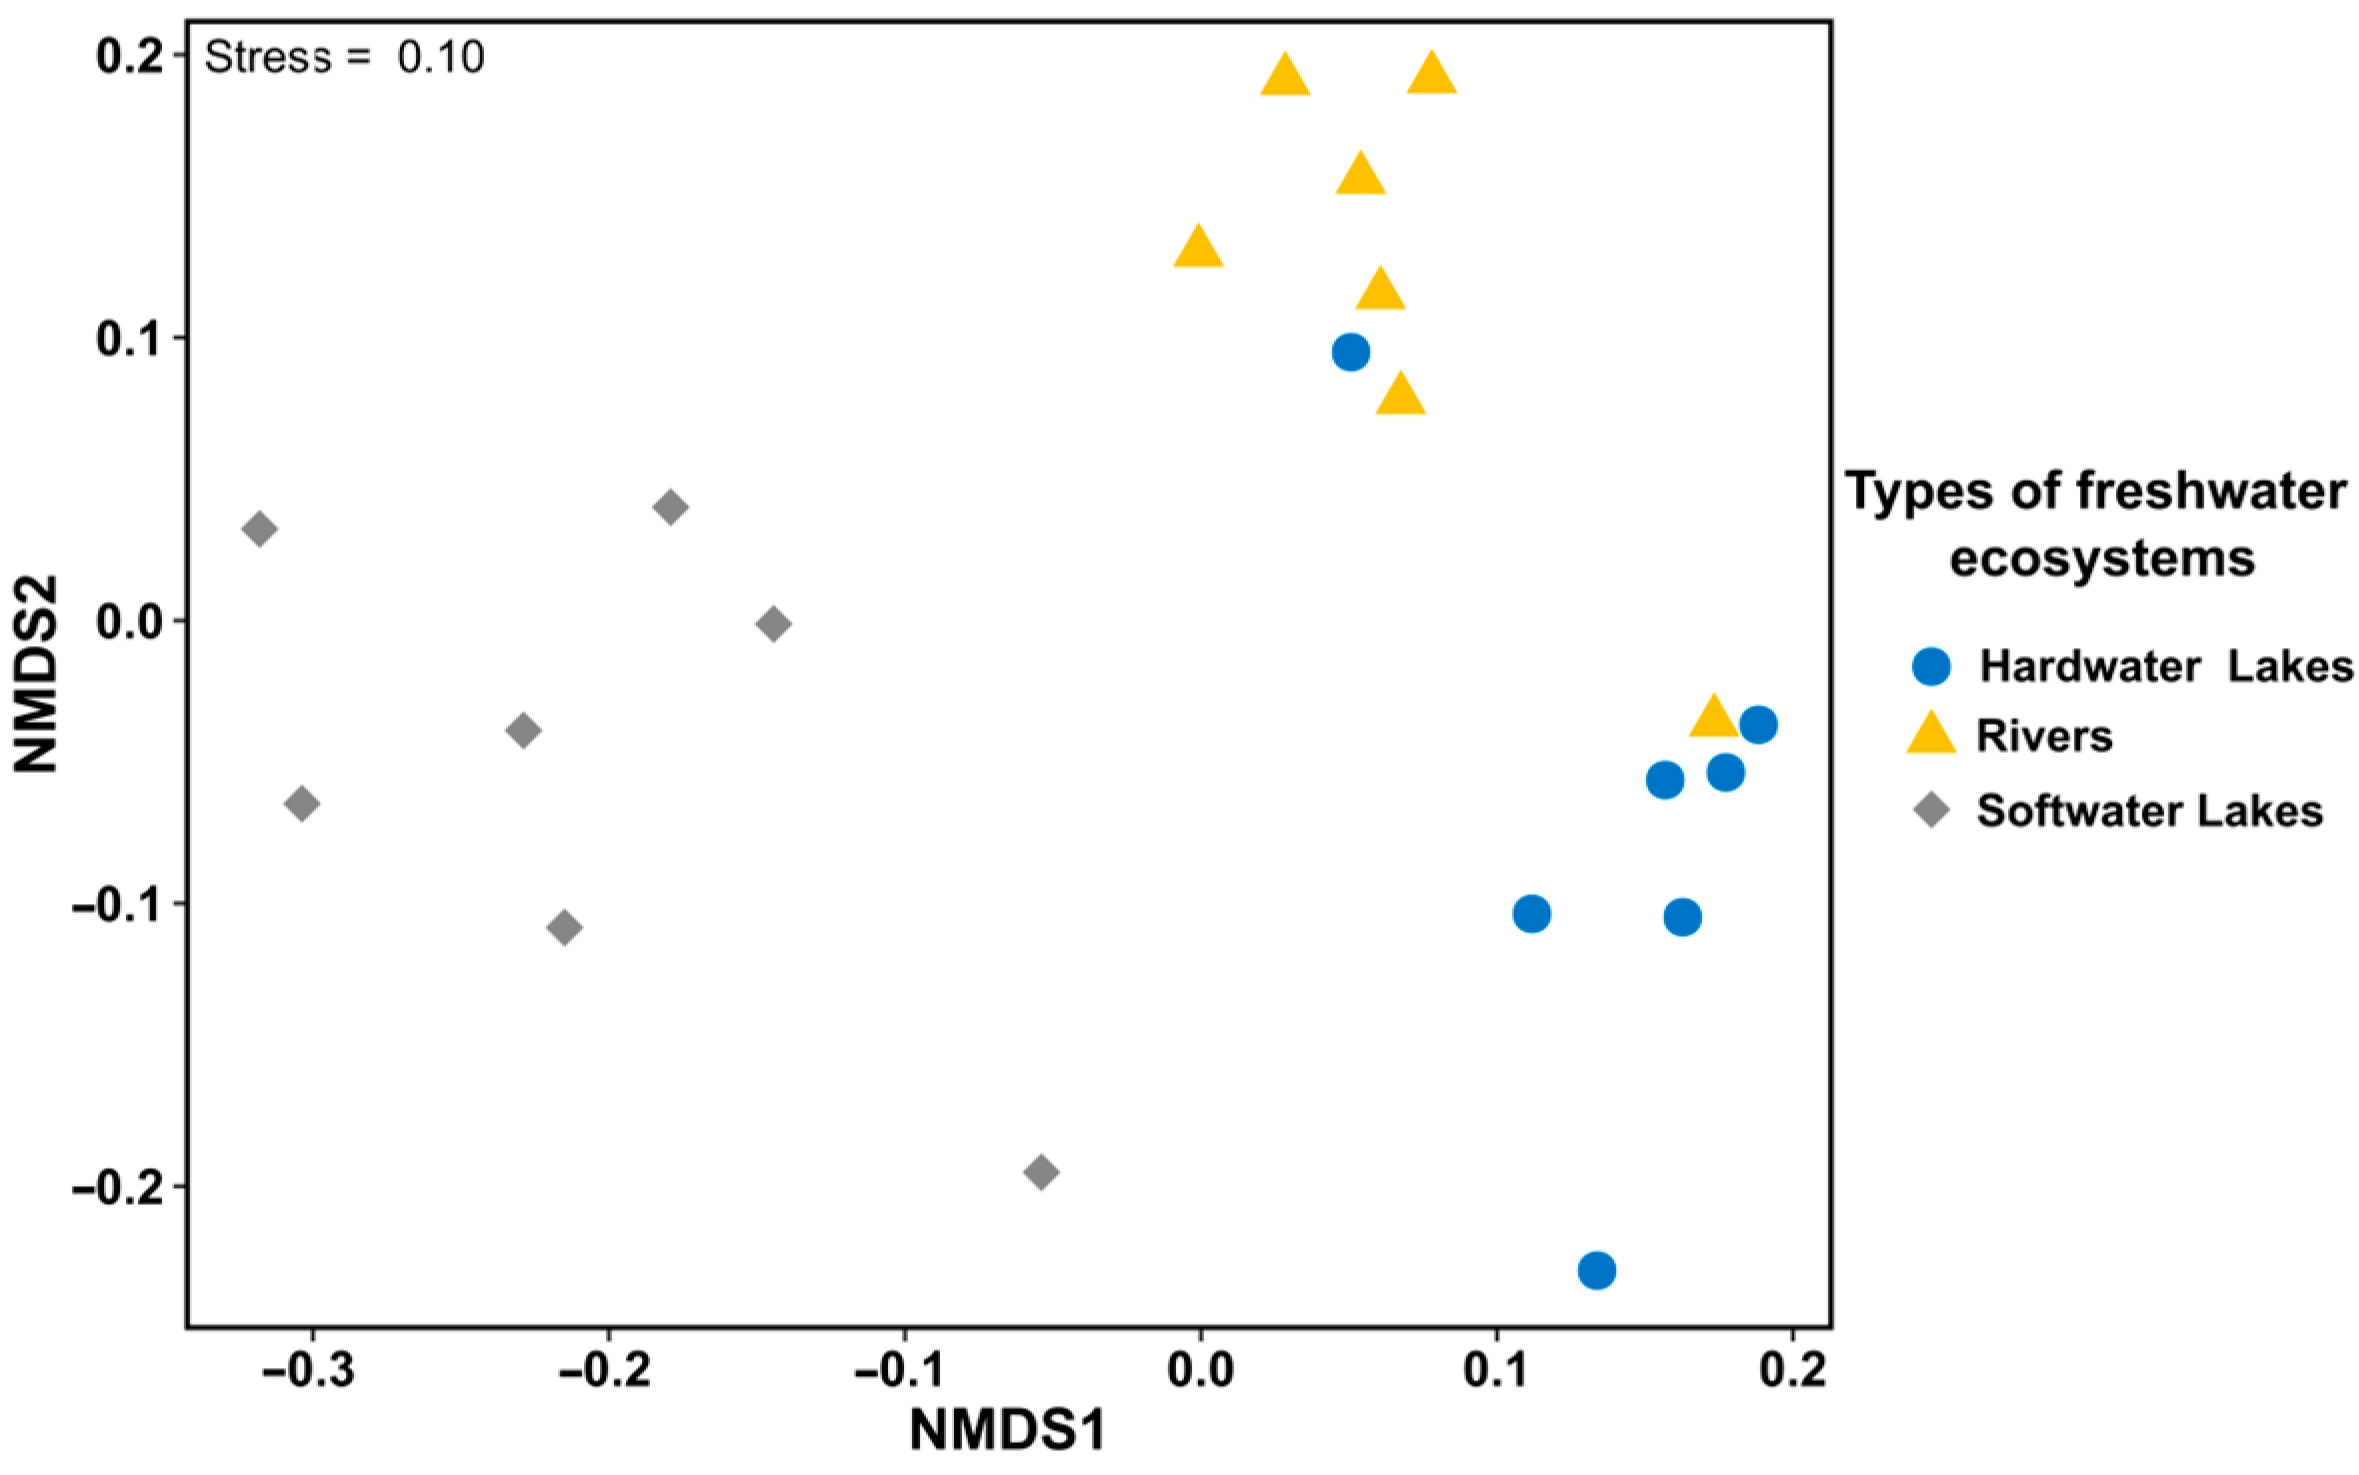
3.1. Diversity of Freshwater Ecosystems Based on the Physical and Chemical Characteristics of Water

The nMDS analysis based on the collected physicochemical data clearly substantiated the assumed differentiation between the analyzed freshwater ecosystems (Figure 2). It is worth mentioning that the two sites, one from hardwater lakes and one from rivers, were grouped differently. Nonetheless, despite the similarities observed in the groups of freshwater ecosystems studied, the ANOSIM similarity analysis showed statistically significant differences between the ecosystems (ANOSIM statistic: r = 0.59, p < 0.001). To highlight the significant differences in the investigated freshwater ecosystems based on variables used in nMDS analysis, the Kruskal–Wallis multiple group independent rank test results are listed in Table 1. The obtained results show that most of the investigated variables (especially DIC, HCO3, CO3−2, and Ca2+) differentiate the three investigated types of freshwater ecosystems (Table 1). The results of the Dunn post hoc test with Bonferroni correction following the Kruskal–Wallis test determining the differences between investigated ecosystems are presented in Table S2 in Supplementary Materials. It should be highlighted that those parameters listed in Table 1 where p = 0.001 exhibit a statistically significant difference (the Dunn post hoc test with Bonferroni correction) between softwater lakes compared to hardwater lakes and rivers, or between only softwater lakes and rivers (for details, see Table S2 in Supplementary Materials).

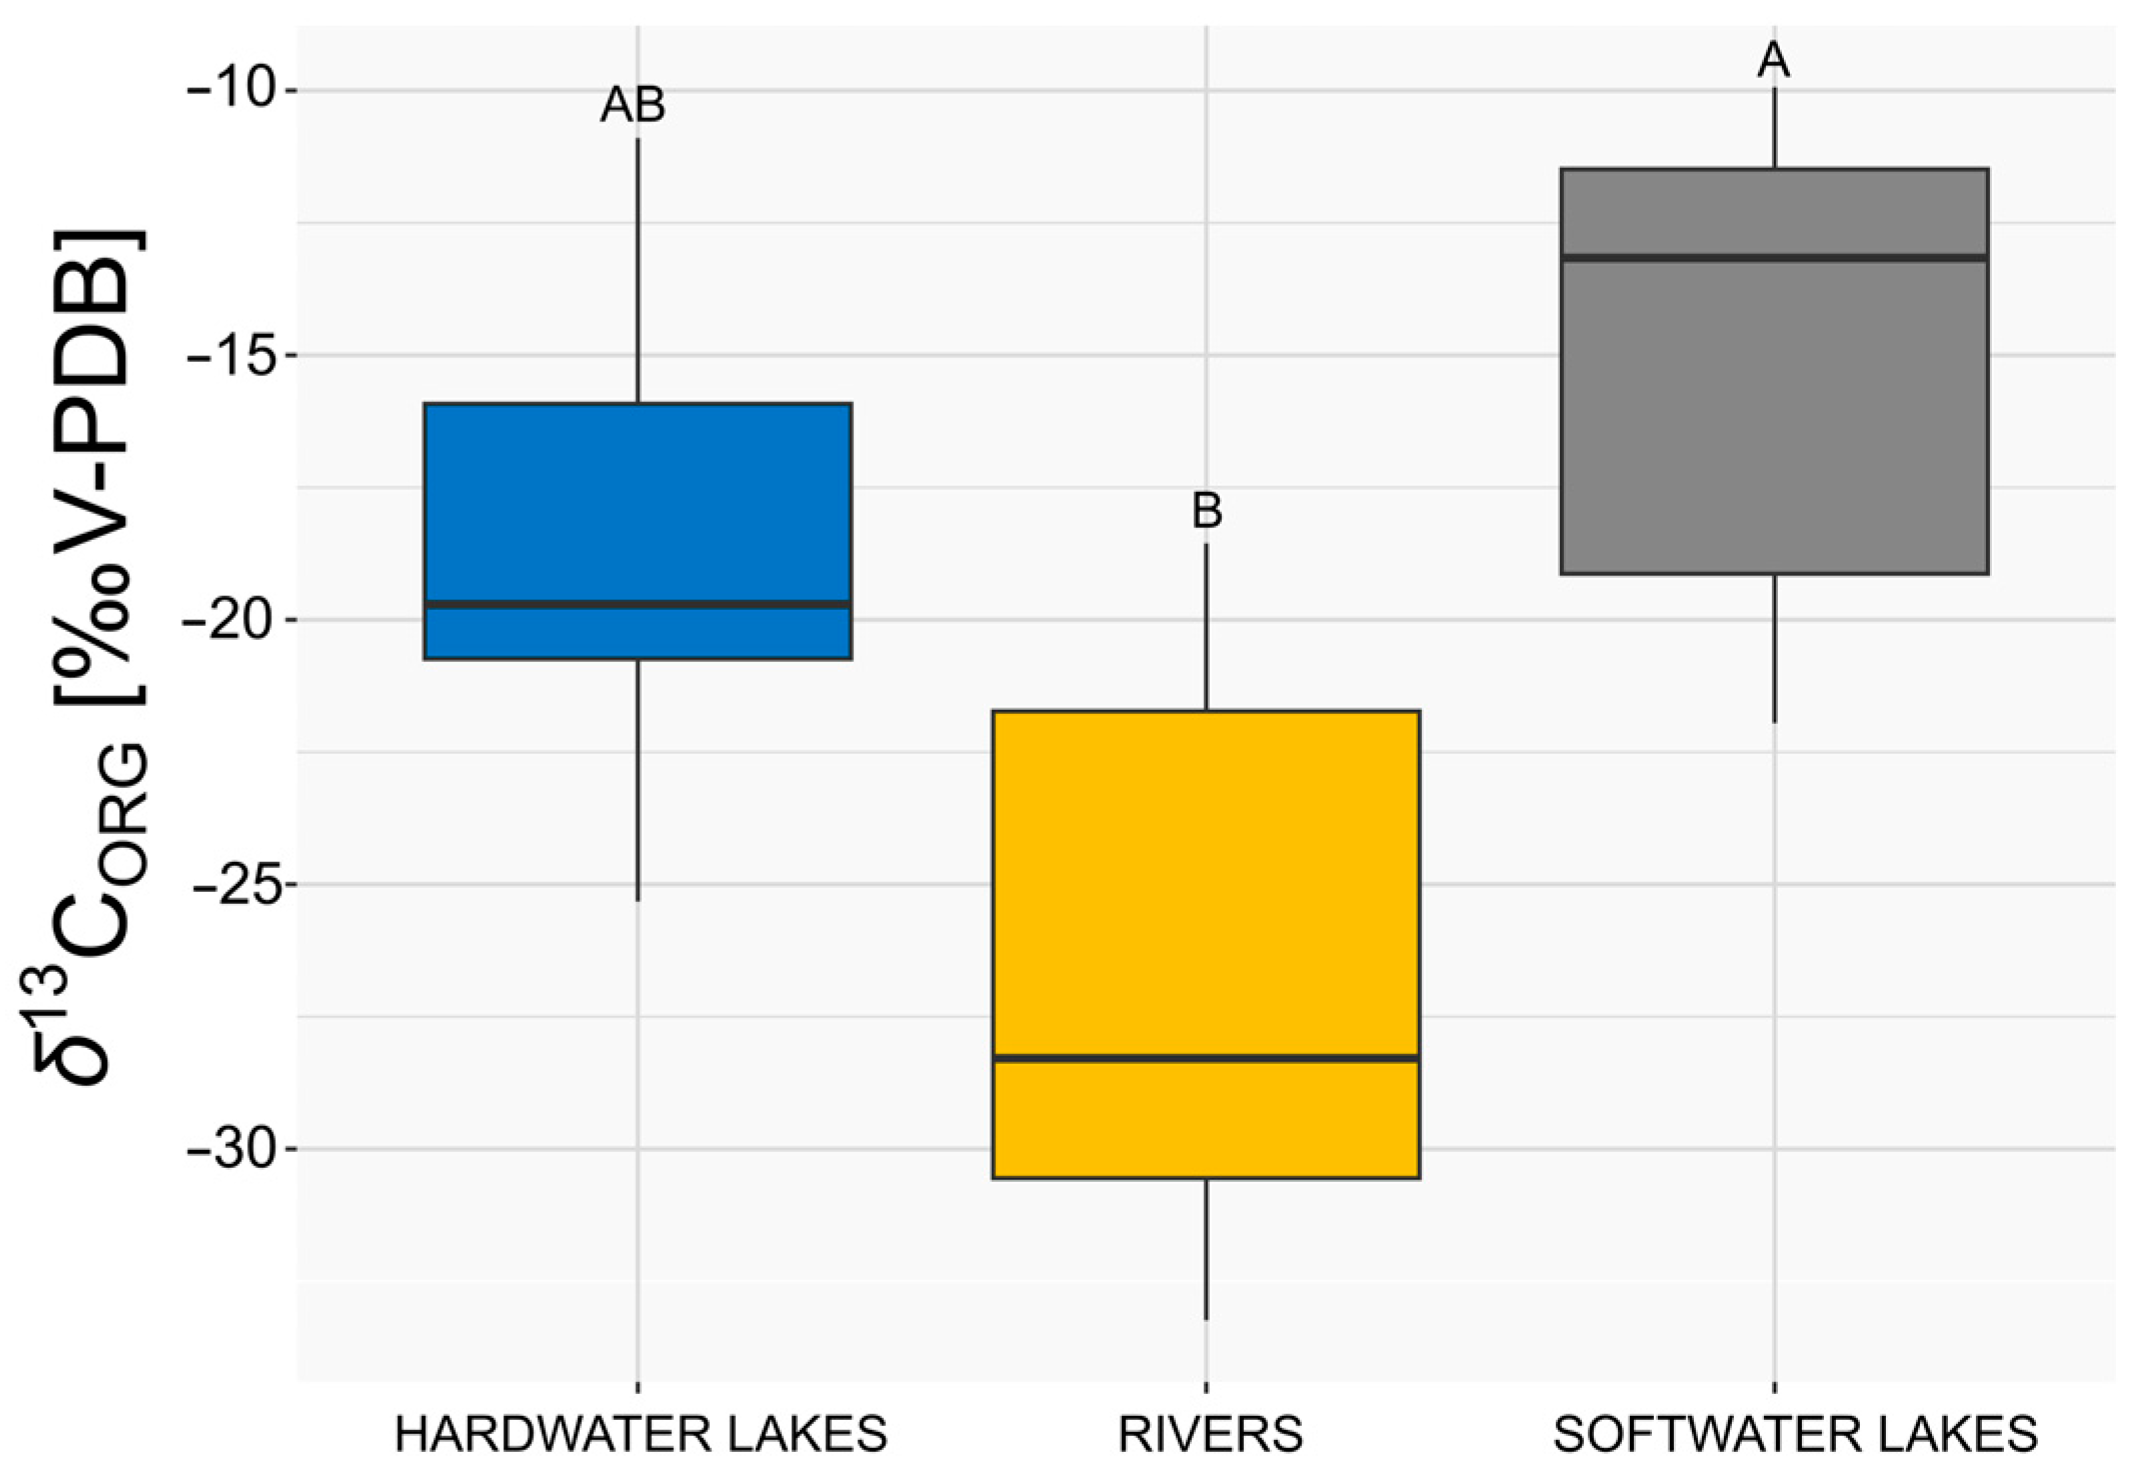
3.2. Comparison of δ13CORG of E. canadensis in Different Freshwater Ecosystems

When comparing the δ13CORG values of E. canadensis in different types of freshwater ecosystems, statistically significant differences were observed. The lowest values were recorded in rivers, while substantially higher values were found in softwater lakes (K–W H = 9.11, p < 0.01 with Bonferroni correction as shown in Figure 3). In contrast, the differences in δ13CORG values between hardwater lakes and rivers were not found to be statistically significant (K–W H = 9.11, p > 0.025 with Bonferroni correction), nor were the differences between hardwater and softwater lakes found to be significant (K–W H = 9.11, p > 0.025 with Bonferroni correction, as shown in Figure 3).

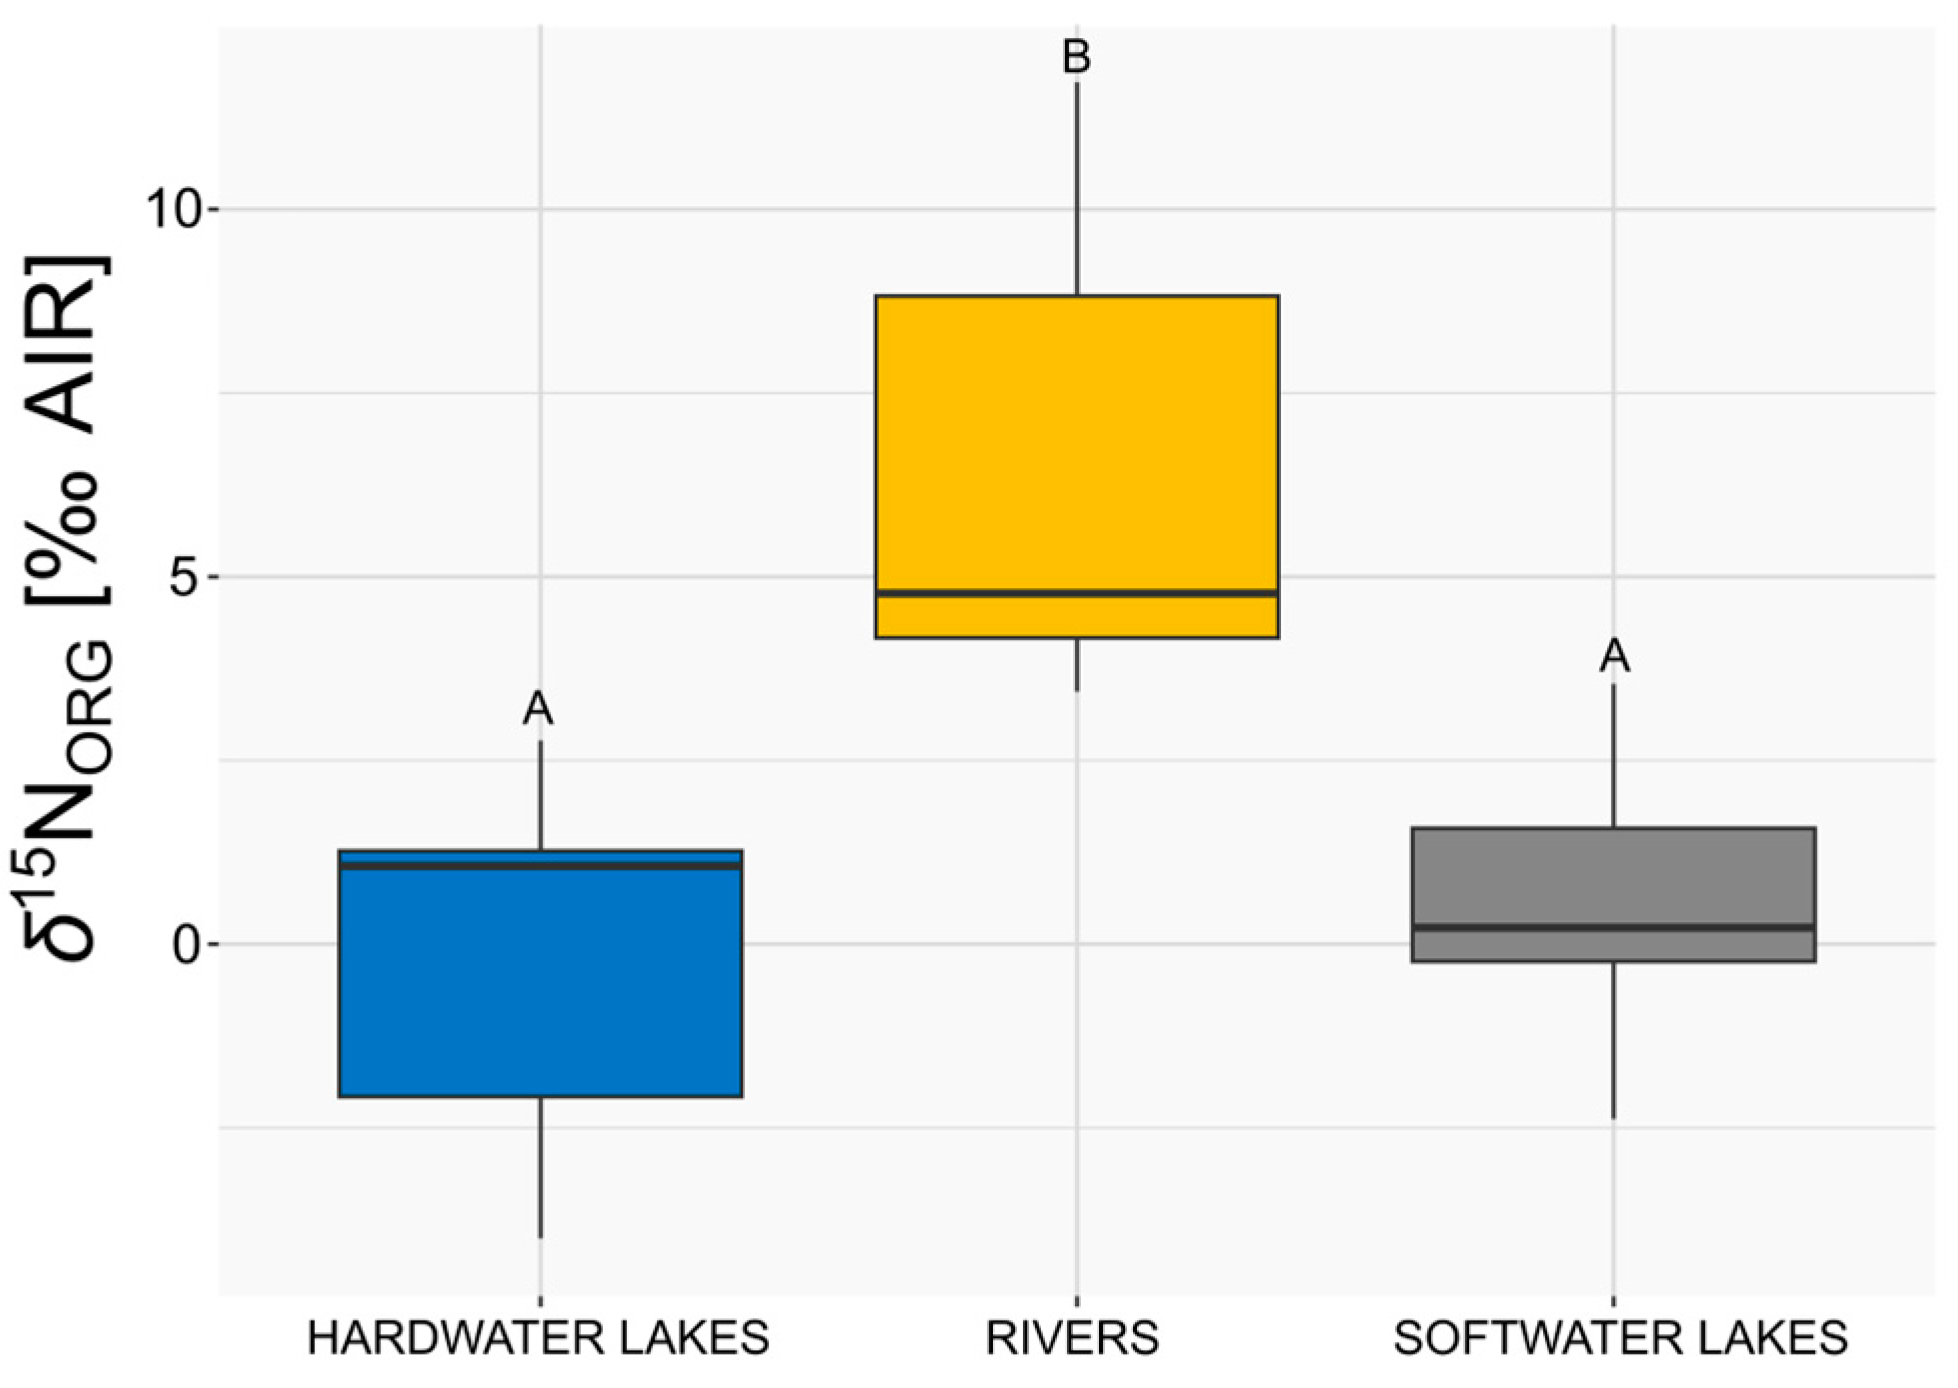
3.3. Comparison of δ15NORG of E. canadensis in Different Freshwater Ecosystems

An evaluation of the δ15NORG results in the studied ecosystems revealed significant differences within them (K–W H = 12.94, p < 0.001, as shown in Figure 4). The δ15NORG values of E. canadensis were the highest in rivers, and they significantly differed from values in soft- and hardwater lakes (Figure 4, p < 0.025 with Bonferroni correction). In contrast, the δ15NORG values observed for hardwater lakes did not exhibit statistically significant differences compared to those recorded for softwater lakes (Figure 4, p > 0.025 with Bonferroni correction).

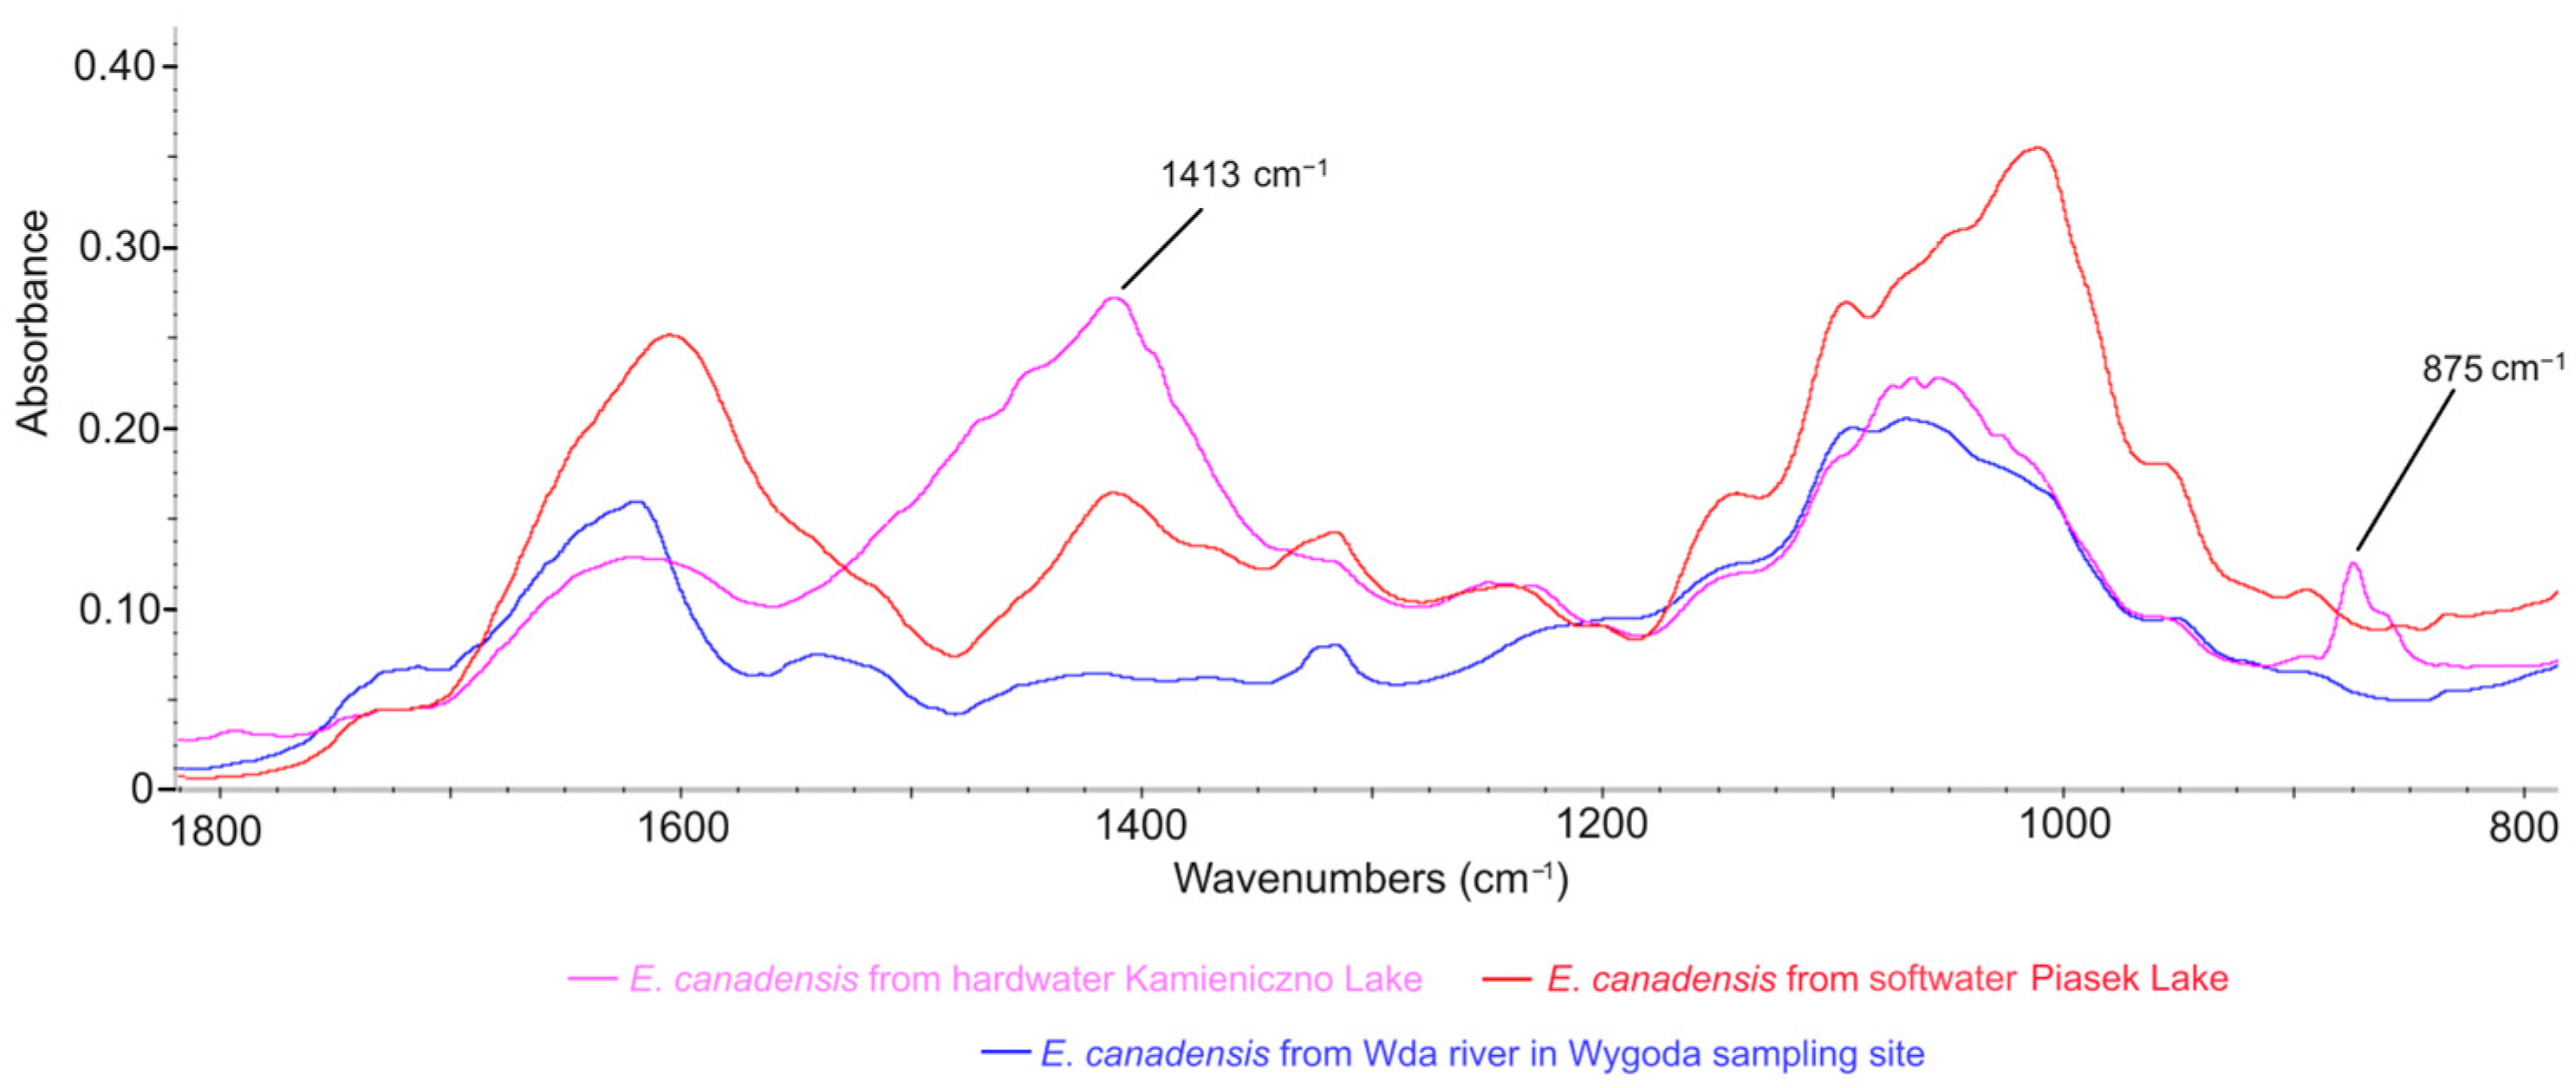
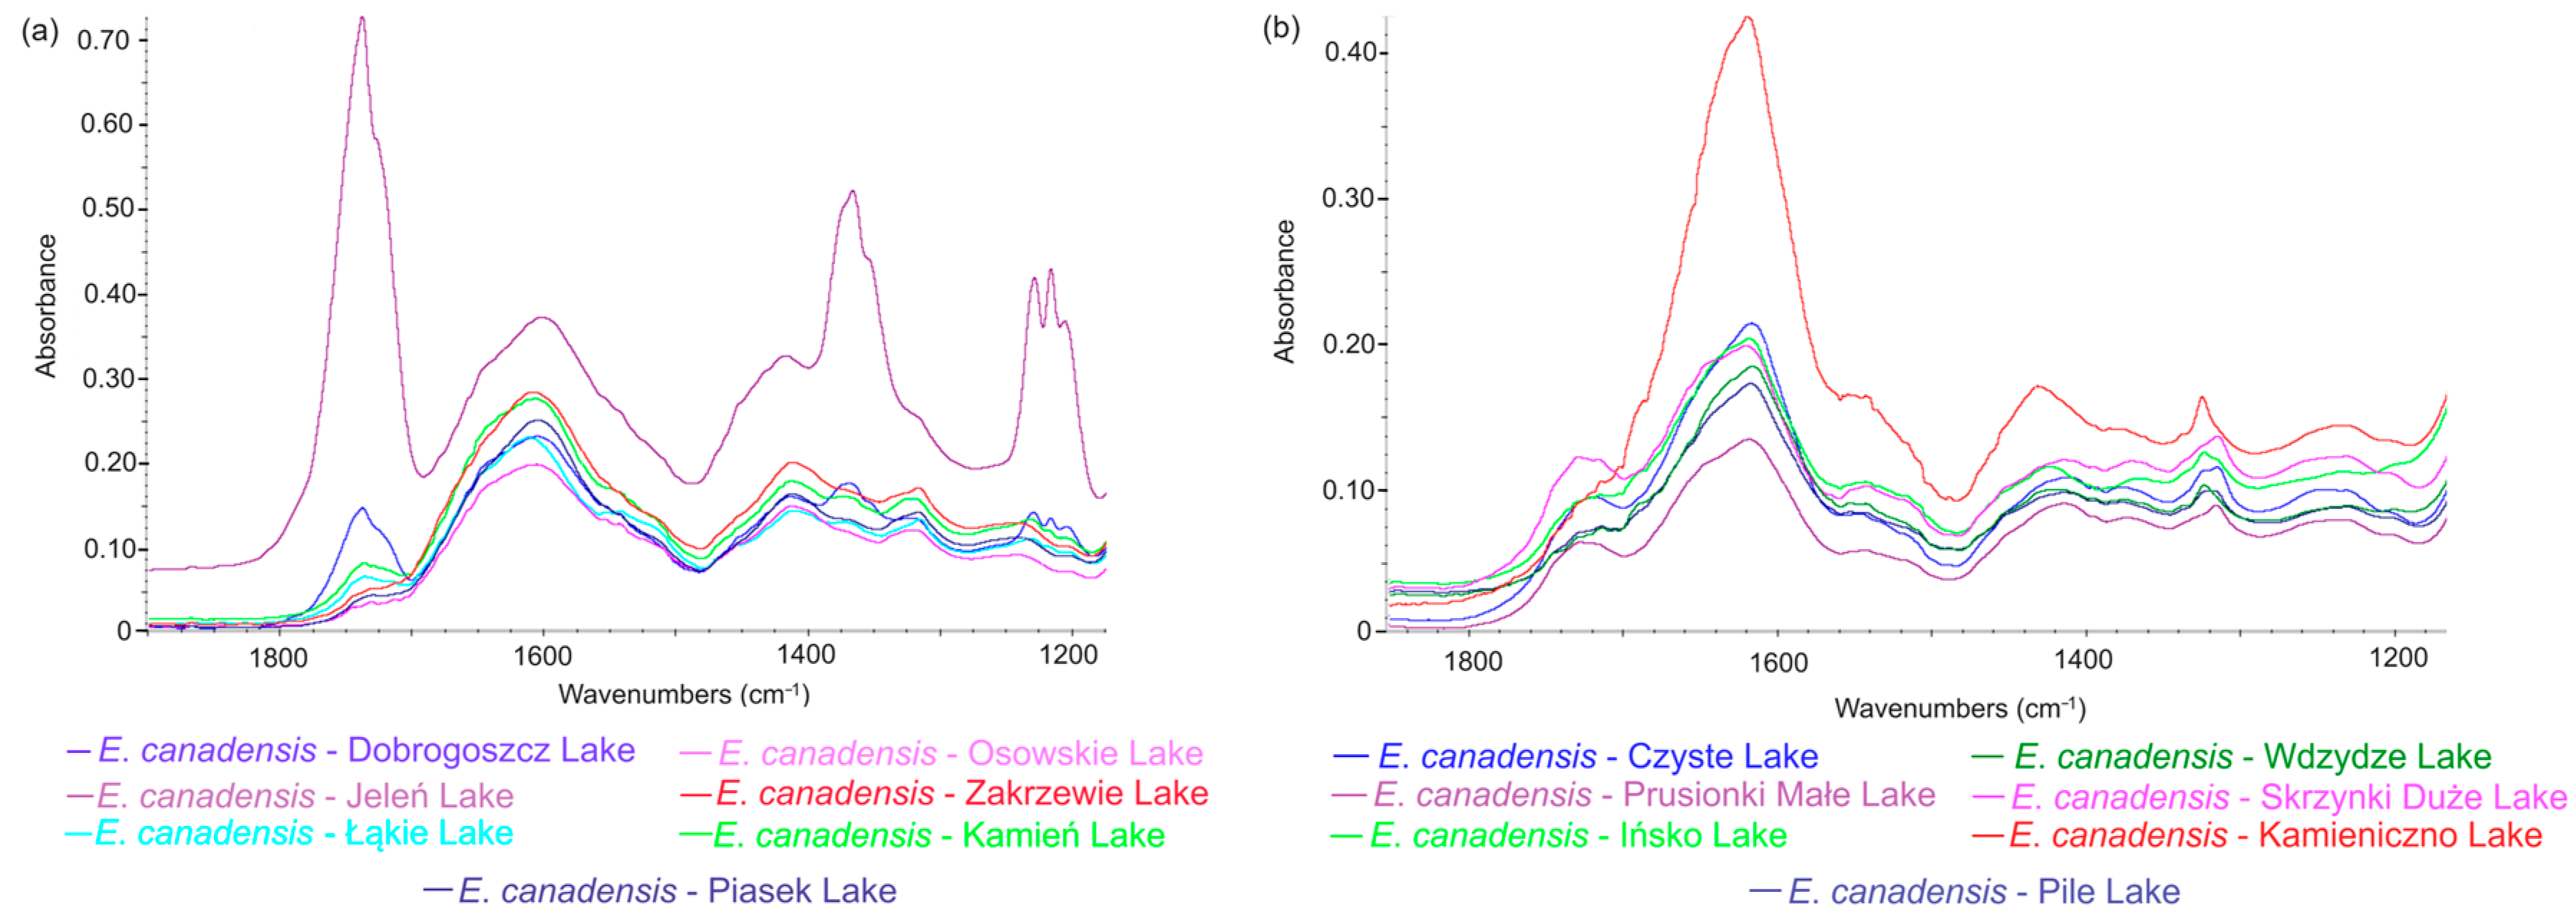
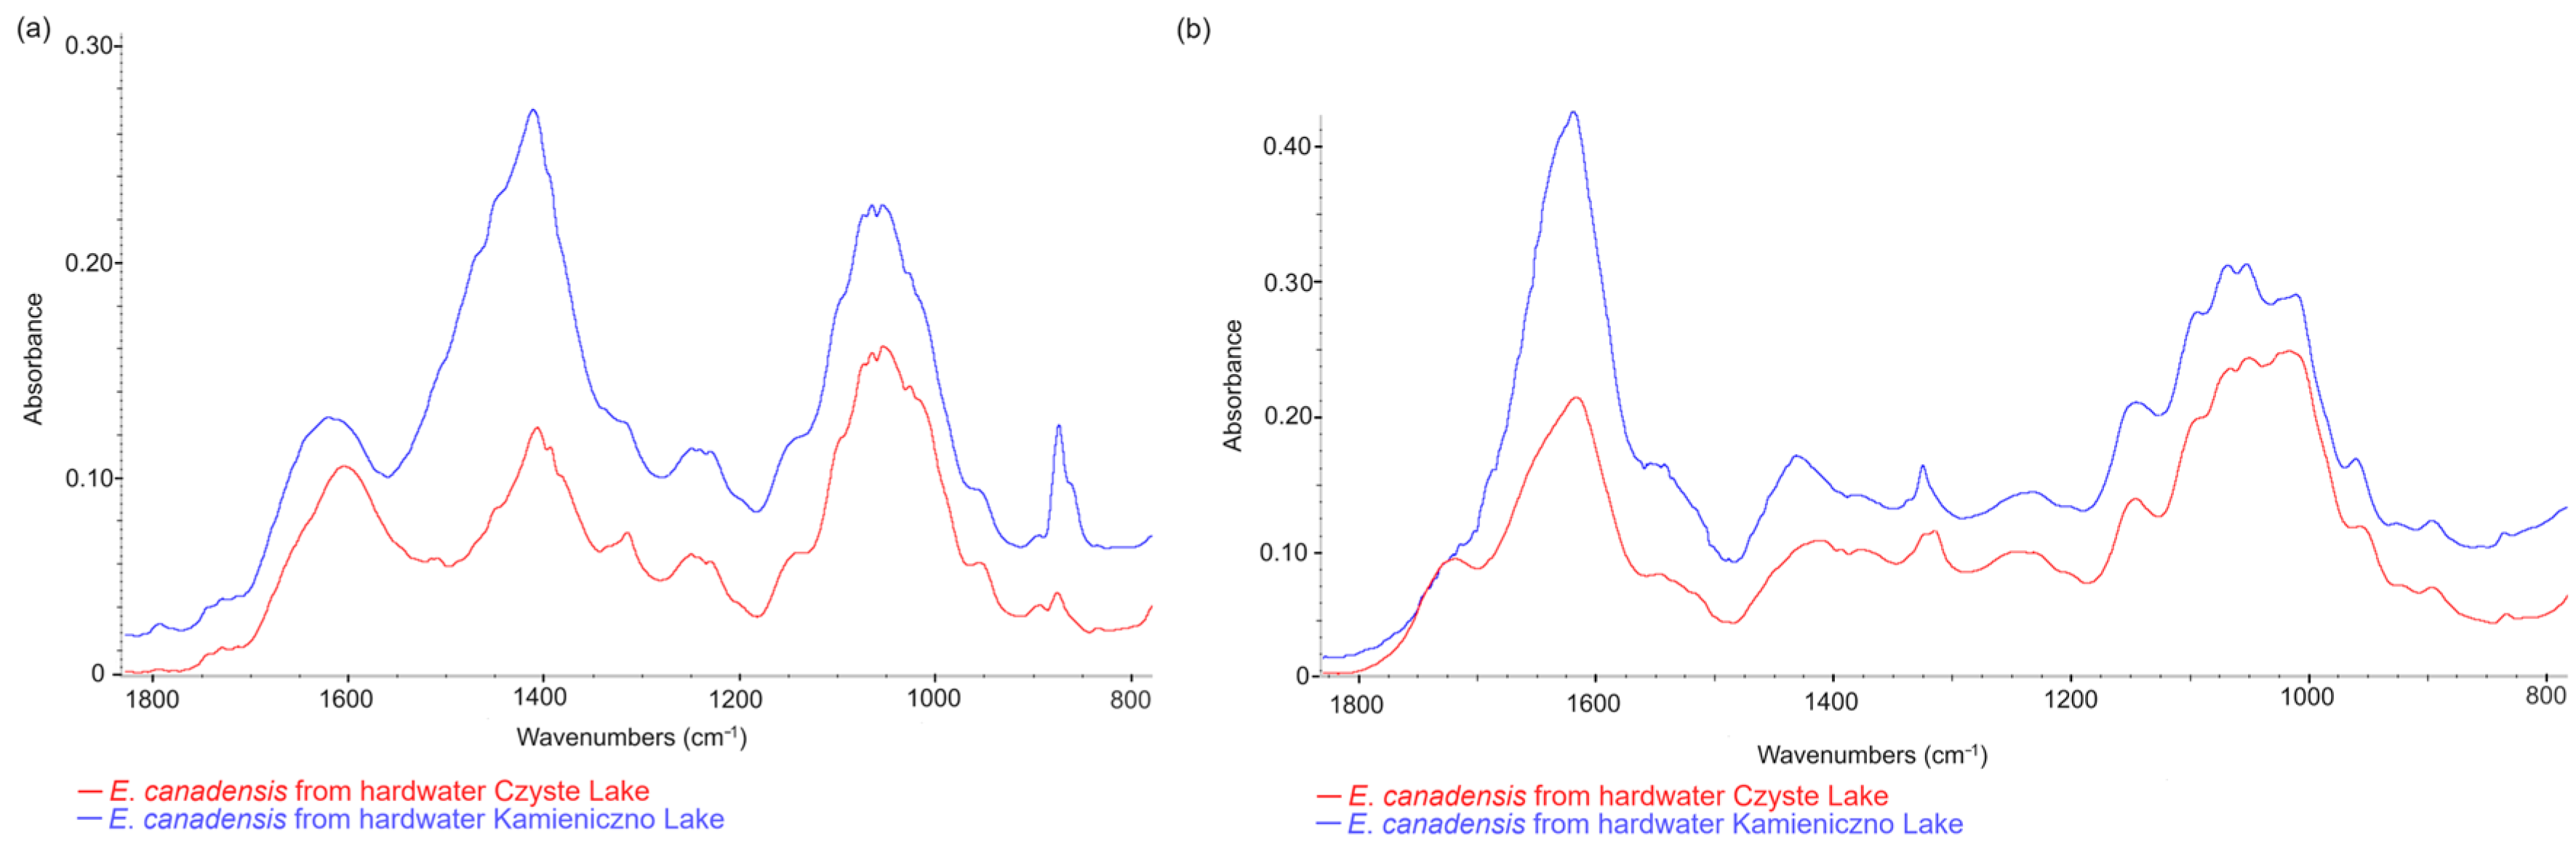
3.4. Comparison of E. canadensis FTIR Spectra in Different Freshwater Ecosystems

A comparison of the spectral regions ranging from 800 to 1800 cm−1 for powdered, undecarbonized E. canadensis material from three different freshwater ecosystems is presented in Figure 5. A visual analysis of this region within the FTIR spectrum indicates intensified vibrations of inorganic carbonate compounds (with peak maxima in the 1400–1500 cm−1 range and a clear peak in the range of 860–880 cm−1 [33]). This phenomenon was most pronounced in the material from hardwater lakes, characterized by a peak maximum of 1413 cm−1 and another at 875 cm−1 (Figure 5). Notably, no clear peaks were found in the samples collected from rivers and softwater lakes, indicating the absence of carbonates in the samples. Furthermore, when comparing the spectral regions in the 1100–1800 cm−1 range between hardwater lakes and rivers (decarbonated material) and softwater lakes (nondecarbonated samples), the differences mentioned above were not observed (Figure 5 and Figure 6). The same applies when comparing the FTIR spectra of non-decarbonized samples with decarbonated material from two hardwater lakes (Figure 7). These results validate the effectiveness of the decarbonization method used for samples from hardwater lakes. However, in the case of one softwater lake, Lake Jeleń, a distinct peak in this region was noticed, which differed from the peaks recorded in the remaining six samples collected in other softwater lakes (Figure 6). Nevertheless, it was not positioned similarly to the carbonate-associated peaks (Figure 5).

4. Discussion

The δ13CORG and δ15NORG values of aquatic vegetation, especially submerged macrophytes, are characterized by very high variability dependent on the environmental conditions in which they thrive [5,13,14,15,16,43]. However, for certain species, habitat differences are not always clearly reflected in their isotopic values [14]. The ecological characteristics of a given species significantly influence both δ13CORG and δ15NORG values, including whether they grow in loose clusters or form dense underwater mats [16]. The results presented in this article, on the basis of both δ13CORG and δ15NORG, confirm that the submerged macrophyte E. canadensis demonstrates varying values based on the type of freshwater environment it inhabits. The discrepancies observed in δ13CORG values most likely arise from significantly different carbon concentrations and carbon circulation between the lakes and rivers analyzed. Softwater lakes, due to their low levels of calcium and magnesium salts, exhibit much lower concentrations of CO2 and HCO3 than hardwater lakes [14]. Since these ions contain a higher proportion of the heavy carbon isotope compared to CO2, variations in the isotopic composition of organic matter are discernible, although not statistically significant (Figure 3, Dunn post hoc test with Bonferroni correction p > 0.025). In the case of rivers, water movement causes intense mixing, leading to an inflow of water rich in isotopically heavier bicarbonates from groundwater. This, in turn, does not disrupt the supply and depletion of specific sources of C used in the photosynthesis process, namely, CO2 or HCO3 [44]. Therefore, the δ13CORG values in E. canadensis substantially differ from those found in lakes (Figure 3, Dunn post hoc test with Bonferroni correction p < 0.025). It is worth emphasizing that E. canadensis uses a carbon concentration mechanism (CCM) that efficiently uses HCO3 as a carbon source. The depletion of C resources, both in the form of CO2 and HCO3, may occur, especially in softwater lakes [45]. Consequently, the higher δ13CORG values recorded for E. canadensis most likely result from the incorporation of more significant amounts of 13C due to the depletion of C resources during intensive plant growth. However, no clear differences in δ13CORG between the two types of lakes were found, which is consistent with the findings from previous studies on the species Nitella flexilis C. Agardh [14]. Therefore, it appears that the stability of conditions and the limited water mixing in lakes contribute to the higher δ13CORG values of E. canadensis compared to those in rivers. The habitat differences between the three investigated types of freshwater ecosystems were clearly divided by comparing several water parameters, especially those related to different forms of carbon dissolved in the water. However, some sites did not fit into the expected group of habitats (Figure 2). This was likely due to the similarity in their physical and chemical water parameters (Table S1 in Supplementary Materials), particularly concerning the concentration of CO3 ions in the Chocimia River near the town of Zielona and waters of the Wda River at the outflow from Lake Wdzydze (Table S1 in Supplementary Materials).
It is crucial to stress that the δ13CORG results presented here align with those reported for E. canadensis in the literature, where authors found results in a similar range (i.e., −12.9 to −22.08‰ [19,22,46]). This confirms that the δ13CORG results of E. canadensis reported here follow patterns recorded in both rivers and hardwater lakes from the temperate zone. However, the results for softwater lakes seem to be higher, especially in those lakes where the pH was the highest or the abundance of plants in the littoral zone was very high, like in Jeleń Lake (data not shown). These findings indicate that the pH and photosynthetic activity significantly influence E. canadensis δ13CORG values.
In the case of δ15NORG values for E. canadensis, more noticeable differences were observed between groups than for δ13CORG (Figure 3 and Figure 4). E. canadensis δ15NORG values in rivers were notably higher than and statistically different from those in lakes (Dunn post hoc test with Bonferroni correction p < 0.025, Figure 4). Those differences are likely caused by increased nitrogen availability originating from organic sources within the catchment area, such as domestic sewage or organic fertilizers runoff. This variance contrasts with the predominantly forested catchment areas of the studied lakes, showcasing a distinct source of nitrogen for plants occurring in rivers [14,43]. Similarly, significantly higher δ15NORG values were obtained in rivers compared to those in lakes for submerged aquatic macrophytes such as Potamogeton crispus L., Potamogeton perfoliatus L., and Stuckenia pectinata (L.) Börner [43]. The δ15NORG values of E. canadensis and three other aquatic plant species in rivers align with the findings of Guo et al. [47], who conducted research on the heavily nitrogen-burdened Nanming River in China, originating from anthropogenic sources. Moreover, the lower values of δ15NORG values for E. canadensis are in line with those reported in the literature, following a similar range (i.e., 1.3 to 4.8‰) [19,22,42], which are more characteristic of not highly disturbed, closed lakes ecosystems.
Even though the δ13CORG and δ15NORG values can distinguish E. canadensis plant material from rivers and lakes, it is not possible to connect the origin of plant material to a specific group of lakes based on the obtained carbon and nitrogen isotope signals (Figure 2 and Figure 3). The discussed results suggest that water movement and water exchange, together with biogenic compounds used as sources of photosynthesis and growth, have a significant impact on the isotopic values of E. canadensis in rivers. However, in the case of lakes, the lack of relationship between δ13CORG and water hardness is surprising, as noticed by the author not only for E. canadensis [14]. It seems that the ability to use two forms of carbon shown by E. canadensis (and N. flexilis from the author’s previous research [14]) causes δ13CORG to be established in an extensive range of values, as shown in Figure 3. Furthermore, the stability of the conditions and a much smaller inflow of pollutants (from mainly the forest catchments in the two types of lakes studied) eliminates the high share of 15N in the organic matter of E. canadensis observed in material from rivers.
Thus, in this study, we decided to apply the fast FTIR-ATR method, which might help in distinguishing the material collected from hardwater and softwater lakes. Comparisons of the E. canadensis FTIR spectrum results allow for effectively differentiating material from hard- and softwater lakes, but only when nondecarbonated material from hardwater lakes is used for analysis. In the decarbonated material, the peaks associated with calcium carbonate, located at 1413 cm−1 and 875 cm−1 in the FTIR-ATR spectrum, do not manifest (see comparison in Figure 7). These additional analyses provide crucial information that might help with revealing the environmental origin of the investigated E. canadensis. It is significant to point out that this type of analysis might be helpful to environmental identification in the case of macroscopic green algae, especially species from the Nitella genus (Pronin—unpublished data), which might be found in softwater and hardwater lakes [14].
The research findings confirm that isotope analyses, combined with the analysis of the 800–1800 cm−1 region of organic matter in aquatic plants, indicate the possibility of identifying the origin of plant material from submerged aquatic plants in northern Poland. To increase the precision and usefulness of identifying the source of plant material, it is recommended that more comprehensive research encompassing a wider range of submerged macrophyte species and a wider group of freshwater ecosystems, including ponds and more eutrophic lakes, be carried out. Moreover, most of the submerged aquatic vegetation utilizes nutrients from the water column and sediments [48]; thus, further studies should also consider habitat diversity based on these environmental elements. It is significant to encompass in this type of study the specific group of submerged plants from the isoetids group (the rosette, evergreen submerged plants characterized as occurring in softwater oligotrophic lakes), which use only the sediments as a nutrient source [49]. Including in further studies plants occurring in a wide range of lakes and rivers (with almost no influence of rapid eutrophication compared to those strongly impacted by this accelerated process) might also provide interesting results, and help in further calibrating and validating the method of plant origin identification suggested in this paper.
It is noteworthy to highlight that, to the best of the author’s knowledge, the methodology employed in this paper to determine the origin of E. canadensis across various freshwater environments represents a pioneering approach. This method has the potential to identify the origin of plant materials, a development that holds significance for environmental, ecological, and paleoenvironmental studies. Moreover, each new data point regarding δ13CORG and δ15NORG values serves as a valuable addition to the limited information available in the existing literature. Consequently, an increase in the documentation of δ13CORG and δ15NORG values associated with aquatic vegetation could lead to more precise and, therefore, more accurate interpretations via the paleoecological analysis of samples containing organic matter sourced from aquatic vegetation.
Nevertheless, the findings here were derived from a local scale, rather than encompassing a comprehensive range of freshwater ecosystems. This limitation restricts the potential utilization of this study to particular ecosystems, notably softwater and hardwater lakes, as well as rivers in temperate climate zones. Additionally, for this method to be feasible, the freshwater ecosystems must possess favorable water and sediment qualities conducive to the growth of aquatic plants. Furthermore, the equipment needed for isotopic and FTIR-ATR analyses is not commonly accessible. Thus, performing such combined analyses requires additional effort and some costs. To sum up, isotopes and FTIR-ATR analyses are complementary to field and herbaria sampling, and both methods might allow for a better understanding of plant diversity and habitat preference.

5. Conclusions

This study delves into the potential of leveraging isotopic signals and spectral analyses of submerged aquatic plant materials, specifically those focusing on E. canadensis, to discern the environmental conditions of their origin. The findings underscore the significant distinctions in stable carbon and nitrogen isotope compositions (δ13CORG and δ15NORG) between samples obtained from rivers and lakes, particularly noting higher δ15NORG values in river-collected materials. However, while δ13CORG and δ15NORG did not distinctly differentiate between softwater and hardwater lake materials, notable differences emerged in the FTIR-ATR spectral analysis, particularly as regards the presence and intensity of calcium carbonate peaks derived when analyzing nondecarbonated plant material from hardwater lakes.
This paper introduces a novel methodology that combines these approaches, offering a pioneering means of swiftly identifying the origins of submerged aquatic plant materials across diverse freshwater environments. The potential for the rapid identification of plant material origins holds significant promise for environmental, ecological, and paleoenvironmental research, providing insights into habitat distinctions that may otherwise remain elusive. Furthermore, each new data point contributing to the δ13CORG and δ15NORG values of aquatic vegetation is invaluable in expanding the limited existing literature, promising more precise and accurate interpretations of paleoecological analyses involving organic material derived from aquatic vegetation.
This research not only reaffirms the value of isotope analyses in discerning the origins of aquatic plant materials, but also underscores the need for broader and more diverse studies involving various submerged macrophyte species across a wider spectrum of freshwater ecosystems. Such expanded research could enhance precision in identifying plant origins, especially considering the habitat diversity of freshwater ecosystems.
Furthermore, the increased knowledge of macrophytes δ13CORG and δ15NORG values might also be essential in further tracking accelerated eutrophication based on aquatic vegetation isotopic signals. This might be important due to the assumption that the increased speed of eutrophication influences organic matter sedimentation in aquatic ecosystems, especially lakes.

Supplementary Materials

The following supporting information can be downloaded at https://www.mdpi.com/article/10.3390/limnolrev24010002/s1, Table S1. The characteristics of the study sites with the raw data of measured variables; Table S2. The results of the Dunn post hoc test with Bonferroni correction following the Kruskal–Wallis test determining the differences between variables of investigated ecosystems.

Funding

This study was funded by the Polish National Science Centre under project no. 2019/32/C/NZ8/00147 and the UGrants—start program 533-D000-GS21-22 (application no. 1220/34/2022).

Data Availability Statement

Most data generated or analyzed during this study are included in this article. The rest of the included data are available from the authors on reasonable request.

Acknowledgments

This study was funded by the Polish National Science Centre under project no. 2019/32/C/NZ8/00147 and the UGrants—start program 533-D000-GS21-22 (application no. 1220/34/2022). I thank the GISMO platform and its staff (Biogéosciences, UMR 6282 CNRS, Université de Bourgogne) for performing stable isotope analyses during my internship in this unit. Marek Merdalski is acknowledged for assisting in the collection of E. canadensis from hardwater lakes and rivers, as well as conducting physicochemical analyses. Małgorzata Pronin is acknowledged for her support and valuable input in manuscript preparation. I would like to thank the Translmed Publishing Group (TPG), a proofreading and copyediting company, for their assistance in proofreading and copyediting the first version of this manuscript. My sister, Justyna Pronin, is acknowledged for the proofreading and copyediting of the final version of the manuscript. I also thank the Regional Director of Environmental Protection in Gdańsk for allowing me to collect E. canadenis from Kamień Lake, situated in natural reserves (decision no. RDOŚ-Gd-WOC.6205.24.2020. MaK.2). Four anonymous peer reviewers and the Editor are kindly acknowledged for their comments and suggestions, which helped improve the manuscript.

Conflicts of Interest

The authors declare no competing interests.

References

  1. Tickner, D.; Opperman, J.J.; Abell, R.; Acreman, M.; Arthington, A.H.; Bunn, S.E.; Cooke, S.J.; Dalton, J.; Darwall, W.; Edwards, G.; et al. Bending the Curve of Global Freshwater Biodiversity Loss: An Emergency Recovery Plan. Bioscience 2020, 70, 330–342. [Google Scholar] [CrossRef] [PubMed]
  2. Lindholm, M.; Alahuhta, J.; Heino, J.; Hjort, J.; Toivonen, H. Changes in the Functional Features of Macrophyte Communities and Driving Factors across a 70-Year Period. Hydrobiologia 2020, 847, 3811–3827. [Google Scholar] [CrossRef]
  3. Li, G.; Hu, S.; Hou, H.; Kimura, S. Heterophylly: Phenotypic Plasticity of Leaf Shape in Aquatic and Amphibious Plants. Plants 2019, 8, 420. [Google Scholar] [CrossRef] [PubMed]
  4. Cronin, G.; Lodge, D.M. Effects of Light and Nutrient Availability on the Growth, Allocation, Carbon/Nitrogen Balance, Phenolic Chemistry, and Resistance to Herbivory of Two Freshwater Macrophytes. Oecologia 2003, 137, 32–41. [Google Scholar] [CrossRef]
  5. Chmara, R.; Pronin, E.; Szmeja, J. Functional Macrophyte Trait Variation as a Response to the Source of Inorganic Carbon Acquisition. PeerJ 2021, 9, e12584. [Google Scholar] [CrossRef]
  6. Aiken, S.G. An Experiment Relating Vegetative Morphology of Myriophyllum alterniflorum DC. (Haloragaceae) to Growth Substrate. Aquat. Bot. 1981, 10, 383–388. [Google Scholar] [CrossRef]
  7. Kaplan, Z. Phenotypic Plasticity In Potamogeton (Potamogetonaceae). Folia Geobot. 2002, 37, 141–170. [Google Scholar] [CrossRef]
  8. Tokarska-Guzik, B. The Establishment and Spread of Alien Plant Species (Kenophytes) in the Flora of Poland; Wydawnictwo Uniwersytetu Śląskiego: Katowice, Poland, 2005; ISBN 8322614853. [Google Scholar]
  9. Kolada, A.; Kutyła, S. Elodea canadensis (Michx.) in Polish Lakes: A Non-Aggressive Addition to Native Flora. Biol. Invasions 2016, 18, 3251–3264. [Google Scholar] [CrossRef]
  10. Cegłowska, A.; Jusik, S.; Samecka-Cymerman, A.; Klink, A.; Szoszkiewicz, K. Habitat Requirements of Elodea canadensis Michx. in Polish Rivers. Oceanol. Hydrobiol. Stud. 2017, 46, 363–378. [Google Scholar] [CrossRef]
  11. Culley, T.M. Why Vouchers Matter in Botanical Research. Appl. Plant Sci. 2013, 1, 1300076. [Google Scholar] [CrossRef]
  12. Guiry, E. Complexities of Stable Carbon and Nitrogen Isotope Biogeochemistry in Ancient Freshwater Ecosystems: Implications for the Study of Past Subsistence and Environmental Change. Front. Ecol. Evol. 2019, 7, 313. [Google Scholar] [CrossRef]
  13. Pronin, E.; Panettieri, M.; Torn, K.; Rumpel, C. Stable Carbon Isotopic Composition of Dissolved Inorganic Carbon (DIC) as a Driving Factor of Aquatic Plants Organic Matter Build-up Related to Salinity. Ecol. Indic. 2019, 99, 230–239. [Google Scholar] [CrossRef]
  14. Pronin, E.; Banaś, K.; Chmara, R.; Ronowski, R.; Merdalski, M. Do Stable Carbon and Nitrogen Isotope Values of Nitella flexilis Differ between Softwater and Hardwater Lakes? Aquat. Sci. 2023, 85, 79. [Google Scholar] [CrossRef]
  15. Apolinarska, K.; Pełechaty, M.; Pronin, E. Discrepancies between the Stable Isotope Compositions of Water, Macrophyte Carbonates and Organics, and Mollusc Shells in the Littoral Zone of a Charophyte-Dominated Lake (Lake Lednica, Poland). Hydrobiologia 2016, 768, 1–17. [Google Scholar] [CrossRef]
  16. Pronin, E.; Pełechaty, M.; Apolinarska, K.; Pukacz, A.; Frankowski, M. Sharp Differences in the Δ13C Values of Organic Matter and Carbonate Encrustations but Not in Ambient Water DIC between Two Morphologically Distinct Charophytes. Hydrobiologia 2016, 773, 177–191. [Google Scholar] [CrossRef]
  17. Liu, H.; Liu, J.; Hu, J.; Cao, Y.; Xiao, S.; Liu, W. Systematical δ 13C Investigations of TOC in Aquatic Plants, DIC and Dissolved CO2 in Lake Water from Three Tibetan Plateau Lakes. Ecol. Indic. 2022, 140, 109060. [Google Scholar] [CrossRef]
  18. Liu, J.; Cheng, L.; Liu, Q.; Yao, S.; Wang, X.; Liu, Y.; Zhang, Y.; Xue, B. Sedimentary Macrophyte δ13Ccellulose Record of Environmental Evolution over the Past Century in East Taihu Lake, China. Ecol. Indic. 2023, 154, 110716. [Google Scholar] [CrossRef]
  19. Chappuis, E.; Seriñá, V.; Martí, E.; Ballesteros, E.; Gacia, E. Decrypting Stable-Isotope (δ13C and δ15N) Variability in Aquatic Plants. Freshw. Biol. 2017, 62, 1807–1818. [Google Scholar] [CrossRef]
  20. Campbell, L.M.; Hecky, R.E.; Wandera, S.B. Stable Isotope Analyses of Food Web Structure and Fish Diet in Napoleon and Winam Gulfs, Lake Victoria, East Africa. J. Great Lakes Res. 2003, 29, 243–257. [Google Scholar] [CrossRef]
  21. Morkūnė, R.; Bučas, M.; Kataržytė, M.; Politi, T.; Vaičiūtė, D.; Vizzini, S.; Martin, G. Food Sources for Benthic Grazers in Trophic Networks of Macrophyte Habitats in a Transitional Baltic Ecosystem. Water 2022, 14, 1565. [Google Scholar] [CrossRef]
  22. Douglas, P.M.J.; Stratigopoulos, E.; Park, S.; Keenan, B. Spatial Differentiation of Sediment Organic Matter Isotopic Composition and Inferred Sources in a Temperate Forest Lake Catchment. Chem. Geol. 2022, 603, 120887. [Google Scholar] [CrossRef]
  23. Wu, J.; Yang, H.; Yu, W.; Yin, C.; He, Y.; Zhang, Z.; Xu, D.; Li, Q. Effect of Ecosystem Degradation on the Source of Particulate Organic Matter in a Karst Lake: A Case Study of the Caohai. Water 2022, 14, 1867. [Google Scholar] [CrossRef]
  24. Guo, Q.; Wang, C.; Wei, R.; Zhu, G.; Cui, M.; Okolic, C.P. Qualitative and Quantitative Analysis of Source for Organic Carbon and Nitrogen in Sediments of Rivers and Lakes Based on Stable Isotopes. Ecotoxicol. Environ. Saf. 2020, 195, 110436. [Google Scholar] [CrossRef] [PubMed]
  25. Duan, L.; Zhang, H.; Chang, F.; Li, D.; Liu, Q.; Zhang, X.; Liu, F.; Zhang, Y. Isotopic Constraints on Sources of Organic Matter in Surface Sediments from Two North–South Oriented Lakes of the Yunnan Plateau, Southwest China. J. Soils Sediments 2022, 22, 1597–1608. [Google Scholar] [CrossRef]
  26. Schulz, H.; Baranska, M. Identification and Quantification of Valuable Plant Substances by IR and Raman Spectroscopy. Vib. Spectrosc. 2007, 43, 13–25. [Google Scholar] [CrossRef]
  27. Jebsen, C.; Norici, A.; Wagner, H.; Palmucci, M.; Giordano, M.; Wilhelm, C. FTIR Spectra of Algal Species Can Be Used as Physiological Fingerprints to Assess Their Actual Growth Potential. Physiol. Plant. 2012, 146, 427–438. [Google Scholar] [CrossRef] [PubMed]
  28. Straková, P.; Larmola, T.; Andrés, J.; Ilola, N.; Launiainen, P.; Edwards, K.; Minkkinen, K.; Laiho, R. Quantification of Plant Root Species Composition in Peatlands Using FTIR Spectroscopy. Front. Plant Sci. 2020, 11, 597. [Google Scholar] [CrossRef]
  29. Ellerbrock, R.H.; Kaiser, M. Stability and Composition of Different Soluble Soil Organic Matter Fractions—Evidence from Δ13C and FTIR Signatures. Geoderma 2005, 128, 28–37. [Google Scholar] [CrossRef]
  30. Castro, K.; Pérez, M.; Rodriguez-Laso, M.D.; Madariaga, J.M. FTIR Spectra Database of Inorganic Art Materials. Anal. Chem. 2003, 75, 214A–221A. [Google Scholar] [CrossRef]
  31. Kiefer, J.; Strk, A.; Kiefer, A.L.; Glade, H. Infrared Spectroscopic Analysis of the Inorganic Deposits from Water in Domestic and Technical Heat Exchangers. Energies 2018, 11, 798. [Google Scholar] [CrossRef]
  32. Miller, F.A.; Wilkins, C.H. Infrared Spectra and Characteristic Frequencies of Inorganic Ions. Anal. Chem. 1952, 24, 1253–1294. [Google Scholar] [CrossRef]
  33. Murphy, K.J. Plant Communities and Plant Diversity in Softwater Lakes of Northern Europe. Aquat. Bot. 2002, 73, 287–324. [Google Scholar] [CrossRef]
  34. Körner, C.; Leuzinger, S.; Riedl, S.; Siegwolf, R.T.; Streule, L. Carbon and Nitrogen Stable Isotope Signals for an Entire Alpine Flora, Based on Herbarium Samples. Alp. Bot. 2016, 126, 153–166. [Google Scholar] [CrossRef]
  35. Díaz-Álvarez, E.A.; de la Barrera, E. Drying Protocol Does Not Alter Plant δ13C and δ15N: A Baseline Survey for Ecological Studies. Isot. Environ. Health Stud. 2019, 55, 526–531. [Google Scholar] [CrossRef] [PubMed]
  36. Stock, W.D.; Chuba, D.K.; Verboom, G.A. Distribution of South African C3 and C4 Species of Cyperaceae in Relation to Climate and Phylogeny. Austral Ecol. 2004, 29, 313–319. [Google Scholar] [CrossRef]
  37. Cai, G.-B.; Chen, S.-F.; Liu, L.; Jiang, J.; Yao, H.-B.; Xu, A.-W.; Yu, S.-H. 1,3-Diamino-2-Hydroxypropane-N,N,N′,N′-Tetraacetic Acid Stabilized Amorphous Calcium Carbonate: Nucleation, Transformation and Crystal Growth. CrystEngComm 2010, 12, 234–241. [Google Scholar] [CrossRef]
  38. Merdalski, M.; Banaś, K.; Ronowski, R. Environmental Factors Affecting Pondweeds in Water Bodies of Northwest Poland. Biodivers. Res. Conserv. 2019, 56, 13–28. [Google Scholar] [CrossRef]
  39. R Core Team R Core Team. R: A Language and Environment for Statistical Computing; The R Project for Statistical Computing: Vienna, Austria, 2022. [Google Scholar]
  40. Oksanen, J. Vegan: An Introduction to Ordination. 2017. Available online: https://cran.r-hub.io/web/packages/vegan/vignettes/intro-vegan.pdf (accessed on 20 September 2023).
  41. Wickham, H. Ggplot2; Springer: New York, NY, USA, 2009; ISBN 978-0-387-98140-6. [Google Scholar]
  42. Dinno, A. Package ‘Dunn.Test’. CRAN Repos. 2017, pp. 1–7. Available online: https://cran.r-project.org/web/packages/dunn.test/dunn.test.pdf (accessed on 20 September 2023).
  43. Pronin, E.; Wrosz, Z.; Banaś, K.; Merdalski, M. Izotopy Stabilne Azotu i Węgla Zanurzonych Roślin Wodnych Rzek Jako Potencjalny Wskaźnik Dopływu Zanieczyszczeń. In Funkcjonowanie I Ochrona Wód Płynących; Czerniawski, R., Bilski, P., Eds.; University of Szczecin Institute of Biology: Szczecin, Poland, 2023; pp. 153–166. [Google Scholar]
  44. Schulte, P.; van Geldern, R.; Freitag, H.; Karim, A.; Négrel, P.; Petelet-Giraud, E.; Probst, A.; Probst, J.L.; Telmer, K.; Veizer, J.; et al. Applications of Stable Water and Carbon Isotopes in Watershed Research: Weathering, Carbon Cycling, and Water Balances. Earth-Sci. Rev. 2011, 109, 20–31. [Google Scholar] [CrossRef]
  45. King, L.; Maberly, S.C.; De Ville, M.M.; Kitschke, M.; Gibson, C.E.; Jones, R.I. Nitrogen Stable Isotope Ratios of Lake Macrophytes in Relation to Growth Form and Nutrient-Limitation. Fundam. Appl. Limnol. 2009, 175, 307–315. [Google Scholar] [CrossRef]
  46. Osmond, C.B.; Valaane, N.; Haslam, S.M.; Uotila, P.; Roksandic, Z. Comparisons of Δ13C Values in Leaves of Aquatic Macrophytes from Different Habitats in Britain and Finland; Some Implications for Photosynthetic Processes in Aquatic Plants. Oecologia 1981, 50, 117–124. [Google Scholar] [CrossRef]
  47. Guo, H.R.; Wu, Y.; Hu, C.C.; Liu, X.Y. Elevated Nitrate Preference Over Ammonium in Aquatic Plants by Nitrogen Loadings in a City River. J. Geophys. Res. Biogeosci. 2022, 127, e2021JG006614. [Google Scholar] [CrossRef]
  48. Raven, J.A. Nutritional Strategies of Submerged Benthic Plants: The Acquisition of C, N and P By Rhizophytes and Haptophytes. New Phytol. 1981, 88, 1–30. [Google Scholar] [CrossRef]
  49. Smolders, A.J.P.; Lucassen, E.C.H.E.T.; Roelofs, J.G.M. The Isoetid Environment: Biogeochemistry and Threats. Aquat. Bot. 2002, 73, 325–350. [Google Scholar] [CrossRef]
Figure 1. The location of the sampled E. canadensis stands in northern Poland. 1—Lake Dobrogoszcz, 2—Lake Zakrzewie, 3—Lake Ląkie, 4—Lake Ossowskie, 5—Lake Jeleń, 6—Lake Piasek, 7—Lake Kamień, 8—River Wda in Bałachy stands, 9—River Wda in Borsak stands 1, 2 and 3, 10—River Chocina in Zielona stands, 11—River Zbrzyca in Laska stands, 12—River Wda in Wda stands, 13—Lake Pursionki Małe, 14—Lake Czyste, 15—Lake Wdzydze, 16—Lake Skrzynki Duże, 17—Lake Kamieniczno, 18—Lake Pile, 19—Lake Ińsko.
Limnolrev 24 00002 g001
Figure 2. Ordination diagrams of nonmetric multidimensional scaling (nMDS) analysis for the data matrix considering freshwater ecosystems as study sites (rows) and physicochemical parameters (pH, conductivity, DIC, CO2, HCO3, CO3−2, DOC, and Ca2+) as species (columns); n = 7 for each group.
Limnolrev 24 00002 g002
Figure 3. Comparison of δ13CORG (‰ V-PDB) of E. canadensis in three types of investigated water ecosystems (n = 7 for each group). The box represents 25–75%, the line inside the box represents the median, and the whiskers represent the minimum and maximum values excluding outliers. Different letters above boxplots indicate statistical significance (p < 0.025) as determined by the Dunn post hoc test with Bonferroni correction following the Kruskal–Wallis test.
Limnolrev 24 00002 g003
Figure 4. Comparison of δ15NORG (‰ AIR) of E. canadensis in three types of investigated water ecosystems (n = 7 for each group). The box represents 25–75%, the line inside the box represents the median, and the whiskers represent the minimum and maximum values excluding outliers. Different letters above boxplots indicate statistical significance (p < 0.025) as determined by the Dunn post hoc test with Bonferroni correction following the Kruskal–Wallis test.
Limnolrev 24 00002 g004
Figure 5. The FTIR spectra comparison of nondecarbonated samples from the river, and the hardwater and softwater lakes.
Limnolrev 24 00002 g005
Figure 6. The FTIR spectra comparison of decarbonated samples: (a) E. canadensis samples collected from softwater lakes and (b) E. canadensis samples collected from hardwater lakes, n = 7 for each group.
Limnolrev 24 00002 g006
Figure 7. The FTIR spectra comparison of (a) nondecarbonated and (b) decarbonated samples from two hardwater lakes.
Limnolrev 24 00002 g007
Table 1. The results of the Kruskal–Wallis test for the physicochemical parameters measured in three investigated freshwater ecosystems.
Physicochemical ParametersKruskal–Wallis Test Results
pHH = 0.013, p = 0.99
conductivity (µS cm−1)H = 14.200, p = 0.001
DIC (mg C/L)H = 14.466, p = 0.001
CO2 (mg C/L)H = 6.2252, p = 0.040
CO2 (CO3−2) (mg C/L)H = 14.764, p = 0.001
CO2 (HCO3) (mg C/L)H = 12.625, p = 0.001
DOC (mg C/L)H = 6.633, p = 0.040
Ca2+ (mg Ca/L)H = 14.716, p = 0.001
Disclaimer/Publisher’s Note: The statements, opinions and data contained in all publications are solely those of the individual author(s) and contributor(s) and not of MDPI and/or the editor(s). MDPI and/or the editor(s) disclaim responsibility for any injury to people or property resulting from any ideas, methods, instructions or products referred to in the content.

