Abstract
Conducting laboratory tests in geotechnical engineering is a costly, time-consuming, and labor-intensive process. As an alternative solution, this study employs various machine learning methods to predict the unconfined compressive strength (UCS) of fine-grained soils stabilized by combining chemical additives (such as Portland cement, lime, and industrial and agricultural waste) and nanosilica. After preparing a comprehensive database of a collection of studies from the literature, ten machine learning models were developed for modeling, and their performances were compared using various metrics. After comparing the performance of the models in predicting the UCS with experimental results, the CatBoost model was determined as the optimal model. The variables of curing time, liquid limit of soil, and additive contents were identified as the most effective parameters on the stabilized soil’s UCS. The best-performing model on the applied dataset was determined and compared with experimental models. After determining the effective parameters for predicting the strength of stabilized soil, the nonlinear relationships between the most important variables and the stabilized soil’s UCS were analyzed and investigated.
1. Introduction
Fine-grained soils pose numerous problems in civil engineering projects due to their low strength, high compressibility, and large volume changes, and therefore require improvement before the construction of engineering structures and infrastructure [1,2]. The performance of these soils can be improved through the use of chemical stabilizers, including Portland cement, lime, and various industrial and agricultural wastes [3,4,5,6]. By adding these calcium-based stabilizers, alumina and silica are released from the clay particles, increasing the pH and reacting with the calcium hydroxide released from the chemical additive to form cementitious gels that increase soil strength.
Nanoparticles are often used as additives to various materials to enhance their fundamental properties, such as strength and durability in civil engineering [7,8]. Among them, nano-SiO2 particles in cemented soil, due to their large specific surface area (SSA) and high purity, accelerate hydration, exhibit strong pozzolanic activity, fill nanopores in the soil matrix, and inhibit the formation of harmful crystals [9,10]. When a cementitious additive is combined with nano-silica and water, both components dissociate into H2SiO4 (from the additive), H2SiO4 (from nano-SiO2), Ca2+, and OH− ions. During the hydration process, the H2SiO4 ions react with Ca2+, enhancing the pozzolanic activity and forming more calcium silicate hydrate (C–S–H) gel [11,12]. Therefore, substituting part of the additives—particularly Portland cement and lime—with nanosilica can help reduce the environmental impact of construction activities.
Traditional methods for determining the optimal additive amounts and parameters affecting additive performance rely on trial and error, which is not only time-consuming and laborious but also results in inefficient material utilization. For example, multiple parallel tests are often required to evaluate the unconfined compressive strength (UCS) of chemically stabilized soil. Recently, with progress in computational technology, the development of UCS predictive models has contributed to simplifying the design process and reducing resource consumption and environmental impacts in geotechnical projects.
Many machine learning (ML) models have been used to predict the UCS of stabilized soils, such as support vector machine (SVM), random forest (RF), and extreme gradient boosting (XGB) [13,14,15,16]. Additionally, numerous investigations have employed artificial neural networks (ANNs) for this purpose [17,18,19]. Das et al. [20] used ANNs and SVM to predict UCS of cement-stabilized soils, finding that SVM produced more accurate results based on statistical evaluations. Similarly, Tabarsa et al. [21] compared ANN and SVM models for estimating the strength of soils stabilized with lime, cement, and rice husk ash, reaffirming the superior performance of the SVM approach. Hoque et al. [22] employed multiple ML models to estimate the UCS of polypropylene-stabilized soft soil, finding that the RF had the best performance, with an accuracy of 0.937 and an R2 value of 0.894. In another study, Zhang et al. [14] reported that the XGB model provided superior predictive capability for the UCS of soil–cement mixtures compared with other models such as SVM and RF. Luo et al. [23], by developing several machine learning models, demonstrated that additive content, curing time, and soil moisture significantly affect the UCS of soil stabilized with geopolymers and alkali activators. Table 1 provides an overview of selected studies on the prediction of UCS in soils stabilized using different cementitious materials.

Table 1.
Summary of previous studies on predicting UCS using various machine learning methods.
A review of the existing technical literature reveals that machine learning models have been employed to predict the strength parameters of fine-grained soils improved with various cementitious materials. However, the application of ML models to predict the UCS of fine-grained soils stabilized by combining them with nanosilica has not yet been investigated. The strength of soil is primarily affected by its grain size distribution, Atterberg limits, moisture content, and density [31]. Related studies have used Atterberg limits, compaction parameters, soil fine content, chemical admixture content, and curing time as input variables to predict the UCS of stabilized soils [13,15,17,21,23]. Previous laboratory studies have shown that variations in the chemical composition of different additives result in differences in the formation of cementitious products, and consequently, distinct effects on soil strength enhancement [6,12,32]. Nevertheless, only a limited number of studies have incorporated the chemical compositions of additives as input variables when predicting the UCS of stabilized soils [33,34]. Therefore, in this research, in addition to the conventional feature variables, the amounts of CaO, Al2O3, and SiO2 compounds present in the main additive were also included as input parameters.
The present study aims to develop different ML models capable of predicting the compressive strength of soils stabilized with different cementitious materials and nanosilica, and to determine the relation of different parameters with UCS. First, a dataset of studies on fine-grained soils stabilized with various cementitious materials (Figure 1) in combination with nanosilica was collected for the first time through a comprehensive literature review. Then, ten machine learning models—namely Multi-Layer Perceptron (MLP), Decision Tree (DT), K-Nearest Neighbors (KNNs), Random Forest (RF), Gradient Boosting (GB), XGBoost (XGB), Categorical Boosting (CatBoost), Adaptive Boosting (AdaBoost), Light Gradient Boosting Machine (LGBM), and Linear Regression (LR)—were developed to train and test the dataset. The performance of those methods was evaluated using seven indicators, and the best-performing model was then selected for analyzing the effective variables. Finally, Shapley Additive Explanations (SHAP) and Partial Dependence Plot (PDP) methods were employed to identify the relative influence of different factors on the UCS of stabilized soils. Figure 2 presents the methodological framework of the developed models.
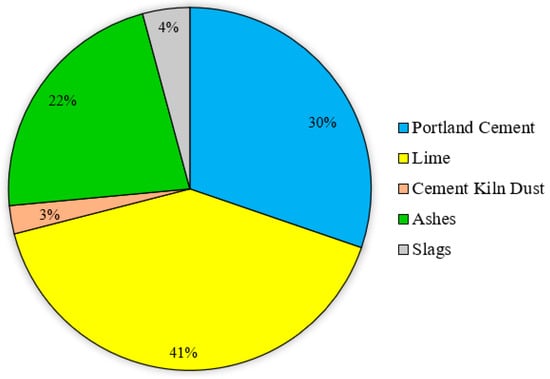
Figure 1.
Database distribution of cementitious materials combined with Nano-SiO2 for soil stabilization.
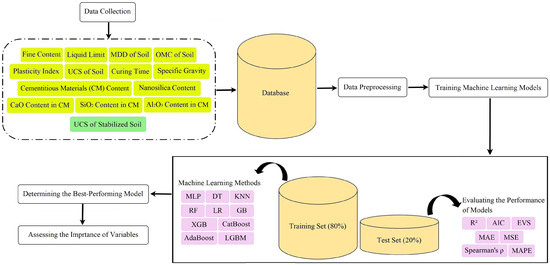
Figure 2.
Flowchart of the Machine Learning Methodology.
2. Methodology
In this section, first, the data collection process and the characteristics of the data are presented. Then, the methods used for prediction are introduced. Subsequently, the model implementation is briefly presented. Finally, the methods used for interpretation and feature analyses are described.
2.1. Data Collection
In the present study, a thorough literature review was undertaken to assemble a comprehensive dataset for predicting the UCS of fine-grained soils stabilized with cementitious materials (e.g., Portland cement, lime, and various industrial and agricultural by-products) in combination with nano-SiO2. The independent variables considered for UCS prediction included fine content (sizes less than 0.075 mm); initial soil properties such as maximum dry density (MDD), liquid limit (LL), plasticity index (PI), specific gravity (Gs), optimum moisture content (OMC), UCS, content of the primary additive (cementitious material, CM), the contents of CaO, SiO2, and Al2O3 in the CM; nanosilica content; and curing time. These parameters were collected from studies conducted in diverse geographic regions worldwide. Considering the number of laboratory studies involving various cementitious materials combined with nanosilica, and the limitations in reporting all input and output variables in these studies based on a specific and uniform standard, a total of 238 samples were compiled. Numerous previous studies have employed smaller datasets for predicting the UCS of stabilized soil [15,19,20,21,30]. Table 2 summarizes the data sources used for UCS values of stabilized soils, while Table 3 presents the statistical characteristics of the parameters analyzed in this research.
Table 2.
Database sources for UCS of stabilized soils.
Table 3.
Statistical values of the databases used in this study.
2.2. Machine Learning
As mentioned, ten prediction techniques (i.e., ML, ensemble learning, and deep learning techniques) were applied in this study to predict the UCS of stabilized soil (including nanosilica). In this section, these techniques are briefly introduced.
2.2.1. Multi-Layer Perceptron (MLP)
MLP is an ANN model with multiple layers that mimics the mammal’s brain recognition to predict a parameter (dependent variable) based on other factors (independent variables). MLP includes three types of layers, and each of them contains processing units, called neurons. The input layer prepares the data for modeling; the hidden layers use activation functions and different weights to change the data representation; and finally, the output layer presents the predicted values [50].
2.2.2. Decision Tree (DT)
DT is a white-box prediction method that simulates the tree shapes and their leaves and nodes to develop an interpretable machine learning algorithm. This method is efficient when the number of observations is high in the dataset. DT optimizes the decision rules to identify the best feature cut-off thresholds and divide the observations into different groups based on their similarities [51]. Then, DT applies a pruning operator to remove unnecessary branches to reduce the complexity and enhance the efficiency of the prediction process [52].
2.2.3. K-Nearest Neighbors (KNN)
KNN is a non-parametric prediction technique that has been widely used for statistical analysis. KNN predicts the dependent variable of a given data sample using similar observations. In other words, all the observations are plotted in an H-dimensional space based on their independent variables’ values, where H denotes the number of independent variables. Then, the distance between the given testing observation and other training observations is calculated. Consequently, the K nearest observations are identified (K observations with the minimum distances), and KNN predicts the output based on the output of the nearest samples. Among the K nearest data samples, those located at shorter distances exert a greater influence on the output value than those farther away [53].
2.2.4. Random Forest (RF)
RF is an ensemble learning technique that develops many weak learners (generally DTs) and combines them to construct a prediction model. That method applies bagging or bootstrap aggregating for regression and classification purposes. RF selects random observations from the dataset to form different smaller datasets and performs different DTs on each of these subdatasets. Then, the predicted values of trained DTs and their corresponding residuals are employed to predict the testing observations’ dependent variable [54].
2.2.5. Gradient Boosting (GB)
GB is also an ensemble learning algorithm that develops the final prediction model based on weak learners. GB usually employs DTs as weak learners and combines them using a boosting paradigm to improve the prediction performance. In GB, a DT is first developed, and then each DT is trained on the previous DT residual. The learning rate controls the contribution of each individual DT to the model’s overall prediction. Trees are added to the model sequentially, and this continues until the predefined number of iterations is completed or no further improvement in prediction accuracy is achieved [55].
2.2.6. XGBoost (XGB)
XGB is another ensemble learning method that models the relationship between dependent and independent variables by combining multiple DTs. This method employs a parallel learning process. Hence, it can efficiently handle large-scale datasets while reaching accurate predictions. XGB iteratively refines its predictions, optimizing the ensemble structure at each step to enhance overall performance [56].
2.2.7. Categorical Boosting (CatBoost)
CatBoost is also an ensemble learning method. This method replaces categorical variables with binary variables and also uses Bayesian estimators to decrease the probability of overfitting. CatBoost utilizes target-based statistical encoding to directly handle categorical input features, which leads to a reduction in computational time. Unlike other ensemble learning algorithms, such as XGBoost, CatBoost employs a symmetric tree structure that maintains consistent depth across all nodes in DTs [57].
2.2.8. Adaptive Boosting (AdaBoost)
AdaBoost is an iterative algorithm that predicts the dependent variable by merging various weak learners. To this end, it develops a given number of DTs and allocates equal weights to them. Then, all DTs are trained, and their residuals are calculated. In each iteration, the weight of each model is updated based on the corresponding residual. This iterative process continues, and finally, the model predicts the final value based on the predicted value of each DT and their final weights [58].
2.2.9. Light Gradient Boosting Machine (LGBM)
LGBM is another ensemble learning model applied in this study. LGBM is an updated version of GB, and it is famous for its fast runs and accurate predictions. LGBM supports parallel learning, which can lead to a reduction in memory usage. LGBM applies a leaf-wise leaf growth strategy, reducing the excessive depth growth in DTs [59].
2.2.10. Linear Regression (LR)
LR is a simple method for presenting data, prediction, and capturing the linear relationships between the dependent variable and independent variables. This method is white-box and easy to interpret. However, this method uses a predetermined structure, which can reduce its prediction performance [60].
2.3. Model Implementation
The dataset was randomly divided into two subsets: a training set (80%) and a testing set (the remaining 20%). The training set was used for tuning the hyperparameters and training the model, and the testing set was used to examine the model’s performance on unseen data. To tune hyperparameters, five-fold cross-validation and Optuna were taken into account simultaneously. We also normalized the data using the normalization functions available in scikit-learn (sklearn), as some of the machine-learning algorithms applied in this study (such as KNN and MLP) are sensitive to differences in the scale and range of the dependent and independent variables.
After tuning and training the final model, the prediction performance of the models on testing data was evaluated based on seven performance indicators to determine the best-performing model for the UCS of stabilized soil. These indicators include the coefficient of determination (R2), mean absolute error (MAE), mean squared error (MSE), mean absolute percentage error (MAPE), explained variance score (EVS), Akaike information criterion (AIC), and Spearman’s rank correlation coefficient ():
2.4. Interpretation Techniques
The best-performing model for the applied dataset was first determined based on the mentioned performance metrics. Then, the best-performing model was synchronized with SHapley Additive exPlanations (SHAP) to sort the features based on their relative influence on UCS. Further, Partial Dependency Plots (PDPs) were used to illustrate the nonlinear relationship between each independent variable and the dependent variable.
SHAP synchronizes with machine learning models and interprets their results using game theory. This method was introduced by Lundberg and Lee [61], and it presents local explanations. SHAP applies an additive feature attribution approach, where the model output is expressed as a linear combination of input feature contributions. The relative impact of each input variable on the response is then evaluated by examining its marginal effect on the prediction [62].
PDPs can display how each material influences the UCS. They visualize the nonlinear associations between the dependent and independent variables. In this method, new synthetic data are created by systematically substituting the values of a selected independent variable with a range of possible values, while keeping other features constant [63]. A machine learning algorithm (here, the best-performing technique) is then applied to estimate the dependent variable for these generated observations. Finally, the mean of these estimated outcomes is computed to represent the partial dependence of the chosen independent variable based on its marginal distribution [64].
3. Results and Discussion
3.1. Evaluating the Performance of Models
Seven performance indicators were employed to identify the best-performing prediction model for the UCS of stabilized soil. Table 4 summarizes the performance results of the models on the testing data. It is observed that only the XGB and CatBoost models have R2 values greater than 0.90. For UCS prediction, the CatBoost model demonstrated the best performance (R2 = 0.943; MAE = 70.072 kPa; MSE = 10,934.0 kPa2; AIC = 454.4; EVS = 0.943; MAPE = 0.084; Spearman’s ρ = 0.966), whereas the LR model yielded the weakest performance. Following CatBoost, the XGB and GB models demonstrated superior performance among the remaining models, based on a comprehensive set of indicators, respectively. Conversely, after LR, the AdaBoost and MLP models exhibited the weakest predictive capabilities, respectively. Given the exceptional accuracy of CatBoost across all key metrics, it was selected as the best-performing model for the subsequent analyses (SHAP and PDP).
Table 4.
Comparison of the performance of models for predicting compressive strength on testing data (green: the best-performing; red: the worst-performing).
3.2. Comparison of Prediction Performance of Different Models
Figure 3 compares the experimental and predicted compressive strength values by different models for the test data. The predicted values of the LR, AdaBoost, and MLP models show poor distribution, and most errors exceed 30%, especially in LR and AdaBoost. The good correlation observed between the experimental and predicted UCS values in the CatBoost, XGB, and GB models, compared to the other models, is consistent with the analysis in the previous section. In the remaining models, only a small number of data points show errors exceeding 30%, while most of the data lie along the 45° diagonal line.
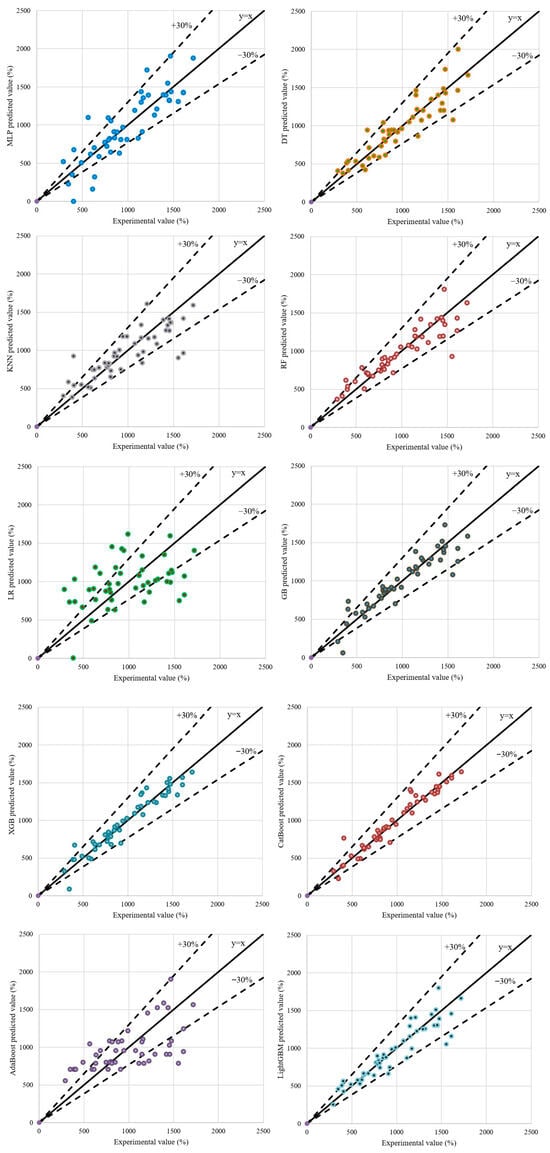
Figure 3.
Comparison of experimental vs. predicted UCS values for stabilized soil with cementitious materials and nanosilica.
The residual distribution of the ML models on the test set is shown in Figure 4. The LR model is the weakest, exhibiting the largest residual distribution confidence interval and deviation from normality. Conversely, the CatBoost model shows the best performance with residual values close to zero, indicating good prediction accuracy and stability. Following LR, the AdaBoost, MLP, and KNN models show increasingly larger and more unstable residuals, respectively, indicating poor performance of these models.
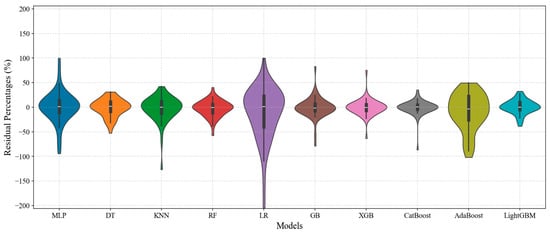
Figure 4.
Violin plot of residual percentages for ML models on the test set.
The consistent visual and statistical evidence confirms CatBoost as the best-performing model on the applied dataset. The poor performance of models like LR suggests the underlying relationship between the input features and UCS is highly nonlinear, a complexity that tree-based ensemble methods like CatBoost are specifically designed to handle. The next step involves moving beyond prediction to model interpretation. Specifically, CatBoost will be applied to two interpretability methods: SHAP and PDP.
3.3. Feature Importance and Dependency Analysis
Since CatBoost was identified as the optimal machine learning algorithm for predicting the UCS of soils stabilized with cementitious binders and nanosilica, the SHAP and Partial PDP techniques were applied to interpret this model and quantify the relative importance of the input variables. As depicted in Figure 5, the SHAP analysis elucidates the contribution of each predictor variable to the model output. The most influential features, along with their respective positive or negative impacts on the predicted UCS, are clearly delineated. The vertical axis represents the ranked importance of the variables, from the most to the least significant. Higher SHAP values, represented by redder markers, indicate a stronger positive influence of the corresponding input variable on the UCS, whereas bluer markers denote a lower or negative contribution.
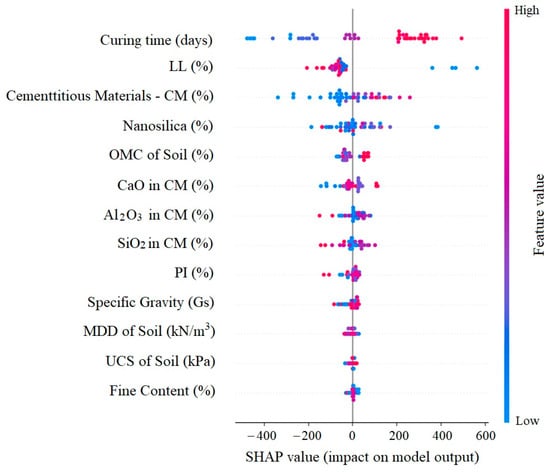
Figure 5.
Feature importance analysis using SHAP values.
The results indicate that curing time exerts the most significant relative influence on the UCS of soils stabilized with cementitious binders and nanosilica. The subsequent most influential parameters are the LL and the dosage of additives. Conversely, variables such as fine content (particles smaller than 0.075 mm), the MDD of soil, and specific gravity of the soil exhibit negligible contribution to the prediction of the stabilized soil’s UCS. This is likely because the study focused on fine-grained soils, where both fine content and specific gravity showed little variation. Additionally, since nanosilica was introduced into a soil–CM mixture, the CM primarily contributed to the initial strength, while nanosilica enhanced the strength at later stages, thereby reducing the influence of the initial soil strength as an input parameter on final strength (output parameter). In a study on the effectiveness of nanosilica and sugarcane bagasse ash on UCS of sandy soil, using various machine learning models and different training ratios, the curing period and nanosilica content were identified as the most influential parameters [65]. According to Onyelowe et al. [14] and Goutham and Krishnaiah [29], the additive content and LL were determined as key input parameters, whereas Ranathunga et al. [66] and Yao et al. [34] identified the additive content and curing period as the dominant factors influencing the strength of stabilized soils. As illustrated in Figure 5, among the chemical compounds present in cementitious materials, CaO is more significant than SiO2 and Al2O3. The development of early strength largely depends on the CaO content, whereas SiO2 and Al2O3 contribute more during extended curing periods [67].
In the PDP method, the relationships between input variables and predicted outcomes are illustrated graphically. The PDP values, shown as blue dots, along with the fitted red curves, are presented in Figure 6. As observed, an increase in curing time, CM content, and the soil’s OMC led to a higher UCS in stabilized soils. Conversely, increasing the soil’s LL reduces the strength. It has been consistently reported that the UCS of admixture-stabilized soils increases with curing time, irrespective of the type of stabilizing materials [12,68]. When sufficient moisture is available, the chemical reactions between the soil and the admixtures may persist for several months [69]. By increasing the curing time, the soil matrix becomes denser due to the development of pozzolanic and hydration reactions and the formation of cementitious compounds such as ettringite and C–S–H. Eventually, the rate of strength gain approaches an asymptotic value at extended curing ages [70].
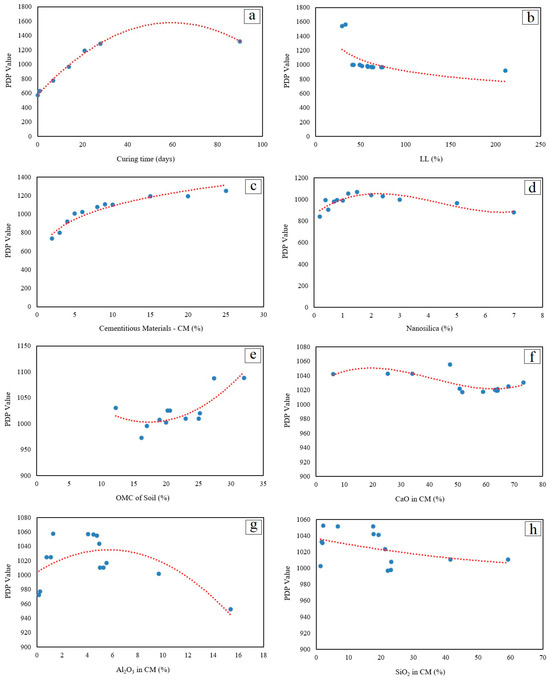
Figure 6.
PDPs illustrating the effect of influential features: (a) Curing time, (b) LL, (c) CM, (d) Nanosilica, (e) OMC, (f) CaO, (g) Al2O3, (h) SiO2.
The UCS generally increases with higher CM content, as a greater amount of CM promotes the formation of additional hydration products, which bind soil particles more cohesively. The addition of nanosilica enhances the strength of the samples, primarily owing to the reaction of silica and calcium hydroxide during hydration, which forms more C–S–H gels. Moreover, the high specific surface area of nanosilica accelerates the formation of cementitious products. An increasing trend in strength is observed with nanosilica content up to 1–2%; however, beyond this level, the strength decreases, likely due to the agglomeration of excess nanoparticles and their occupation of pore spaces. Once the pores are filled, further hydration is hindered by the limited space available for additional reaction products, resulting in a reduction in strength.
In harmony with the findings of Por et al. [71], who showed that clay with low LL tends to achieve higher strength than clay with high LL, the effect of LL on the UCS is seen in Figure 6b. As the samples were prepared at the OMC for the UCS test, increasing the OMC enhances the availability of water for hydration reactions. This promotes the formation of additional cementitious products, thereby increasing the UCS (Figure 6e).
The influence of major oxides present in cementitious materials on UCS is illustrated in Figure 6f–h. As shown, an increase in CaO content up to an optimal level enhances strength by filling soil pores with cementitious hydration products. However, beyond this limit, excessive CaO reduces reactivity and consequently decreases strength. Experimental results reported by Rosa et al. [72] and Mahedi et al. [67] indicate that the ratios of CaO/SiO2, CaO/Al2O3, and CaO/(Al2O3 + SiO2) are key parameters influencing the UCS of chemically stabilized soils, with strength generally increasing as these ratios rise. Conversely, as shown in Figure 6g,h, higher silica and alumina contents lead to lower CaO/SiO2, CaO/Al2O3, and CaO/(Al2O3 + SiO2) ratios, resulting in a decrease in UCS.
4. Conclusions
In this study, a comprehensive and accurate comparison of ten machine learning models—MLP, DT, KNN, RF, GB, XGB, CatBoost, AdaBoost, LGBM, and LR—was conducted to predict the UCS of fine-grained soils stabilized with a combination of various cementitious materials and Nano-SiO2. The input variables were selected on the compiled dataset, including initial soil properties, additive contents, major chemical compositions of the cementitious binders, and curing time.
The performance of all models was evaluated using seven performance indicators. A comparison between the predicted and experimental results revealed that the CatBoost model exhibited the highest predictive accuracy, followed by the XGB model. In contrast, the AdaBoost model exhibited the greatest error fluctuation and demonstrated the weakest performance in predicting the UCS of stabilized soil.
The relative importance of the variables influencing the UCS of the treated soil was determined to be as follows: curing time, soil LL, CM content, nanosilica content, soil OMC, major oxides content in the CM, and basic soil characteristics, including PI, Gs, MDD, initial UCS, and fine content.
With increasing curing time, CM content, and nanosilica content (up to an optimum level), the UCS of the stabilized soil increases, whereas an increase in the soil LL leads to a decrease in the predicted UCS. An increase in CaO content and in the combined amount of Al2O3 and SiO2 in the cementitious material (CM) leads to an increase and decrease, respectively, in the CaO/(Al2O3 + SiO2) ratio, which is a key parameter governing the effectiveness of chemical soil stabilizers. As this ratio increases, the UCS of the treated soil also increases.
The UCS test is a traditional laboratory method that provides accurate measurements under controlled conditions but is costly, labor-intensive, and time-consuming due to sample preparation, curing, and repeated trials. ML methods offer a cost-effective alternative by predicting UCS using existing datasets, eliminating the need for additional physical tests and enabling rapid, reproducible predictions. ML models also allow for evaluation across multiple soil types, stabilizer combinations, and curing conditions, while identifying key variables and nonlinear relationships influencing UCS. However, the accuracy of ML predictions depends on the quality and range of the training data and requires experimental validation for novel soils or stabilizers.
Given the limitations of studies on soil stabilization using combinations of cementitious materials and nanosilica, further laboratory experiments appear necessary. Moreover, to enhance the accuracy of predictions, future research should consider variables such as nanosilica particle size, dominant soil chemical components, and the effects of other nanoparticles, which will require additional experimental investigations. One of the limitations of this study is that it relies on a relatively small number of observations for modeling due to the lack of additional data samples containing nanosilica in the literature. However, previous studies have shown that increasing the number of data samples [73] and independent variables [74] can improve prediction performance. Therefore, it is suggested that future studies apply large-scale datasets (when available) to predict the UCS of fine-grained soils stabilized with various cementitious materials in combination with nanosilica. Another limitation of this study is that it did not analyze the outliers in the dataset, and future studies should investigate the influence of outliers on the outcomes.
Author Contributions
Conceptualization, S.G. and H.N.; methodology, S.G. and H.N.; software, H.N.; formal analysis, S.G. and H.N.; investigation, S.G. and H.N.; data curation, S.G.; writing—original draft preparation, S.G. and H.N.; All authors have read and agreed to the published version of the manuscript.
Funding
This research received no external funding.
Data Availability Statement
The data used in this study are cited in the manuscript.
Acknowledgments
The authors gratefully acknowledge the support and technical assistance of Radis Company, which played an instrumental role in the success of this research.
Conflicts of Interest
The authors declare no conflicts of interest.
References
- Bell, F.G. Engineering Treatment of Soils, 1st ed.; CRC Press: Boca Raton, FL, USA, 1993. [Google Scholar]
- Ural, N. The Importance of Clay in Geotechnical Engineering. Current Topics in the Utilization of Clay in Industrial and Medical Applications; InTech: London, UK, 2018. [Google Scholar]
- Firoozi, A.A.; Guney Olgun, C.; Firoozi, A.A.; Shojaei Baghini, M. Fundamentals of soil stabilization. Int. J. Geo-Eng. 2017, 8, 26. [Google Scholar] [CrossRef]
- Nigitha, D.; Prabhanjan, N. Efficiency of cement and lime in stabilizing the black cotton soil. Mater. Today Proc. 2022, 68, 1588–1593. [Google Scholar] [CrossRef]
- Gidebo, F.A.; Yasuhara, H.; Kinoshita, N. Stabilization of expansive soil with agricultural waste additives: A review. Int. J. Geo-Eng. 2023, 14, 14. [Google Scholar] [CrossRef]
- Ghavami, S. A Comparative Study on the Effect of Cement Kiln Dust, Fly Ash, and Ground Granulated Blast Furnace Slag on Compaction Characteristics and California Bearing Ratio of Clay Soils. J. Transp. Infrastruct. Eng. 2024, 10, 57–70. [Google Scholar]
- Daniyal, M.; Azam, A.; Akhtar, S. Application of nanomaterials in civil engineering. In Nanomaterials and Their Applications; Springer: Singapore, 2018. [Google Scholar]
- Utsev, T.; Tiza, T.M.; Mogbo, O.; Kumar Singh, S.; Chakravarti, A.; Shaik, N.; Pal Singh, S. Application of nanomaterials in civil engineering. Mater. Today Proc. 2021, 62, 5140–5146. [Google Scholar] [CrossRef]
- Ghavami, S.; Naseri, H.; Jahanbakhsh, H.; Moghadas Nejad, F. The impacts of nano-SiO2 and silica fume on cement kiln dust treated soil as a sustainable cement-free stabilizer. Constr. Build. Mater. 2021, 285, 122918. [Google Scholar] [CrossRef]
- Wang, L.; Liu, Q.; Li, X.A.; Qin, B.; Hong, B.; Shi, J. Effect of nanosilica on the hydrological properties of loess and the microscopic mechanism. Sci. Rep. 2024, 14, 13692. [Google Scholar] [CrossRef]
- Rai, S.; Tiwari, S. Nano Silica in Cement Hydration. Mater. Today Proc. 2018, 5, 9196–9202. [Google Scholar] [CrossRef]
- Barman, D.; Dash, S.K. Stabilization of expansive soils using chemical additives: A review. J. Rock Mech. Geotech. Eng. 2022, 14, 1319–1342. [Google Scholar] [CrossRef]
- Taffese, W.Z.; Abegaz, K.A. Prediction of Compaction and Strength Properties of Amended Soil Using Machine Learning. Buildings 2022, 12, 613. [Google Scholar] [CrossRef]
- Zhang, C.; Zhu, Z.; Liu, F.; Yang, Y.; Wan, Y.; Huo, W.; Yang, L. Efficient machine learning method for evaluating compressive strength of cement stabilized soft soil. Constr. Build. Mater. 2023, 392, 131887. [Google Scholar] [CrossRef]
- Onyelowe, K.C.; Moghal, A.A.; Ebid, A.; Rehman, A.U.; Hanandeh, S.; Priyan, V. Estimating the strength of soil stabilized with cement and lime at optimal compaction using ensemble-based multiple machine learning. Sci. Rep. 2024, 14, 15308. [Google Scholar] [CrossRef]
- Uniyal, K.; Pratap, B.; Kumar, P.; Gupta, K.K.; Vaishnava, R. Strength analysis of sugarcane bagasse ash and rice husk based subgrade material with natural soil using different machine learning. Civ. Eng. Infrastruct. J. 2025; in press. [Google Scholar]
- Suman, S.; Mahamaya, M.; Das, S.K. Prediction of Maximum Dry Density and Unconfined Compressive Strength of Cement Stabilised Soil Using Artificial Intelligence Techniques. Int. J. Geosynth. Ground Eng. 2016, 2, 11. [Google Scholar] [CrossRef]
- Ghorbani, A.; Hasanzadehshooiili, H. Prediction of UCS and CBR of microsilica-lime stabilized sulfate silty sand using ANN and EPR models; application to the deep soil mixing. Soils Found. 2018, 58, 34–49. [Google Scholar] [CrossRef]
- Vamsi Krishna, S.; Sai Santosh, B.; Sai Prasanth, B. Prediction of UCS and CBR of a stabilized Black-cotton soil using artificial intelligence approach: ANN. Mater. Today Proc. 2023; in press. [Google Scholar]
- Das, S.K.; Samui, P.; Sabat, A.K. Application of Artificial Intelligence to Maximum Dry Density and Unconfined Compressive Strength of Cement Stabilized Soil. Geotech. Geol. Eng. 2011, 29, 329–342. [Google Scholar] [CrossRef]
- Tabarsa, A.; Latifi, N.; Osouli, A.; Bagheri, Y. Unconfined compressive strength prediction of soils stabilized using artificial neural networks and support vector machines. Front. Struct. Civ. Eng. 2021, 15, 520–536. [Google Scholar] [CrossRef]
- Hoque, M.I.; Hasan, M.; Islam, M.S.; Houda, M.; Abdallah, M.; Sobuz, M.H.R. Machine Learning Methods to Predict and Analyse Unconfined Compressive Strength of Stabilised Soft Soil with Polypropylene Columns. Cogent Eng. 2023, 10, 2220492. [Google Scholar] [CrossRef]
- Luo, Z.; Xue, X.; Xiong, C.; Huang, R.; Du, J.; Li, J.; Liu, K. Data-driven prediction of unconfined compressive strength in stabilized soils using machine learning. Discov. Appl. Sci. 2025, 7, 1122. [Google Scholar] [CrossRef]
- Mozumder, R.A.; Laskar, A.I.; Hussain, M. Empirical approach for strength prediction of geopolymer stabilized clayey soil using support vector machines. Constr. Build. Mater. 2017, 132, 412–424. [Google Scholar] [CrossRef]
- Priyadarshee, A.; Chandra, S.; Gupta, D.; Kumar, V. Neural Models for Unconfined Compressive Strength of Kaolin Clay Mixed with Pond Ash, Rice Husk Ash and Cement. J. Soft Comput. Civ. Eng. 2020, 4, 85–102. [Google Scholar]
- Ngo, H.T.T.; Pham, T.A.; Vu, H.L.T.; Giap, L.V. Application of Artificial Intelligence to Determined Unconfined Compressive Strength of Cement-Stabilized Soil in Vietnam. Appl. Sci. 2021, 11, 1949. [Google Scholar] [CrossRef]
- Zeini, H.A.; Al-Jeznawi, D.; Imran, H.; Bernardo, L.F.A.; Al-Khafaji, Z.; Ostrowski, K.A. Random Forest Algorithm for the Strength Prediction of Geopolymer Stabilized Clayey Soil. Sustainability 2023, 15, 1408. [Google Scholar] [CrossRef]
- Kumar, A.; Sinha, S.; Saurav, S.; Chauhan, V.B. Prediction of unconfined compressive strength of cement–fly ash stabilized soil using support vector machines. Asian J. Civ. Eng. 2024, 25, 1149–1161. [Google Scholar] [CrossRef]
- Goutham, D.; Krishnaiah, A. Prediction of Unconfined Compressive Strength of Expansive Soil Amended with Bagasse Ash and Lime Using Artificial Neural Network. J. Soft Comput. Civ. Eng. 2024, 8, 33–54. [Google Scholar]
- Mohammed, A.M.A.; Husain, O.; Abdulkareem, M.; Mohd Yunus, N.Z.; Jamaludin, N.; Mutaz, E.; Elshafie, H.; Hamdan, M. Explainable Artificial Intelligence for predicting the compressive strength of soil and ground granulated blast furnace slag mixtures. Results Eng. 2025, 25, 103637. [Google Scholar] [CrossRef]
- Ahmad, W.; Uchimura, T. The Effect of Moisture Content at Compaction and Grain Size Distribution on the Shear Strength of Unsaturated Soils. Sustainability 2023, 15, 5123. [Google Scholar] [CrossRef]
- Peethamparan, S.; Olek, J.; Lovell, J. Influence of chemical and physical characteristics of cement kiln dusts (CKDs) on their hydration behavior and potential suitability for soil stabilization. Cem. Concr. Res. 2008, 38, 803–815. [Google Scholar] [CrossRef]
- Yao, Q.; Tu, Y.; Yang, J.; Zhao, M. Hybrid XGB model for predicting unconfined compressive strength of solid waste-cement-stabilized cohesive soil. Constr. Build. Mater. 2024, 449, 138242. [Google Scholar] [CrossRef]
- Yao, Q.; Tu, Y.; Yang, J. Predicting the compressive strength of solid waste-cement stabilized compacted soil using machine learning model. Mater. Today Commun. 2025, 44, 111882. [Google Scholar] [CrossRef]
- Bahmani, S.H.; Huat, B.B.; Asadi, A.; Farzadnia, N. Stabilization of residual soil using SiO2 nanoparticles and cement. Constr. Build. Mater. 2014, 64, 350–359. [Google Scholar] [CrossRef]
- Bahmani, S.H.; Farzadnia, N.; Asadi, A.; Huat, B.B. The effect of size and replacement content of nanosilica on strength development of cement treated residual soil. Constr. Build. Mater. 2016, 118, 294–306. [Google Scholar] [CrossRef]
- Mostafa, A.E.A.; Ouf, M.S.; Elgendy, M.F.; Elgendy, E. Stabilization of Subgrade Pavement Layer Using Silica Fume and Nano Silica. Int. J. Sci. Eng. Res. 2016, 7, 573–581. [Google Scholar]
- Ghasabkolaei, N.; Janalizadeh, A.; Jahanshahi, M.; Roshan, N.; Ghasemi, S.E. Physical and geotechnical properties of cement-treated clayey soil using silica nanoparticles: An experimental study. Eur. Phys. J. Plus 2016, 131, 134. [Google Scholar] [CrossRef]
- Ghaffarpour Jahromi, S.; Yazdi Ravandi, Z. Investigation of the Effect of Nano-Silica in Stabilization of Clay Soil and Improving the Mechanical and Volumetric Properties of Subgrade. J. Transp. Res. 2019, 16, 169–183. [Google Scholar]
- Ghorbani, A.; Hasanzadehshooiili, H.; Mohammadi, M.; Sianati, F.; Salimi, M.; Sadowski, L.; Szymanowski, J. Effect of Selected Nanospheres on the Mechanical Strength of Lime-Stabilized High-Plasticity Clay Soils. Adv. Civ. Eng. 2019, 2019, 4257530. [Google Scholar] [CrossRef]
- Shahsavani, S.; Vakili, A.H.; Mokhberi, M. Effects of freeze-thaw cycles on the characteristics of the expansive soils treated by nanosilica and Electric Arc Furnace (EAF) slag. Cold Reg. Sci. Technol. 2021, 182, 103216. [Google Scholar] [CrossRef]
- Mirzababaei, M.; Karimiazar, J.; Sharifi Teshnizi, E.; Arjmandzadeh, R.; Bahmani, S.H. Effect of nano-additives on the strength and durability characteristics of marl. Minerals 2021, 11, 1119. [Google Scholar] [CrossRef]
- Munda, J.; Padhi, J.; Mohanty, S. Investigation on performance of expansive soil stabilized with fly ash and nano-SiO2. Mater. Today Proc. 2022, 67, 1268–1275. [Google Scholar] [CrossRef]
- Eissa, A.; Bassuoni, M.T.; Ghazy, A.; Alfaro, M. Improving the properties of soft clay using cement, slag, and nanosilica: Experimental and statistical modeling. J. Mater. Civ. Eng. 2022, 34, 04022031. [Google Scholar] [CrossRef]
- Karimiazar, J.; Sharifi Teshnizi, E.; O’Kelly, B.C.; Sadeghi, S.; Karimizad, N.; Yazdi, A.; Arjmandzadeh, R. Effect of nano-silica on engineering properties of lime-treated marl soil. Transp. Geotech. 2023, 43, 101123. [Google Scholar] [CrossRef]
- Aksu, G.; Eskisar, T. The geomechanical properties of soils treated with nanosilica particles. J. Rock Mech. Geotech. Eng. 2023, 15, 954–969. [Google Scholar] [CrossRef]
- Bhavitha, K.; Gangavaram, P.; Revuru, P.K.; Rohilla, S.; Mallikarjuna, R.K. Assessing the Geotechnical Properties of Lime-Stabilized Black Cotton Soil in the Presence of Nanosilica. Int. J. Geomech. 2024, 24, 06024024. [Google Scholar]
- Alshawmar, F. Utilization of nano silica and plantain leaf ash for improving strength properties of expansive soil. Sustainability 2024, 16, 2157. [Google Scholar] [CrossRef]
- Ghavami, S.; Hallaji, A.; Sandooghsaz, Y. Assessment of the Effect of Fly Ash and Nanosilica on the Geotechnical Properties of Forest Road Subgrade. Civ. Proj. 2025, 7, 73–88. [Google Scholar]
- Hasan, M.K.; Alam, M.A.; Das, D.; Hossain, E.; Hasan, M. Diabetes prediction using ensembling of different machine learning classifiers. IEEE Access 2020, 8, 76516–76531. [Google Scholar] [CrossRef]
- Suresh, A.; Udendhran, R.; Balamurgan, M. Hybridized neural network and decision tree based classifier for prognostic decision making in breast cancers. Soft Comput.-Fusion Found. Methodol. Appl. 2020, 24, 7947. [Google Scholar] [CrossRef]
- Rau, C.S.; Wu, S.C.; Chien, P.C.; Kuo, P.J.; Chen, Y.C.; Hsieh, H.Y.; Hsieh, C.H. Prediction of mortality in patients with isolated traumatic subarachnoid hemorrhage using a decision tree classifier: A retrospective analysis based on a trauma registry system. Int. J. Environ. Res. Public Health 2017, 14, 1420. [Google Scholar] [CrossRef]
- Ghavami, S.; Alipour, Z.; Naseri, H.; Jahanbakhsh, H.; Karimi, M.M. A new ensemble prediction method for reclaimed asphalt pavement (RAP) mixtures containing different constituents. Buildings 2023, 13, 1787. [Google Scholar] [CrossRef]
- Biau, G.; Scornet, E. A random forest guided tour. Test 2016, 25, 197–227. [Google Scholar] [CrossRef]
- Friedman, J.H. Stochastic gradient boosting. Comput. Stat. Data Anal. 2002, 38, 367–378. [Google Scholar] [CrossRef]
- Naseri, H.; Waygood, E.O.D.; Patterson, Z. Household transportation lifecycle greenhouse gas emission prediction. Transp. Res. Part D Transp. Environ. 2025, 141, 104660. [Google Scholar] [CrossRef]
- Naseri, H.; Waygood, E.O.D.; Patterson, Z.; Wang, B. Who is more likely to buy electric vehicles? Transp. Policy 2024, 155, 15–28. [Google Scholar] [CrossRef]
- Hu, G.; Yin, C.; Wan, M.; Zhang, Y.; Fang, Y. Recognition of diseased Pinus trees in UAV images using deep learning and AdaBoost classifier. Biosyst. Eng. 2020, 194, 138–151. [Google Scholar] [CrossRef]
- Naseri, H.; Waygood, E.O.D.; Patterson, Z.; Wang, B. Which variables influence electric vehicle adoption? Transportation 2024, 1–38. [Google Scholar] [CrossRef]
- Naseri, H.; Jahanbakhsh, H.; Foomajd, A.; Galustanian, N.; Karimi, M.M.; Waygood, E.O.D. A newly developed hybrid method on pavement maintenance and rehabilitation optimization applying Whale Optimization Algorithm and random forest regression. Int. J. Pavement Eng. 2023, 24, 2147672. [Google Scholar] [CrossRef]
- Lundberg, S.M.; Lee, S.I. A unified approach to interpreting model predictions. In Proceedings of the 31st International Conference on Neural Information Processing Systems, Long Beach, CA, USA, 4–9 December 2017; pp. 4768–4777. [Google Scholar]
- Mangalathu, S.; Hwang, S.H.; Jeon, J.S. Failure mode and effects analysis of RC members based on machine-learning-based SHapley Additive exPlanations (SHAP) approach. Eng. Struct. 2020, 219, 110927. [Google Scholar] [CrossRef]
- Naseri, H.; Ciari, F.; Patwary, A.U.Z.; Cloutier, M.S. Satisfaction in pedestrianized areas: What shapes positive and negative experiences? Cities 2026, 168, 106511. [Google Scholar] [CrossRef]
- Inglis, A.; Parnell, A.; Hurley, C.B. Visualizing variable importance and variable interaction effects in machine learning models. J. Comput. Graph. Stat. 2022, 31, 766–778. [Google Scholar] [CrossRef]
- Sorum, N.G.; Pradhan, P.; Sangma, J.R.D. Examination and prediction of influential factors on unconfined compressive strength of nano-stabilised subgrade soil using machine learning algorithms. Geomech. Geoengin. 2025, 1–24. [Google Scholar] [CrossRef]
- Ranathunga, R.J.K.P.N.; Sampath, K.H.S.M.; Ranathunga, A.S. Prediction of Geotechnical Properties of Rice Husk Ash-Stabilized Soil Systems. In Proceedings of the 2023 Moratuwa Engineering Research Conference, Moratuwa, Sri Lanka, 9–11 November 2023; pp. 240–245. [Google Scholar]
- Mahedi, M.; Cetin, B.; White, D.J. Cement, lime, and fly ashes in stabilizing expansive soils: Performance evaluation and comparison. J. Mater. Civ. Eng. 2020, 32, 04020177. [Google Scholar] [CrossRef]
- Sinha, P.; Iyer, K.K.R. Effect of Stabilization on Characteristics of Subgrade Soil: A Review. In Advances in Computer Methods and Geomechanics; Springer: Singapore, 2020. [Google Scholar]
- Lorenzo, G.A.; Bergado, D.T. Fundamental characteristics of cement-admixed clay in deep mixing. J. Mater. Civ. Eng. 2006, 18, 161–174. [Google Scholar] [CrossRef]
- Bi, J.; Chian, S.C. Modelling of three-phase strength development of ordinary Portland cement-and Portland blast-furnace cement-stabilised clay. Géotechnique 2020, 70, 80–89. [Google Scholar] [CrossRef]
- Por, S.; Nishimura, S.; Likitlersuang, S. Deformation characteristics and stress responses of cement-treated expansive clay under confined one-dimensional swelling. Appl. Clay Sci. 2017, 146, 316–324. [Google Scholar] [CrossRef]
- Rosa, M.G.; Cetin, B.; Edil, T.B.; Benson, C.H. Freeze–thaw performance of fly ash–stabilized materials and recycled pavement materials. J. Mater. Civ. Eng. 2017, 29, 04017015. [Google Scholar] [CrossRef]
- Althnian, A.; AlSaeed, D.; Al-Baity, H.; Samha, A.; Dris, A.B.; Alzakari, N.; Abou Elwafa, A.; Kurdi, H. Impact of dataset size on classification performance: An empirical evaluation in the medical domain. Appl. Sci. 2021, 11, 796. [Google Scholar] [CrossRef]
- Naseri, H.; Waygood, E.O.D.; Patterson, Z.; Alousi-Jones, M.; Wang, B. Travel mode choice prediction: Developing new techniques to prioritize variables and interpret black-box machine learning techniques. Transp. Plan. Technol. 2025, 48, 582–605. [Google Scholar] [CrossRef]
Disclaimer/Publisher’s Note: The statements, opinions and data contained in all publications are solely those of the individual author(s) and contributor(s) and not of MDPI and/or the editor(s). MDPI and/or the editor(s) disclaim responsibility for any injury to people or property resulting from any ideas, methods, instructions or products referred to in the content. |
© 2025 by the authors. Licensee MDPI, Basel, Switzerland. This article is an open access article distributed under the terms and conditions of the Creative Commons Attribution (CC BY) license (https://creativecommons.org/licenses/by/4.0/).