Article

Quality by Design Approach for a Multicomponent Quantification Using HPLC-PDA and HPLC-MS: Application to Dosage Form and Biological Body Fluids

by
Naser F. Al-Tannak
1,2,*,
Bashayer J. Al-Shatti
3,
Abdullah S. Al Ali
2,4 and
A. Hemdan
5
1
Acting Dean, Faculty of Public Health, Kuwait University, Kuwait City P.O. Box. 46300, Kuwait
2
Department of Pharmaceutical Chemistry, Faculty of Pharmacy, Kuwait University, Kuwait City P.O. Box 46300, Kuwait
3
5th Year Pharmacy Student, Faculty of Pharmacy, Health Science Center, Kuwait University, Kuwait City P.O. Box 46300, Kuwait
4
In Vitro Toxicology Group, Institute of Life Science, Swansea University Medical School, Singleton Park Campus, Swansea SA2 8PP, Wales, UK
5
Pharmaceutical Analytical Chemistry Department, Faculty of Pharmacy, Ahram Canadian University, 6th October 12451, Egypt
*
Author to whom correspondence should be addressed.
Separations 2022, 9(8), 217; https://doi.org/10.3390/separations9080217
Submission received: 8 July 2022 / Revised: 7 August 2022 / Accepted: 9 August 2022 / Published: 12 August 2022

Abstract

:
A multicomponent pharmaceutical that contains loratadine, paracetamol, and pseudoephedrine was quantified using HPLC-PDA. The three analytes were well-separated and quantified in the dosage form on a C-18 column using a gradient mobile phase. A quality by design strategy was followed to achieve the challenging separation. Screening and optimization steps were carried out to investigate the effect of many factors on the studied responses with a minimum number of runs. The ANOVA of the factorial model showed that % acetonitrile (factor A), flow rate (factor B), and pH (factor C) were significant. The detection of the analytes’ peaks was carried out using a PDA detector at 248nm for loratadine and paracetamol, and 214 nm for pseudoephedrine. The second method was SPE-HPLC-MS, where the three analytes and desloratadine, the active metabolite of loratadine, were quantified in spiked plasma and urine, using betamethasone valerate as an internal standard. The recovery of the analytes from body fluids was above 96%, and the LOQ was below 0.5 ng/mL. The validation of the developed HPLC-PDA method was achieved as per ICH guidelines, whereas the HPLC-MS method was validated according to FDA guidelines for bioanalytical method validation. The results were compared with the reported method, and no significant differences were found.

Graphical Abstract

1. Introduction

A multicomponent that contains loratadine, paracetamol, and pseudoephedrine is used to treat cases of the common cold and allergic rhinitis. Loratadine is a selective antagonist of histamine H1 receptors [1]. The metabolism of loratadine produces the active metabolite, desloratadine [2]. Desloratadine is an antihistamine that is used to treat the symptoms of allergies, such as sneezing and watery eyes. Paracetamol is an antipyretic and analgesic that is used to manage fever and as an alternative to aspirin, which sometimes cause irritation to the stomach [3]. Pseudoephedrine is a decongestant that constricts blood vessels and is used for relief from nasal congestion [4].
During a literature survey, deficiencies in the reported methods for determination of this multicomponent were noticed. In 2012, Abro K. published a paper on LC–tandem mass spectrometric determination of loratadine, paracetamol, and pseudoephedrine in plasma using chlorpheniramine as an internal standard and monolithic column [5]. The reported paper succeeded in the separation and determination of the analytes in about 10 min, which is considered a very long run time for pharmacokinetic studies, which need the analysis of large number of samples. Additionally, the reported paper does not take into consideration the analysis of the pharmacologically active desloratadine. Farid N.F. published a paper in 2016 on HPTLC determination of loratadine, paracetamol, and pseudoephedrine in tablets and plasma [6]. Additionally, this reported paper does not take into consideration the analysis of the pharmacologically active desloratadine, and no internal standard was used. Other reported chromatographic methods for determination of loratadine and/or paracetamol with other combinations in binary or ternary mixtures can be found in the literature [5,6,7,8,9,10,11].
Quality by design (QbD) was used recently for the RP-HPLC determination of multicomponent pharmaceuticals. This includes screening of all the expected factors that may affect the studied responses, followed by optimization of the significant factors to obtain the most optimum responses [12,13,14,15,16].
In the present study, determination of loratadine, paracetamol, and pseudoephedrine in a tablet dosage form was attempted on a C18 column using HPLC-PDA. The separation of the analytes was challenging due to the overlapping of paracetamol and pseudoephedrine peaks. This may have been due to similar reactivity towards the stationary phase as the log p of both analytes was very close [17]. Several trials were carried out by changing One Factor At a Time (OFAT) to separate the mixture, but every time the two analytes overlapped. For full resolution, many trials are needed; however, this process is very time-consuming and require large amounts of solvents, which are expensive. For this reason, the quality by design (QbD) approach was exploited to gain an improved understanding of the effect of the factors on separation efficiency [18]. FDA cGMP and the International Conference on Harmonization (ICH) guidelines Q8(R2) introduced QbD in the twenty-first century [19,20].
The HPLC-PDA method was validated as per ICH guidelines, while the SPE-HPLC-MS method was validated as per FDA guidelines for bioanalytical method validation.
The aim of this work was to determine the ternary mixture of loratadine, paracetamol, and pseudoephedrine in tablets using the QbD strategy for the first time and to determinate the quaternary mixture of loratadine, its active metabolite desloratadine, paracetamol, and pseudoephedrine using SPE-HPLC-MS in biological fluids for the first time.

2. Materials and Methods

2.1. Material and Reagents

Loratadine, desloratadine, paracetamol, pseudoephedrine, and betamethasone valerate were obtained from (Sigma-Aldrich, Darmstadt, Germany). Standards’ purity was higher than 98.5%. Figure 1 shows the chemical structures of the analyzed compounds. Trimed® Flu tablets labeled as containing 5 mg of loratadine, 500 mg of paracetamol, and 120 mg of pseudoephedrine (MINAPHARM) were obtained from the Egyptian market. MS-grade acetonitrile and formic acid were purchased from (Sigma-Aldrich, Darmstadt-Germany). Deionized water was used throughout the work and is indicated by the word “water”. Potassium dihydrogen phosphate was provided by (Al- Nasr Company for Pharmaceutical chemicals, Qalyubia- Egypt). Human blank plasma was obtained from The Holding Company for Biological products and Vaccines (VACSERA, Cairo, Egypt). Human urine samples were provided by volunteers.

2.2. Instrument

A Shimadzu LC-2040C 3D PLUS nexera–i equipped with a PDA detector (LC-2030/2040 PDA), LC-2040 pump, and four-line degasser and coupled with triple-quadrupole MS 8040 (Kyoto, Japan) was used for separation. An Inertsil C-18 (150 × 4.6 mm, 5µ) analytical column was utilized for the separation. Data acquisition was carried out with LabSolutions software, where statistical analysis was performed using Design-Expert® 11 software.

2.3. Procedures

2.3.1. Preparation of Standard Solutions and Working Solutions

A total of 100 mg of loratadine, desloratadine, paracetamol, pseudoephedrine, and betamethasone valerate (IS) was weighed and transferred separately to 100 mL volumetric flasks. Then, this was dissolved in 20 mL of acetonitrile, and distilled water was added until the flask was filled up to the mark to prepare stock solutions. Standard working solutions with a concentration of 200 µg/mL were prepared for the HPLC-PDA method and 500 ng/mL for the SPE-HPLC-MS method by dilution with the starting mobile phase. Each analyte was prepared in blank plasma and urine as the quality control (QC) sample at three levels: low (LQC), medium (MQC), and high (HQC), with concentrations of 1.00 ng/mL, 100 ng/mL, and 400 ng/mL, respectively.

2.3.2. Sample Preparation for SPE-HPLC-MS

Plasma samples were stored at −80 °C and thawed immediately before spiking, and urine samples were stored in the fridge. Extraction of the analytes and IS from plasma and urine samples was carried out using solid-phase extraction (SPE). C18 cartridge (200 mg/3cc) was employed for the extraction. The cartridge was conditioned with 3 mL of acetonitrile and 3 mL of water. Then, 5 mL of the plasma or urine sample was passed through the cartridge with a flow rate of 1 mL/min. Washing of the cartridge was performed by passing 5% acetonitrile in water through the cartridge. Then, the cartridge was dried under vacuum for 5 min, and the elution of the analytes and internal standard was achieved using 3 mL of acetonitrile at a flow rate of 0.5 mL/min. The resultant extract was dried till dryness under vacuum and then reconstituted in the mobile phase for LC-MS analysis.

2.3.3. Chromatographic Conditions

An Inertsil C-18 (150 × 4.6 mm, 5µ) analytical column was utilized as a stationary phase.

For HPLC-PDA

Gradient elution of the mobile phase was used to to shorten the run time of the analysis, gradient elution was used.
The employed mobile phases were: phase A: acetonitrile; phase B: 20 Mm potassium phosphate buffer, pH 5.5. The gradient was as follows: 50% phase B with a flow rate of 1.1 mL/min for 2 min, then decreased linearly to 30% B from 2 min to 3 min. Then, the gradient went back to the original conditions from 3 min to 4 min.
The detection of the analytes’ peaks was performed using a PDA detector at 248 nm for loratadine and paracetamol, and 214 nm for pseudoephedrine. Column temperature was kept at 40 °C.

For SPE-HPLC-MS

Full determination of the compounds was carried out using isocratic elution mode. The employed mobile phases were: phase A: 0.2% formic acid in acetonitrile; phase B: 0.2% formic acid. The mobile phase ratio was 70% phase A: 30% phase B with a flow rate of 1.2 mL/min. The LC was connected to triple-quadrupole MS 8040 equipped with an ESI interface working at 4.5 kV positive ionization mode, and DL and heat block temperatures of 250 °C and 400 °C, respectively, were applied. Nebulizing and drying nitrogen gas flow rates were 3 L/min and 15 L/min, respectively. The analytical run time was 3.5 min, and the full scan covered the mass range from m/z 100 to 1000.

2.3.4. Validation

Linearity and Range

For HPLC-PDA, different concentrations of the analytes were prepared by diluting the standard working solution of each analyte with the starting mobile phase. The prepared concentrations were 0.5–50 μg/mL loratadine, 50–150 μg/mL paracetamol, and 20–100 μg/mL pseudoephedrine. A total of 10 μL of each concentration was injected three times into the HPLC system. Calibration curves were plotted between the peak area against the concentration.
For SPE-HPLC-MS, human plasma and urine samples were spiked with standard solution of each analyte to reach concentrations from 0.50 to 500 ng/mL. Then, 100 μL of the internal standard was added to each calibration standard. The samples were extracted as explained earlier, and then 10 μL of each concentration was chromatographed, and the mean relative peak area of each parent ion to that of the internal standard was plotted against the corresponding concentration.

Accuracy

For HPLC-PDA, six different concentrations of each analyte were injected three times to calculate the recovery percentage from the obtained regression equation.
For SPE-HPLC-MS, spiked samples were analyzed at four levels, LLQC, LQC, MQC, and HQC. Then, the RSD% was calculated.

Precision Repeatability

For HPLC-PDA, the relative standard deviation was calculated by injecting three different concentrations of each analyte in the same day.
For SPE-HPLC-MS, spiked samples were analyzed three times in the same day at four levels, LLQC, LQC, MQC, and HQC. Then, the RSD% was calculated.

Intermediate Precision

For HPLC-PDA, the relative standard deviation was calculated by injecting three different concentrations of each analyte in three different days.
For SPE-HPLC-MS, spiked samples were analyzed three times in three consecutive days at four levels, LLQC, LQC, MQC, and HQC. Then, the RSD% was calculated.

Limit of Quantitation (LOQ) and Limit of Detection (LOD)

According to ICH recommendations [21], the signal-to-noise ratio was used to determine the LOQ and LOD in chromatographic methods. A signal-to-noise ratio of 3:1 is generally considered acceptable for estimating the detection limit, whereas a ratio of 10:1 is used to estimate the quantitation limit.

Robustness

The robustness of an analytical procedure is a measure of its capacity to remain unaffected by small but deliberate variations in method parameters and provides an indication of its reliability during normal usage. Robustness was tested by making deliberate changes in starting acetonitrile %, mobile phase pH, column temperature, and flow rate.

Recovery and Matrix Effect

Recovery % calculation was carried out to test for extraction efficiency of the developed method. This was achieved by comparing the relative peak area of spiked samples before extraction with that spiked after extraction at the three quality control levels. The matrix effect test was performed to assess the effect of the matrix on the quantification of the studied analytes by the developed method. This was achieved by comparing he relative peak area of spiked samples after extraction with that of the standard solution.

Selectivity

Three different batches of blank human plasma and urine were extracted and analyzed to test method selectivity.

Stability

The stability of the analytes was checked during method development. Long-term stability, bench-top, and stock solution stability, autosampler, and freeze–thaw stability of the analytes were checked using three replicates of a low concentration and high-concentration QC samples. Long-term stability was assessed by analyzing the QC samples kept in a refrigerator at 4 °C for 7 days. Bench-top stability was assessed by analyzing the samples left on the bench at room temperature for six hours. Stock solution stability was assessed by analyzing the QC samples of each analyte three times in the solution state. Autosampler stability was checked by assessing the stability of the analytes under the conditions of the autosampler for four hours. Freeze and thaw stability was assessed by freezing and thawing the analytes in the matrix studied for three cycles. The recovery % was compared to freshly prepared QC solutions.

2.3.5. Application to Pharmaceutical Formulation

To quantify the content of the analytes in Trimed® Flu tablets, 10 tablets were crushed and then blended. Then, 50 mL of acetonitrile was added to extract the analytes. Then, the contents were stirred for 20 min. Filtration was carried out with a 0.45 µm Whatman filter. Washing of the filter paper was performed three times, each time with 10 mL of acetonitrile. Then, water was added to the solution until the flask was filled up to the mark. To reach the linearity range, dilutions were made. Then, the above-mentioned procedure was applied for analysis of the contents, and the recoveries were calculated.

3. Results and Discussion

During the literature survey, a very limited number of reported methods were found for the determination of loratadine in its ternary mixture [5,6,7,8,9,10,
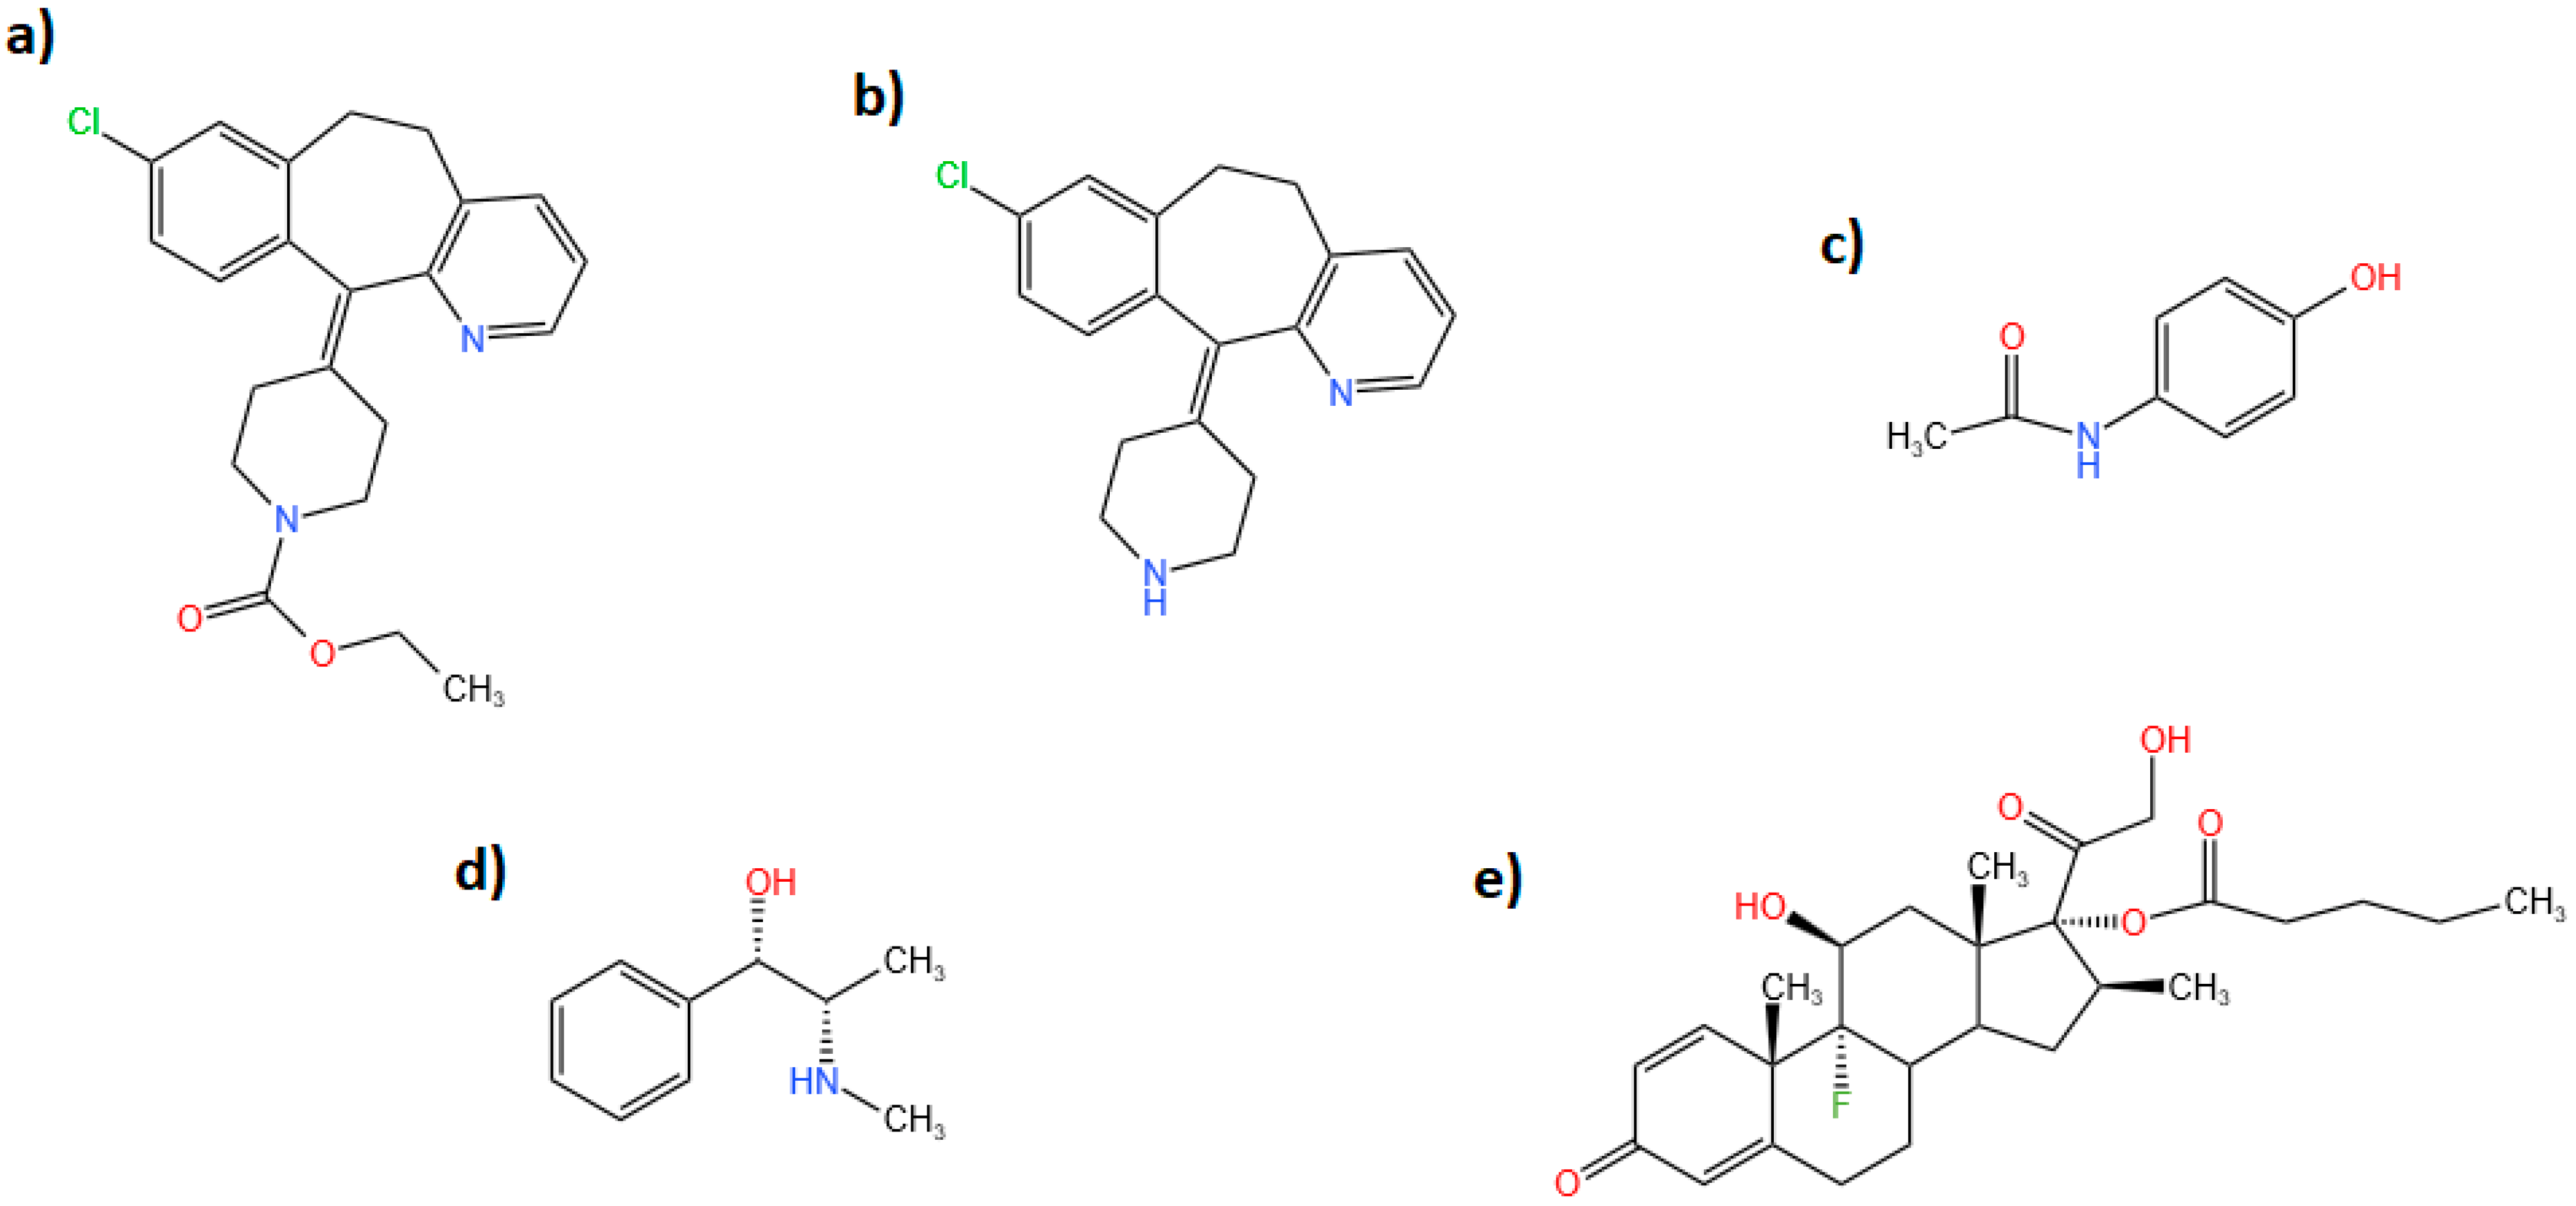
11]. However, to our knowledge, there are no reported chromatographic methods for the separation and quantification of the quaternary mixture loratadine, its active metabolite desloratadine, paracetamol, and pseudoephedrine. This is due to the very similar interaction of the mentioned analytes with the different stationary phases. In the present study, determination of loratadine, paracetamol, and pseudoephedrine in a tablet dosage form was attempted on C18 column using HPLC-PDA. The separation of the analytes was challenging due to the overlapping of paracetamol and pseudoephedrine peaks.
Additionally, the determination of the mixture with the pharmacologically active desloratadine in human plasma and urine was studied using SPE-HPLC-MS. Betamethasone valerate was used as an internal standard for the mass spectrometry method.
To achieve our goal, a QbD approach was used to separate the analytes over a minimum number of trials. Most of the published chromatographic methods use OFAT to develop a chromatographic method that can separate the tested mixture with an acceptable resolution. However, OFAT requires a large number of experiments, and it does not enable the full understanding of the main and interaction effects of the studied factors. Response surface study with a central composite design was applied to optimize the studied factors. The produced random 12 runs for the screening step and the other 20 runs for the optimization step are presented in the electronic supplementary material, Table S1.

3.1. Screening Step

Irregular fractional two-level factorial design was implemented for the screening of all the factors and how they could affect the studied responses: resolution between each analyte and the next one and run time (Rt). Two levels for each factor were used: % acetonitrile at 30% and 70%, flow rate at 0.5 mL/min and 2 mL/min, pH 3 and 7, and oven temperature at 25 and 40 °C. The total number of runs for the screening step was 12, as presented in the electronic supplementary material, Table S1. The factors were studied through a factorial study type using a two-level factorial design type. The process order of the developed screening model was main effects only and the type was a factorial model. The significance level to assess the effect of the model terms was alpha = 0.05. The ANOVA for the selected factorial model showed that only three factors were significant. The three factors were % acetonitrile (factor A), flow rate (factor B), and pH (factor C). The remaining factor (oven temperature) was a statistically insignificant factor, as presented in Table 1. Pareto charts which indicate the significant factors for each response are presented in the electronic supplementary material, Figure S1.

3.2. Optimization Step

Only the significant factors from the screening step were further studied for optimization. The study type was a response surface, and the design type was a central composite. The process order of the developed optimization model was quadratic, and the model type was polynomial. For optimization, 20 runs were carried out, as presented in the electronic supplementary material, Table S1. The factors were studied at five different levels. ANOVA results are shown in Table 1. Results show that the quadratic model was suggested for all the responses. The relationship between the different responses (y) and the significant factors (x) is shown in the following equation:
y = a ± b1 (x1) ± b2 (x2) ± b3 (x3) ± b4 x12 ± b5 x22 ± b6 x32
where x1, x2, and x3 are the studied factors acetonitrile %, flow rate, and pH, respectively.
Figure S2 in the electronic supplementary material represents the perturbation charts explaining the effect of significant factors on the responses.
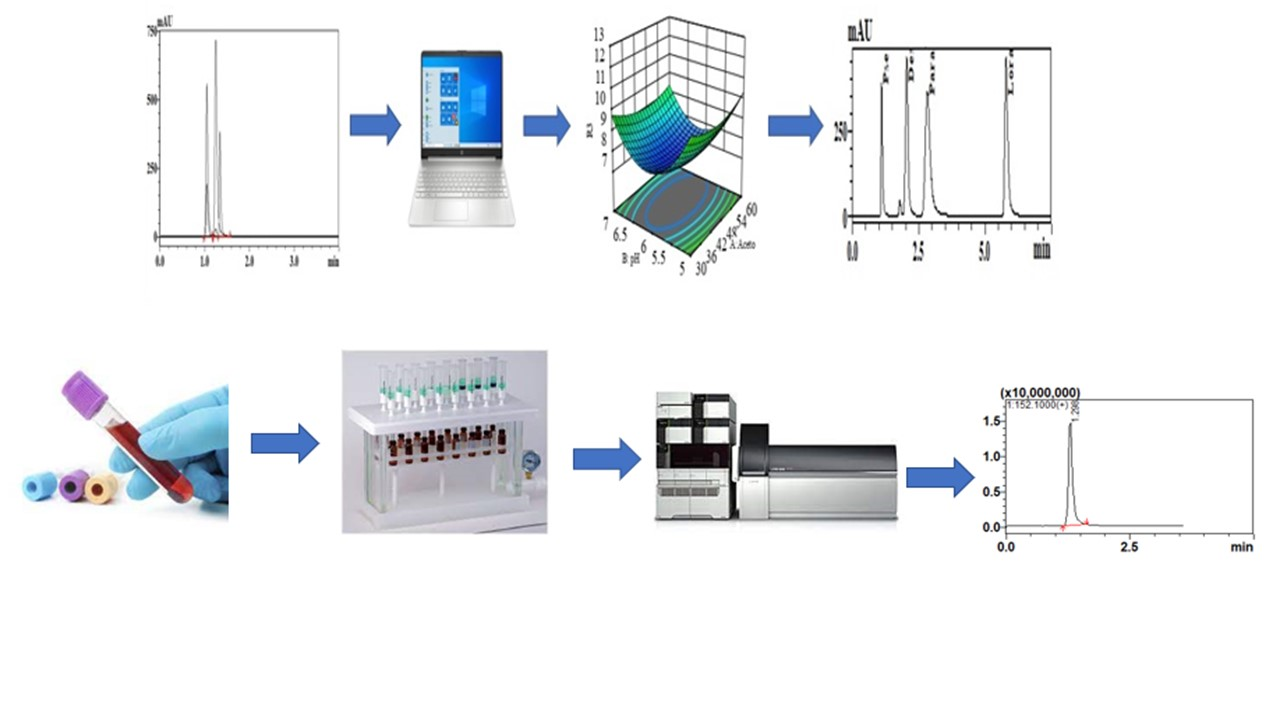
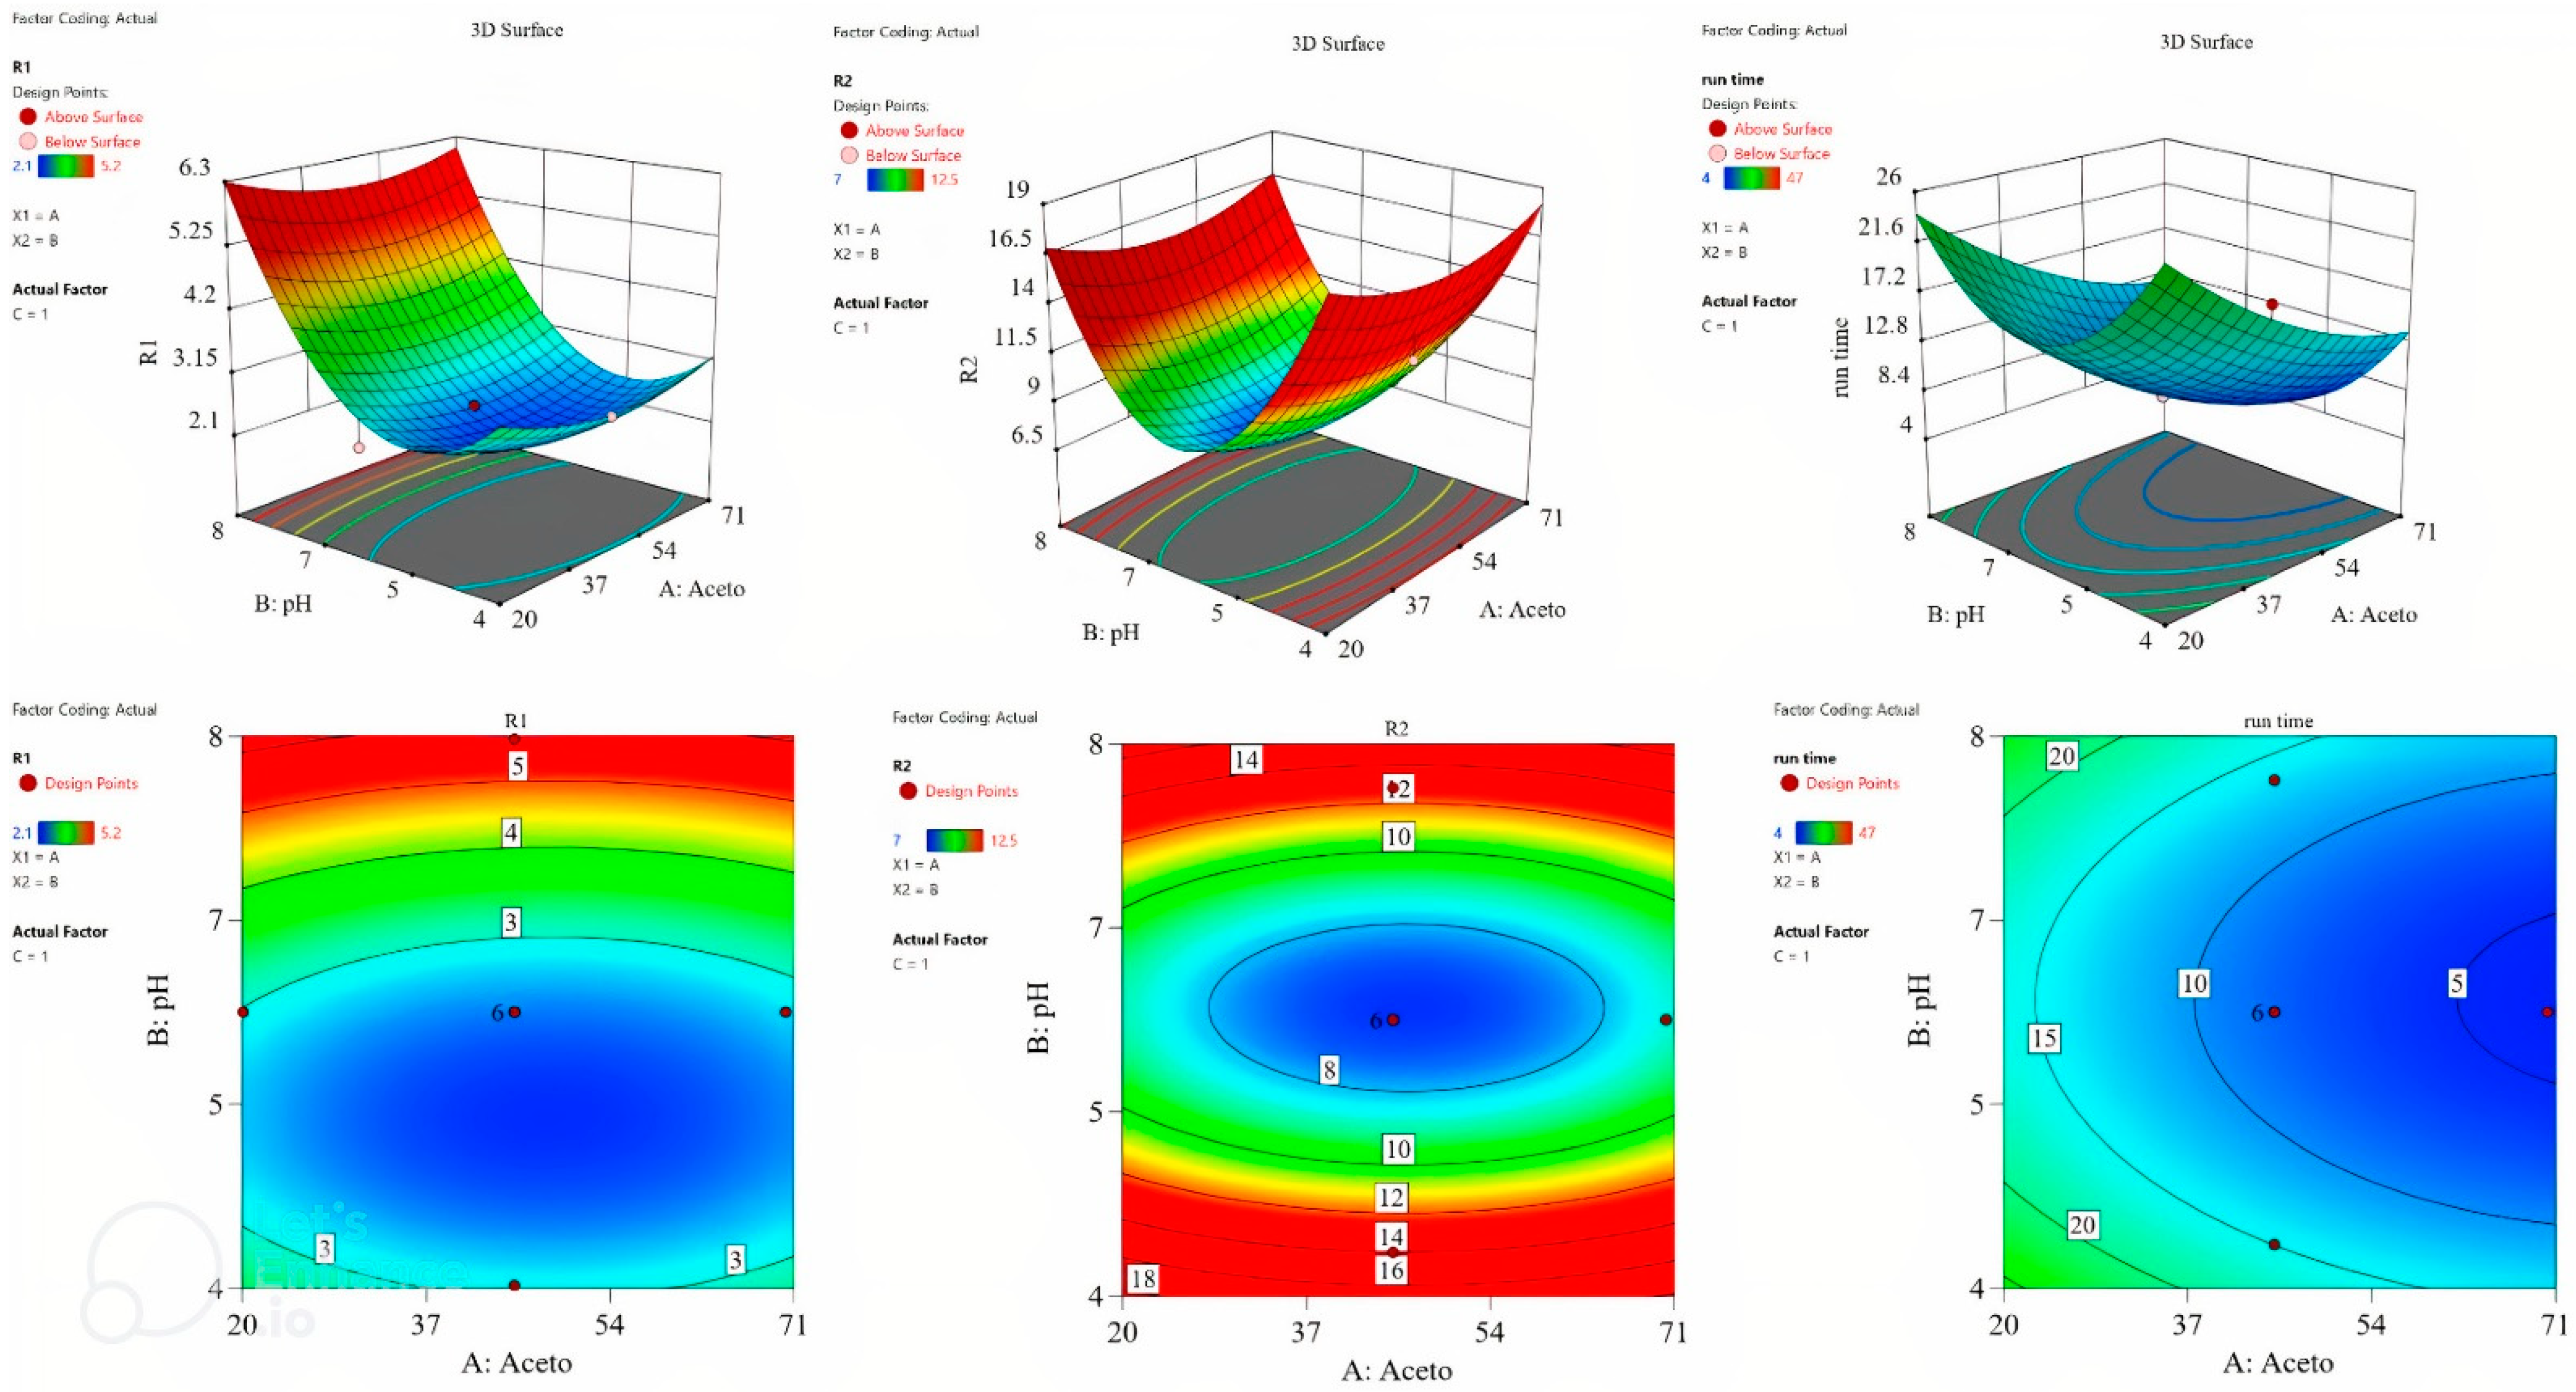
The surface plot and the contour plot are shown in Figure 2, revealing the relationship between the factors and the studied responses.
The numerical optimization tool of the software was utilized to optimize the responses. The desirability criteria for R1 (resolution between pseudoephedrine and paracetamol) and R2 (resolution between paracetamol and loratadine) was set to the maximum, whereas it was set to the minimum for run time. The optimization tool suggested that 50% acetonitrile, pH 5.5, and 1.1 mL/min flow rate were the optimum conditions, reaching a desirability of 0.849.
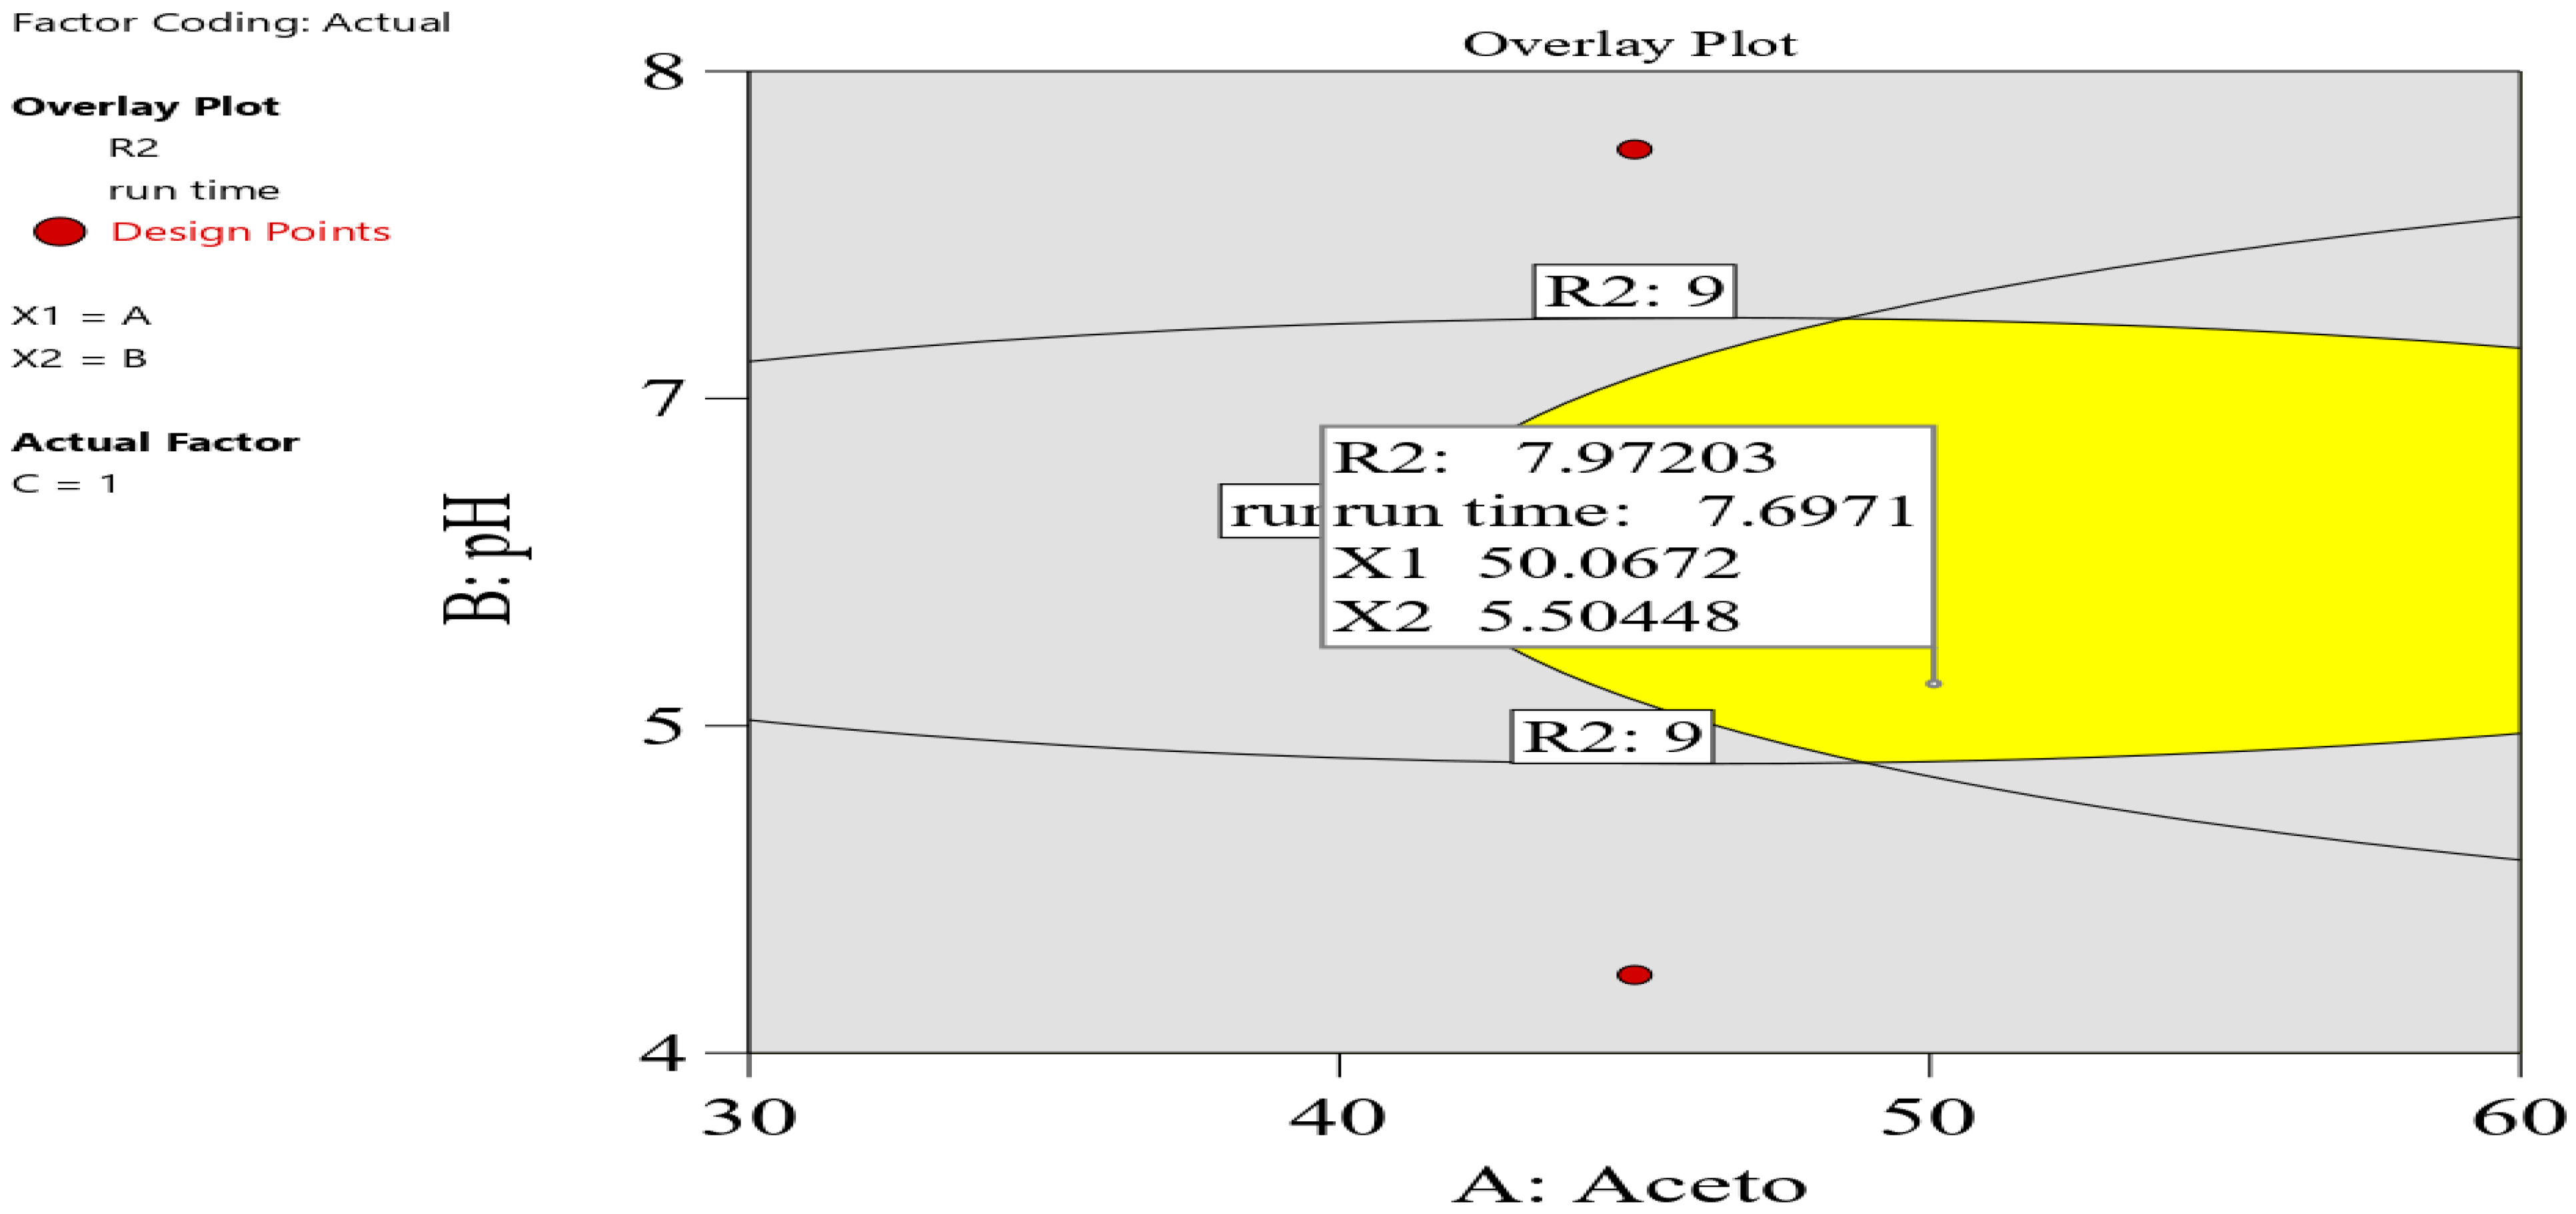
In the graphical optimization, the setting was as follows: R1 and R2 were set at 2 as the lower acceptable limit, and 10 min was set as the maximum run time. The overlay plot shows the optimum conditions, as shown in Figure 3. Yellow indicates sweet-spot areas, whereas gray was assigned to areas that do not fit in the model.
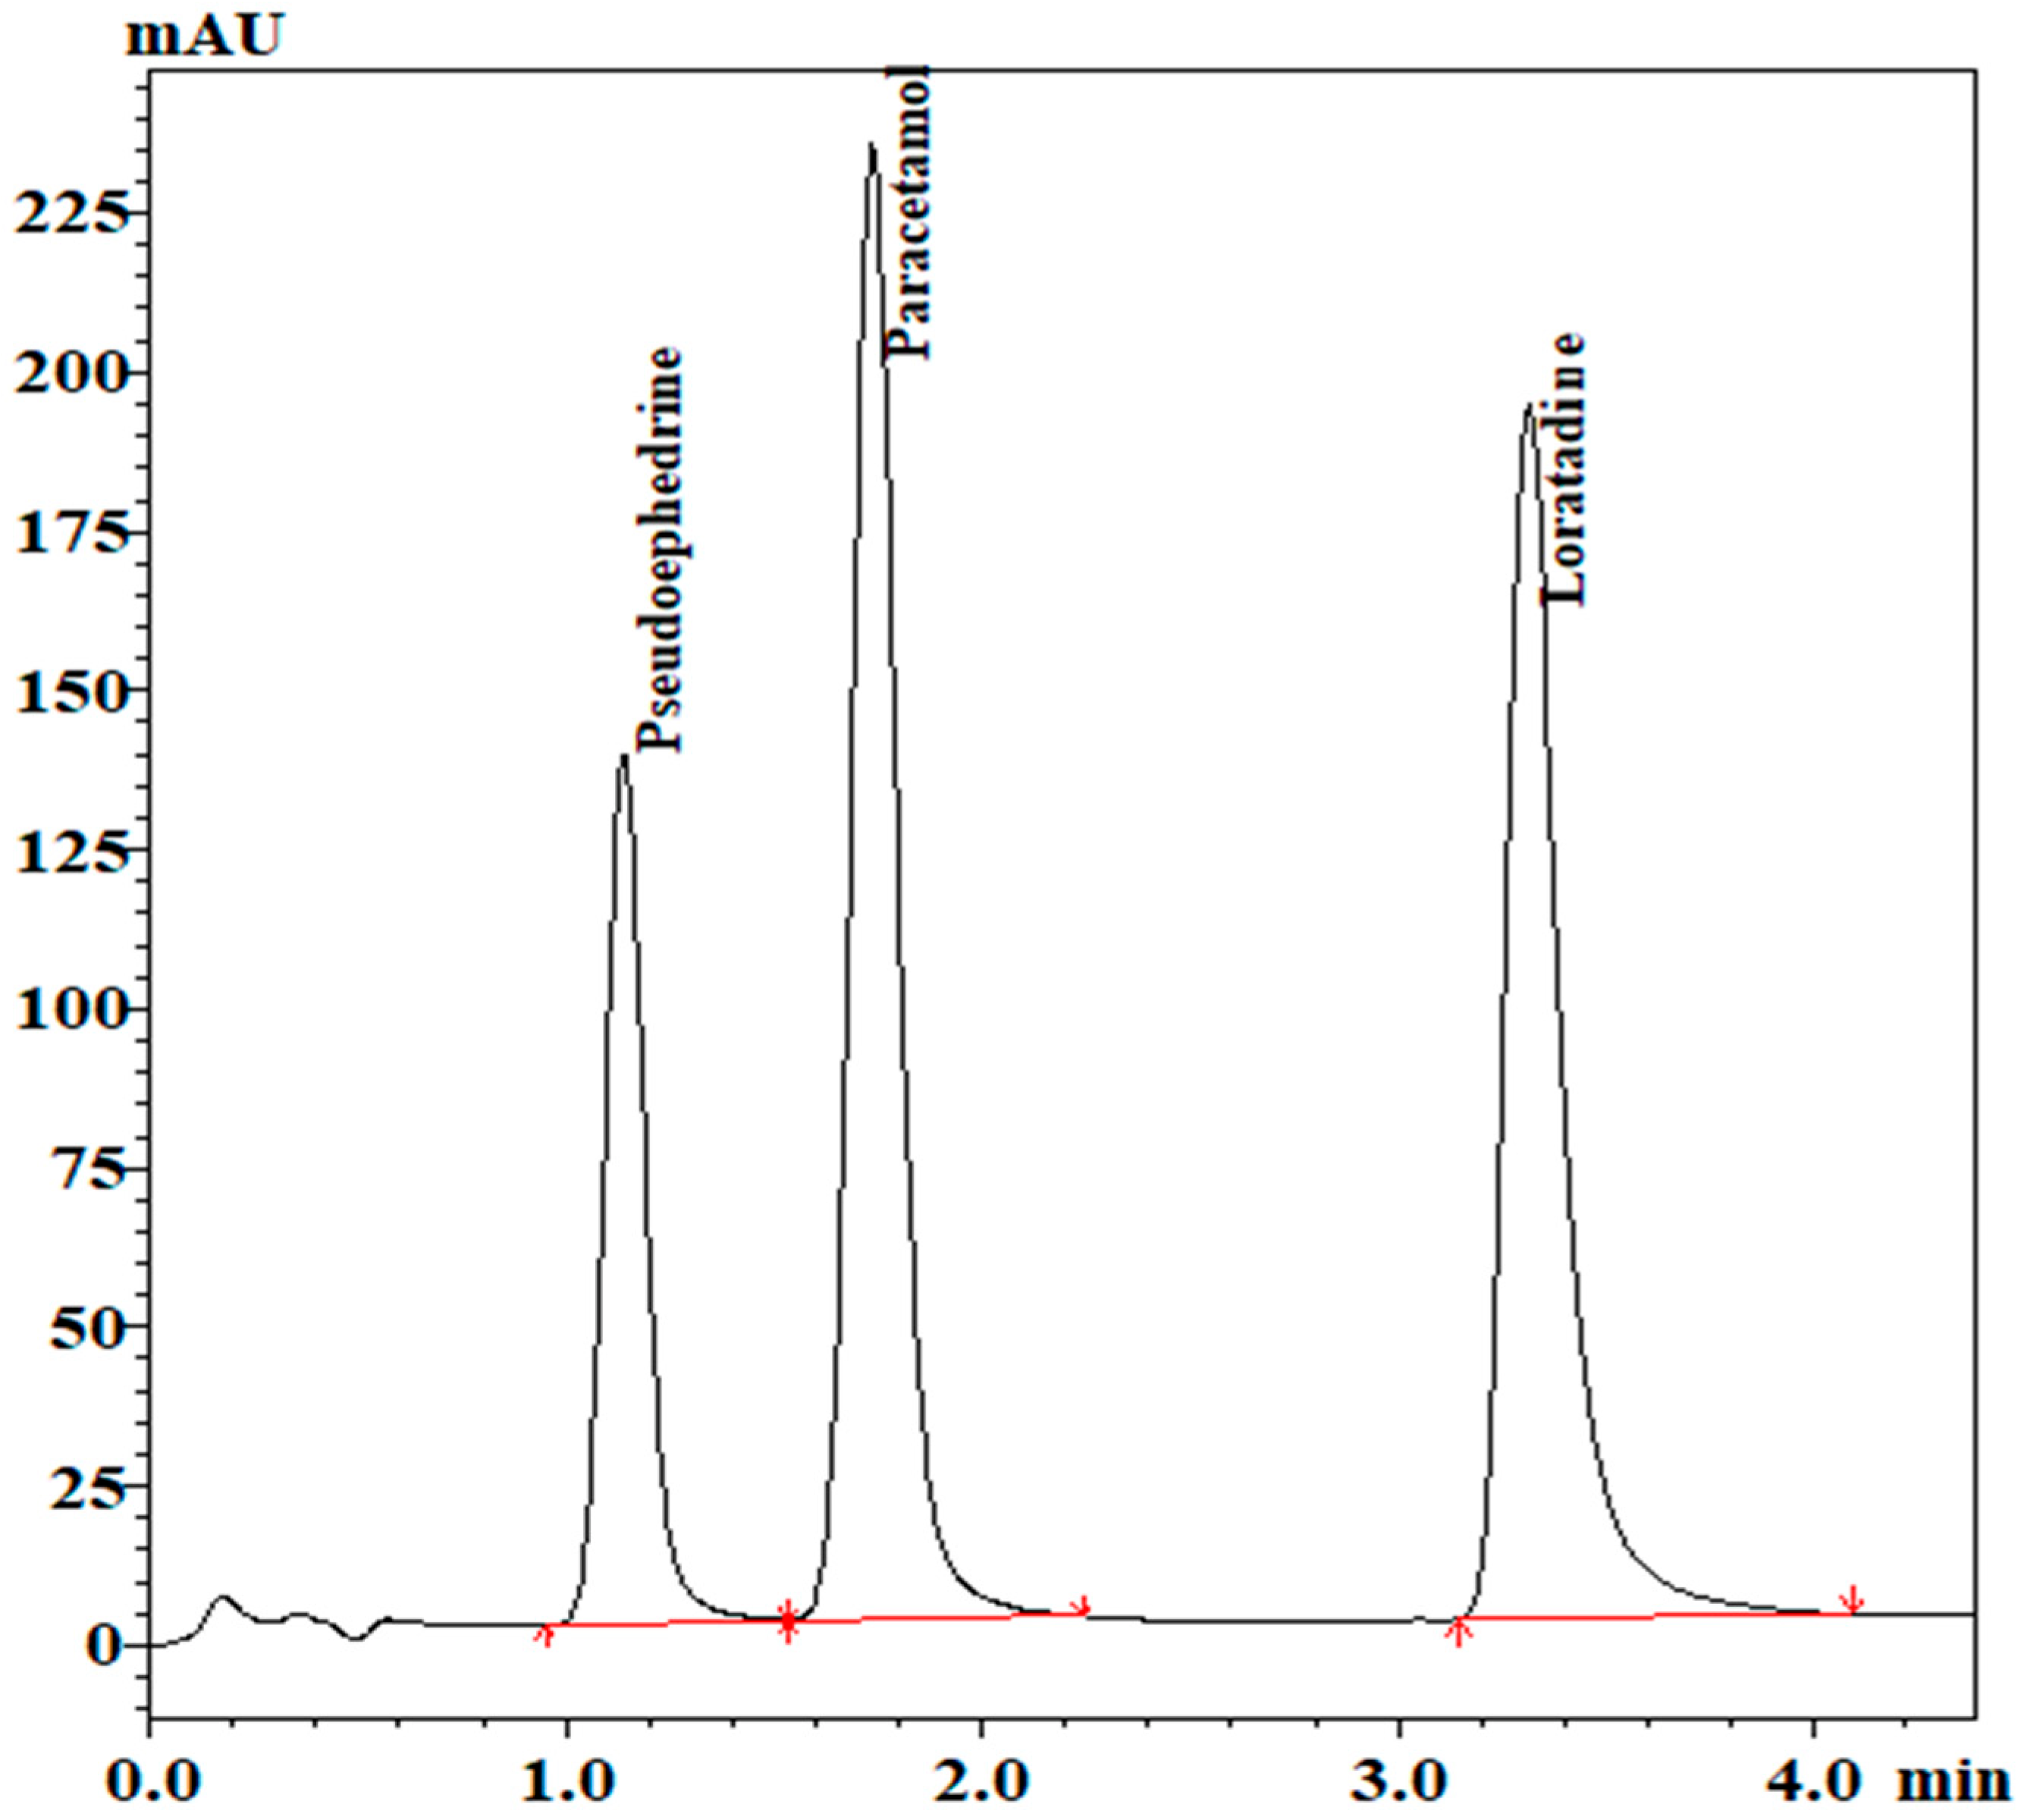
Loratadine was the reason for the long run time. So, gradient elution was used to shorten the run time. The gradient mobile phase was as follows:
The employed mobile phases were phase A: acetonitrile; phase B: potassium phosphate buffer, pH 5.5. The gradient was as follows: 50% phase B was used with a flow rate of 1.1 mL/min for 2 min, which was then decreased linearly to 30% B from 2 min to 3 min. Then, the gradient went back to the original conditions from 3 min to 4 min.
The chromatogram for separation of the analytes is shown in Figure 4. System suitability parameters are shown in Table 2.
Validation of the proposed method was carried out as per ICH guidelines [21] regarding linearity, accuracy, precision, LOD and LOQ, and robustness. All the parameters were within the acceptable limits. Calibration curves are represented in Figure S3 in the electronic supplementary material. Validation parameters and results of the marketed dosage form are shown in Table 3, whereas robustness results are represented in Table S2 in the electronic supplementary material.

3.3. SPE-HPLC-MS

To our knowledge, there are no reported HPLC-MS methods for determination of loratadine, its active metabolite desloratadine, paracetamol, and pseudoephedrine in human plasma and urine. So, the present study represents the first method for determination of the mixture in biological fluids by LC-MS.
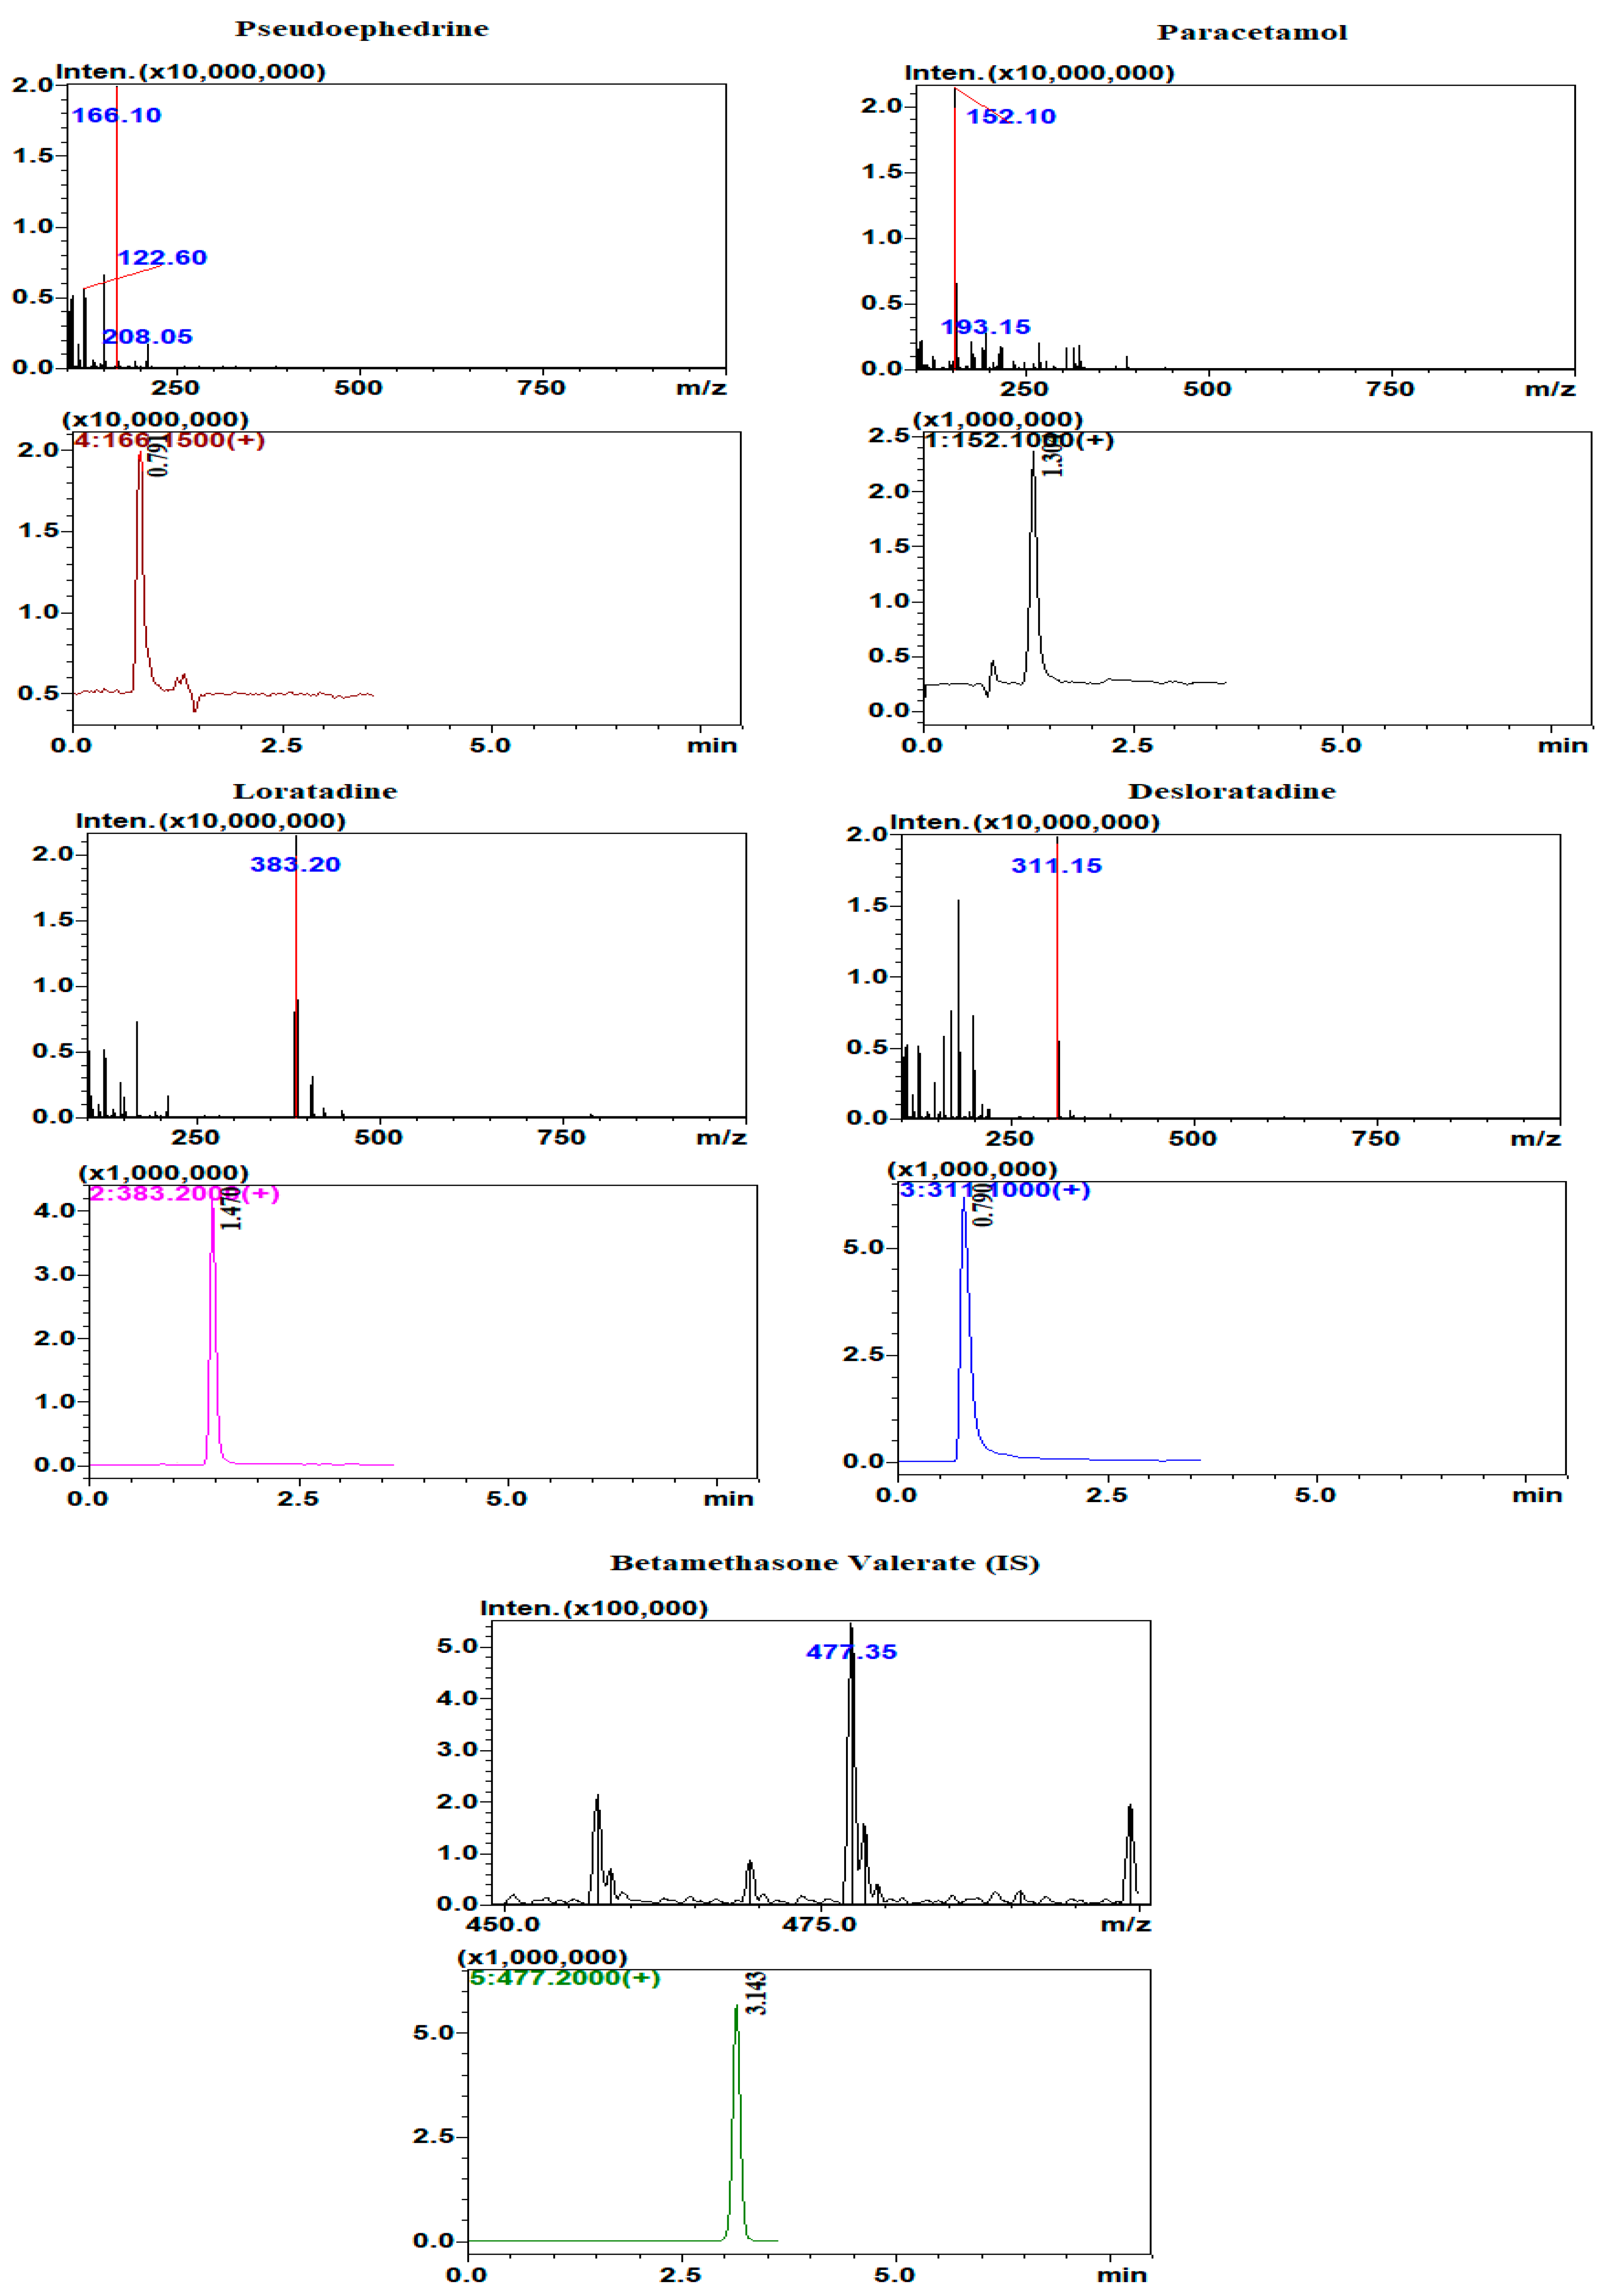
The very high sensitivity and selectivity of HPLC-MS makes it the technique of choice for determination of drugs and metabolites in biological body fluids. The separation of the four analytes and the IS was attempted using several mobile phase compositions and ratios. The optimum separation was obtained using a mobile phase composed of: phase A: 0.2% formic acid in acetonitrile; and phase B: 0.2% formic acid. The mobile phase ratio was 70% phase A: 30% phase B with a flow rate of 1.2 mL/min. The run time was about 3.5 min. Determination of the analytes and the internal standard was carried out under positive ionization mode. Selected ion monitoring (SIM) was used for the detection and quantification of the analytes where the protonated parent ions [M + H]+ of loratadine, desloratadine, paracetamol, pseudoephedrine, and betamethasone valerate (IS) were detected and determined at m/z 383.2, 311.2, 152.1, 166.15, and 477.2, respectively. The full MS scan and SIM chromatograms showing the retention times of the analyzed drugs are shown in Figure 5.
Validation of the HPLC-MS method was carried out as per FDA guidelines for bioanalytical method validation regarding linearity, accuracy, precision, stability, recovery, and matrix effects [22]. Calibration curves are represented in Figure S4 in the electronic supplementary material.
Extraction of the analytes from human plasma and urine was performed using solid phase extraction, where the recovery % for all the analytes was above 96 %. Selectivity of the method was tested by extracting and analyzing three different batches of blank human plasma and urine, where no interference from endogenous substances was detected at the m/z and retention times of the analytes.
The sensitivity of the method was tested via calculating LOQ and LOD. The lowest concentration that could be quantified for all the analytes was 0.5 ng/mL for all analytes where RSD did not exceed 20%.
Validation parameters of the developed method are shown in Table 4 and Table 5 and stability results are shown in Table 6.

3.4. Statistical Comparisons

Accuracy results for each analyte as obtained using the developed HPLC-PDA method were compared with the results obtained by applying the reported HPTLC method [6]. No significant differences were found between the two methods, as presented in the electronic supplementary material, Table 7.

4. Conclusions

The combination of loratadine, paracetamol, and pseudoephedrine could be separated with sufficient accuracy using a conventional C18 column. Achieving full resolution of the mixture was challenging due to the similar interaction of the analytes towards the stationary phases. So, a QbD approach was exploited to assess the main and interaction effects of the studied factors with the least number of runs and develop a multivariate chromatographic method that could separate all the analytes with sufficient resolution and in a reasonable run time. Gradient elution was utilized to shorten the run time of the analysis. Additionally, loratadine, its active metabolite desloratadine, paracetamol, and pseudoephedrine were determined for the first time in human plasma and urine using the SPE-HPLC-MS method with perfect recovery and accuracy. The developed HPLC-PDA method could be used in quality control laboratories for separation of the mixtures, while the SPE-HPLC-MS method could be used in pharmacokinetic studies to detect and quantify the mentioned drugs in biological body fluids.

Supplementary Materials

The following supporting information can be downloaded at: https://www.mdpi.com/article/10.3390/separations9080217/s1. Figure S1: Pareto charts showing the significant factors for each response; Figure S2: perturbation charts showing the interaction effects of the studied factors for each response; Figure S3. Calibration curves for the analytes for HPLC method; Figure S4. Calibration curves for the analytes for MS method; Table S1: the produced random runs for screening and optimization; Table S2. Robustness testing for the developed HPLC method.

Author Contributions

Conceptualization, N.F.A.-T. and A.H.; methodology, N.F.A.-T., B.J.A.-S., A.S.A.A. and A.H.; software, N.F.A.-T. and A.H.; validation, N.F.A.-T., B.J.A.-S., A.S.A.A. and A.H.; formal analysis, N.F.A.-T. and A.H.; investigation, N.F.A.-T. and A.H.; resources, N.F.A.-T. and A.H.; data curation, N.F.A.-T. and A.H.; writing—original draft preparation, N.F.A.-T., B.J.A.-S., A.S.A.A. and A.H.; writing—review and editing, N.F.A.-T. and A.H.; visualization, N.F.A.-T. and A.H.; supervision, N.F.A.-T. and A.H.; project administration, N.F.A.-T. and A.H. All authors have read and agreed to the published version of the manuscript.

Funding

This research received no external funding.

Data Availability Statement

Not applicable.

Acknowledgments

The authors express their sincere gratitude to the Department of Pharmaceutical Chemistry, Faculty of Pharmacy, Kuwait University, for providing the facilities and instruments used to accomplish this study.

Conflicts of Interest

The authors declare no conflict of interest.

References

  1. Witiak, D.T. Antiallergenic agents. In Medicinal Chemistry, 3rd ed.; Burger, A., Ed.; Wiley Interscience: New York, NY, USA, 1970; p. 3. [Google Scholar]
  2. Yumibe, N.; Huie, K.; Chen, K.; Snow, M.; Clement, R.P.; Cayen, M.N. Identification of human liver cytochrome P450 enzymes that metabolize the nonsedating antihistamine loratadine: Formation of descarboethoxyloratadine by CYP3A4 and CYP2D6. Biochem. Pharmacol. 1996, 51, 165–172. [Google Scholar] [CrossRef]
  3. Budavari, S. The Merck Index, an Encyclopedia of Chemicals, Drugs and Biologicals, 14th ed.; Merck and Co. Inc.: Whithouse Station, NJ, USA, 2006. [Google Scholar]
  4. Martindale-Extra Pharmacopoeia, 34th ed.; The Complete Drug References; The pharmaceutical Press: London, UK, 2005.
  5. Abro, K.; Memon, N.; Bhanger, M.I.; Perveen, S.; Kandhro, A. Multi-component quantitation of loratadine, pseudoephedrine and paracetamol in plasma and pharmaceutical formulations with liquid chromatography-tandem mass spectrometry utilizing a monolithic column. Quim. Nova 2012, 35, 1950–1954. [Google Scholar] [CrossRef]
  6. Farid, N.F.; Abdelaleem, E.A. HPTLC method for the determination of paracetamol, pseudoephedrine and loratidine in tablets and human plasma. J. Chromatogr. Sci. 2016, 54, 647–652. [Google Scholar] [CrossRef] [PubMed]
  7. Belal, F.; El-Razeq, S.A.; El-Awady, M.; Zayed, S.; Barghash, S. Rapid micellar HPLC analysis of loratadine and its major metabolite desloratadine in nano-concentration range using monolithic column and fluorometric detection: Application to pharmaceuticals and biological fluids. Chem. Cent. J. 2016, 10, 79. [Google Scholar] [CrossRef]
  8. Sebaiy, M.M.; Ziedan, N.I. Developing a High-performance Liquid Chromatography Method for Simultaneous Determination of loratadine and its Metabolite desloratadine in Human Plasma. Curr. Drug Metab. 2019, 20, 1053–1059. [Google Scholar] [CrossRef] [PubMed]
  9. El-Sherbiny, D.T.; El-Enany, N.; Belal, F.; Hansen, S.H. Simultaneous determination of loratadine and desloratadine in pharmaceutical preparations using liquid chromatography with a microemulsion as eluent. J. Pharm. Biomed. Anal. 2007, 43, 1236–1242. [Google Scholar] [CrossRef] [PubMed]
  10. Youssef, S.H.; Mohamed, D.; Hegazy, M.A.; Badawey, A. Analytical methods for the determination of paracetamol, pseudoephedrine and brompheniramine in Comtrex tablets. BMC Chem. 2019, 13, 78. [Google Scholar] [CrossRef] [PubMed]
  11. Acheampong, A.; Gyasi, W.O.; Darko, G.; Apau, J.; Addai-Arhin, S. Validated RP-HPLC method for simultaneous determination and quantification of chlorpheniramine maleate, paracetamol and caffeine in tablet formulation. Springerplus 2016, 5, 625. [Google Scholar] [CrossRef] [PubMed]
  12. Krishna, M.V.; Dash, R.N.; Reddy, B.J.; Venugopal, P.; Sandeep, P.; Madhavi, G. Quality by Design (QbD) approach to develop HPLC method for eberconazole nitrate: Application oxidative and photolytic degradation kinetics. J. Saudi Chem. Soc. 2016, 20, S313–S322. [Google Scholar] [CrossRef]
  13. Peraman, R.; Bhadraya, K.; Reddy, Y.P.; Reddy, C.S.; Lokesh, T. Analytical quality by design approach in RP-HPLC method development for the assay of etofenamate in dosage forms. Indian J. Pharm. Sci. 2015, 77, 751–757. [Google Scholar] [CrossRef] [PubMed]
  14. Karmarkar, S.; Garber, R.; Genchanok, Y.; George, S.; Yang, X.; Hammond, R. Quality by design (QbD) based development of a stability indicating HPLC method for drug and impurities. J. Chromatogr. Sci. 2011, 49, 439–446. [Google Scholar] [CrossRef] [PubMed]
  15. Patil, T.S.; Deshpande, A.S. Development of an innovative quality by design (QbD) based stability-indicating HPLC method and its validation for clofazimine from its bulk and pharmaceutical dosage forms. Chromatographia 2019, 82, 579–590. [Google Scholar] [CrossRef]
  16. Vijayaraj, S.; Palei, N.N.; Katyayani, T. Quality by Design (Qbd) Approach to Develop HPLC Method for Estimation of Gliclazide and its Impurity (Gliclazide Impurity A) in Bulk Drug. Curr. Pharm. Anal. 2019, 15, 716–723. [Google Scholar] [CrossRef]
  17. Pseudoephedrine. Available online: https://go.drugbank.com/drugs/DB00852 (accessed on 13 July 2021).
  18. ICH Harmonized Tripartite Guideline (2009) Pharmaceutical Development Q8(R2); ICH: Geneva, Switzerland, 2009.
  19. Food and Drug Administration. Department of Health and Human Services Pcfsc, A Risk-Based Approach; Food and Drug Administration: Silver Spring, MD, USA, 2004. [Google Scholar]
  20. Holm, P.; Allesø, M.; Bryder, M.C.; Allesø, M.; Bryder, M.C.; Holm, R. Q8 (R2) Pharmaceutical Development. In Nims RW ED; Teasdale, A., Ed.; ICH Quality Guidelines: An implementation guide; Wiley: Hoboken, NJ, USA, 2018; pp. 535–577. [Google Scholar]
  21. ICH, Validation of analytical procedure: Text and methodology Q2(R1). In Proceedings of the International Conference on Harmonization, Geneva, Switzerland, 15 December 2005.
  22. Food and Drug Administration. FDA, Guidance for Industry, Bioanalytical Method Validation; Food and Drug Administration: Silver Spring, MD, USA, 2001. [Google Scholar]
Figure 1. Chemical structures of (a) loratadine, (b) desloratadine, (c) paracetamol, (d) pseudoephedrine, and (e) betamethasone valerate (IS).
Separations 09 00217 g001
Figure 2. Selected surface and contour plots for the interaction effect of factors on certain responses.
Separations 09 00217 g002
Figure 3. Overlay plot of the responses for the interaction of two factors, showing the sweet spot colored in yellow.
Separations 09 00217 g003
Figure 4. Chromatogram for full separation of the analytes using the gradient HPLC method.
Separations 09 00217 g004
Figure 5. Full MS scan (top) and SIM chromatograms (bottom) of each of the analyzed drugs.
Separations 09 00217 g005
Table 1. ANOVA and regression parameters of the fractional factorial design and central composite design (the insignificant interaction effects are not presented).
Screening
ItemR1R2Run Time
Fp ValueFp ValueFp Value
ACN%16.880.0063----
Flow Rate31.40.0014--11.920.0136
pH1259.3˂0.0001196.1<0.000110.50.0177
Temp.------
Adjusted R20.9924 0.9525 0.6978
Optimization
ItemR1R2Run Time
Coefficientp ValueCoefficientp ValueCoefficientp Value
Intercept22.2143 94.6109 156.7841
A-Aceto−0.04370.6886−0.17700.8297−0.76430.0029
B-Flow Rate−1.33370.1476−6.13390.4134−72.6409˂0.0001
C-pH−6.76330.0002−26.23810.3750−26.16820.6546
A20.00060.35260.00240.14650.00340.4067
B20.84640.17383.16580.042622.8906˂0.0001
C20.65350.00112.188˂0.00012.18710.0342
ModelQuadratic0.0041Quadratic0.0018Quadratic˂0.0001
Bold values indicate that the independent factor had a significant effect on the selected response.
Table 2. System suitability parameters of the developed HPLC-PDA method.
DrugParametersC18 Column 150 × 4.6 mm
pseudoephedrineRetention time (min)1.10
NTP *775.00
HETP (µm) **193.55
Resolution ***2.80
Symmetry factor1.10
paracetamolRetention time (min)1.80
NTP2378.00
HETP (µm)63.08
Resolution ***9.20
Symmetry factor1.20
loratadineRetention time (min)3.40
NTP8317.44
HETP (µm)18.03
Resolution ـــــــــــــــ
Symmetry factor1.20
* Number of theoretical plates, ** Height equivalent to theoretical plates and *** Resolution relative to the next peak.
Table 3. Validation parameters and assay of pharmaceutical formulation using the proposed method.
ParameterPseudoephedrineParacetamolLoratadine
Range µg/mL20–10050–1500.5–50
Regression equationy = 0.2541x + 0.1851y = 0.3217x + 0.0351y = 0.1428x + 0.1024
Correlation coefficient (r)0.99990.99980.9998
Accuracy a99.26 ± 0.74100.41 ± 0.968100.58 ± 1.622
Repeatability b99.35 ± 1.26999.18 ± 1.22598.85 ± 1.177
RSD%1.2771.2351.191
Intermediate precision c98.37 ± 1.41799.06 ± 1.83299.36 ± 1.781
RSD%1.4401.0631.792
LOQ (µg/mL)1.01.00.5
LOD (µg/mL)0.330.330.16
Recovery of pharmaceutical preparation d99.25 ± 1.44999.81 ± 1.08599.16 ± 1.532
a: Six concentrations of each analyte covering the range (25, 35, 50, 60, 75, and 95 µg/mL) for pseudoephedrine, (55, 70, 90, 120, 135, and 145 µg/mL) for paracetamol, and (1, 5, 15, 25, 35, and 45 µg/mL) for loratadine; b: Intra-day (n = 3), average of three concentrations (30, 40, and 80 µg/mL) for pseudoephedrine, (60, 100, and 140 µg/mL) for paracetamol, and (2, 20, and 40 µg/mL) for loratadine, repeated 3 times within the same day; c: Inter-day (n = 3), average of three concentrations (30, 40, and 80 µg/mL) for pseudoephedrine, (60, 100, and 140 µg/mL) for paracetamol, and (2, 20, and 40 µg/mL) for loratadine, repeated 3 times over three consecutive days, d: Trimed® Flu tablets labeled as containing 5 mg of loratadine, 500 mg of paracetamol, and 120 mg of pseudoephedrine.
Table 4. Validation parameters of the SPE-HPC-MS method in plasma samples.
ParameterPseudoephedrineParacetamolLoratadineDesloratadine
Plasma
LLQCLQCMQCHQCLLQCLQCMQCHQCLLQCLQCMQCHQCLLQCLQCMQCHQC
0.5 ng/mL1ng/mL100 ng/mL400 ng/mL0.5 ng/mL1 ng/mL100 ng/mL400 ng/mL0.5 ng/mL1 ng/mL100 ng/mL400 ng/mL0.5 ng/mL1 ng/mL100 ng/mL400 ng/mL
Range0.5–500 ng/mL
Repeatability92.57105.4102.8103.599.26110.8103.5102.898.47104.4103.798.71103.895.81102.4105.7
RSD%12.67.156.273.812.489.345.876.881.285.384.772.821.428.675.813.47
Intermediate precision93.72108.3104.2102.698.6996.37102.899.47101.2104.7102.099.4199.71103.3101.699.37
RSD%13.178.274.625.282.815.617.285.221.872.712.643.421.223.842.283.47
Recovery %97.5696.2096.4197.2898.1597.1497.5296.1896.3897.6196.8297.3198.3196.1096.4797.52
Matrix effect98.9899.72101.599.47100.8100.6101.898.9499.6198.2698.68101.7100.399.7198.91101.5
Table 5. Validation parameters of the SPE-HPC-MS method in urine samples.
ParameterPseudoephedrineParacetamolLoratadineDesloratadine
Urine
LLQCLQCMQCHQCLLQCLQCMQCHQCLLQCLQCMQCHQCLLQCLQCMQCHQC
0.5 ng/mL1 ng/mL100 ng/mL400 ng/mL0.5 ng/mL1 ng/mL100 ng/mL400 ng/mL0.5 ng/mL1 ng/mL100 ng/mL400 ng/mL0.5 ng/mL1 ng/mL100 ng/mL400 ng/mL
Range0.5–500 ng/mL
Repeatability105.4101.298.7898.12101.8100.899.72101.8395.4299.67101.8101.494.72101.799.1898.64
RSD%1.231.832.711.991.674.212.171.828.672.631.721.835.612.211.841.33
Intermediate precision101.499.22100.7102.999.67103.999.2898.2793.55102.798.24101.495.19102.6100.7105.3
RSD%2.412.621.822.434.112.823.231.4710.282.881.711.6211.782.161.271.82
Recovery %102.399.4099.1798.83101.699.4298.6899.71103.398.6799.8199.4897.3898.4699.3398.86
Matrix effect99.1899.81100.5101.899.62101.6100.899.18101.299.80101.5101.799.71102.499.67101.5
Table 6. Stability of the analytes in different conditions.
DrugPseudoephedrineParacetamolLoratadineDesloratadine
MatrixPlasmaUrinePlasmaUrinePlasmaUrinePlasmaUrine
Conc.LQCHQCLQCHQCLQCHQCLQCHQCLQCHQCLQCHQCLQCHQCLQCHQC
1 ng/mL400 ng/mL1 ng/mL400 ng/mL1 ng/mL400 ng/mL1 ng/mL400 ng/mL1 ng/mL400 ng/mL1 ng/mL400 ng/mL1 ng/mL400 ng/mL1 ng/mL400 ng/mL
Bench-Top (Mean Recovery % ± RSD)98.6297.5197.64101.399.38102.5102.7100.497.38101.896.48100.7102.698.3696.38102.4
1.211.861.171.830.821.631.470.921.631.210.870.631.291.481.390.83
Long Term (Mean Recovery % ± RSD)96.6697.58102.5100.5102.999.62101.798.6798.38102.7101.599.57100.9101.5101.599.64
1.531.681.341.821.671.391.271.561.921.860.861.530.730.531.460.93
Stock Solution (Mean Recovery % ± RSD)102.6101.897.58101.7100.7102.899.81101.3103.498.61100.8102.498.7599.41101.7102.2
0.831.281.620.961.380.831.630.860.721.471.530.881.621.821.691.45
Autosampler (Mean Recovery % ± RSD)100.699.6799.42101.2100.6101.299.8999.36100.6101.398.9499.87100.5101.2100.699.45
1.531.291.271.831.561.481.370.860.911.151.381.291.990.820.631.18
Freeze–Thaw (Mean Recovery % ± RSD)102.497.3896.48102.4101.897.6899.38101.5102.596.38101.9102.6102.897.53101.796.43
1.831.922.011.561.382.121.561.781.832.131.581.631.472.151.661.89
Table 7. Statistical comparison of the results obtained using the proposed method and the reported method for the analysis of the analytes in bulk powder.
ColumnDrugMeanS.DNVarianceStudent’s t Test (2.23) aF Test (5.05) a
C-18pseudoephedrine99.260.74060.5480.0333.078
paracetamol100.410.96860.9371.0731.963
loratadine100.581.62262.6310.0811.461
Reported Method *pseudoephedrine99.241.29961.687 ــــــــــــــــــ ــــــــــــــــــ
paracetamol99.681.35661.839 ــــــــــــــــــ ــــــــــــــــــ
loratadine100.511.34261.801 ــــــــــــــــــ ــــــــــــــــــ
a The values in parenthesis are the corresponding theoretical values of t and F at p = 0.05; * Reported method [6], the proposed chromatographic method was developed using HPTLC aluminum plates precoated with silica gel 60 F254 using acetone–hexane–ammonia (4:5:0.1, by volume) as a developing system followed by densitometric measurement at 254 nm and 208 nm.
Publisher’s Note: MDPI stays neutral with regard to jurisdictional claims in published maps and institutional affiliations.

