Article

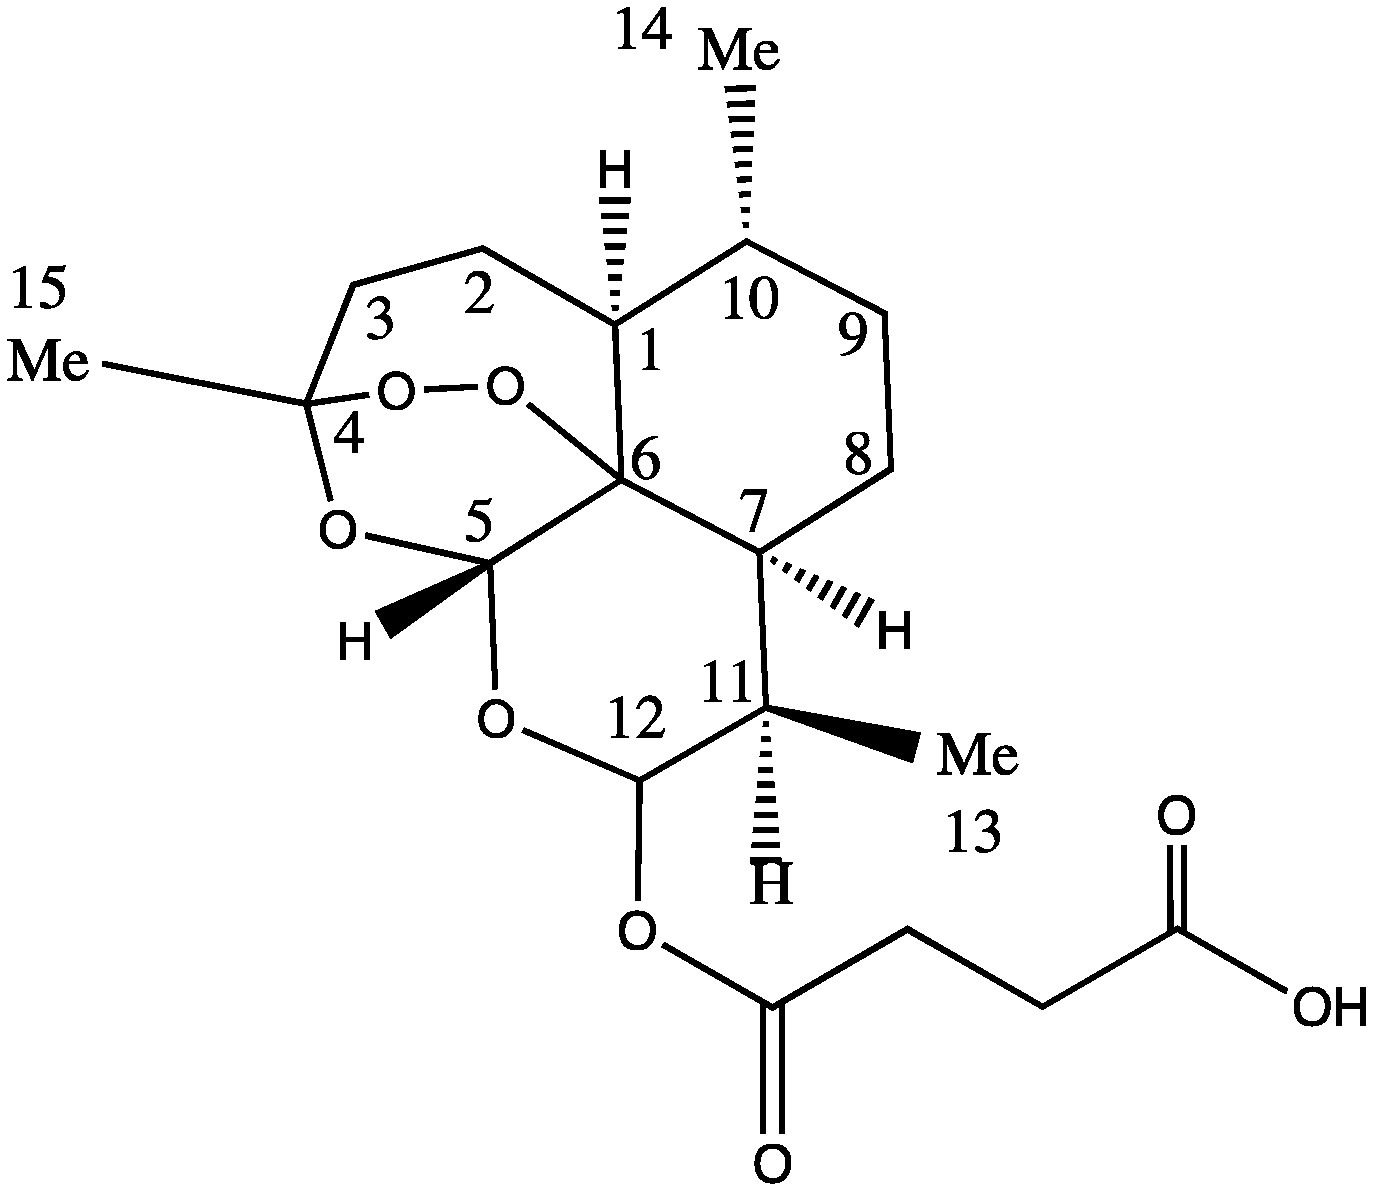
LC-MS/TOF Characterization and Stability Study of Artesunate in Different Solvent Systems

Department of Chemistry and Biochemistry, Rowan University, Glassboro, NJ 08028, USA
*
Author to whom correspondence should be addressed.
Separations 2022, 9(8), 218; https://doi.org/10.3390/separations9080218
Submission received: 13 July 2022 / Revised: 28 July 2022 / Accepted: 1 August 2022 / Published: 13 August 2022

Abstract

:
Artemisinin (ART) is a sesquiterpene lactone and a popular malaria drug used in many parts of the world. Artesunate (ARTS) is a semi-synthetic derivative of ART with improved pharmacokinetic properties. However, the half-life of ARTS is less than an hour in vivo. The analysis of this drug in vitro in different solvent systems using LC-MS/TOF showed a solvent-driven breakdown. ARTS breakdown formed several derivatives, including dihydroartemisinin (DHA), artemether (ARTM) and DHA-dimer among others, at different rates in different solvent composition systems. The change in temperature from room temperature to physiological temperature (37 °C) was found to enhance the rate of the ARTS breakdown. In methanol, ARTS mainly formed ARTM with a chromatographic peak decrease of about 3.13%, while methanol and water (90:10) v/v mainly gave rise to DHA and ARTM with about an 80% chromatographic peak decrease. On the other hand, ARTS in methanol and ammonium acetate (85:15) v/v formed DHA, ARTM, DHA-dimer and other reaction peaks with about a 97% peak decrease and the formation of an orange solution pointing to a molecular re-arrangement reaction. These results have an important bearing on research on the analysis of artemisinin drugs conducted on these common solvents.

1. Introduction

ART derivatives possess a potent antimalarial activity. They are very active against all Plasmodium species and the asexual blood stage of malaria parasites [1,2]. ART is a sesquiterpene lactone derived from the Chinese medicinal plant qinghao, also known as Artemisia annua or sweet wormwood [3]. It is a 1,2,4-trioxane ring system with an internal peroxide bridge [4]. Synthetic and semi-synthetic derivatives of ART include ARTS, which mainly improves the pharmacokinetic limitations of ART. These limitations in ART include poor solubility, low bioavailability and a short half-life [5]. DHA was one of the first semi-synthetic functional derivatives of ART [6]. Other first-generation semi-synthetic derivatives included arteeter and ARTM, which are lipid-soluble, while ARTS is water-soluble [7].
The natural 1,2,4-trioxane pharmacophore in all artemisinins is responsible for the antimalarial activity [8,9]. The dosage is prescribed as a combination therapy to manage infection and to reduce resistance against the ARTs [10,11]. Although the mechanisms of action of these drugs are not well understood, the endo-peroxide bridge is suggested to play a key role in the overall mechanism of action [12,13]. Recent reports suggest that artemisinins possess anticancer properties [14,15]. Cancer drugs are usually toxic to both cancerous cells as well as normal cells. Artemisinins present no significant cytotoxicity to normal cells according to thousands of studies so far from thousands of malaria patients [16]. They were found to be effective against several cancers including throat cancer [17], ovarian cancer [18], breast cancer [19], colon cancer [20] and prostate cancer [21], among other cancer types [22]. In general, ART-derived monomeric molecules in the micro-molar range showed cytotoxicity to cancer cells, with the IC50 values of ART-dimers in cancer cells being much lower than doxorubicin and paclitaxel [23,24]. Preliminary clinical research shows that after two months of treatment with ARTS, the tumor in laryngeal squamous cell carcinoma patients was significantly reduced. Just like ART-derived dimers, hybrid anticancer drugs that are chemically bound together can have more attractive properties than single-molecule anticancer drugs and can cause enhanced cytocidal pharmacological effects as well as provide synergy to inhibit cancer cell growth [25].
The ARTS moiety represents a potentially active pharmacophore showing great promise for the conjugation of other cancer drugs in order to form new novel drugs. The activity of the ARTS molecules is centered around the peroxide bridge; therefore, other sites within the molecule, in particular position twelve on ARTS (Figure 1), are attractive for conjugation with other drugs. Despite being water-soluble, ARTS has a low stability in neutral or acidic pH. Sodium ARTS is known to convert into biologically active metabolite DHA in vivo [26]. Other research reports that after absorption, ARTS rapidly converts to DHA and that DHA is the form that is responsible for antimalarial activity [27,28]. In other research, the onset of hydrolysis of ARTS into DHA was observed 25 min after an intravenous administration [27]. A linear decomposition of ARTS was observed, with only about 31% and 18% of the drug remaining after 18 h of reaction, while the parent compound ARTS and the rest were converted into DHA and other products [29]. The rate of decomposition can be affected by physical parameters such as the temperature and solvent composition.
The temperature can initiate or accelerate the breakdown of pharmaceutical compounds [30]. The temperature affects the rate of drug oxidation or hydrolysis, while the rate of reaction increases proportionally with every 10 °C increase in temperature [31]. For ARTS, a thermal analysis at 100 °C for 39 h produced beta-ARTS, ARTS dimers, 9,10-anhydrodihydroartemisinin (glycal), DHA, beta-formate ester and other smaller reaction products from DHA intermediate and further thermal decomposition [32]. The study of the decomposition of ARTS in different solvent systems can help identify solvents that can delay decomposition during chromatographic analysis. The aim of the current work is to investigate the rate of decomposition of ARTS at room temperature and at a physiological temperature of 37 °C in different solvent systems using LC-/MS/TOF. ARTS decomposition was studied in methanol, methanol and water (90:10 v/v), and methanol and ammonium acetate (85:15 v/v). These are the common solvents used in chromatographic analysis [33,34,35]. The decomposition products as well as the rates of decomposition were compared in three solvent systems. Understanding the nature and rate of decomposition of ARTS is essential to understanding its other potential reactions as well as to tuning methods for its analysis. This work was initiated because a constant frustration during the chromatographic analysis of ARTS revealed very interesting information regarding the mobile phases used in relation to the number and size of chromatographic signals generated.

2. Materials and Methods

2.1. Chemicals and Reagents

ARTS was purchased from Tokyo Chemical Company (TCI). LC-MS-grade methanol, ammonium acetate, acetonitrile and water were purchased from VWR. Other chemicals used for instrument calibration include ESI-L tuning mix and mass reference solutions (ammonium trifluoroacetate, purine, HP-0921), all LC-MS-grade from Agilent Technologies, Santa Clara, CA, USA.

2.2. Chromatographic Procedure

The LC-MS analysis was carried out using an Agilent 6230 series LC-MS/TOF unit. The separation of reaction products was carried out using Agilent Technologies, ZORBAX Eclipse Plus C-18 RRHD column (2.1 × 50 mm) with 1.8 µm diameter stationary phase particles. The mobile phase consisted of methanol and water containing 0.1% formic acid (v/v) 70:30. The chromatographic runs were performed under isocratic conditions at a flow rate of 0.250 mL/min. Every end of the run was followed by a post-run step that included flushing the column with the mobile phase repeatedly. The column temperature was set to 25 °C.

2.3. Mass Spectrometer Procedure

The mass spectrometry for the LC/MS was the TOF 6230 series set to Dual AJS ESI in positive ion mode. The settings of the mass spectrometer were as follows: scan mode (standard), range (200–3000) m/z, threshold (200), nebulizer gas (40.0 psi) and dry gas (8.0 L/min), and dry temperature (325 °C). The compound stability and trap drive level were set to 100%. The MS/MS fragmentation amp was set to 175 V and the skimmer cone to 65 V. The instrument mode was set to high resolution for tuning and calibration.

2.4. Sample Preparation

Several ARTS samples in 5 mL volumetric flasks were dissolved in different solvent compositions including (i) methanol 100%, (ii) methanol with water, 90:10, and (iii) 20 mM ammonium acetate buffer with methanol, 15:85 v/v. The concentration of ARTS in the solutions was maintained at 1.04 × 10⁻² M. For the analysis, 1 mL of the sample mixtures was drawn, filtered, and transferred into individual vials using syringe filters. A comparison was made for solution mixtures left at room temperature versus those incubated at 37 °C. Sample mixtures were incubated at 37 °C at different lengths of time before analysis.
Chromatographic procedures were adjusted to optimize the separation of the elution products. Various mobile phase compositions, flow rates and injection volumes were investigated in order to effectively separate the samples. An isocratic solvent containing a mixture of methanol and water was used as the mobile phase for the LC-MS method. After several trials, 70:30 v/v methanol/water with 0.1% formic acid showed an optimized elution of the reaction products. In this experiment, the incubation temperature was set to 37 °C, and the column temperature was maintained at 25 °C, which was about room temperature. After the optimization of the reaction conditions, each sample was run three times.

3. Results

3.1. ARTS in Methanol

The reaction of ARTS with methanol was monitored by obtaining chromatograms of the ARTS sample dissolved in methanol and then incubated at room temperature and at 37 °C. Figure 2a shows the LC-MS chromatogram obtained. The sample was first analyzed immediately after mixing (at room temperature, ~25 °C) and then analyzed again each day for twenty-one days at 37 °C. On the first day, only one chromatogram peak for ARTS was obtained at 2.1 min retention time. Upon incubating the mixture at 37 °C, other reaction product peaks appeared at about 0.9, 1.2, 1.6, 1.9, 2.8, 3.1, 3.4 and 6.0 min. These new chromatographic reaction product peaks grew with the time of incubation at 37 °C. There was no further increase of chromatographic peaks after 21 days of continuous incubation at 37 °C. The mass spectra of these reaction products are shown on Figure S1. Figure 2b shows a linear plot of the intensity as a function of time. The linear growth of the reaction peaks for DHA and artemether from day 1 to day 21 is shown.
The reaction peaks observed at 1.9 and 6.0 mins corresponded to DHA and ARTM, respectively. The fragmentation pattern from the mass spectra confirmed the presence of DHA and ARTM. The reaction peak of ARTM at 6.0 min was growing rapidly during the incubation period. Based on the peak intensity of ARTS, the initial concentration of the reactant was estimated to be quite high, largely beyond the linear response region. When compared to ARTS, the percentage increases after 21 days of DHA and ARTM were 16.16% and 68.69%, respectively. The increase of ARTM and DHA followed a linear growth with y = 3.4x −6.63 and y = 0.74x −1.44, respectively.
The mass spectra of the reaction products corresponding to Figure 2a are shown in Figure S1. The ARTS molecular ion is 384. Other ions include [M+Na]+, [M+K]+ and [2M+Na]+, corresponding to m/z of 407, 423 and 791, respectively. The new product chromatographic peaks appearing between 0.9 and 6.0 min are shown in Table 1. Table S1 shows the identification of mass fragments of ARTS reaction products in methanol.

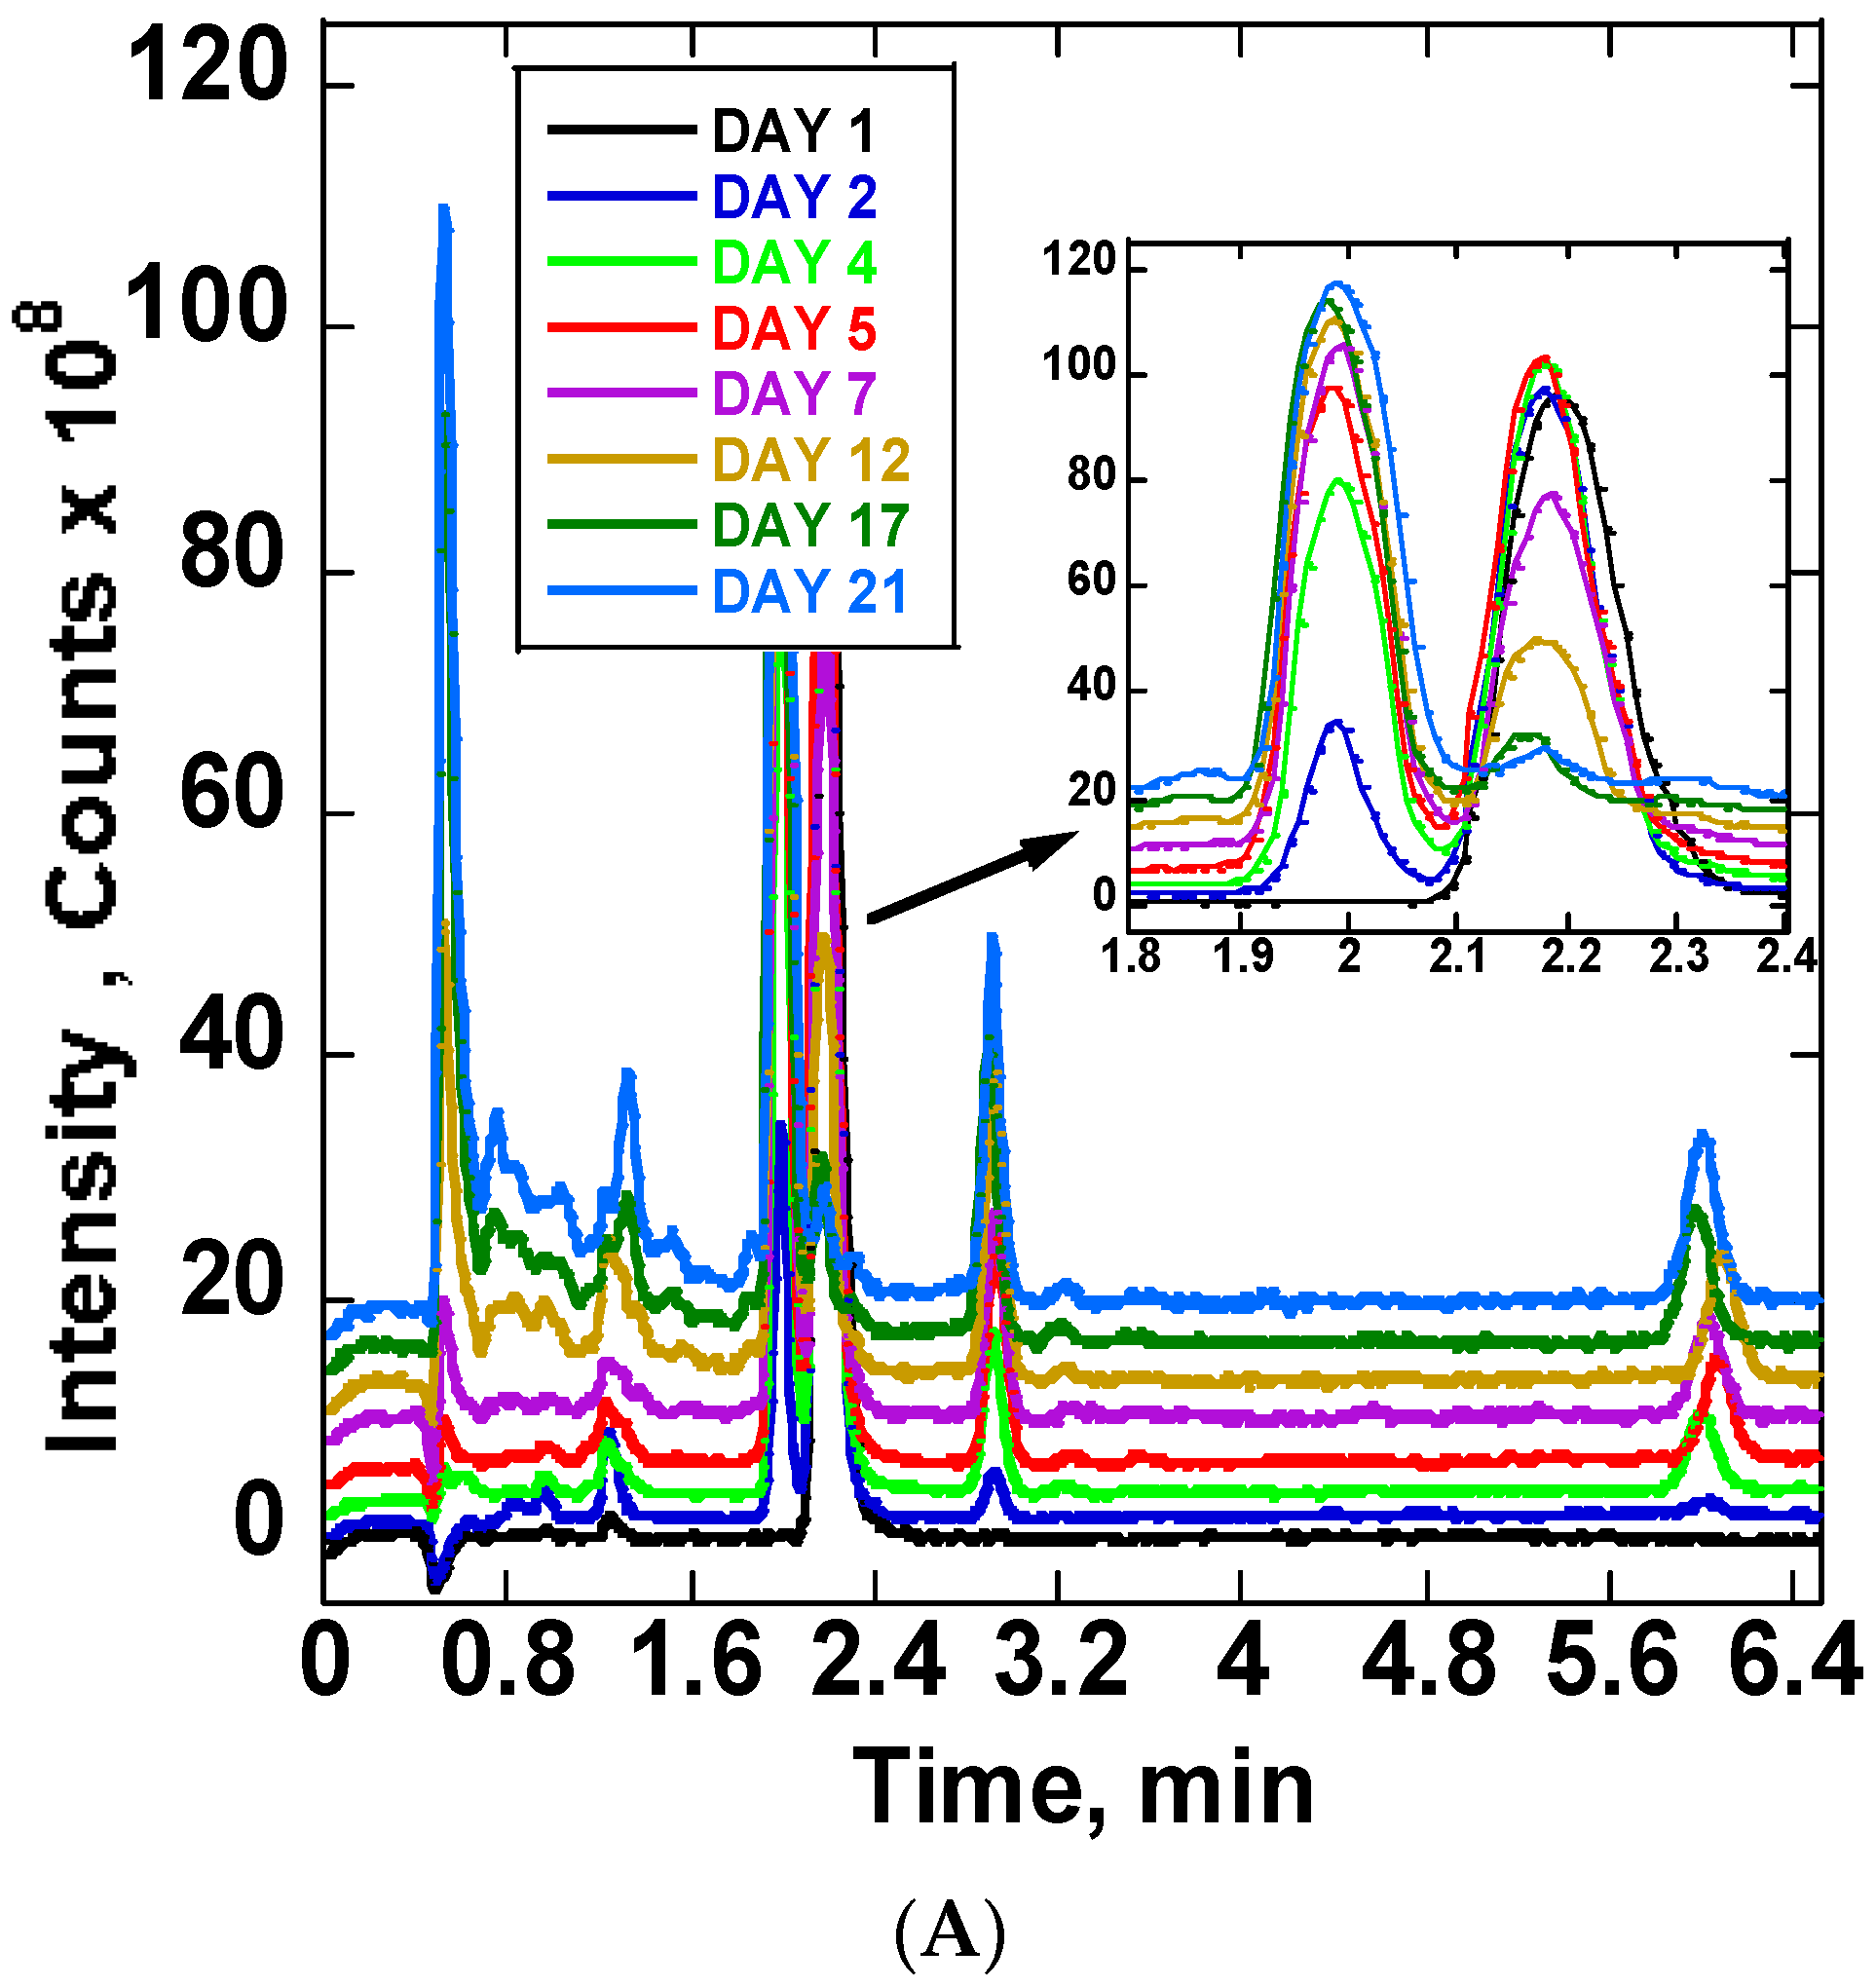
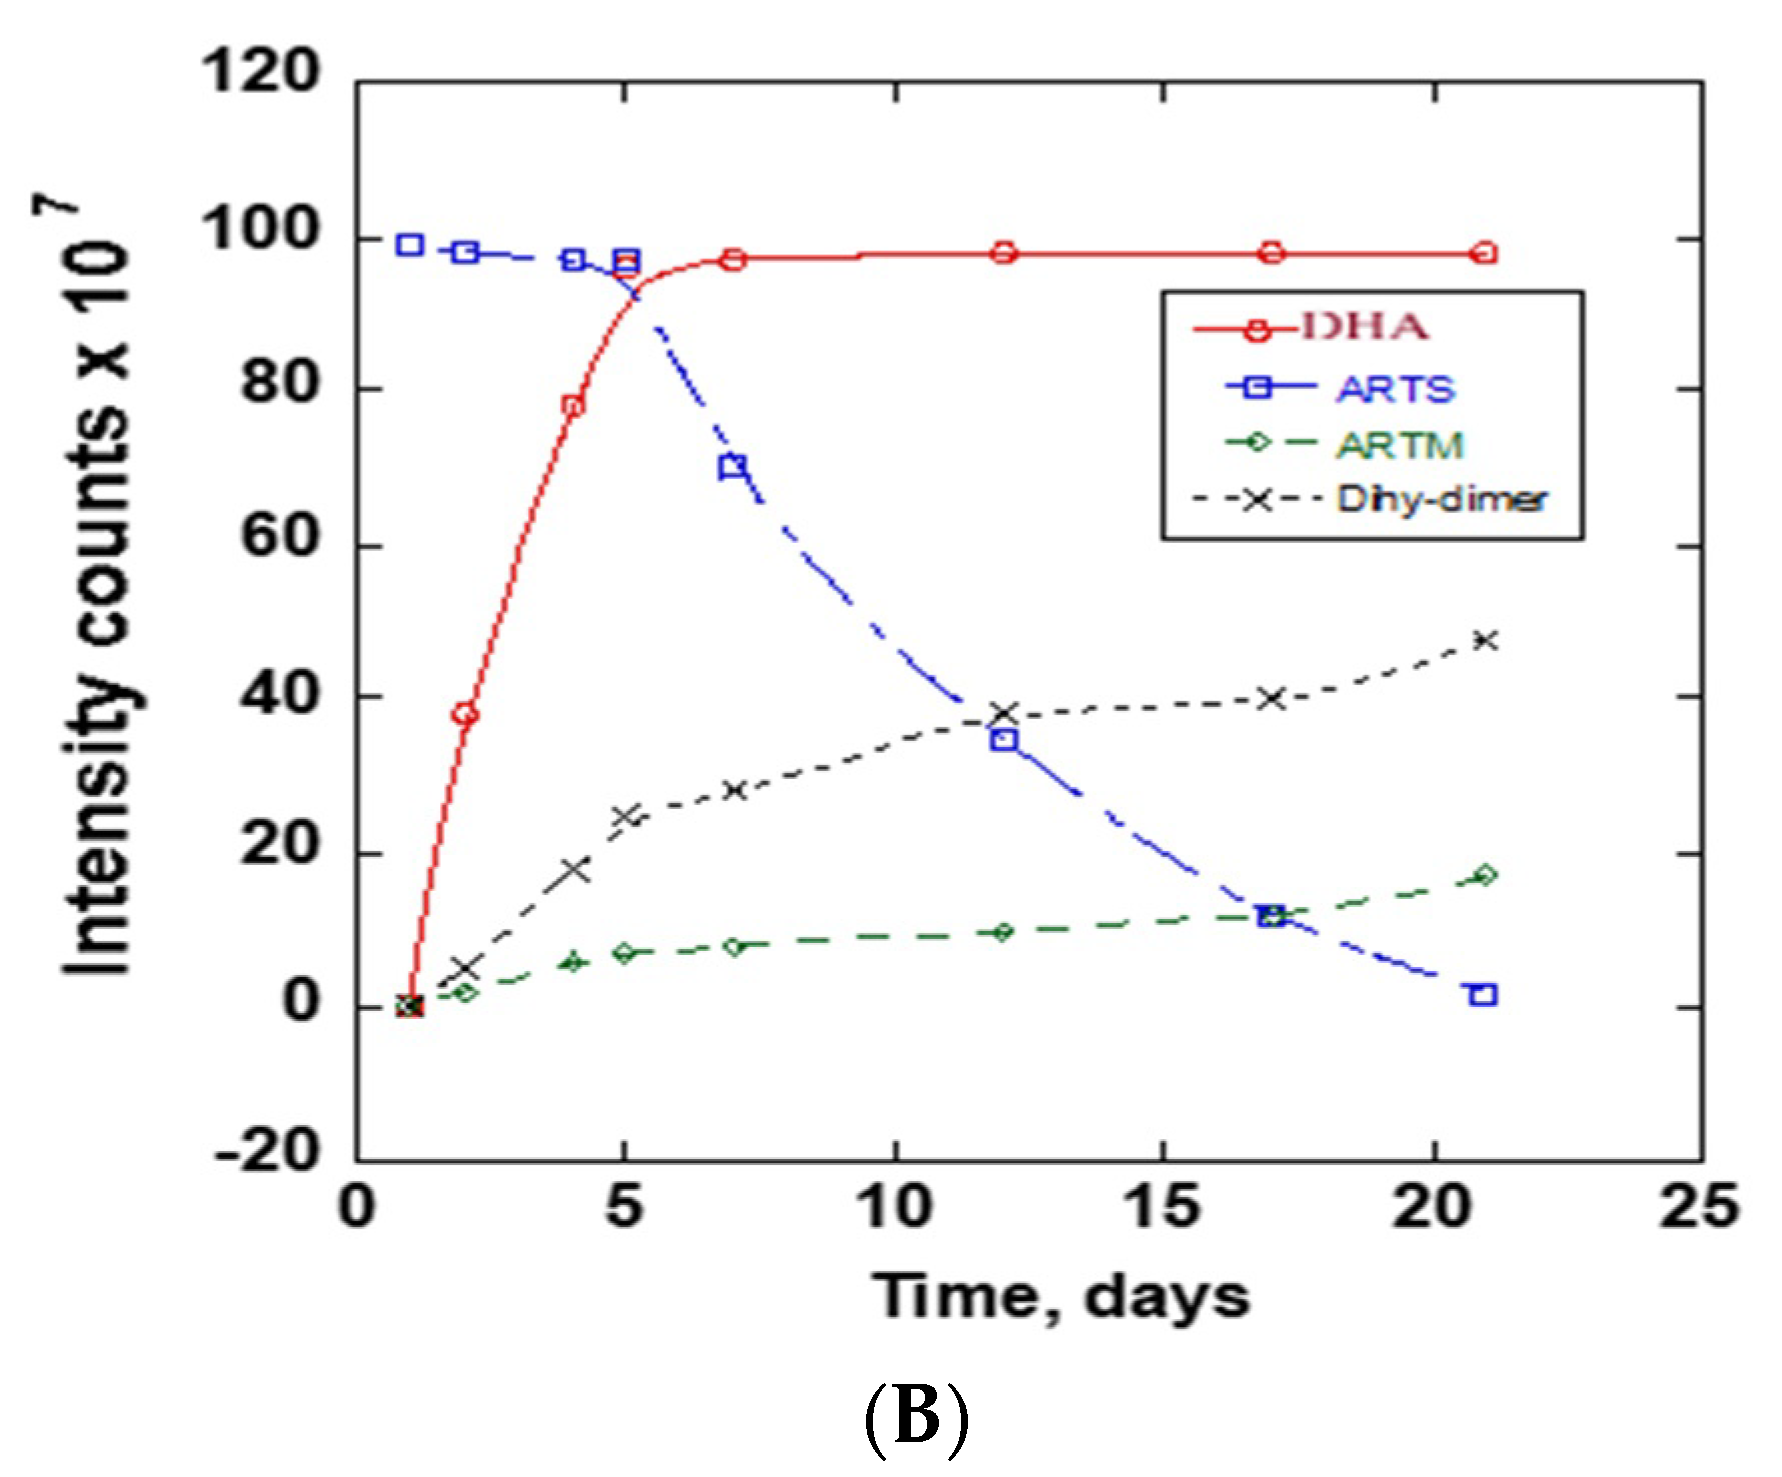
3.2. ARTS in Methanol and Water

The stability of ARTS in methanol/water, 90:10 (v/v), was monitored by collecting chromatograms of the sample at room temperature and at 37 °C. The sample was immediately analyzed after dissolving in the solvent and then again, each day for twenty-one days. Figure 3A–C show the obtained chromatograms. On the first day, only one chromatogram peak for ARTS was obtained at about 2.1 min. Other reaction product peaks appeared at about 0.5, 1.0, 1.6, 1.9, 2.8, 3.2, 3.5 and 6.0 mins upon incubation at 37 °C. These new chromatographic product peaks grew with the time of incubation at 37 °C. There were no changes in the chromatographic peaks after 21 days of continuous monitoring. Further analysis of these reaction products followed, using mass spectra. Figure 3D,E show the growth graph of the reaction peaks. Figure S2 shows the mass spectra of the ARTS reaction peaks.
The ARTS peak at 2.1 min continuously decreased, while the DHA peak at 1.9 min and the ARTM peak at 6.0 min continuously grew. The parent peak of ARTS decreased to about 80% in 21 days. As compared to ARTS, the percentage increases of the DHA, ARTM and DHA dimers were 97%, 100% and 15%, respectively. The DHA increase was almost by the same margin as the reduction of ARTS. Although the initial concentration of ARTS was high, as shown on the plateau region of the detector, it was clear that it led to the formation of other product chromatographic peaks. In this solvent system, DHA and ARTM plateaued after 15 and 17 days, respectively (Figure 3D,E). The decline of the chromatographic peak of ARTS was much slower after 20 days.
The mass spectra of the reaction products corresponding to Figure 3A,B are given in Figure S2. The major fragment ions include [M+Na]+, [M+K]+ and [2M+Na]+, corresponding to m/z of 407, 423 and 791, respectively. The new product chromatographic peaks appearing between 0.5 and 6.0 min are shown in Table 2. Table S2 shows the identification of mass fragments of ARTS reaction products in methanol/water.

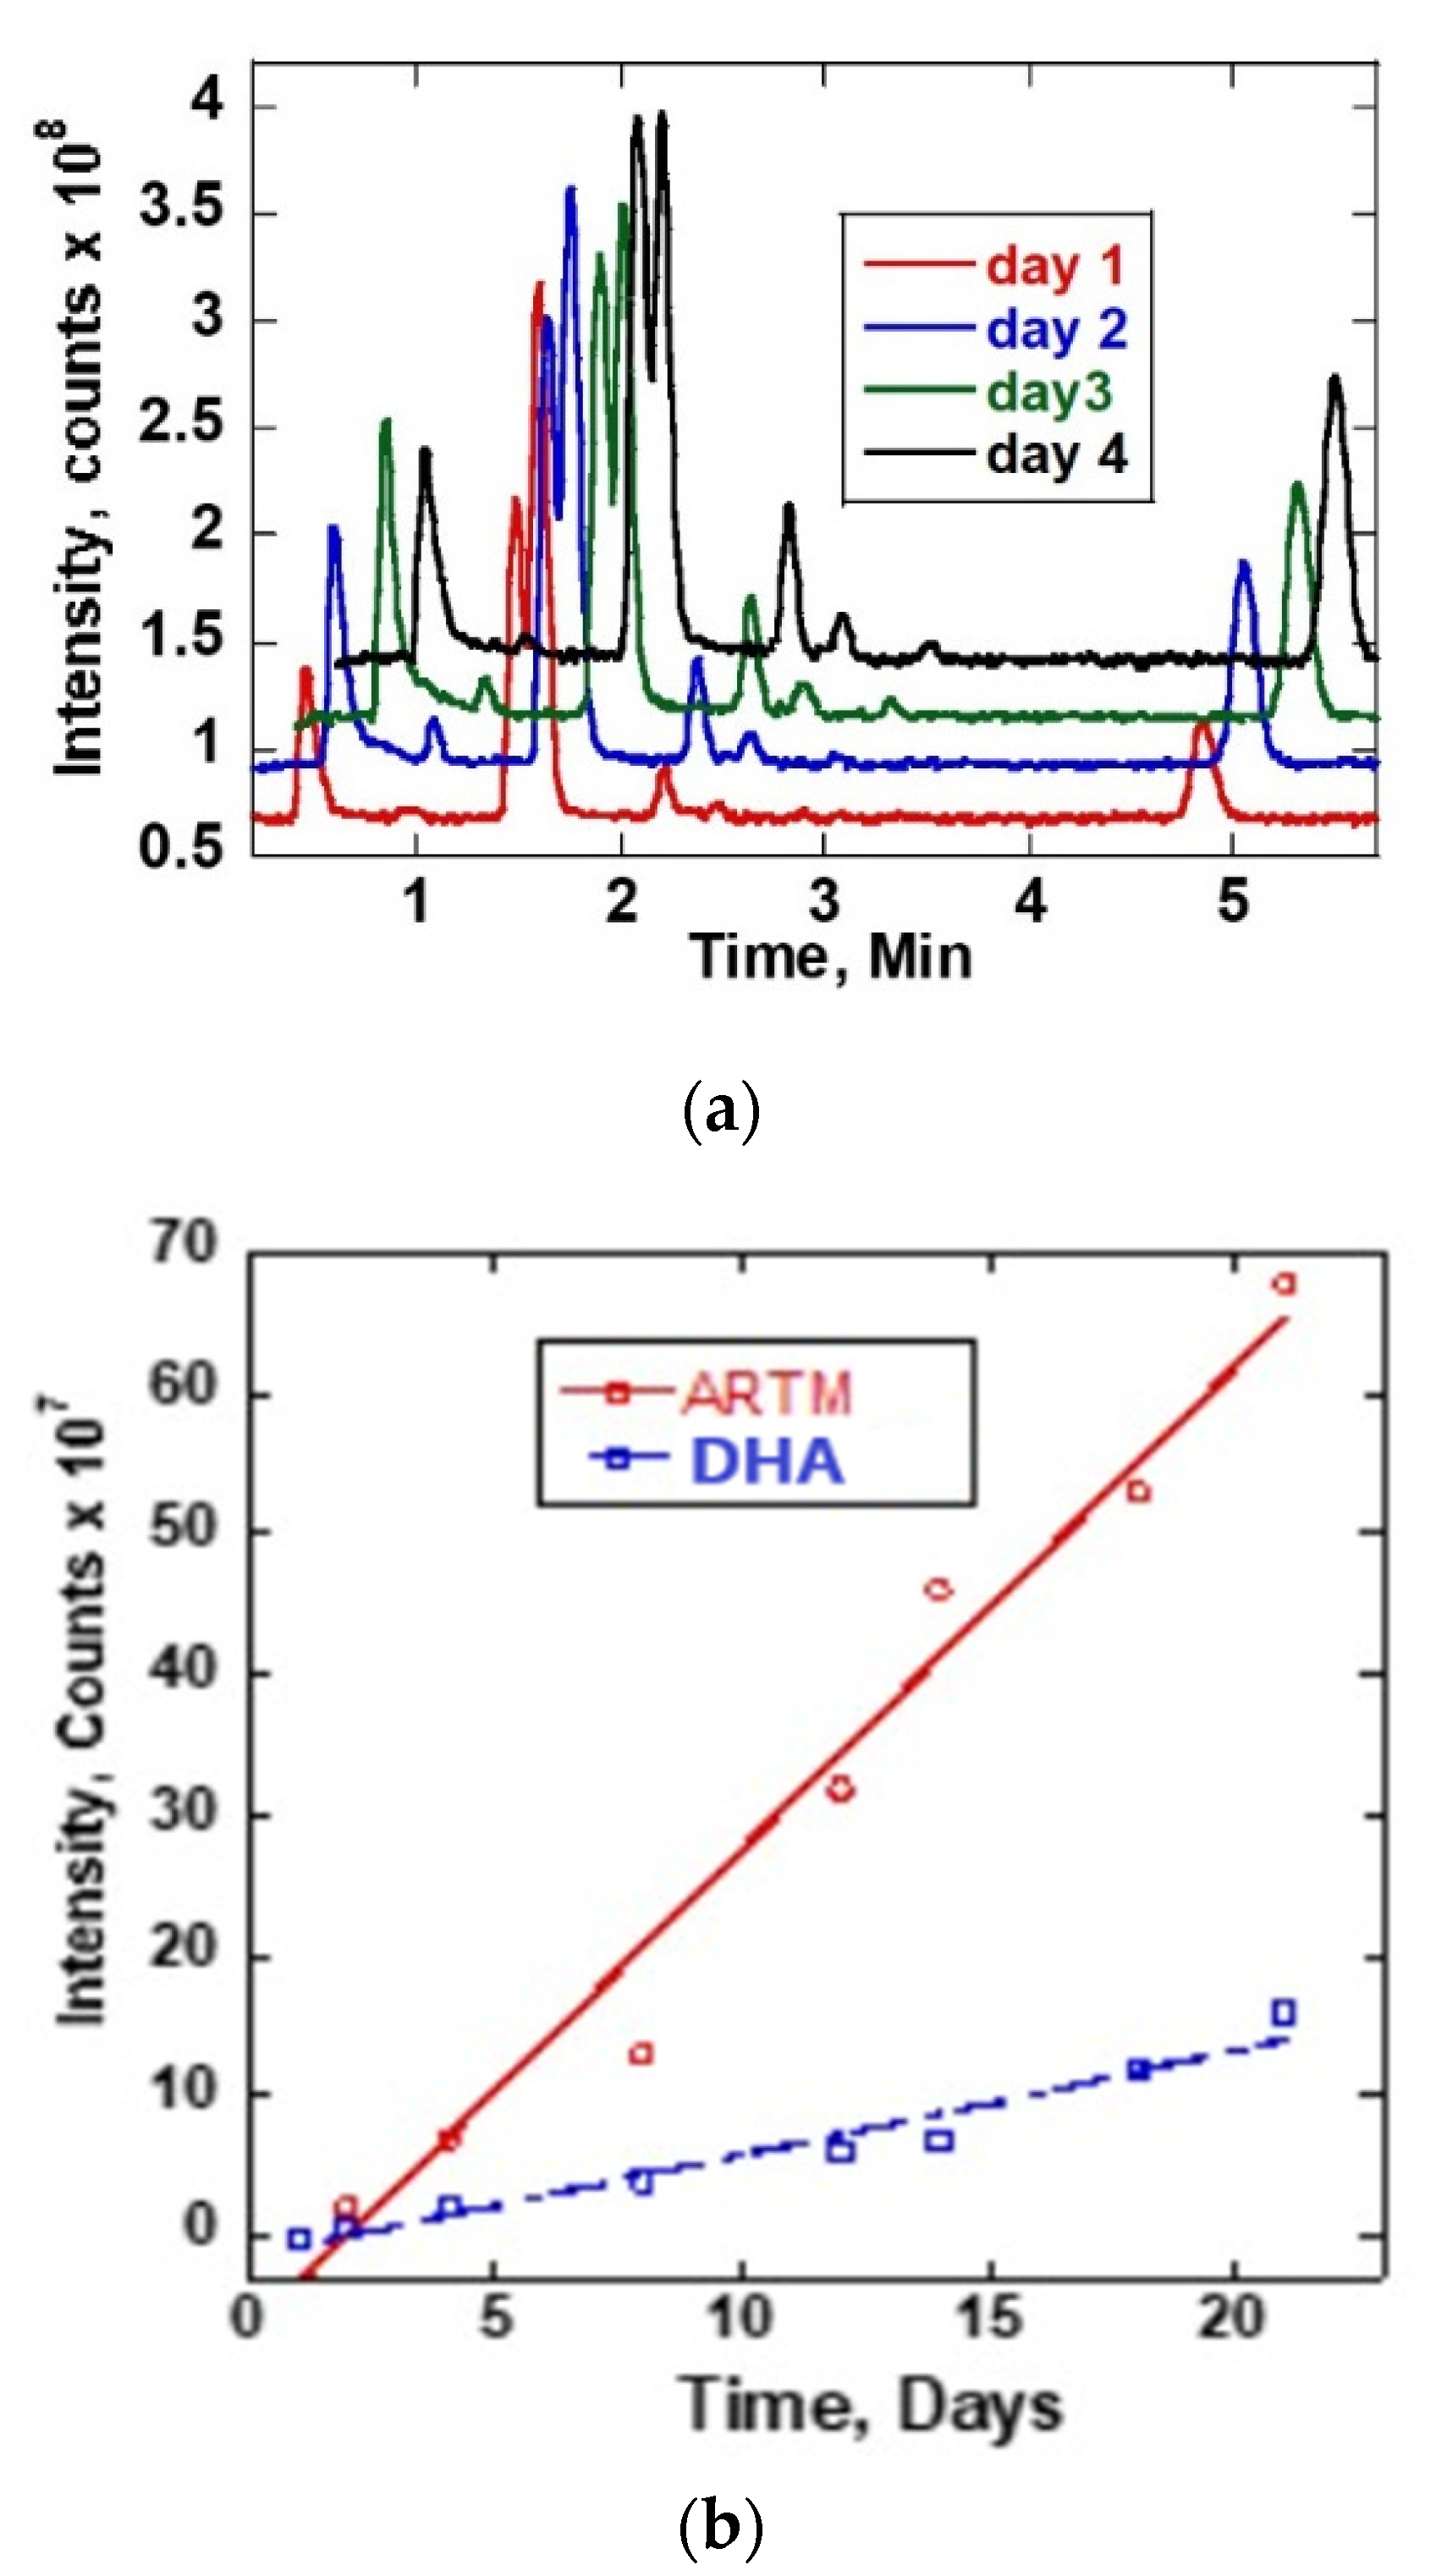
3.3. ARTS in Ammonium Acetate and Methanol

The stability of ARTS in 20 mM ammonium acetate: methanol (15:85) v/v at room temperature and at 37 °C was compared using chromatograms collected at different times. The obtained chromatograms are in Figure 4A. The Figure 4A insert shows the chromatograms between 1.8 and 2.4 min. There was a notable increase of the product peak and decrease of the reactant peak. On the first day, one chromatogram peak for ARTS occurred at 2.1 min retention time. Upon continuous incubation at 37 °C, other reaction product peaks appeared. The main peaks showed up at the following retention times: 0.5, 0.7, 0.8, 0.9, 1.2, 1.3, 1.9, 2.8 and 6.0 mins. The completion of the reaction was observed at day 21 of the continuous incubation at 37 °C, which was indicated by the reduction of the ARTS peak and the color change of the sample from clear to orange. Further analysis of these reaction products followed, using mass spectra. Figure 4B shows peaks’ growth as a function time in days for all of the significant chromatographic peaks. Figure S3 shows the mass spectra of the ARTS reaction peaks.
In this solvent system, we find some similar peaks but with different growth rates. ARTS showed up at its usual retention time at 2.1 min, and the peak intensity decreased, while the DHA peak at 1.9 min and ARTM peak at 6.0 min increased. The main compound formed in this reaction was DHA. A decrease of 97% of ARTS and an increase of about the same amount of DHA show the conversion of ARTS to DHA in this solvent system. When compared to ARTS, the percentage increase of ARTM was about 17.17%, while the percentage increase of the peak of the DHA dimer was 32.32%. Based on the mass spectra obtained, the peak at 2.8 min was assigned to the DHA dimer.
The introduction of ammonia in the solvent system resulted in the formation of a colored compound. The mechanism behind this was speculated to involve nitrogen from ammonia. This ARTS caused a breakdown of the peroxide bond resulting in a more enhanced conjugated molecule and, hence, the colored compound. This reaction was observed to be a function of time, judging from the growing chromatographic product peaks.
The mass spectra of the reaction products corresponding to Figure 4a are given in Figure S3. The ARTS molecular ion is 384. The other ions include [M+Na]+, [M+K]+ and [2M+Na]+, corresponding to m/z of 407, 423 and 791, respectively. The new product chromatographic peaks appearing between 0.5 and 6.0 min are shown in Table 3. Table S3 shows the identification of mass fragments of ARTS reaction products in 20 mM ammonium acetate: methanol.

4. Discussion

Mobile phase buffers and solvents are not supposed to participate in any reaction during drug analysis. However, in this work, solvents played a key role in the decomposition of ARTS. The ARTS molecule degraded and formed several ARTs, including DHA, ARTM and DHA dimers, at different rates in different solvent composition systems. In methanol, ARTS mainly formed ARTM. The methyl group in methanol favors the formation of ARTM from the degradation product of ARTS. The initial reactant peak decreased by about 3.13%. When compared to ARTS, the percentage increases of DHA and ARTM were 16.16% and 68.69%, respectively. Meanwhile, ARTS in methanol and water mainly gave rise to DHA and ARTM. The growths of DHA and ARTM were quite significant in the methanol and water composition, where the initial reactant peak decreased by about 80%. When compared to ARTS, the percentage increases of DHA, ARTM and DHA dimers were 97%, 100% and 15%, respectively. DHA increased by almost the same margin as the reduction of ARTS. On the other hand, ARTS in methanol and ammonium acetate formed DHA, DHA dimer and other reaction peaks. The main compound formed in this reaction was DHA. The initial reactant peak decreased by about 97%. When compared to ARTS, the percentage increases of DHA, ARTM, DHA dimers were 98.98%, 17.17% and 32.32%, respectively. It is clear that the presence of water and ammonium acetate promoted the formation of the DHA dimer. Other studies confirmed that the IC50 values of artemisinin-derived dimers in cancer cells were significantly lower than those of monomeric ones [23,24].
The introduction of ammonium acetate in the solvent system resulted in the formation of a colored compound at 37 °C (Figure 5). The ARTS has a peroxide bond, whereas the other molecule, ammonium acetate, acts as a nitrogen source. The mechanism behind this reaction is speculated to be that the nitrogen from ammonia attacks ARTS and breaks the peroxide bond, which enhances the conjugation reaction that results in the formation of the colored compound. Figure S4 shows the mechanism of conjugation between ARTS and nitrogen in 20 mM ammonium acetate/methanol at 37 °C. The drug molecule ARTS’ color change occurred as a result of conjugation between the drug and ammonia in the solvent at 37 °C. Figure 5A–C show a comparison between the ARTS reaction in methanol, methanol/water and 20 mM ammonium acetate/methanol solvents respectively. A and B show a clear solution while B which was ARTS show an orange color.

5. Conclusions

In this work, we have explored the decomposition of ARTS in different solvent systems, namely in methanol, methanol with water, and methanol, water, and ammonium acetate. In all three solvent systems, ARTS decomposed at different rates into DHA, ARTM and DHA dimers, among major products. There were other products formed and not identified, as their peak intensities were low. The presence of ammonium acetate in the solvent system resulted in the formation of a bright orange solution at five days, a confirmation of conjugation from the breakdown of the endo-peroxide bond. These degradation reactions were only observed when the mixture was incubated at 37 °C. ARTS at 37 °C in methanol with water and ammonium acetate produced DHA at the highest rate compared to the other solvent systems, while the methanol with water system produced ARTM at the highest rate. The study of the ART derivatives at this temperature is key to understanding the drug activity in vivo as well as to altering the methods that are used to analyze the derivatives.

Supplementary Materials

The following supporting information can be downloaded at: https://www.mdpi.com/article/10.3390/separations9080218/s1, Figure S1: Mass spectrum of ARTS reaction products in methanol at 0.9 min (A), 1.2 min (B), 1.6 min (C), 1.9 min (D), 2.1 min (E), 2.8 min (F), 3.1 min (G), 3.4 min (H) and 6.0 min (I). Figure S2: Mass spectrum of ARTS reaction products in methanol/water at 0.5 min (A), 1.0 min (B), 1.6 min (C), 1.9 min (D), 2.8 min (E), 3.2 min (F), 3.5 min (G) and 6.0 min (H). Figure S3: Mass spectrum of ARTS reaction products in 20 mM ammonium acetate: methanol at 0.5 min (A), 0.7 min (B), 0.8 min (C), 0.9 min (D), 1.2 min (E), 1.3 min (F), 1.9 min (G), 2.8 min (H) and 6.0 min (I). Figure S4: Mechanism of conjugation between ARTS and nitrogen in 20 mM ammonium acetate/methanol at 37 °C. Table S1: Identification of mass fragments of artesunate reaction products in methanol. Table S2: Identification of mass fragments of artesunate reaction products in methanol: water. Table S3: Identification of mass fragments of artesunate reaction products in 20 mM Ammonium Acetate: methanol.

Author Contributions

Conceptualization, methodology, validation was done by A.M. Formal analysis, investigation, data curation, writing—original draft preparation, was done by K.O. Review and editing, visualization, supervision, and project administration was done by A.M. All authors have read and agreed to the published version of the manuscript.

Funding

This research received no external funding.

Informed Consent Statement

Not applicable.

Data Availability Statement

Data are available upon request from the corresponding author.

Acknowledgments

The authors would like to acknowledge Rowan University for the Research Fellowship provided as well the departmental facilities that enabled this work.

Conflicts of Interest

The authors declare no conflict of interest.

References

  1. Tilley, L.; Straimer, J.; Gnädig, N.F.; Ralph, S.A.; Fidock, D.A. Artemisinin Action and Resistance in Plasmodium falciparum. Trends Parasitol. 2016, 32, 682–696. [Google Scholar] [CrossRef]
  2. Pukrittayakamee, S.; Chotivanich, K.; Chantra, A.; Clemens, R.; Looareesuwan, S.; White, N.J. Activities of Artesunate and Primaquine against Asexual- and Sexual-Stage Parasites in Falciparum Malaria. Antimicrob. Agents Chemother. 2004, 48, 1329–1334. [Google Scholar] [CrossRef] [PubMed]
  3. Graziose, R.; Lila, M.A.; Raskin, I. Merging traditional Chinese medicine with modern drug discovery technologies to find novel drugs and functional foods. Curr. Drug Discov. Technol. 2010, 7, 2–12. [Google Scholar] [CrossRef] [PubMed]
  4. Ivanescu, B.; Miron, A.; Corciova, A. Sesquiterpene Lactones from Artemisia Genus: Biological Activities and Methods of Analysis. J. Anal. Methods Chem. 2015, 2015, 247685. [Google Scholar] [CrossRef] [PubMed]
  5. Rudrapal, M.; Chetia, D. Endoperoxide antimalarials: Development, structural diversity and pharmacodynamic aspects with reference to 1,2,4-trioxane-based structural scaffold. Drug Des. Dev. Ther. 2016, 10, 3575–3590. [Google Scholar] [CrossRef]
  6. Tu, Y. The Discovery and Development of Artemisinins and Antimalarial Agents; Academic Press: Cambridge, MA, USA, 2017; Volume 9. [Google Scholar]
  7. Meshnick, S.R.; Taylor, T.E.; Kamchonwongpaisan, S. Artemisinin and the Antimalarial Endoperoxides: From Herbal Remedy to Targeted Chemotherapy. Microbiol. Rev. 1996, 60, 301–315. [Google Scholar] [CrossRef] [PubMed]
  8. Hooft van Huijsduijnen, R.; Guy, R.K.; Chibale, K.; Haynes, R.K.; Peitz, I.; Kelter, G.; Phillips, M.A.; Vennerstrom, J.L.; Yuthavong, Y.; Wells, T.N. Anticancer properties of distinct antimalarial drug classes. PLoS ONE 2013, 8, e82962. [Google Scholar] [CrossRef]
  9. Rudrapal, M.; Chetia, D.; Singh, V. Novel series of 1,2,4- trioxane derivatives as antimalarial agents. J. Enzym. Inhib. Med. Chemistry. 2017, 32, 1159–1173. [Google Scholar] [CrossRef]
  10. Ștefan, I. Combination therapy-a way to forestall artemisinin resistance and optimize uncomplicated malaria treatment. J. Med. Life 2015, 8, 326–328. [Google Scholar]
  11. Nosten, F.; White, N.J. Artemisinin-based combination treatment of falciparum malaria. Am. J. Trop. Med. Hyg. 2007, 77, 181–192. [Google Scholar] [CrossRef]
  12. Cui, L.; Su, X.Z. Discovery, mechanisms of action and combination therapy of artemisinin. Expert Rev. Anti-Infect. Ther. 2009, 7, 999–1013. [Google Scholar] [CrossRef] [PubMed]
  13. Wang, J.; Huang, L.; Li, J.; Fan, Q.; Long, Y.; Li, Y.; Zhou, B. Artemisinin directly targets malarial mitochondria through its specific mitochondrial activation. PLoS ONE 2010, 5, e9582. [Google Scholar] [CrossRef] [PubMed]
  14. Chen, X.; He, L.-Y.; Lai, S.; He, Y. Dihydroartemisinin inhibits the migration of esophageal cancer cells by inducing autophagy. Oncol. Lett. 2020, 20, 1. [Google Scholar] [CrossRef]
  15. Augustin, Y.; Staines, H.M.; Krishna, S. Artemisinins as a novel anti-cancer therapy: Targeting a global cancer pandemic through drug repurposing. Pharmacol. Ther. 2020, 216, 107706. [Google Scholar] [CrossRef]
  16. Adjuik, M.; Babiker, A.; Garner, P.; Olliaro, P.; Taylor, W.; White, N. International Artemisinin Study Group. Artesunate combinations for treatment of malaria: Meta-analysis. Lancet 2004, 363, 9–17. [Google Scholar] [PubMed]
  17. Wang, T.; Wang, J.; Ren, W.; Liu, Z.-L.; Cheng, Y.-F.; Zhang, X.-M. Combination treatment with artemisinin and oxaliplatin inhibits tumorigenesis in esophageal cancer EC109 cell through Wnt/β-catenin signaling pathway. Thorac. Cancer 2020, 11, 2316–2324. [Google Scholar] [CrossRef] [PubMed]
  18. Li, X.; Ba, Q.; Liu, Y.; Yue, Q.; Chen, P.; Li, J.; Zhang, H.; Ying, H.; Ding, Q.; Song, H.; et al. Dihydroartemisinin selectively inhibits PDGFRα-positive ovarian cancer growth and metastasis through inducing degradation of PDGFRα protein. Cell Discov. 2017, 3, 17042. [Google Scholar] [CrossRef] [PubMed]
  19. Feng, M.-X.; Hong, J.-X.; Wang, Q.; Fan, Y.-Y.; Yuan, C.-T.; Lei, X.-H.; Zhu, M.; Qin, A.; Chen, H.-X.; Hong, D. Dihydroartemisinin prevents breast cancer-induced osteolysis via inhibiting both breast caner cells and osteoclasts. Sci. Rep. 2016, 6, 19074. [Google Scholar] [CrossRef]
  20. Zhou, X.; Zijlstra, S.N.; Soto-Gamez, A.; Setroikromo, R.; Quax, W.J. Artemisinin Derivatives Stimulate DR5-Specific TRAIL-Induced Apoptosis by Regulating Wildtype P53. Cancers 2020, 12, 2514. [Google Scholar] [CrossRef]
  21. Zhang, C.; Fortin, P.-Y.; Barnoin, G.; Qin, X.; Wang, X.; Fernandez Alvarez, A.; Bijani, C.; Maddelein, M.-L.; Hemmert, C.; Cuvillier, O.; et al. An Artemisinin-Derivative–(NHC)Gold(I) Hybrid with Enhanced Cytotoxicity through Inhibition of NRF2 Transcriptional Activity. Angew. Chem. Int. Ed. 2020, 59, 12062–12068. [Google Scholar] [CrossRef]
  22. Zhang, Y.; Xu, G.; Zhang, S.; Wang, D.; Saravana Prabha, P.; Zuo, Z. Antitumor Research on Artemisinin and Its Bioactive Derivatives. Nat. Prod. Bioprospecting 2018, 8, 303–319. [Google Scholar] [CrossRef] [PubMed]
  23. Reiter, C.; Fröhlich, T.; Gruber, L.; Hutterer, C.; Marschall, M.; Voigtländer, C.; Friedrich, O.; Kappes, B.; Efferth, T.; Tsogoeva, S.B. Highly potent artemisinin-derived dimers and trimers: Synthesis and evaluation of their antimalarial, antileukemia and antiviral activities. Bioorganic Med. Chem. 2015, 23, 5452–5458. [Google Scholar] [CrossRef] [PubMed]
  24. Slade, D.; Galal, A.M.; Gul, W.; Radwan, M.M.; Ahmed, S.A.; Khan, S.I.; Tekwani, B.L.; Jacob, M.R.; Ross, S.A.; El Sohly, M.A. Antiprotozoal, anticancer and antimicrobial activities of dihydroartemisinin acetal dimers and monomers. Bioorganic Med. Chem. 2009, 17, 7949–7957. [Google Scholar] [CrossRef] [PubMed]
  25. Fortin, S.; Bérubé, G. Advances in the development of hybrid anticancer drugs. Expert Opin. Drug Discov. 2013, 8, 1029–1047. [Google Scholar] [CrossRef] [PubMed]
  26. White, N.J. Malaria. In Antibiotic and Chemotherapy; Finch, R.G., Greenwood, D., Norrby, S.R., Whitley, R.J., Eds.; W.B. Saunders: London, UK, 2010; pp. 809–822. [Google Scholar]
  27. Morris, C.A.; Duparc, S.; Borghini-Fuhrer, I.; Jung, D.; Shin, C.S.; Fleckenstein, L. Review of the clinical pharmacokinetics of artesunate and its active metabolite dihydroartemisinin following intravenous, intramuscular, oral or rectal administration. Malar. J. 2011, 10, 263. [Google Scholar] [CrossRef] [PubMed]
  28. Woodrow, C.J.; Haynes, R.K.; Krishna, S. Artemisinins. Postgrad. Med. J. 2005, 81, 71–78. [Google Scholar] [CrossRef]
  29. Parapini, S.; Olliaro, P.; Navaratnam, V.; Taramelli, D.; Basilico, N. Stability of the antimalarial drug dihydroartemisinin under physiologically relevant conditions: Implications for clinical treatment and pharmacokinetic and in vitro assays. Antimicrob. Agents Chemother. 2015, 59, 4046–4052. [Google Scholar] [CrossRef]
  30. Armenian, P.; Campagne, D.; Stroh, G.; Ives Tallman, C.; Zeng, W.Z.; Lin, T.; Gerona, R.R. Hot and Cold Drugs: National Park Service Medication Stability at the Extremes of Temperature. Prehospital Emerg. Care 2017, 21, 378–385. [Google Scholar] [CrossRef]
  31. Crichton, B. Keep in a cool place: Exposure of medicines to high temperatures in general practice during a British heatwave. J. R. Soc. Med. 2004, 97, 328–329. [Google Scholar] [CrossRef]
  32. Haynes, R.K.; Chan, H.W.; Lung, C.M.; Ng, N.C.; Wong, H.N.; Shek, L.Y.; Williams, I.D.; Cartwright, A.; Gomes, M.F. Artesunate and Dihydroartemisinin (DHA): Unusual Decomposition Products Formed under Mild Conditions and Comments on the Fitness of DHA as an Antimalarial Drug. ChemMedChem 2007, 2, 1448–1463. [Google Scholar] [CrossRef]
  33. Penna, E.A.; de Souza, J.C.Q.; de Oliveira, M.A.L.; Chellini, P.R. Determination of antimalarial drugs in pharmaceutical formulations and human blood by liquid chromatography: A review. Anal. Methods 2021, 13, 4557–4584. [Google Scholar] [CrossRef] [PubMed]
  34. Saeed, M.A.; Ansari, M.T.; Ch, B.A.; Zaman, M. RP-HPLC method for the determination and quantification of artesunate. J. Chromatogr. Sci. 2020, 58, 695–699. [Google Scholar] [CrossRef] [PubMed]
  35. Chutvirasakul, B.; Joseph, J.F.; Parr, M.K.; Suntornsuk, L. Development and applications of liquid chromatography-mass spectrometry for simultaneous analysis of anti-malarial drugs in pharmaceutical formulations. J. Pharm. Biomed. Anal. 2021, 195, 113855. [Google Scholar] [CrossRef] [PubMed]
Figure 1. Chemical structure of ARTS.
Separations 09 00218 g001
Figure 2. (a) TIC chromatograms of ARTS in methanol for different time durations and at 37 °C. (b) Plot of intensity as a function of time of DHA and ARTM reaction peaks.
Separations 09 00218 g002
Figure 3. (A) TIC chromatograms of ARTS reaction in methanol/water (90:10) monitored as a function of time (days). (B) Zoomed-in TIC chromatograms at 1.8 to 2.4 min. (C) Zoomed-in TIC chromatograms at 2.4 to 4.0 min. (D) Peak intensities as a function of time of DHA and ARTS. (E) Peak intensities as a function of time.
Separations 09 00218 g003
Figure 4. (A) Daily TIC chromatograms of ARTS reaction in 20 mM ammonium acetate: methanol obtained at room temperature and at 37 °C. (B) Peak intensity as a function of time (days) for chromatographic peaks representing DHA, ARTS, ARTM and DHA dimers.
Separations 09 00218 g004aSeparations 09 00218 g004b
Figure 5. Artesunate reaction in (A) methanol Clear solution), (B) methanol:water (clear solution) and (C) 20 mM ammonium acetate: methanol (orange solution).
Separations 09 00218 g005
Table 1. Retention time and fragmentation patterns of ARTS reaction products in methanol.
Retention TimeMain Fragments (m/z)
0.9407
1.2407, 791
1.6221, 307
1.9261, 307, and 591
2.8261, 267, 285, 307, 321, 329, 341, 385, and 591
3.1221, 267, 275, 321, 329, 421, 458, and 619
3.4221, 249, 267, 285, 289, 311, 329, 341, and 385
6.0221, 249, 267, 275, 281, 321, and 619
Table 2. Retention time and fragmentation patterns of ARTS reaction products in methanol: water.
Retention TimeMain Fragments (m/z)
0.5203, 217, 252, 261, 275, and 305
1.0203, 217, 221, 261, 293, 305, and 321
1.6203, 217, 221, and 307
1.9221, 249, 261, 267, 307, 323, and 591
2.8203, 217, 221, 249, 261, 267, 307, 323, and 591
3.2203, 217, 221, 267, 321, 421, and 619
3.5203, 217, 221, 249, 261, 289, 305, 311, and 351
6.0221, 249, 267, 275, 321, 337, and 619
Table 3. Retention time and fragmentation patterns of ARTS reaction products in 20 mM ammonium acetate: methanol.
Retention TimeMain Fragments (m/z)
0.5218, 230, 232, 245, 248, 260, 276, and 308
0.7232, 236, and 265
0.8206, 262, 307, and 329
0.9248, 267, 291, 307, 329, 341, 369, 385, 407, and 467.
1.3214, 246, and 307
1.9221, 261, 307, 591, and 573
2.8261, 307, and 591
6.0221, 275, 321, and 619
Publisher’s Note: MDPI stays neutral with regard to jurisdictional claims in published maps and institutional affiliations.

