Abstract
The essential oils and polysaccharides from guava leaves have important functions. In the process of microwave extraction of plant essential oils and polysaccharides, pretreatment with lithium salts solution is helpful to increase the extraction rate. The experiment was conducted using a single factor method. Results were optimized by principal component analysis and response surface optimization. The optimal conditions were: LiCl dosage 45 μmol, microwave time 40 min, liquid-solid ratio 10, homogenization time 4.2 min, liquid-material ratio 10, and microwave irradiation power 700 W. The highest yield of essential oil and polysaccharide were 10.27 ± 0.58 mL/kg dry weight (DW) and 50.31 ± 1.88 g/kg·DW, respectively. Three verification experiments showed that the extraction rate of the microwave method was higher than that of the traditional heating method. In addition, the bacteriostatic zones reached the maximum 23.7 ± 0.11 mm when the concentration was 40 μL/mL, and the above results have practical significance.
1. Introduction
In the process of separating natural products from plants, enzymolysis-assisted extraction is a good substitute for traditional extraction methods [1], however, the limitation of enzymolysis is that the specificity of the enzyme is a disadvantage, and the actual production cost of the enzyme is expensive [2].
Metal salt (metal ion) solutions are often added during extraction to increase the extraction rate of plant functional components. It has been reported that microwave heating of metal salt solutions can effectively absorb and transfer energy [3]. Metal salt solutions of different concentrations are composed of organic and inorganic ions [4]. Metal salts have attracted attention due to their excellent physical and chemical parameters [5]. At the same time, essential oils (EOs) are widely used in the separation of natural functional components, and the extraction technology of polysaccharide compounds [6] and EO compounds [7] in plant cell walls. EOs are a combination of volatile compounds existing in plant leaf cells. Polysaccharides are the molecules that constitute cellulose and hemicellulose [8] and are also the internal skeleton of plant raw materials [9]. Previous research experiments by Khursheed et al. showed that metal salt solutions have been successfully used to dissolve cellulose [10]. Therefore, we speculate that it is feasible to use lithium salt solution as a substitute for traditional enzyme-assisted extraction. In the pretreatment process, the lithium salts solution can effectively destroy the part of the plant cell wall and release more active ingredients, which helps to improve the yield of active ingredients in the extraction process.
Guava (Psidium guajava L.) is a plant of the Myrtaceae (Rhodomyrtus tomentosa) family [11], which is native to the Mexican region of North America and has strong adaptability to climate conditions, especially in dry environments [12]. Guava leaves are elliptical or oval, 50–120 mm long, and 30–50 mm wide. The leaves are rich in functional components. Guava is an edible fruit whose leaf is widely used in tea and drinks [13] and is also recognized as a high-quality medical material in the world, which is now widely cultivated in southern China [14]. Diseases have continuously and significantly impacted crop yield. For instance, the economic losses caused by plant scab, bacterial wilt, and soft rot are the largest in recent years [15].
A variety of compounds are present in essential oils, Freitas, P.R. et al. have identified monoterpene α-pinene and limonene as bioactive secondary metabolites with antibacterial properties [16]; The synergistic mechanism of compounds has a potential functional role. As an efflux pump, of natural products Compounds and its importance of therapeutic potential. Freitas, P. et al. used D-limonene in the production of many products, Such as cosmetics and condiments [17]. In this context, studies have shown that essential oils are an important source of bioactive compounds and have the potential to overcome the mechanism of antibiotic resistance [18].
EO also has local anesthesia and anti-inflammatory functions [19] and antitumor effects [20]. In guava leaves, there are numerous polysaccharides, which are functional natural products [21] as are a large number of polysaccharides. Guava leaf polysaccharides have a variety of biological and pharmacological activities and exist naturally in plant roots, leaves, and other parts [6]. Luo et al. studied a variety of active functions of guava leaf polysaccharides, including cholesterol-lowering activity [21] immune activity, stimulating activity, and anti-pancreatic cancer activity [22]. At the same time, studies have reported that polysaccharides have various physiological functions in clinical practice and can also prevent diabetes [23]. Therefore, people should pay more attention to these natural compounds due to their potential application value and economic value.
There are many separation technologies for natural products, such as solvent extraction [24], hydro distillation [25,26], and ultrasonic extraction [7]. Among these technologies, solvent extraction is widely used to extract natural products from plant leaves to characterize their physical and chemical properties [27], however, solvent extraction easily leads to residual organic solvents, and poor enzyme stability tends to reduce extraction efficiency [21]. Ultrasonic extraction has obvious noise pollution [28]. Because of the long heating time and complicated separation process in the direct heating method, the yield of the individual ingredients is low. The above traditional methods are limited in their application for the actual separation of natural products and may degrade active compounds as well as limit the choice of solvents [29].
Microwave-mediated hydro distillation with salts addition (MMHSA) is a new technology recently developed for extraction and separation, the highly regarded performance of this technology is attributed to its time saving and no noise pollution [30]. Microwave irradiation can improve the transfer of heat energy in a very short time, destroy the cell wall and increase the permeability of the protoplasm layer to extract inclusions [31,32]. Microwave energy can promote the infiltration of plant materials into capillary fibers, improve the water absorption capacity of plant materials and improve extraction efficiency [33]. Radiation heating can work in a very short time. Molecular dipole migration can be induced by microwave radiation, which is considered the cause of hydrogen bond rupture in the plant cell wall [34]. After the EO was obtained, the polysaccharide in the leaves can be obtained directly by ethanol solution precipitation based on the remaining residue [35]. Ethanol precipitation is simple and easy and will not cause a waste of resources. The EO is sufficiently isolated in the cell under the coordinated action of microwaves and salt solutions, and the polysaccharides were separated by ethanol in the same guava leaves without wasting the extracted substrate, thus providing a good energy-saving effect.
Principal Component Analysis (PCA) is a method of transforming a set of potentially correlated variables into a set of linearly uncorrelated variables through orthogonal transformation, which can reduce the dimension of the data space studied [36]. This method can be used to filter out the main factors in a large amount of data, identify whether there is a significant difference exists between different variables, and understand the relationships among a large number of variables in a great system by the lesser variables that do not lose much information [37,38]. Therefore, we tried to compare the extraction efficiency of traditional heating reflux extraction with MMHSA method, which used lithium salt solution to pretreat guava leaves. Compared with previous methods, MMHSA is expected to obtain higher EO and polysaccharides synchronously, to obtain a broader prospect in the exploration of natural product separation.
2. Materials and Methods
2.1. Materials and Reagents
Fresh guava leaves were purchased from farmers’ manor in Meizhou City, Guangdong Province, identified by Pro. Hesheng Yang of Jiaying College, the leaves were dried at 25 °C in the shade for 7 days, pretreated by a grinder, and divided into small pieces with a length of 10 mm for later use.
Anhydrous lithium chloride, Lithium hydroxide, Lithium acetate, Lithium nitrate, and Lithium sulphat (purity ≥ 99%, BASF Biotechnology Co., Ltd., Hefei, China); Anhydrous ethanol; purity ≥ 99% (Fuyu Chemical Co., Ltd., Tianjin, China); deionized water (Jiaying University); n-hexane; purity ≥ 99%, (Guangfu Ltd., Tianjin, China); anhydrous sodium sulfate (purity ≥ 99%, Fuchen Chemical Reagent Company, Tianjin, China).
2.2. Apparatus
The structure of the microwave extraction device used in the experiment is shown in Figure 1 The device is composed of three parts: microwave heating, EO collection, and condensed reflux. maximum microwave radiation output power is 700 W, and the inside of the microwave oven cavity is 600 mm × 550 mm × 560 mm (Xintuo Analytical Instrument Co., Ltd., CW-2000, Shanghai, China). The power can be adjusted continuously as needed, the maximum power is 700 W under normal pressure, and the temperature is controlled by an external knob. The irradiation power can be varied with actual needs.
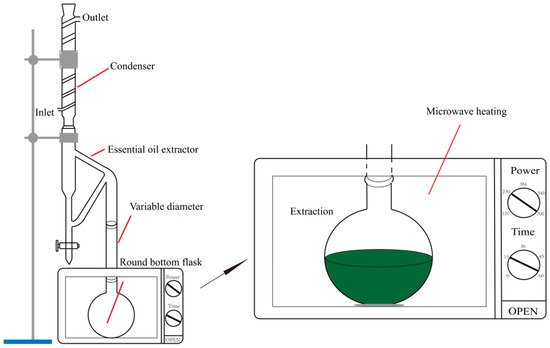
Figure 1.
Structure of microwave heating device.
2.3. Experimental Process
Fresh guava leaves were dried and weighed to calculate the moisture content and then cut into strips of 10 mm × 20 mm. Prepare different concentrations of lithium solution, and add 30 g dried guava leaves in a round-bottomed flask, guava leaves were pretreated at room temperature for a certain amount of time and placed in a 500 mL round-bottomed.
The extracted structure is shown in Figure 1, EO was extracted under different conditions, and the yield was calculated. Gas chromatographic-mass spectrometry (GC-MS) was used to analyze the composition of EOs. The obtained supernatant was concentrated to one-third of the original volume, a certain proportion of ethanol was added and the mixture was mixed well, then allowed to stand for 12 h, eluted with deionization three times, and the precipitate was dried to obtain guava leaf polysaccharide, and the yield was calculated by weighing.
2.4. Principal Component Analysis Process
Principal component analysis was used to reduce the dimensionality of single-factor experimental data. PCA plots were drawn by Origin 9 to analyze the variation trend of each variable on PC1 and PC2, and confidence intervals were used to test the reliability of sample statistical parameters. In general, PC1 can best reflect the direction of data change in the multidimensional space, and PC2 is perpendicular to PC1 and can best reflect the direction of the remaining data change. The projection of each factor on the PC axis is the load coefficient, which can be used to judge the influence value of this variable on the PC, and then the corresponding factor index is reflected by each principal component.
2.5. Essential Oil Detection Conditions
According to the results of RSO, three validation experiments were carried out to obtain EO sample A with lithium salts, sample B of EO by the heating reflux method, and sample C without lithium salts. The methods were tested by gas chromatography/mass spectrometry (Agilent −7000 GC/MS, Palo Alto, CA, USA) for composition determination: Take 0.5 mL of the EO sample, dissolve in 500 times the volume of n-hexane, and determine the EO components through 0.22 μm filter membrane extraction (Column specifications: 25 m × 0.2 mm quartz capillary column OV-101; Column temperature: 40–200 °C; Column pressure: 0.8 kg/cm2; Heating rate: 10 °C/min; Gasification temperature: 250 °C; Carrier gas: Helium, injection 1 μL; the electron energy is 70 eV, and the ion source temperature is 250 °C).
2.6. Bacterial Culture
The S. acidiscabies strains, R. solanacearum strains, and E. carotovora subsp carotovora borgey strains were provided by College of Life sciences, Northeastern Agricultural University, China. The antibiotic (Ampicillin: Rifampicin-1:1) solution was mixed evenly with 1 mL each from for use in subsequent experiments. Diluted with LB medium to a certain concentration for backup. The antibacterial activity of the EO was evaluated with the filter sheet diffusion method. 10 μL bacterial suspension of 108 CFU/mL was evenly applied on the LB medium with a 0.8 mm filter paper placed at the center of the medium. The pipette with 10 μL GLEO solution (1.25–40 µL/mL in 0.1% Tween-80) was dropped on the filter paper, replacing 0.1% with Tween-80 as a negative control. The plates were inverted and incubated at a temperature of 37 ± 1 °C for 12 h, and the diameter of the inhibitory region was measured and recorded.
3. Results and Discussion
3.1. Each Parameter on the Extraction Yield
3.1.1. Influence of Lithium Salt Addition on Yield
As is shown in Figure 2, the leaves are treated with different types of lithium salts solutions in a unit of time, and the relationship between the extraction rate and different treatment conditions is discussed. Through screening, the extraction rate of the raw materials pretreated with lithium chloride was the highest, with EOs of 5.1 mL/kg dry weight (DW) and polysaccharides of 27.8 g/kg·DW; the extraction rates of EOs and polysaccharides obtained after lithium sulfate treatment are the smallest, which are 1.21 mL/kg·DW and 12 g/kg·DW, respectively, in addition, the optimal amount of lithium salt is 45 μmol, possibly because compared with other lithium salts, lithium chloride has the strongest damaging effect on plant cell walls during the pretreatment process, increasing the number of active ingredients spilled, this is consistent with the study of Hassanvand et al. [39].
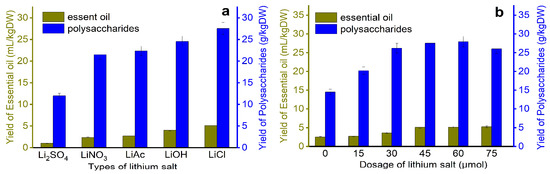
Figure 2.
Screening and amount of lithium salt; (a) the effect of different types of lithium on the yield of essential oil, (b) the effect of the amount of lithium on the yield of essential oil.
3.1.2. Each Parameter on the Yield of EO and Polysaccharide
As is shown in Figure 3a, When the liquid-to-solid ratio was 4–8, the extraction rates of EOs and polysaccharides continued to increase with a rapid trend, and the increase in extraction rate decreased when the ratio of liquid to solid was 8. An appropriate proportion was beneficial to increase the extraction rate and reduce energy consumption. Therefore, when the solid-to-liquid ratio was 8, the yields of EOs and polysaccharides were 7.3 mL/kg·DW and 37.5 g/kg·DW, respectively.
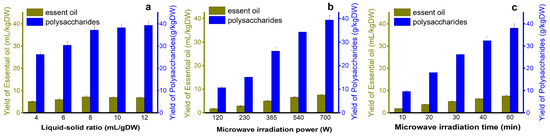
Figure 3.
Influence of each factor on the yield (a) Liquid-soild ratio; (b) microwave irradiation power and (c) microwave irradiation.
The extraction rates of polysaccharides and EOs are positively correlated with radiation power (Figure 3b). Under an irradiation power of 700 W, the yields of EOs and polysaccharides were 7.6 mL/kg·DW and 38.6 g/kg·DW, respectively, and numerous active components were released from leaf cells, thus increasing the yield of EOs and polysaccharides [40].
The yield of EO and polysaccharides was positively correlated with extraction time. When the microwave irradiation time is 10–20 min, the EO and extraction rate show a regular step increase (large range). When the extraction time was 40–60 min, the increase in the extraction rate decreased, and the target substance obtained in the first 40 min was almost 85% (Figure 3c). With the extension of time, the extraction rate will still increase, but the increased amplitude decreases. Therefore, 40 min was selected as the best condition for the next study [41].
3.1.3. Kinetic Analysis
The kinetic data for MMHSA are first-order and second-order fitted kinetic curve models (Figure 4), which provide a graph for discussing the extraction yield under different microwave times and microwave power conditions. First, with increasing microwave time and power, the yield curve trends of EOs and polysaccharides were the same. As shown in Figure 4a, the yield of EO increased rapidly to 5 mL/kg·DW within 15 min. As time goes by, the yield curve gradually slows down, which may be due to the low-power and short-term extraction of the outflow of EO in the cell after a period. The continuous heating and time increase will help to further separate the effective ingredients in the leaves. A yield of approximately 8.8 mL/kg·DW was obtained in 40 min, but the extraction rate obtained in 60 min did not increase significantly; therefore, the optimal yield of EO was approximately 40 min.
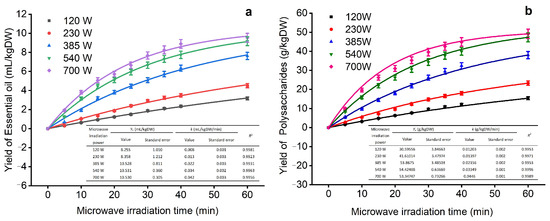
Figure 4.
Extraction kinetic curve (The subfigures in the figure are correlation coefficient of the fitting curve; (a) yield of essential oil; (b) yield of polysaccharides).
Compared with EOs, the yield of polysaccharides is higher (Figure 4b). According to the second-order kinetic model fitting, the yield of polysaccharides is positively correlated with time and power, which is consistent with the yield curve of EOs. The yield of polysaccharides varies significantly under different power conditions. When the extraction power is 700 W, the yield is the largest; when the extraction time is within 40 min, the yield of polysaccharides increases significantly, reaching a maximum of 44.6 mg/kg·DW, but as the extraction time continues to extend, the increase in the extraction rate of polysaccharides will decrease, which may cause heat accumulation due to continuous microwave irradiation, leading to gelation of cells, so the outflow of EOs and polysaccharides will decrease [42]. Therefore, we choose the kinetic curve as 700 W, with 40 min as the next step of optimization.
3.2. Correlation Analysis
In the correlation analysis of essential oil yield (Figure 5a), the correlation coefficient between lithium mole number and liquid-solid ratio, microwave power, and microwave time is close to 1, that is, the correlation is very high. Similarly, the correlation coefficient between microwave power and microwave time is close to 1. Lithium salts showed a significant negative correlation with other single factors, which may be related to the ion amount of different lithium salts, while other single factors were positively correlated, such correlation characteristics can also be reflected in the yield of polysaccharides extracted by microwave (Figure 5b). In the yield of polysaccharides, microwave power and microwave time were also highly correlated. However, the correlation coefficient between liquid-solid ratio and microwave power and microwave time was larger than that in the yield of essential oil, and the correlation coefficient between the mole number of lithium and liquid-solid ratio, microwave power, and microwave time was smaller than that in the yield of essential oil, the above rules are consistent with those described by Xiaoqian Du et al. [43]. Because every single factor between the essential oil and polysaccharide yield has a significant correlation, to further filter out the most useful data in all experimental data information, the next step we will use the PCA method will be more high correlation between the single factor into unrelated minority variables, to analyze the characteristics of essential oil and polysaccharide.
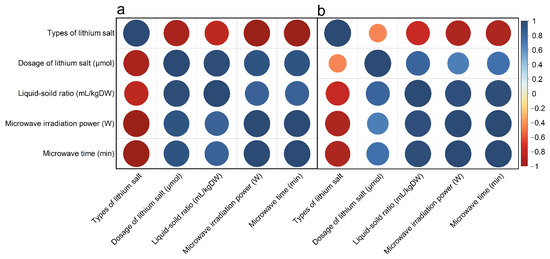
Figure 5.
Correlation analysis of yield of (a) essential oil and (b) polysaccharide under different factors.
3.3. Principal Component Analysis
The contribution value of the first principal component (PC1) is 89.3%, the contribution value of the second principal component (PC2) is only 10.4%, and the cumulative contribution rate of the two is 99.7%. The first two principal components can represent the information characteristics of 99.7% of the original data. In PC1, the liquid-solid ratio had the highest correlation, followed by microwave time and microwave power, and the correlation between these two factors was extremely high; therefore, we can consider that PC1 represents the information characteristics of the yield of EOs and polysaccharides, which were mainly affected by the above three factors.
The contribution rate of PC2 was 10.4%. Different types of lithium salts had the highest correlation with the new independent variables of PC2 in all experimental factors. Similarly, the information represented by PC2 is the yield characteristics of EOs and polysaccharides affected mainly by the types of lithium salts. This change is related to the inherent characteristics of the different types of lithium salts in the extraction process of the EOs and polysaccharides. From the change of score value of PC2, PC2 is affected mainly by the type of lithium salt, and the sample values (e1–e5, p1–p5) corresponded to the influence characteristics of LiCl, LiOH, LiAc, LiNO3, and Li2SO4 on the yield of EOs and polysaccharides, respectively. The yield of LiCl was the largest, so its corresponding score of PC2 was also the largest, and the smallest score was that of Li2SO4. Therefore, the main type of lithium salt selected in our experiment was LiCl.
Figure 6 shows that the points representing polysaccharides changed greatly, while the point change of EO was not obvious, which may be because the yield of EOs was lower than that of polysaccharides overall. With the increase in the single-factor variable, the yield increased slowly and approached a value, and the rate of increase decreased. By plotting confidence intervals, the different values can be seen to have a certain theoretical basis, so the central tendency of polysaccharides and EOs also represents regularity. From the change of the PC1 score value, with the increase of any single factor, the value of PC1 will increase, but the trend is stable. As the levels of each factor increased, the yield of EO and polysaccharides also increased and tended to reach an extreme directional value. PC1 accounted for 89.3% of the contribution rate of PCA [44]. Therefore, the three most influential factors of the extraction rate were the liquid-solid ratio, irradiation time, and microwave power. We chose these three factors for further research [36].
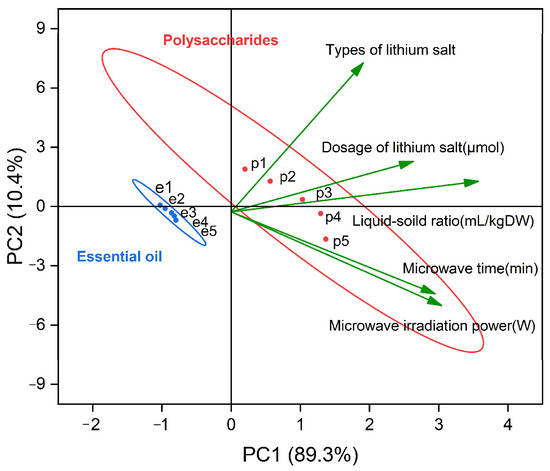
Figure 6.
Biplot of first and second principal components from PCA (e1–e5 represents the sample values of essential oils at different levels of strength, and p1–p5 represents the sample values of polysaccharides at different levels of strength).
3.4. The Response Surface Optimization (RSO) Optimization Process
We used Design-Expert (Version 8.0, Stat-Ease, Inc., Minneapolis, MN, USA) to design single-factor experimental results based on previous experiments: X1: solid–liquid ratio, X2: microwave power, and X3: microwave time. The yields of Y1: EO and Y2: polysaccharide was used as response values. A total of 17 treatment groups were designed (Table 1 and Table 2).

Table 1.
Box-Behnken design (BBD) with experimental value for a total yield of EO (mL/kg·DW), analysis of variance (ANOVA) for response surface quadratic model; “*”is significant and “**” is extremely significant.
Table 2.
Box-Behnken design (BBD) with experimental value for a total yield of polysaccharides (g/kgDW), analysis of varance (ANOVA) fo response surface quadratic model.
3.4.1. Influence of Lithium Salt Addition on Yield
We use response surface analysis to fit the data in Table 1 and obtain the regression equation:
Y = 43.65 + 10.08X1 + 3.24X2 + 2.99X3 + 2.52X1X2 + 1.19X1X3 + 1.56X2X3 − 8.03X12 − 2.76X22 − 3.60X32
The optimization analysis of EO yield revealed that the p value was extremely significant (p < 0.01). The missing term is p = 0.119 > 0.05 (not significant), indicating that unknown factors have little influence on the experiment, so the error can be ignored. R2 = 0.99, R2 adj = 0.98 and CV% = 2.21% < 3% of the model. These data generated by the response surface fit the experiment well. X1X2 and X1X3 of the primary term, secondary term and interaction term had extremely significant effects on the yield of EO (p < 0.01), while X2X3 of the interaction term had no significant effect (p > 0.05). According to the permutation of the f value X1 > X2 > X3, the effect of the solid-liquid ratio on EO yield was the most significant.
3.4.2. Effects of RSO Parameters on the Yield of Polysaccharides
Data analysis of RSO for polysaccharide yield is shown in Table 2 According to the formula:
Y = 43.65 + 10.08X1 + 3.24X2 + 2.99X3 + 2.52X1X2 + 1.19X1X3 + 1.56X2X3 − 8.03X12 − 2.76X22 − 3.60X32
From the analysis results of polysaccharide yield, p = 0.0001 < 0.01 indicated that the model was extremely significant. p = 0.1462 < 0.05 was not significant, indicating that the experimental error was small (other factors had little interference with the experiment) and could be ignored. R2 = 0.99, CV% = 3.64, indicating a high degree of model fitting. The results showed that the model could accurately measure the effects of the above factors on the yield of polysaccharides.
3.4.3. Influence of Response Surface Optimization Factors on Yield
The EO rate gradually increases as the ratio of material to liquid increases from 6–10, and the microwave power increases from 385–700 W (Figure 7a). A higher solid-liquid ratio is generally believed to be conducive to providing more target substances, and higher microwave power is conducive to destroying the structure of the oil coating. Figure 7b discusses the relationship between the yield of EO and the ratio of solid to liquid and extraction time. When the extraction time was from 35–45 min, the yield of EO was not obvious, but when the ratio of solid to liquid ranged from 6–10, the yield of EO increased significantly.
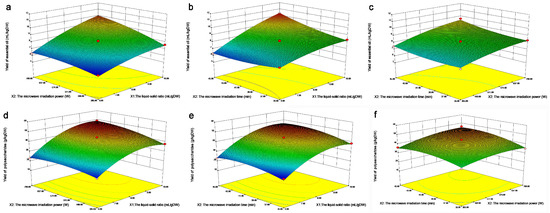
Figure 7.
Response surface diagram of the influence of various factors on the yield of EO; (a) The influence of microwave power and liquid-solid ratio on the extraction rate of EO; (b) The influence of microwave time and liquid-solid ratio on the extraction rate of EO; (c) The influence of microwave time and microwave power on the extraction rate of EO; (d) The influence of microwave power and liquid-solid ratio on the extraction yield of polysaccharides; (e) The influence of microwave time and liquid-solid ratio on the extraction yield of polysaccharides; (f) Effects of microwave time and microwave power on the extraction yield of polysaccharides.
With a solid-liquid ratio from 6–10 and an increase in the microwave power from 385–700 W, the polysaccharide extraction rate gradually increased (Figure 7d), and the optimum extraction conditions appeared. A higher solid–liquid ratio is generally believed to be helpful to provide more targets, a higher irradiation power is conducive to the destruction of the structure of wrapped polysaccharides, and a more intense microwave treatment condition is conducive to the extraction of polysaccharides. Therefore, extraction of polysaccharides in the range of 9–10 in the ratio of material to liquid and 637–700 W in microwave power is necessary. Figure 7e shows that with an increase in the solid–liquid ratio from 6–10 and microwave time from 35–45 min, the polysaccharide extraction rate gradually increased, and the optimal extraction conditions appeared, indicating that the combination interval with a higher solid-liquid ratio and microwave time was favorable for the extraction of polysaccharides. With increasing microwave power from 385–700 W and microwave time from 35–45 min, the extraction rate of polysaccharides gradually increased (Figure 7f), and the optimal interval appears under the extraction conditions [40].
The results showed that the microwave power and microwave time were favorable for the extraction of polysaccharides. Therefore, it is necessary to extract polysaccharides in the microwave power range of 637–700 W and microwave time range of 41–43 min.
3.4.4. Validation Test
Within the test range of various factors, with the yield of EO and polysaccharides as the optimization objectives, the optimal process parameters were analyzed. The optimal conditions for each indicator were a solid–liquid ratio of 9.73, microwave power of 658 W, and microwave time of 43 min. The yields of EO and polysaccharides were 10.45 mL/kg·DW and 50.65 g/kg·DW, respectively. Under these conditions, the yields of EO and polysaccharide were 10.27 ± 0.58 mL/kg·DW and 50.31 ± 1.88 g/kg·DW, respectively, which were not significantly different from the predicted values (p > 0.05) and could be further extracted according to the modified conditions.
3.5. Comparison with Reference Techniques
The traditional electric heating sleeve extraction method adopts glass fiber and metal heating lines, which require a certain time to heat. The glass vessels are embedded in a sleeve and exposed to air, resulting in energy loss, and the temperature cannot be controlled uniformly. Compared with the traditional method of heating extraction, MMHSA using high-frequency electromagnetic waves makes the material within the molecule collide under the effect of an electric field, the electromagnetic energy enters as heat energy, the microwave heating penetrating ability increases the temperature quickly, there is a small heat loss, the operation is convenient, and the EO yields using this method are excellent. Compared with the above two experimental methods, it is obvious that the extraction efficiency of microwaves is higher than the extraction efficiency of traditional methods [45,46].
3.6. Analysis of EOs Compounds
The EO from guava leaves was detected by gas chromatography/mass spectrometry, including the identified components and relative area [47]. A total of 76 components were detected. EO extracted with lithium salt (EOa) contained 51 components; extracted EO without lithium salt (EOb) contained 44 components, and EO extracted by heating mantle (EOc) contained 42 ingredients (Table 3). The main components in the EO extracted by these three methods were l-caryophyllene, l-calamenene, 1,4,7-cycloundecatriene, 1,5,9-aromandendrene and globulol, but the relative abundance (RA) % of each volatile component was significantly different. The EOc process is a process of distilling fresh plant materials by heating them at the bottom of the flask through resistance. The materials are not heated evenly, and the extraction efficiency is relatively low. EOb microwave-assisted heating uses ambient radiation heating to heat materials evenly through water vapor. Comparatively speaking, the extraction range is more uniform, with better thermal penetration and high solvent water content in the system. EOa is the metal ion lithium chloride added based on EOb, so the extraction rate increased significantly. Each of the three processes has its own characteristics, but there are certain differences in the content of EO.
Table 3.
GC-MS detection of essential oil composition results.
As is shown in Figure 8, the contribution rate of the first principal component (PC1) is 92.2%, the contribution rate of the PC2 is 4.4%, and the cumulative contribution rate of the first two principal components is 96.6%, which can represent the change information of data. The vertical projection of EOa on the PC1 axis was the largest, followed by EOc and EOb. The variation of PC1 value had the greatest correlation with variable EOa (extraction method), followed by EOc and EOb. From the PC2 axis, EOc and EOb are in the positive direction of the PC2 axis, and the positive vertical projection of EOc is the largest on the PC2 axis, while EOa is in the negative axis, and the negative vertical projection is the largest on the PC2 axis, indicating that the change of PC2 value is greatly affected by EOa and EOc extraction methods. Each component can be roughly divided into four categories. The first category is the chemical components near the origin, whose PC1 and PC2 values are small, indicating that the content of such chemical components is small or close to zero, and is not affected by the three extraction methods. The second category was chemical components with a large PC1 value and close to 0 PC2 value, such as L-Caryophyllene, Globulol, and L-calamenene. The contents of these chemical components were all high under the three extraction methods, and EOa was the highest, followed by EOc and EOb. The third type is located in the first quadrant, and the PC1 value is small, but the PC2 value is large. These compounds are greatly affected by extraction methods, while the content is little or zero under EOa methods, such as alpha-copaene, Tau-cadinol and alpha-cadinol. The fourth category is located in the fourth quadrant, with a small PC1 value and a large absolute value of PC2. These chemical components are also greatly affected by extraction methods.
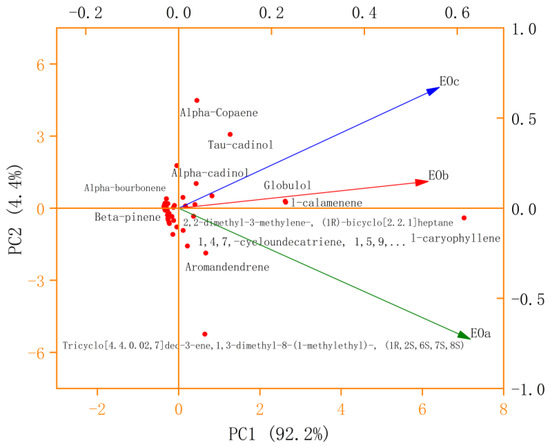
Figure 8.
PCA analysis of EO compounds obtained by different extraction methods.
3.7. Bacteriostatic Activity of EO
When the concentration reached 40 μL/mL, the bacteriostatic zones are 23.7 ± 0.11 mm, 21.1 ± 0.09 and 20.1 ± 0.05 mm (As is shown in Table 4), respectively. The positive control substance (antibiotics) on the bacteria inhibition is equally obvious. which may be due to the fact that EO contains terpenoids with a large number of hydrophobic groups, which can dissolve lipid compounds on the cell membrane and lead to their dissolution and outflow in the cell, thus damaging the cell structure. It is worth noting that ampicillin and EOs have some similarities in bacteriostatic principle. Rifampicin is an antibacterial agent that interferes with the key enzyme of RNA synthesis, thus inhibiting the synthesis of bacterial RNA and blocking the RNA transcription process, making it difficult for bacteria to proliferation [44]. Therefore, the significant bacteriostatic activity of EOs is inseparable from their rich chemical composition.
Table 4.
Inhibition of EO on different species of bacteria.
As is shown in Table 5, the correlation analysis between different concentrations of essential oils and the size of the inhibition zone is as follows: The correlation coefficient between concentration and SA was 0.863, between concentration and RS was 0.817, and between concentration and ECCB was 0.841. The significance values of the three strains were all less than 0.05, with little difference. Therefore, concentration was significantly correlated with the inhibition effect at the level of 0.05.
Table 5.
Correlation analysis (EO concentration and inhibition zone size).
4. Conclusions
In this study, we discuss mainly the MMHSA synchronous extraction of EO and polysaccharides from guava leaves. During the extraction process, we discussed the influence of different lithium salts on the extraction rate. The single factor method was used to discuss and verify the effect of different factors on the extraction rate. Principal Component Analysis (PCA) showed that the most significant effects on EO and polysaccharide yield were solid–liquid ratio, microwave time, and irradiation power, the maximum yield of EO is 10.27 ± 0.58 mL/kg·DW, and the yield of polysaccharides is 50.31 ± 1.88 g/kg·DW. The above studies indicated that EO extracted method had a development prospect.
Author Contributions
Conceptualization and writing, X.Z. and Y.H.; software, L.Z.; data analysis, H.Z. and Y.N.; graphics rendering, Y.A.; validation, Z.L. All authors have read and agreed to the published version of the manuscript.
Funding
This research was funded by Meizhou Science and Technology Fund (2021B0204007, 2021B0204001); Key Scientific Research Platform Project of Guangdong Universities (2019GCZX007); Science and Technology Program of Guangdong Province (2020B0201001) and Meizhou Applied Science and Technology Special Fund Project (2020B0205004).
Institutional Review Board Statement
This study did not require ethical approval.
Informed Consent Statement
This study did not involve humans.
Data Availability Statement
The data shown in this study are contained within the article.
Conflicts of Interest
The authors declare no conflict of interest.
References
- De Oliveira, I.; Uchoa, M.A.; Fernandes, M.G.; Vieira, C.R.Y.I.; Faccenda, O.; De Oliveira, I.S.T. Antixenosis of the Triozid, Triozoida limbata (Hemiptera: Triozidae) to Some Cultivars of Psidium guajava (Myrtaceae) in the Field. Fla. Èntomol. 2019, 102, 695–700. [Google Scholar] [CrossRef]
- Manikandan, R.; Anand, A.V. Evaluation of Antioxidant Activity of Psidium guajava Linn. in streptozotocin–Induced Diabetic Rats. Free Radic. Antioxid. 2016, 6, 72–76. [Google Scholar] [CrossRef]
- Husaini, O.; Zulkifli, Z.; Lande, M.L.; Nurcahyani, E. Karakterisasi Bahan Anti Browning dari Ekstrak Air Buah Jambu Batu (Psidium guajava Linn) pada Buah Apel Malang (Malus sylvestris (L.) Mill). J. Penelit. Pertan. Ter. 2017, 17, 85–92. [Google Scholar] [CrossRef]
- Ganem, F.; Mattedi, S.; Rodríguez, O.; Rodil, E.; Soto, A. Deterpenation of citrus essential oil with 1-ethyl-3-methylimidazolium acetate: A comparison of unit operations. Sep. Purif. Technol. 2020, 250, 117208. [Google Scholar] [CrossRef]
- Liu, Z.; Qiao, L.; Gu, H.; Yang, F.; Yang, L. Development of Brönsted acidic ionic liquid based microwave assisted method for simultaneous extraction of pectin and naringin from pomelo peels. Sep. Purif. Technol. 2017, 172, 326–337. [Google Scholar] [CrossRef]
- Luo, Y.; Peng, B.; Liu, Y.; Wu, Y.; Wu, Z. Ultrasound extraction of polysaccharides from guava leaves and their antioxidant and antiglycation activity. Process Biochem. 2018, 73, 228–234. [Google Scholar] [CrossRef]
- Yang, Y.-C.; Wang, C.-S.; Wei, M.-C. Development and validation of an ultrasound-assisted supercritical carbon-dioxide procedure for the production of essential oils from Perilla frutescens. LWT 2020, 128, 109503. [Google Scholar] [CrossRef]
- Ju, T.; Xi, J. Continuous extraction optimization, molecular structures and antioxidant activities of polysaccharide from Gracilariopsis lemaneiformis using liquid-phase pulsed discharge. Sep. Purif. Technol. 2019, 236, 116241. [Google Scholar] [CrossRef]
- Singha, K.; Hor, P.K.; Soren, J.P.; Mondal, J.; Mondal, K.C.; Pati, B.R.; Das Mohapatra, P.K. Exploration of bioactive prospects of a polysaccharide fraction from Termitomyces heimii against colorectal cancer and broad spectrum bacteria. Bioact. Carbohydr. Diet. Fibre 2021, 25, 100255. [Google Scholar] [CrossRef]
- Khursheed, R.; Singh, S.K.; Wadhwa, S.; Gulati, M.; Awasthi, A. Therapeutic potential of mushrooms in diabetes mellitus: Role of polysaccharides. Int. J. Biol. Macromol. 2020, 164, 1194–1205. [Google Scholar] [CrossRef]
- Díaz-De-Cerio, E.; Verardo, V.; Gómez-Caravaca, A.M.; Fernández-Gutiérrez, A.; Segura-Carretero, A. Health Effects of Psidium guajava L. Leaves: An Overview of the Last Decade. Int. J. Mol. Sci. 2017, 18, 897. [Google Scholar] [CrossRef]
- Rodríguez-Palafox, E.E.; Vásquez-López, A.; Márquez-Licona, G.; Lima, N.B.; Lagunes-Fortiz, E.; Tovar-Pedraza, J.M. First Report of Colletotrichum siamense Causing Anthracnose of Guava (Psidium guajava) in Mexico. Plant Dis. 2021, 105, 3290. [Google Scholar] [CrossRef]
- Takahashi, Y.; Otsuki, A.; Mori, Y.; Kawakami, Y.; Ito, H. Inhibition of leukocyte-type 12-lipoxygenase by guava tea leaves prevents development of atherosclerosis. Food Chem. 2015, 186, 2–5. [Google Scholar] [CrossRef]
- Sopon, A.; Thongdet, E.; Punnarak, P.; Suksai, S. The Potential of Sea Grapes (Caulerpa Lentilifera) Extracted Polysaccharide as Prebiotics on Inhibiting Pathogenic Bacteria Vibrio Parahaemolyticus. Int. J. Environ. Sci. Dev. 2020, 11, 572–576. [Google Scholar] [CrossRef]
- Chen, B.; Long, Q.-S.; Meng, J.; Zhou, X.; Wu, Z.-B.; Tuo, X.-X.; Ding, Y.; Zhang, L.; Wang, P.-Y.; Li, Z.; et al. Target Discovery in Ralstonia solanacearum through an Activity-Based Protein Profiling Technique Based on Bioactive Oxadiazole Sulfones. J. Agric. Food Chem. 2020, 68, 2340–2346. [Google Scholar] [CrossRef]
- De Araújo, A.C.J.; Freitas, P.R.; dos Santos Barbosa, C.R.; Muniz, D.F.; de Almeida, R.S.; de Menezes, I.R.A.; Ribeiro-Filho, J.; Tintino, S.R.; Coutinho, H.D.M. In Vitro and In Silico Inhibition of Staphylococcus aureus Efflux Pump NorA by α-Pinene and Limonene. Curr. Microbiol. 2021, 78, 3388–3393. [Google Scholar] [CrossRef]
- Freitas, P.R.; de Araújo, A.C.J.; dos Santos Barbosa, C.R.; Muniz, D.F.; de Almeida, R.S.; de Menezes, I.R.A.; da Costa, J.G.M.; Rodrigues, F.F.G.; Rocha, J.E.; Pereira-Junior, F.N.; et al. Inhibition of the MepA efflux pump by limonene demonstrated by in vitro and in silico methods. Folia Microbiol. 2022, 67, 15–20. [Google Scholar] [CrossRef]
- Costa, M.D.S.; Rocha, J.E.; Campina, F.F.; Silva, A.R.; Da Cruz, R.P.; Pereira, R.L.; Quintans-Júnior, L.J.; De Menezes, I.R.; Araújo, A.A.D.S.; De Freitas, T.S.; et al. Comparative analysis of the antibacterial and drug-modulatory effect of D-limonene alone and complexed with β-cyclodextrin. Eur. J. Pharm. Sci. 2019, 128, 158–161. [Google Scholar] [CrossRef]
- Yostawonkul, J.; Kitiyodom, S.; Kaewmalun, S.; Suktham, K.; Nittayasut, N.; Khongkow, M.; Namdee, K.; Ruktanonchai, U.R.; Rodkhum, C.; Pirarat, N.; et al. Bifunctional clove oil nanoparticles for anesthesia and anti-bacterial activity in Nile tilapia (Oreochromis niloticus). Aquaculture 2019, 503, 589–595. [Google Scholar] [CrossRef]
- Nanashima, N.; Kitajima, M.; Takamagi, S.; Fujioka, M.; Tomisawa, T. Comparison of Chemical Composition between Kuromoji (Lindera umbellata) Essential Oil and Hydrosol and Determination of the Deodorizing Effect. Molecules 2020, 25, 4195. [Google Scholar] [CrossRef]
- Luo, Y.; Peng, B.; Wei, W.; Tian, X.; Wu, Z. Antioxidant and Anti-Diabetic Activities of Polysaccharides from Guava Leaves. Molecules 2019, 24, 1343. [Google Scholar] [CrossRef]
- Yan, Y.; Li, X.; Wan, M.; Chen, J.; Li, S.; Cao, M.; Zhang, D. Effect of extraction methods on property and bioactivity of water-soluble polysaccharides from Amomum villosum. Carbohydr. Polym. 2015, 117, 632–635. [Google Scholar] [CrossRef]
- He, L.; Yan, X.; Liang, J.; Li, S.; He, H.; Xiong, Q.; Lai, X.; Hou, S.; Huang, S. Comparison of different extraction methods for polysaccharides from Dendrobium officinale stem. Carbohydr. Polym. 2018, 198, 101–108. [Google Scholar] [CrossRef]
- Vijayan, U.K.; Varakumar, S.; Singhal, R.S. A comparative account of extraction of oleoresin from Curcuma aromatica Salisb by solvent and supercritical carbon dioxide: Characterization and bioactivities. LWT 2019, 116, 108564. [Google Scholar] [CrossRef]
- Li, Y.-X.; Zhang, C.; Pan, S.; Chen, L.; Liu, M.; Yang, K.; Zeng, X.; Tian, J. Analysis of chemical components and biological activities of essential oils from black and white pepper (Piper nigrum L.) in five provinces of southern China. LWT 2020, 117, 108644. [Google Scholar] [CrossRef]
- Pejin, B.; Vujisic, L.; Sabovljevic, M.; Tesevic, V.; Vajs, V. Preliminary Data on Essential Oil Composition of the Moss Rhodobryum ontariense (Kindb.) Kindb. Cryptogam. Bryol. 2011, 32, 113–117. [Google Scholar] [CrossRef]
- Anbalagan, K.; Kumar, M.M.; Ilango, K.; Mohankumar, R.; Priya, R.L. Prelusive scale extraction of mangiferin from Mangifera indica leaves: Assessing solvent competency, process optimization, kinetic study and diffusion modelling. Ind. Crop. Prod. 2019, 140, 111703. [Google Scholar] [CrossRef]
- Sommer, A.; Mahlknecht, G.; Obermeyer, G. Measuring the Osmotic Water Permeability of the Plant Protoplast Plasma Membrane: Implication of the Nonosmotic Volume. J. Membr. Biol. 2007, 215, 111–123. [Google Scholar] [CrossRef][Green Version]
- Shang, A.; Gan, R.-Y.; Zhang, J.-R.; Xu, X.-Y.; Luo, M.; Liu, H.-Y.; Li, L.-B. Optimization and characterization of microwave-assisted hydro-distillation extraction of essential oils from Cinnamomum camphora leaf and recovery of polyphenols from extract fluid. Molecules 2020, 25, 3213. [Google Scholar] [CrossRef]
- Feng, Y.-N.; Zhang, X.-F. Polysaccharide extracted from Huperzia serrata using response surface methodology and its biological activity. Int. J. Biol. Macromol. 2020, 157, 267–275. [Google Scholar] [CrossRef]
- Hu, B.; Li, Y.; Song, J.; Li, H.; Zhou, Q.; Li, C.; Zhang, Z.; Liu, Y.; Liu, A.; Zhang, Q.; et al. Oil extraction from tiger nut (Cyperus esculentus L.) using the combination of microwave-ultrasonic assisted aqueous enzymatic method–Design, optimization and quality evaluation. J. Chromatogr. A 2020, 1627, 461380. [Google Scholar] [CrossRef]
- Jiao, Z.; Zhang, Y.; Fan, H. Ultrasonic-microwave method in preparation of polypyrrole-coated magnetic particles for vitamin D extraction in milk. J. Chromatogr. A 2016, 1457, 7–13. [Google Scholar] [CrossRef]
- Sagarika, N.; Prince, M.V.; Kothakota, A.; Pandiselvam, R.; Sreeja, R.; & Mathew, S.M. Characterization and Optimization of Microwave Assisted Process for Extraction of Nutmeg (Myristica fragrans Houtt.) Mace Essential Oil. J. Essent. Oil Bear. Plants 2018, 21, 895–904. [Google Scholar] [CrossRef]
- Zhang, H.; Cai, X.T.; Tian, Q.H.; Xiao, L.X.; Zeng, Z.; Cai, X.T.; Yan, J.Z.; Li, Q.Y. Microwave-Assisted Degradation of Polysaccharide from Polygonatum sibiricum and Antioxidant Activity. J. Food Sci. 2019, 84, 754–761. [Google Scholar] [CrossRef]
- Hashemifesharaki, R.; Xanthakis, E.; Altintas, Z.; Guo, Y.; Gharibzahedi, S.M.T. Microwave-assisted extraction of polysaccharides from the marshmallow roots: Optimization, purification, structure, and bioactivity. Carbohydr. Polym. 2020, 240, 116301. [Google Scholar] [CrossRef]
- Yu, G.; Zhu, H.; Huang, Y.; Zhang, X.; Sun, L.; Wang, Y.; Xia, X. Preparation of Daidzein microparticles through liquid antisolvent precipitation under ultrasonication. Ultrason. Sonochemistry 2021, 79, 105772. [Google Scholar] [CrossRef]
- Ekpa, O.; Fogliano, V.; Linnemann, A. Identification of the volatile profiles of 22 traditional and newly bred maize varieties and their porridges by PTR-QiTOF-MS and HS-SPME GC–MS. J. Sci. Food Agric. 2021, 101, 1618–1628. [Google Scholar] [CrossRef]
- Miladinović, D.L.; Dimitrijević, M.V.; Mihajilov-Krstev, T.M.; Marković, M.S.; Ćirić, V.M. The significance of minor components on the antibacterial activity of essential oil via chemometrics. LWT 2021, 136, 110305. [Google Scholar] [CrossRef]
- Hassanvand, F.; Nejad, A.R.; Fanourakis, D. Morphological and physiological components mediating the silicon-induced enhancement of geranium essential oil yield under saline conditions. Ind. Crop. Prod. 2019, 134, 19–25. [Google Scholar] [CrossRef]
- Chen, F.; Jia, J.; Zhang, Q.; Yang, L.; Gu, H. Isolation of essential oil from the leaves of Polygonum viscosum Buch-ham. using microwave-assisted enzyme pretreatment followed by microwave hydrodistillation concatenated with liquid–liquid extraction. Ind. Crops Prod. 2018, 112, 327–341. [Google Scholar] [CrossRef]
- Liu, Z.; Li, H.; Cui, G.; Wei, M.; Zou, Z.; Ni, H. Efficient extraction of essential oil from Cinnamomum burmannii leaves using enzymolysis pretreatment and followed by microwave-assisted method. LWT 2021, 147, 111497. [Google Scholar] [CrossRef]
- Zhang, Q.; Huo, R.; Ma, Y.; Yan, S.; Yang, L.; Chen, F. A novel microwave-assisted steam distillation approach for separation of essential oil from tree peony (Paeonia suffruticosa Andrews) petals: Optimization, kinetic, chemical composition and antioxidant activity. Ind. Crop. Prod. 2020, 154, 112669. [Google Scholar] [CrossRef]
- Du, X.; Hu, M.; Liu, G.; Qi, B.; Zhou, S.; Lu, K.; Xie, F.; Zhu, X.; Li, Y. Development and evaluation of delivery systems for quercetin: A comparative study between coarse emulsion, nano-emulsion, high internal phase emulsion, and emulsion gel. J. Food Eng. 2022, 314, 110784. [Google Scholar] [CrossRef]
- Khodaei, N.; Nguyen, M.M.; Mdimagh, A.; Bayen, S.; Karboune, S. Compositional diversity and antioxidant properties of essential oils: Predictive models. LWT 2021, 138, 110684. [Google Scholar] [CrossRef]
- Chen, Q.; Hu, Z.; Yao, F.Y.-D.; Liang, H. Study of two-stage microwave extraction of essential oil and pectin from pomelo peels. LWT 2016, 66, 538–545. [Google Scholar] [CrossRef]
- Liu, Z.; Li, H.; Zhu, Z.; Huang, D.; Qi, Y.; Ma, C.; Zou, Z.; Ni, H. Cinnamomum camphora fruit peel as a source of essential oil extracted using the solvent-free microwave-assisted method compared with conventional hydrodistillation. LWT 2022, 153, 112549. [Google Scholar] [CrossRef]
- Jassal, K.; Kaushal, S.; Rashmi; Rani, R. Antifungal potential of guava (Psidium guajava) leaves essential oil, major compounds: Beta-caryophyllene and caryophyllene oxide. Arch. Phytopathol. Plant Prot. 2021, 54, 2034–2050. [Google Scholar] [CrossRef]


Publisher’s Note: MDPI stays neutral with regard to jurisdictional claims in published maps and institutional affiliations. |
© 2022 by the authors. Licensee MDPI, Basel, Switzerland. This article is an open access article distributed under the terms and conditions of the Creative Commons Attribution (CC BY) license (https://creativecommons.org/licenses/by/4.0/).