Abstract
Comprehensive two-dimensional gas chromatography mass spectrometry (GC×GC-MS) is a powerful tool for the analysis of complex mixtures, and it is ideally suited to discovery studies where the entire sample is potentially of interest. Unfortunately, when unit mass resolution mass spectrometers are used, many detected compounds have spectra that do not match well with libraries. This could be due to the compound not being in the library, or the compound having a weak/nonexistent molecular ion cluster. While high-speed, high-resolution mass spectrometers, or ion sources with softer ionization than 70 eV electron impact (EI) may help with some of this, many GC×GC systems presently in use employ low-resolution mass spectrometers and 70 eV EI ionization. Scripting tools that apply filters to GC×GC-TOFMS data based on logical operations applied to spectral and/or retention data have been used previously for environmental and petroleum samples. This approach rapidly filters GC×GC-TOFMS peak tables (or raw data) and is available in software from multiple vendors. In this work, we present a series of scripts that have been developed to rapidly classify major groups of compounds that are of relevance to metabolomics studies including: fatty acid methyl esters, free fatty acids, aldehydes, alcohols, ketones, amino acids, and carbohydrates.
1. Introduction
Most of the GC-based metabolomics applications combine GC with MS detection to help with the identification of unknown analytes. Metabolomics samples typically exhibit high complexity due to their diverse chemical content that is present at wide concentration ranges. In non-target studies, accurate identification of metabolites at low concentrations can be complicated by coelutions and/or peak distortion due to closely/coeluting highly abundant metabolites [1,2]. Low-concentration analytes can also be easily obscured due to noise in the spectrum that can hinder the qualitative identification of peaks based on mass spectral library matching. Meanwhile, overloaded peaks from high-concentration species may lead to inaccurate identification arising from detector saturation and distortion of mass spectra [3].
As a platform, comprehensive two-dimensional gas chromatography time-of-flight mass spectrometry (GC×GC-TOFMS) is an excellent tool for non-target metabolomics. The higher and more effective use of peak capacity when compared to one-dimensional GC methods, results in improved signal-to-noise ratios due to increased signal (focusing/band compression at modulator) and decreased noise (separation of analytes from primary column bleed and coeluting analytes). Consequently, spectra are cleaner, allowing improved compound identification. When compared to LC-MS methods, matrix effects are less in GC-MS, and the technique offers a broad dynamic range [4]. Additionally, GC×GC techniques provide chromatograms with an inherently ordered structure, which is useful for the identification of unknown compounds. Moreover, this technique is advantageous through the possibility of “seeing everything”; the TOFMS allows the capture of complete mass spectra at every point [5]. Due to the above benefits, this instrument is seeing increasingly frequent use for non-target metabolomics studies of biofluids (e.g., urine, blood, sweat), breath, plant extracts, etc. [2,6,7,8,9,10,11].
However, the amount of data generated from such comprehensive techniques is massive and nearly impossible to handle manually [2,5,12,13]. GC(×GC)-MS systems often use electron impact ionization (EI), which generates highly reproducible fragmentation patterns in both m/z values and the relative abundances of the corresponding ions. This facilitates the construction of databases of searchable mass spectral libraries. When a chromatogram is processed with an MS library database, the final peak table contains a list of tentatively identified analytes with the library match similarity factors. However, despite the use of such databases, a manual review of thousands of peaks in a sample can be a tedious task. Each entry in the peak table must be verified by comparing the retention index and the MS library for a higher assurance of compound identification. Unfortunately, in many studies with unit mass resolution mass spectrometers, many (sometimes most) detected compounds have spectra that do not match well with libraries. While the advancement made in GC×GC-MS systems with high-speed, high-resolution accurate mass spectrometers, or ion sources with softer ionization than 70 eV electron impact may resolve some of the challenges, there are many GC×GC systems presently in use that rely on low-resolution mass spectrometers. With the process of manually examining the peak table, compounds with low spectral match quality can be evaluated along with library retention indices to obtain the final list of provisional identifications. The issue is that when analytes are searched against a library, it is possible to have multiple compounds with the same library hit for structurally similar compounds. It is also common that a detected analyte is not registered in the mass spectral library database. This is especially true for trimethylsilyl (TMS) derivatives of compounds, generated with a gold standard derivatization method for metabolomics samples [14]. Consequently, peak tables suffer from incorrect/ambiguous name assignments [15] and these tentative names must be verified through a manual process by knowledgeable personnel capable of interpreting the mass spectral and elution data. With a complex sample, where the list of analytes can reach several thousands of peaks, this manual process is a significant burden. The complexity of data analysis, rather than the usual culprits of sample preparation or instrumental time, serves as the major bottleneck in GC×GC-TOFMS analysis.
In order to speed up and simplify data analysis, script-based filtering of peaks is a promising tool. Scripting involves programming a series of logic rules based on mass spectrometric and/or retention properties for target compounds to determine whether the compound belongs to a specific class [16,17,18]. The extensive and reproducible fragmentation patterns from EI are advantageous for creating mass spectral filtering scripts. The scripts work as a data reduction filter by enabling the classification of chromatographic peaks based on distinguishable features in mass spectral information. Scripting tools that apply filters to GC×GC-TOFMS data were initially used for environmental and petroleum samples. Numerous scripts have been published to aid with, for example, the identification of halogenated species [17,19,20,21,22]. It was evident that the scripting tool greatly assists with an automated and rapid classification of the compounds in GC×GC chromatograms [16,17,23,24,25,26]. The speed and convenience of data analysis afforded by scripting contributed to the more widespread use of GC×GC in the environmental and petroleum fields.
When developing scripts, finding the molecular ion is beneficial, as the subsequent expected neutral losses can be deduced from the molecular ion peak. The primary reason why scripts could be developed and used widely for environmental studies is due to the convenience in locating the molecular ion for the major compound classes of interest, such as halogenated species and aromatic compounds. Investigation of the molecular ion was performed as the fundamental step in many of the previously reported scripts for environmental samples [16,17,27]. Writing scripts becomes more challenging for compounds that generate a weak (or no) molecular ion, as a molecular ion usually forms the basis for scripting rules. TMS derivatives generally produce weak or undetectable molecular ion peaks due to the fast elimination of the substituent radical from the silicon of the molecular ion [28,29]. In addition, for TMS derivatized compounds, the trimethylsilyl moiety (m/z 73) is, if not the base peak, a major ion common to all TMS derivatives.
This manuscript presents a suite of scripts developed for GC×GC-TOFMS metabolomics data with the aim of rapid screening of complex biological samples, which typically contain thousands of compounds, comprised of diverse compound classes. In this work, the scripts were developed using the scripting feature in ChromaTOF® (v.4.72; LECO), one of the most used commercial software packages in the GC×GC-TOFMS community. However, the scripts presented herein should be equally applicable to data from other GC×GC-MS systems, possibly with minor adjustments to the abundance thresholds in the logical decision trees. The greatest advantage of the scripts presented herein is their reliance solely on mass spectral information (i.e., retention information is not considered). This makes the scripts versatile and applicable to any GC×GC-TOFMS data (likely well-resolved GC-TOFMS data also), regardless of the conditions used in the analytical run. The scripts were applied to standard mixtures of four different major classes of metabolites (amino acids, fatty acids, fatty acid methyl esters, and carbohydrates) at different concentrations. After validating the performance of classifying scripts with standards at low and high concentrations, the automated filtering scripts were applied to various derivatized and non-derivatized biosamples to evaluate their performance. To the best of our knowledge, this represents the first collection of automated filtering scripts for handling GC×GC-TOFMS data in metabolomics applications.
2. Materials and Methods
2.1. Chemicals and Materials
2.1.1. Derivatization Materials
HPLC grade methanol, HPLC grade toluene, and 99.9% pyridine were purchased from Millipore-Sigma Canada. Toluene was dried over anhydrous sodium sulfate (Millipore-Sigma Canada). Methoxyamine hydrochloride (Millipore-Sigma, Canada) solution was prepared in pyridine at a concentration of 20 mg/mL. Ampoules of N-methyl-N-(trimethylsilyl) trifluoroacetamide + 1% trichloromethylsilane (MSTFA + 1% TMCS), were purchased from Fisher Scientific Canada and opened immediately prior to use. Safe-Lock amber centrifuge tubes were purchased from Eppendorf Canada Ltd., while 2-mL glass GC vials, GC vials with integral 300 μL inserts, and GC vial caps (PTFE-faced silicon) were purchased from Chromatographic Specialities Inc. (Canada).
2.1.2. Standard Mixtures
To test the performance of the developed scripts at various concentrations (from LOD level to overload-the-column high), a mixture of amino acid standard mixture (AAS18-10 mL analytical standard, Millipore-Sigma Canada), fatty acid standard mixture (Nu-Check, MN, USA), fatty acid methyl esters standard mixture (SUPELCO 37 Component FAME Mix, Millipore-Sigma Canada), and a carbohydrates standard mixture (Carbohydrates kit, Millipore-Sigma Canada) were mixed at 18 different concentrations. The compounds of the standard mixture used in the experiment are listed in Supplementary Materials Table S1. The details of how the mixtures were prepared are also included in Supplementary Materials. A total of 108 compounds are in the mixture of standards, including 17 amino acids, 44 fatty acids, 37 fatty acid methyl esters, and 10 carbohydrates.
2.2. Sample Preparation
The performance of the scripts was evaluated using previously acquired data from a variety of sample types, including urine, plasma, algae, feces, and sweat [30,31].
2.2.1. Derivatization
Urine, plasma, algae samples, and standard mixtures were prepared by a typical two-step derivatization process of methoximation, followed by subsequent trimethylsilylation [32]. The details of sample preparation are included in Supplementary Materials. In brief, the sample was extracted with an organic solvent and dried under nitrogen. To the dried residue, 50 µL of 20 mg/mL methoxyamine hydrochloride in pyridine were added for methoximation and incubated at 60 °C for 2 h. Subsequently, 100 µL of MSTFA were added and incubated again at 60 °C for 1 h.
2.2.2. SPME (Solid-Phase Microextraction)
The volatiles from feces and sweat samples were extracted using a three-phase SPME fibre (CAR/DVB/PDMS) with sampling from the headspace [30,33]. Other details are in the publications presenting the data sets.
2.3. GC×GC-TOFMS Analysis
All GC×GC-TOFMS analyses were performed on a LECO Pegasus 4D system (Leco Instruments, St. Joseph, MI, USA), with an Agilent Technologies 7890 gas chromatograph (Palo Alto, CA, USA) equipped with a four-jet dual-stage liquid nitrogen cryogenic modulator. The samples were analyzed with different column combinations and different GC×GC and MS methods. The two GC×GC-TOFMS conditions used to evaluate the versatility of scripts in Section 3.2 are summarized in Table 1.

Table 1.
GC×GC-TOFMS conditions employed to evaluate the versatility of scripts in Section 3.2.
2.4. Data Processing and Automated Classification
All GC×GC-TOFMS data were processed using ChromaTOF® (v.4.72) software from LECO. The baseline offset was set to 0.9, and the expected peak widths throughout the entire chromatographic run were set to 10 s for the first dimension and 0.15 s for the second dimension. The data were processed with a peak finding threshold of S/N 30:1. Peak finding and deconvolution of mass spectra were performed automatically as an embedded function of ChromaTOF®. All chromatographic peaks were searched against the NIST MS Search v.2.3 (2017) and Wiley 08 libraries. The scripting option was enabled in ChromaTOF®, allowing user-written scripts to be applied over the entire chromatographic space. The scripts were written with Microsoft VBScript language, a Visual Basic dialect.
2.5. Scripting-Based Classifications and Evaluation
The scripts used mass spectral information without any retention time information to locate the members of target compounds/classes. The scripts were written as a set of logical operations, incorporating the knowledge about mass spectral fragmentation for the class of compounds of interest. In general, the scripts presented in this study involve the following steps: the expected molecular ion of the family of compounds was calculated based on the molecular structure, probable neutral losses were subtracted from the calculated molecular ion, and then other prominent features (e.g., abundance of major fragments and low intensities for specific regions in the mass spectrum) were evaluated. For metabolites that are mostly non-halogenated species, isotopic ratios are not as useful as they are for the halogenated species in environmental studies.
For a homologous series of metabolites, the expected molecular ion was calculated using the number of carbons in the alkyl chain. For example, for the class of normal saturated fatty acid methyl esters, the theoretical molecular ion was determined with Equation (1). From the calculated molecular ion, the subsequent fragment losses, such as [M-31]+, representing a loss of a methoxy group, as well as [M-43]+ and [M-29]+, were investigated from a complex rearrangement. The ion at m/z 74 is the McLafferty rearrangement ion, which is the base peak for FAMEs; this confirms that it is indeed a methyl ester. For the case of TMS derivatives of saturated fatty acids, the molecular ion also was calculated, based on the number of carbons in the alkyl chain, with Equation (2). For TMS derivatives of fatty acids, the molecular ion is generally weak or absent due to its susceptibility to hydrolysis. Instead, [M-15]+, which represents the loss of a methyl group, is significantly abundant. In addition, m/z 73 and 75 are common to all TMS derivatives and usually are considerably abundant.
Expected MW = 14 × Carbon_number + 46
Expected_MW = 14 × Carbon_number + 104
In theory, the molecular ion should be the highest m/z aside from its isotopic cluster. To address the limitation of compounds with weak/nonexistent molecular ion peaks, the strategy of calculating the molecular ion, instead of searching for the appearance of the molecular ion from the mass spectra, was used. With this approach, the spectra that have a considerable number of high mass ions bigger than the expected molecular ion with significant intensities were programmed to be excluded from the classification. With logical operations, the intensities (ion counts) in the mass channel region above [M+2]+ to the end mass of the mass spectrum were checked if they fall within the set tolerance for noise (i.e., 1% relative abundance of the base peak). This was done to reduce the chance of bigger molecules being falsely filtered due to common fragment ions or random chance. The scripts that were developed for use in this work can be found on GitHub at https://github.com/seolinnam/Scripts_Metabolomics (accessed on 14 June 2021). As additional metabolomics-related scripts are developed, they will be added to this repository. To evaluate the performance of the scripts, standard mixtures of four different classes of compounds (amino acids, fatty acids, fatty acids methyl esters, and carbohydrates) were prepared at various concentrations. Since the scripts rely entirely on the mass spectral information, the spectral quality is crucial for scripts to work reliably. Various concentrations of standard mixtures were prepared to test both ends of concentrations: (1) at extremely high concentrations, where the peaks are overloaded and saturating the detector, could result in distorted ion ratios, and (2) at very low concentrations, where the signals may be close to the noise level, consequently boosting the noise in mass spectra, leading to inaccurate ion ratios and fragmentation patterns. Eighteen mixtures of the standards at different concentrations were prepared by mixing the four different classes of standard mixtures at various concentrations. These standard mixtures were derivatized following the two-step methoximation and trimethylsilylation derivatization procedure.
3. Results and Discussion
Since GC×GC-TOFMS data provide both chromatographic and mass spectral information, scripts can be written using either or a combination of retention and spectral information. While mass spectral information is independent of the GC×GC-TOFMS method used, retention information depends on the column combination and the GC×GC method (temperature programming, flow rate) used for the analysis. Some published scripts involve retention information in the search algorithms to enhance the accuracy of the scripts for the compound classes that are challenging to distinguish with the mass spectral information alone. The scripts presented herein were written using only mass spectral information. This provides a significant advantage because these scripts are independent of separation parameters and can be applied to any GC or GC×GC-TOFMS chromatograms, regardless of the column combinations and GC and MS conditions used.
3.1. Evaluation of Scripts
The same data processing method with the in-house written scripts were applied to all 18 chromatograms using ChromaTOF®. A peak table for each chromatogram was generated automatically from the software after the data processing was finished. The family group for the compounds that are classified by the scripts were displayed in the classification column in the peak table. The peak tables were sorted to prioritize classified compounds (Table 2 and Table 3). The detailed results of how many compounds in the standard mixtures at various concentrations were classified for each group are included in the Supplementary Materials Table S2. Figure 1 shows the classified peaks using the “bubbles” feature, where the radii of the bubbles correspond to the relative areas of the represented peaks. Each class of compounds was assigned a different color. It is visually evident that the scripts struggled to classify peaks more at low concentrations (Figure 1A) rather than at high concentrations (Figure 1C). Figure 1C showed that while peaks may have been overloaded, the performance of the scripts was not significantly affected.
Table 2.
Fourteen compounds were filtered from the standard mixture prepared at the lowest concentration. 1tR, 2tR represent primary and secondary retention times, respectively.
Table 3.
Ninety-five compounds were filtered from the standard mixture prepared at the highest concentration. 1tR, 2tR represent primary and secondary retention times, respectively.
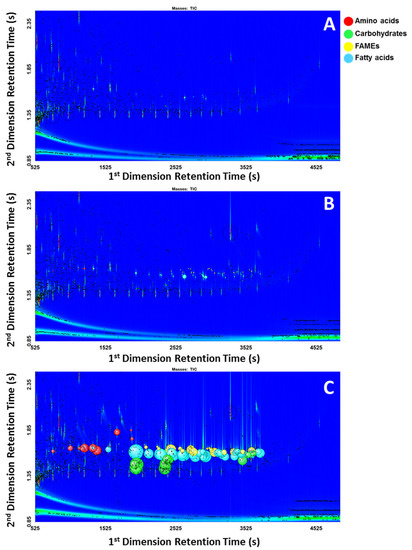
Figure 1.
(A) Low concentration; (B) Intermediate concentration; (C) High concentration.
For the low concentration, of 108 compounds in the standard mixture, only 14 compounds (8 saturated fatty acids, 2 monoenoic fatty acids, 1 dienoic fatty acid, and 3 carbohydrates) were classified using the scripts. In this work, the term limit of classification (LOC) is used to describe the lowest concentration where the scripts could correctly classify the compound. The LOC varied widely for different classes and even for different compounds within the same class due to the differences in the complexity of characteristic mass spectral features used in developing scripts. Depending on how unique the fragmentation of the target compound is, scripting can filter out the compounds of interest more or less effectively using the distinct mass spectral features. As an example, the LOC for a TMS derivative of arachidic acid was determined to be 85.1 pg on-column. The compound was detected with a signal-to-noise ratio of 387. The concentration of 85.1 pg on-column was the first occurrence of the compound that was classified correctly as a TMS derivative of a saturated fatty acid. The mass spectral match score for this compound at the lowest concentration (21.3 pg on column, S/N 64.22) was 464 for similarity and 732 for reverse (Figure 2B), which was significantly lower than 857 for similarity and 918 for reverse in a higher concentration (2.13 ng on column, S/N 15089) standard (Figure 2A).
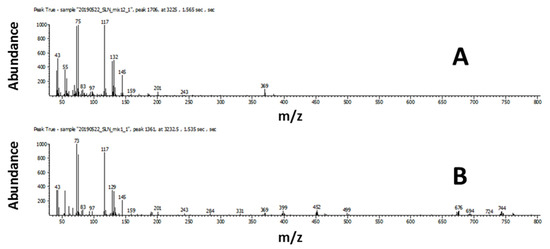
Figure 2.
Arachidic acid, TMS derivative (A) high concentration; (B) low concentration.
Low concentrations resulted in low-quality spectra with higher noise, which hindered the ability of the classifying scripts and resulted in some false negatives. To alleviate this issue, scripts were refined to eliminate any compound that has more than five prominent peaks (abundance greater than 1% of the base peak) beyond the [M+2]+ peak. The threshold for tolerating noise in the higher masses above [M+2]+ was calculated by taking the average of all the signals of masses above [M+2]+, and four standard deviations above the average was set as the threshold to discriminate the real signals versus noise. This small alteration slightly improved the result of classifying scripts at the lower concentrations; however, it increased the possibility of false-positives due to the increased flexibility for lower intensity peaks at the higher end of the mass spectrum. Nonetheless, as a proof-of-concept, testing the scripts on the standard mixtures at various concentrations revealed its fairly robust performance as an automated, convenient, and rapid screening tool. Once the scripts are written, the accuracy and leniency of such scripts can be tuned by the user by adding or removing specific features and adjusting the tolerance levels for ion ratios, based on need. Furthermore, the addition of retention time information may increase the accuracy of the scripts further. Since this would significantly sacrifice their versatility, we leave the inclusion of retention information to the individual laboratory, so that they can tune the scripts to their needs and their absolute retention times based on the columns and experimental conditions used in their laboratory.
3.2. Versatility of Scripts
The greatest advantage of the proposed scripts is their flexibility; they can be applied to any GC×GC-TOFMS chromatograms, regardless of the conditions used. To validate this benefit, a standard mixture of 37 FAMEs was analyzed using two different GC×GC-TOFMS conditions. The chromatograms are shown in Figure 3. The chromatogram in Figure 3C is a FAME extract from algae, which was analyzed using the same conditions as for the chromatogram in Figure 3B. The chromatograms were processed using the same data processing method with scripts for FAMEs. Table 4 shows the results for the two conditions and the algae extracts.
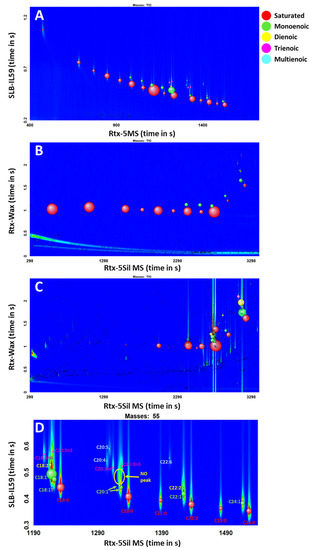
Figure 3.
(A) SUPELCO 37-Component FAME Mix ran with GC×GC-TOFMS Condition 1; (B) GC×GC-TOFMS Condition 2; (C) Algae extract with GC×GC-TOFMS Condition 2; (D) zoomed-in chromatogram of Figure 3A. Red bubbles for saturated, light green for monoenoic, yellow for dienoic, pink for trienoic, and light blue multienoic.
Table 4.
Standard FAMEs results using two different conditions and an algae extract.
With Condition 1, thirty-four FAMEs were identified (Figure 3A). However, methyl butyrate and methyl hexanoate (short-chain FAMEs) were missed in classification because they eluted before the solvent delay time under the GC×GC TOFMS conditions that were used to acquire the chromatogram. One isomer each of C18:2 and C20:2 were not detected, as the peaks were not well resolved in the region of the chromatogram with other nearby abundant peaks (Figure 3D). Both cis- and trans- forms of methyl eicosenoate (C20:1) were detected and classified correctly as monoenoic FAMEs, although the SUPELCO certificate only mentions the presence of methyl cis-11-eicosenoate (Figure 3D). Twenty-one FAMEs were identified in Condition 2 correctly from C6 to C18; the last compound to be able to be eluted with the given GC×GC TOFMS condition was C18 FAME due to the temperature limitation with an insufficient hold time at the end of the run. The use of the PEG phase in the second dimension restricted the maximum temperature to 230 °C in 1D and 245 °C in 2D. Among the detected peaks in the range of C6 to C18 FAMEs, all twenty-one FAMEs that are in the standard mixture were correctly classified into the corresponding groups.
The scripts applied to algae extracts classified forty-nine FAMEs from 981 peaks in approximately 10 min of data processing time. All 49 peaks were identified correctly, despite the evidently overloaded peaks towards the end of the chromatogram (C16 and C18 FAMEs). Algae extract results showed that the scripting tool allowed rapid screening and provided a general understanding of the composition of the sample in a short time. The scripting tool enables quick visualization of the location of members of target classes of compounds, while simultaneously offering a rough visual estimation of the concentration of the compounds.
3.3. Filtering of Peak Table by Scripts
After the evaluation of the scripts, they were applied to four different real-world samples that were prepared with two major sample preparation methods for metabolomics studies, SPME, and TMS derivatization. Sweat and fecal samples were prepared with SPME, a method for volatile analysis without derivatization, whereas plasma and urine were prepared with a two-step methoximation/trimethylsilylation derivatization. The four different samples were analyzed with different GC×GC-TOFMS conditions, each with different column configurations. All four acquired chromatograms (Figure 4) were processed with the same scripts, without any special treatment to the data, such as artifact removal (column bleed), in order to fully assess the power of the scripts. The classes of metabolites that were used in the scripts were aldehydes, alcohols, ketones, free fatty acids, fatty acid methyl esters, fatty acid ethyl esters, and isopropyl esters to target for non-derivatized compounds and trimethylsilyl esters of amino acids, fatty acids, sugars, other organic acids, and sterols for the TMS derivatives.
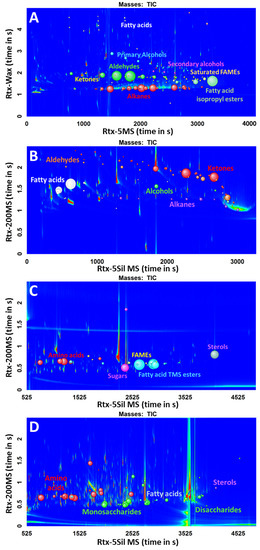
Figure 4.
Chromatograms of different sample types with the same scripts applied. (A) Sweat; (B) Feces; (C) Plasma; (D) Urine.
The raw chromatograms of each sample contained thousands of peaks, which make reviewing the data and getting useful information and interpretation of the data a challenge. After the scripting filters were applied, the peak tables were reduced from the original thousands of peaks detected to a few dozen classified compounds, which makes the manual revision of the data more realistic and convenient. The classified peaks for each sample were reviewed manually to verify the accuracy of the scripts. In the process of the manual revision, true-positives (TPs) and false-positives (FPs) for classification were determined. TPs indicate the compounds that are correctly classified to the corresponding class, whereas FPs represent the compounds that are incorrectly assigned to the class. The number of TPs and FPs for each class of compound was counted for the evaluation of the scripts. To confirm the identity of a peak, the entire mass spectrum of each classified analyte was examined against a library. The ordered structure in GC×GC also helped the compound identification by diagnosing the relative position of the compound in chromatographic space, especially for homologous series of compounds.
Table 5 shows the results of the scripts applied to four different samples. The number of compounds that were classified correctly into the corresponding class was counted, and TPs were recorded, with the number of FPs recorded in parenthesis. Overall, the scripts displayed high accuracy, given that the samples were analyzed with different GC×GC-TOFMS methods. It is noteworthy that for the samples that were extracted with SPME, no compounds were classified as TMS derivatives. On the other hand, for derivatized samples, no compounds were classified as alcohols or free fatty acids, which would have been trimethylsilylated. Although it is not practical to examine every single peak in a sample that contains thousands of peaks to assess the occurrence of true negatives and false negatives, the fact that no compound classified as TMS derivatives for SPME and vice versa for TMS-derivatized samples, provides a strong indication that the scripts are reliable.
Table 5.
Results of sweat, feces, plasma, and urine samples with scripting filters applied.
Even with the powerful separation efficiency of GC×GC, coelution is inevitable for complex biological samples. As an example, in the plasma sample, methionine-2TMS and aspartic acid-3TMS coeluted almost perfectly in both the first and second dimensions (Figure 5A). As both are TMS derivatives (i.e., m/z 73 is a common ion in the derivatized products), it must have been difficult to distinguish them as two different peaks even with EIC of m/z 73 and would have been easily missed without careful examination of the data. However, with the scripting tool, they were identified as two distinct compounds, despite their vast difference in intensities, where methionine-2TMS could be obscured by aspartic acid-3TMS (Figure 5B).
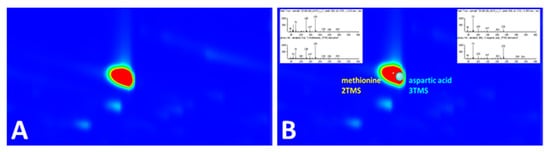
Figure 5.
(A) At m/z 73, the region of the chromatogram appeared to have a single intense peak due to complete coelution of two peaks in both 1D and 2D. (B) Coeluted peaks were classified as two different peaks by script.
3.4. Applying Cached Scripts
There are two ways that scripts can be applied to GC×GC data in ChromaTOF®. Scripts described so far were used to classify chromatographic peaks that match specific spectral criteria in a peak table. Another manner in which scripts can be applied in ChromaTOF® is with so-called cached scripts. The script function with a cached script returns a numeric value, which is cached into a calculated “ion trace” during data processing. After the data is processed, the cached ion traces are plotted and the responses of only the target analytes that match the particular spectral criteria are shown.
As an example, cached scripts for TMS esters of saturated fatty acids were applied to a derivatized standard mixture. The standard mixture contained over 1000 peaks. Figure 6 presents the comparison between TIC and the cached script result. The EIC using mass channel m/z 73 would not be sufficiently selective in derivatized biological samples since m/z 73 is a common mass in derivatized products. Using the cached scripts, the TOFMS can be transformed into a selective detector for spectra with the desired characteristics, and the surface plot showing only the target analytes allows rapid screening of samples.
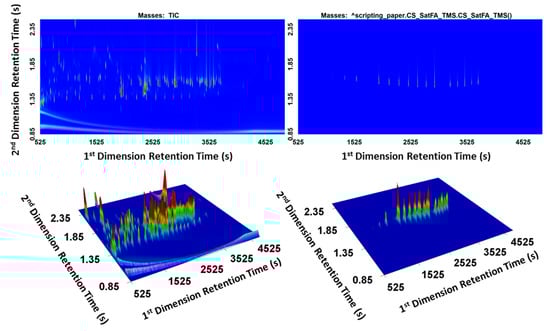
Figure 6.
Cached script result for generating a selective response for TMS esters of saturated fatty acids.
4. Conclusions
Due to the complexity and the amount of data acquired from GC×GC-TOFMS analyses, data handling has been a significant challenge, especially with metabolomics data. In this work, scripting algorithms for numerous classes of metabolites were written using the scripting feature in the LECO ChromaTOF®. To the best of our knowledge, this scripting tool represents the first time that automated screening by filtering scripts for handling GC×GC-TOFMS data in metabolomics applications had been reported. The objective of filtering scripts was to visualize quickly the members of different classes of metabolites in samples from thousands of peaks in the GC×GC-TOFMS data and to reduce the size of peak tables for further manual review. It could be considered as the semi non-targeted detection of classes of compounds and offered quick visualization of the members of multiple classes of compounds. The most significant advantage of the developed scripting algorithms was that they are agnostic to the GC×GC-TOFMS configuration and methods used. No retention time information was used in the scripts, which made the scripting approach versatile for many applications. Further updating and modifying of classification scripts may be needed due to some factors such as the discrepancy of the detector condition for the instrument, which affects the abundance ratio of ions, etc. However, the developed scripts are sufficient to provide the basic skeleton of mass spectral information for the different classes of metabolites, while avoiding over-specifying the filters. Although room for improvement remains, the presented automated scripting proved to be a useful tool for the classification and visualization of different classes of compounds.
Supplementary Materials
The following are available online at https://www.mdpi.com/article/10.3390/separations8060084/s1, Table S1: Compounds included in the standard mixtures, Table S2: Details of standard mixture preparation μL standard placed in GC vial, Table S3: Number of compounds in the standard mixtures that were classified for each group.
Author Contributions
Conceptualization, S.L.N., A.P.d.l.M., and J.J.H.; methodology, S.L.N.; software, S.L.N.; validation, A.P.d.l.M.; formal analysis, S.L.N.; investigation, S.L.N.; resources, S.L.N.; data curation, S.L.N.; writing—original draft preparation, S.L.N.; writing—review and editing, A.P.d.l.M. and J.J.H.; visualization, S.L.N.; supervision, A.P.d.l.M. and J.J.H.; project administration, J.J.H.; funding acquisition, J.J.H. All authors have read and agreed to the published version of the manuscript.
Funding
Natural Sciences and Engineering Research Council of Canada (NSERC), Discovery Grant RGPIN-2016-05445; Canada Foundation for Innovation, Major Science Initiatives Fund (CFI-MSI) and Genome Canada/Genome Alberta, Genomics Technology Platforms (GTP) awards to The Metabolomics Innovation Centre (TMIC), MITACS Accelerate Grant IT17035.
Data Availability Statement
The data presented in this study are available in the Supplementary Materials.
Acknowledgments
The authors wish to acknowledge the support of the Natural Sciences and Engineering Research Council (NSERC) Canada and the support given to The Metabolomics Innovation Centre (TMIC) through grants from Genome Alberta, Genome Canada, and The Canada Foundation for Innovation. S.L.N. also wishes to acknowledge the support of MITACS and DNA Genotek.
Conflicts of Interest
The authors declare no conflict of interest.
References
- Bean, H.D.; Hill, J.E.; Dimandja, J.D. Improving the quality of biomarker candidates in untargeted metabolomics via peak table-based alignment of comprehensive two-dimensional gas chromatography–mass spectrometry data. J. Chromatogr. A 2015, 1394, 111–117. [Google Scholar] [CrossRef] [PubMed]
- Higgins Keppler, E.A.; Jenkins, C.L.; Davis, T.J.; Bean, H.D. Advances in the application of comprehensive two-dimensional gas chromatography in metabolomics. TrAC Trends Anal. Chem. 2018, 109, 275–286. [Google Scholar] [CrossRef] [PubMed]
- Bilbao, A.; Gibbons, B.C.; Slysz, G.W.; Crowell, K.L.; Monroe, M.E.; Ibrahim, Y.M.; Smith, R.D.; Payne, S.H.; Baker, E.S. An algorithm to correct saturated mass spectrometry ion abundances for enhanced quantitation and mass accuracy in omic studies. Int. J. Mass Spectrom. 2018, 427, 91–99. [Google Scholar] [CrossRef]
- Almstetter, M.; Oefner, P.; Dettmer, K. Comprehensive two-dimensional gas chromatography in metabolomics. Anal. Bioanal.Chem. 2012, 402, 1993–2013. [Google Scholar] [CrossRef]
- Castillo, S.; Mattila, I.; Miettinen, J.; Orešič, M.; Hyötyläinen, T. Data Analysis Tool for Comprehensive Two-Dimensional Gas Chromatography/Time-of-Flight Mass Spectrometry. Anal. Chem. 2011, 83, 3058–3067. [Google Scholar] [CrossRef]
- Vaz-Freire, L.T.; da Silva, M.D.R.G.; Freitas, A.M.C. Comprehensive two-dimensional gas chromatography for fingerprint pattern recognition in olive oils produced by two different techniques in Portuguese olive varieties Galega Vulgar, Cobrançosa e Carrasquenha. Anal. Chim. Acta 2009, 633, 263–270. [Google Scholar] [CrossRef]
- Vasquez, N.P.; Crosnier de bellaistre-Bonose, M.; Lévêque, N.; Thioulouse, E.; Doummar, D.; Billette de Villemeur, T.; Rodriguez, D.; Couderc, R.; Robin, S.; Courderot-Masuyer, C.; et al. Advances in the metabolic profiling of acidic compounds in children’s urines achieved by comprehensive two-dimensional gas chromatography. J. Chromatogr. B 2015, 1002, 130–138. [Google Scholar] [CrossRef]
- de la Mata, A.P.; McQueen, R.H.; Nam, S.L.; Harynuk, J.J. Comprehensive two-dimensional gas chromatographic profiling and chemometric interpretation of the volatile profiles of sweat in knit fabrics. Anal. Bioanal. Chem. 2017, 409, 1905–1913. [Google Scholar] [CrossRef]
- Das, M.K.; Bishwal, S.C.; Das, A.; Dabral, D.; Varshney, A.; Badireddy, V.K.; Nanda, R. Investigation of Gender-Specific Exhaled Breath Volatome in Humans by GCxGC-TOF-MS. Anal. Chem. 2014, 86, 1229–1237. [Google Scholar] [CrossRef] [PubMed]
- Phillips, M.; Cataneo, R.N.; Chaturvedi, A.; Kaplan, P.D.; Libardoni, M.; Mundada, M.; Patel, U.; Zhang, X. Detection of an extended human volatome with comprehensive two-dimensional gas chromatography time-of-flight mass spectrometry. PLoS ONE 2013, 8, e75274. [Google Scholar] [CrossRef]
- Winnike, J.H.; Wei, X.; Knagge, K.J.; Colman, S.D.; Gregory, S.G.; Zhang, X. Comparison of GC-MS and GC×GC-MS in the Analysis of Human Serum Samples for Biomarker Discovery. J. Proteome Res. 2015, 14, 1810–1817. [Google Scholar] [CrossRef] [PubMed]
- Murray, J.A. Qualitative and quantitative approaches in comprehensive two-dimensional gas chromatography. J. Chromatogr. A 2012, 1261, 58–68. [Google Scholar] [CrossRef] [PubMed]
- Seeley, J.V.; Seeley, S.K. Multidimensional Gas Chromatography: Fundamental Advances and New Applications. Anal. Chem. 2013, 85, 557–578. [Google Scholar] [CrossRef] [PubMed]
- Koek, M.M.; Jellema, R.H.; van der Greef, J.; Tas, A.C.; Hankemeier, T. Quantitative metabolomics based on gas chromatography mass spectrometry: Status and perspectives. Metabolomics 2010, 7, 307–328. [Google Scholar] [CrossRef]
- Kind, T.; Wohlgemuth, G.; Lee, D.Y.; Lu, Y.; Palazoglu, M.; Shahbaz, S.; Fiehn, O. FiehnLib: Mass Spectral and Retention Index Libraries for Metabolomics Based on Quadrupole and Time-of-Flight Gas Chromatography/Mass Spectrometry. Anal. Chem. 2009, 81, 10038–10048. [Google Scholar] [CrossRef] [PubMed]
- Jennerwein, M.K.; Eschner, M.; Gröger, T.; Wilharm, T.; Zimmermann, R. Complete Group-Type Quantification of Petroleum Middle Distillates Based on Comprehensive Two-Dimensional Gas Chromatography Time-of-Flight Mass Spectrometry (GC×GC-TOFMS) and Visual Basic Scripting. Energy Fuels 2014, 28, 5670–5681. [Google Scholar] [CrossRef]
- Hilton, D.C.; Jones, R.S.; Sjödin, A. A method for rapid, non-targeted screening for environmental contaminants in household dust. J. Chromatogr. A 2010, 1217, 6851–6856. [Google Scholar] [CrossRef]
- Pena-Abaurrea, M.; Jobst, K.J.; Ruffolo, R.; Shen, L.; McCrindle, R.; Helm, P.A.; Reiner, E.J. Identification of Potential Novel Bioaccumulative and Persistent Chemicals in Sediments from Ontario (Canada) Using Scripting Approaches with GC×GC-TOF MS Analysis. Environ. Sci. Technol. 2014, 48, 9591–9599. [Google Scholar] [CrossRef]
- Hashimoto, S.; Takazawa, Y.; Fushimi, A.; Tanabe, K.; Shibata, Y.; Ieda, T.; Ochiai, N.; Kanda, H.; Ohura, T.; Tao, Q.; et al. Global and selective detection of organohalogens in environmental samples by comprehensive two-dimensional gas chromatography–tandem mass spectrometry and high-resolution time-of-flight mass spectrometry. J. Chromatogr. A 2011, 1218, 3799–3810. [Google Scholar] [CrossRef]
- S Haglund, P.; Löfstrand, K.; Siek, K.; Asplund, L. Powerful GC-TOF-MS Techniques for Screening, Identification and Quantification of Halogenated Natural Products. Mass Spectrom. 2013, 2, S0018. [Google Scholar] [CrossRef]
- Weggler, B.A.; Gröger, T.; Zimmermann, R. Advanced scripting for the automated profiling of two-dimensional gas chromatography-time-of-flight mass spectrometry data from combustion aerosol. J. Chromatogr. A 2014, 1364, 241–248. [Google Scholar] [CrossRef]
- Gómez, M.J.; Herrera, S.; Solé, D.; García-Calvo, E.; Fernández-Alba, A.R. Automatic Searching and Evaluation of Priority and Emerging Contaminants in Wastewater and River Water by Stir Bar Sorptive Extraction followed by Comprehensive Two-Dimensional Gas Chromatography-Time-of-Flight Mass Spectrometry. Anal. Chem. 2011, 83, 2638–2647. [Google Scholar] [CrossRef]
- Welthagen, W.; Schnelle-Kreis, J.; Zimmermann, R. Search criteria and rules for comprehensive two-dimensional gas chromatography–time-of-flight mass spectrometry analysis of airborne particulate matter. J. Chromatogr. A 2003, 1019, 233–249. [Google Scholar] [CrossRef]
- Reichenbach, S.E.; Kottapalli, V.; Ni, M.; Visvanathan, A. Computer language for identifying chemicals with comprehensive two-dimensional gas chromatography and mass spectrometry. J. Chromatogr. A 2005, 1071, 263–269. [Google Scholar] [CrossRef]
- Brokl, M.; Bishop, L.; Wright, C.G.; Liu, C.; McAdam, K.; Focant, J. Analysis of mainstream tobacco smoke particulate phase using comprehensive two-dimensional gas chromatography time-of-flight mass spectrometry. J. Sep. Sci. 2013, 36, 1037–1044. [Google Scholar] [CrossRef] [PubMed]
- Gröger, T.; Welthagen, W.; Mitschke, S.; Schäffer, M.; Zimmermann, R. Application of comprehensive two-dimensional gas chromatography mass spectrometry and different types of data analysis for the investigation of cigarette particulate matter. J. Sep. Sci. 2008, 31, 3366–3374. [Google Scholar] [CrossRef] [PubMed]
- Titaley, I.A.; Ogba, O.M.; Chibwe, L.; Hoh, E.; Cheong, P.H.-Y.; Simonich, S.L.M. Automating data analysis for two-dimensional gas chromatography/time-of-flight mass spectrometry non-targeted analysis of comparative samples. J. Chromatogr. A 2018, 1541, 57–62. [Google Scholar] [CrossRef] [PubMed]
- Halket, J.M.; Zaikin, V.G. Derivatization in Mass Spectrometry—1. Silylation. Eur. J. Mass Spectrom. 2003, 9, 1–21. [Google Scholar] [CrossRef] [PubMed]
- Nicolescu, T.O. Interpretation of Mass Spectra. Mass Spectrom. 2017. [Google Scholar] [CrossRef]
- Mukhtar Abdul-Bari, M.; McQueen, R.H.; Paulina de la Mata, A.; Batcheller, J.C.; Harynuk, J.J. Retention and release of odorants in cotton and polyester fabrics following multiple soil/wash procedures. Text Res. J. 2020, 0040517520914411. [Google Scholar] [CrossRef]
- Nam, S.L.; de la Mata, A.P.; Dias, R.P.; Harynuk, J.J. Towards Standardization of Data Normalization Strategies to Improve Urinary Metabolomics Studies by GC×GC-TOFMS. Metabolites 2020, 10, 376. [Google Scholar] [CrossRef] [PubMed]
- Warwick B Dunn; David Broadhurst; Paul Begley; Eva Zelena; Sue Francis-mcintyre; Nadine Anderson; Marie Brown; Joshau D Knowles; Antony Halsall; John N Haselden; Andrew W Nicholls; Ian D Wilson; Douglas B Kell; Royston Goodacre Procedures for large-scale metabolic profiling of serum and plasma using gas chromatography and liquid chromatography coupled to mass spectrometry. Nat. Protoc. 2011, 6, 1060.
- Dixon, E.; Clubb, C.; Pittman, S.; Ammann, L.; Rasheed, Z.; Kazmi, N.; Keshavarzian, A.; Gillevet, P.; Rangwala, H.; Couch, R.D. Solid-phase microextraction and the human fecal VOC metabolome. PLoS ONE 2011, 6, e18471. [Google Scholar] [CrossRef] [PubMed]


Publisher’s Note: MDPI stays neutral with regard to jurisdictional claims in published maps and institutional affiliations. |
© 2021 by the authors. Licensee MDPI, Basel, Switzerland. This article is an open access article distributed under the terms and conditions of the Creative Commons Attribution (CC BY) license (https://creativecommons.org/licenses/by/4.0/).