Abstract
This study focuses on the optimization of modern extraction techniques for selected by-product materials, including apple, lemon, and tangerine peels, and onion skins, using artificial neural network (ANN) models. The extraction methods included ultrasound-assisted extraction (UAE) and microwave-assisted extraction (MAE) with water as the extractant, as well as maceration (MAC) with natural deep eutectic solvents (NADES). Key parameters, such as total phenolic content (TPC), total flavonoid content (TFC), and antioxidant activities, including reducing power (EC50) and free radical scavenging capacity (IC50), were evaluated to compare the efficiency of each method. Among the techniques, UAE outperformed both MAE and MAC in extracting bioactive compounds, especially from onion skins and tangerine peels, as reflected in the highest TPC, TFC, and antioxidant activity. UAE of onion skins showed the best performance, yielding the highest TPC (5.735 ± 0.558 mg CAE/g) and TFC (1.973 ± 0.112 mg RE/g), along with the strongest antioxidant activity (EC50 = 0.549 ± 0.076 mg/mL; IC50 = 0.108 ± 0.049 mg/mL). Tangerine peel extracts obtained by UAE also exhibited high phenolic content (TPC up to 5.399 ± 0.325 mg CAE/g) and strong radical scavenging activity (IC50 0.118 ± 0.099 mg/mL). ANN models using multilayer perceptron architectures with high coefficients of determination (r2 > 0.96) were developed to predict and optimize the extraction results. Sensitivity and error analyses confirmed the robustness of the models and emphasized the influence of the extraction technique and by-product type on the antioxidant parameters. Principal component and cluster analyses showed clear grouping patterns by extraction method, with UAE and MAE showing similar performance profiles. Overall, these results underline the potential of UAE- and ANN-based modeling for the optimal utilization of agricultural by-products.
1. Introduction
The food processing industry generates large amounts of by-products during production, including various inedible parts of plant materials, leading to negative environmental impacts and economic losses, while the hidden potential of these wasted by-products is neglected [1,2].
A significant by-product of fruit and vegetable processing is the peel, which remains discarded and unused due to hypersensitivity and rapid spoilage, and at the same time, due to the lack of sufficiently developed systems for their processing. This is particularly noticeable in the case of apples and citrus fruits, whose production and consumption at the world level reach enormous levels. In the case of apples, production at the world level during 2023 amounted to 97.3 million tons, and represents an increase compared to previous years [3]. Considering that 10% of the total weight of an apple is its peel, this by-product is generated in substantial quantities. It represents a valuable source of polyphenolic compounds (flavonols, phenolic acid, (−)-epicatechin, (+)-catechin, plant sterols, dihydrochalcones, procyanidins, anthocyanins) and dietary fiber [4,5]. With citrus fruits, the situation is even more pronounced, considering 50–60% of the fruit mass is the peel. According to FAO data, the annual global production of lemons in 2022 was 21.5 million tons, while that of mandarins (including tangerines, clementines, and satsumas) was 44.2 million tons [3]. The valorization and subsequent utilization of such a large amount of peel that is discarded during the processing of this fruit would have both ecological and economic benefits, supporting sustainable production and the circular economy.
Lemon peels are rich in valuable pectin (about 20% of their dry weight), citric acid, and beneficial biologically active compounds such as vitamins, fiber, pectin, polyphenols, and essential oils [6,7,8]. Tangerine peels are rich in flavonoids (hesperidin, naringin, and tangeretin), phenolic acids, polysaccharides, and essential oil, which have antioxidant, antimicrobial, and anti-inflammatory properties, while also serving as a spice to improve the flavor and extend the shelf life of foods [9,10,11]. Apart from fruit, also in the case of vegetable processing, a large amount of waste skin is generated, which represents a cheap and rich source of bio-components. Onions are the third most important vegetable crop in the world, with an annual production of 98 million tons. In Europe, about 500,000 tons of onion waste is generated. In 2022, onion production in the United States reached 3.2 million tons, with 1.03 million tons directed to processing, resulting in approximately 381,100 tons of onion waste [12]. On the other hand, onion skin contains a significantly higher amount of quercetin and other flavonoids than the inner layers. In addition, it is characterized by antimutagenic, antibacterial, and antioxidant effects.
On the other hand, their short shelf life and absence of a dedicated system for their separate collection and processing lead to their disposal in lagoons, where their degradation results in the emission of significant amounts of greenhouse gases such as CO2 and methane (CH4) [13]. However, with the application of advanced drying and extraction technologies, this kind of waste can be transformed into valuable chemicals with significant applications in the pharmaceutical, food, and cosmetic industries, or for obtaining bioplastics.
To utilize such by-products effectively, one key step is selecting an appropriate extraction method and its parameters. The disadvantages of conventional extraction techniques, such as low yield and high energy consumption, can be addressed by applying modern extraction techniques. Ultrasound-assisted extraction (UAE) relies on cavitation energy to disrupt the cell walls of the plant material, allowing easier penetration of the solvent into the pores of the matrix and more efficient extraction of the desired components [14]. Microwave-assisted extraction (MAE), on the other hand, is based on energy transfer through molecular interactions with an electromagnetic field, leading to rapid energy absorption by the solvent and the material, resulting in prompt heating of the extraction mixture, and thereby increasing the efficiency of the process [15,16].
These modern extraction techniques are increasingly being integrated into industrial practice, especially in highly developed countries that invest significantly in the bio economy. Nonetheless, their application often requires high capital investments, which remains a significant reason why many industries continue to rely on conventional extraction technologies, primarily maceration. However, the disadvantages of maceration can be successfully overcome by replacing traditional solvents with next-generation alternatives, such as natural deep eutectic solvents (NADES). NADES are a mixture of natural, non-toxic, edible components with great potential for application in extracting bioactive components from plants. Research shows that the application of NADES for the extraction of polyphenols from plants [17] or plant by-products [18] has great potential. To ensure high efficiency and economy, in addition to selecting the most appropriate extraction technique for a given plant material, it is also necessary to optimize the process parameters. In this context, the use of state-of-the-art machine learning optimization tools, in particular artificial neural network (ANN) modeling, can be advantageous [19]. So far, ANN models have been used to study the optimal variables for the extraction of bioactive compounds from many different agricultural waste materials: sweet potato peels [20], papaya peels [21], banana peels [22], pomegranate peels [23], orange peels [24], watermelon peels [25], and dragon fruit peels [26]. As far as we are aware, no articles have yet been published on the optimization of the proposed extraction techniques for the selected by-product materials.
The aim of this research was to investigate, predict, and optimize the effects of different extraction techniques, including ultrasound-assisted extraction (UAE), microwave-assisted extraction (MAE), and maceration (MAC) with natural deep eutectic solvents (NADES) on the total bioactive compounds and antioxidant capacity of selected by-products such as apple, lemon, and tangerine peels, and onion skins, using the ANN.
2. Materials and Methods
2.1. Samples
Golden Delicious apples, lemons, tangerines, and onions were purchased from the local market (Novi Sad, Serbia). The plant materials were visually inspected and taxonomically identified based on their morphological characteristics by the authors prior to processing. Once the plant material was washed and peeled, the obtained peels were convectively dried in a single layer on a wire mesh tray, and stored in a drying chamber (Memmert IN160, Schwabach, Germany) at a temperature of 40 ± 1 °C until constant weight. After drying, the samples were finely ground to a powder using a universal laboratory mill (WZ-1, Solem, ZBPP, Bydgszcz, Poland) and stored in airtight containers protected from light and moisture at room temperature until further use. For each extraction, 5 g of plant material was used.
2.2. Extraction Procedures
The plant material was extracted using ultrasound-assisted extraction (UAE), microwave-assisted extraction (MAE), and maceration (MAC) techniques. UAE and MAE were performed with water as a solvent, while MAC was carried out using two different natural deep eutectic solvents (NADES) composed of fructose-glycerol in a 1:4 ratio (MAC1) and choline chloride-glycerol in a 1:2 ratio (MAC2). The choice of NADES systems followed the project’s requirement to apply environmentally friendly and biocompatible solvents. Among several generally recognized as safe (GRAS)-component combinations initially evaluated in our preliminary project screening, the glycerol–fructose–water and choline chloride-glycerol mixtures showed the most suitable physicochemical properties (viscosity, stability) and promising extraction behavior, consistent with trends reported in the literature for phenolic compounds.
UAE was performed in an ultrasonic water bath (Branson, MO, USA), with a sample-to-solvent ratio of 1:15, at 80 °C for 30 min. The UAE parameters were determined during preliminary screening.
The same sample-to-solvent ratio was applied in MAE. MAE was performed in an open system using a modified household microwave (LG Electronics, Inc., Seoul, South Korea) following the method previously described by Zekovic et al. [27]: 1 min preheating at 160 W, 1 min preheating at 320 W, and 30 min extraction at 480 W.
For the MAC extraction, NADES were prepared by heating the components in a water bath at 80 °C, and then placed on a magnetic stirrer hot plate (IKA-Werke GmbH & Co. KG, Staufen, Germany). The mixtures were stirred for approximately 10 min until a stable transparent liquid was formed. Both prepared NADES were stable at room temperature (≈20 °C) for more than seven days. Such obtained NADES were then mixed with the plant material, and extractions were carried out at 80 °C for 30 min following the procedure described in Pavlić et al. [17]. The obtained extracts were stored in a fridge until analysis.
2.3. Determination of Total Phenolic and Flavonoid Content and Antioxidant Activities
The total phenolic content (TPC) of the extracts was determined by the Follin-Ciocalteu method [28,29] and expressed as chlorogenic acid equivalents (mg CAE/g) [30]. The total flavonoid content (TFC) was determined by a spectrophotometric method based on the AlCl3 reaction and expressed as rutin equivalents (mg RE/g) [31].
The antioxidant activity of the extracts was measured using the DPPH radical method [32]. The extracts were mixed with 90 µM DPPH and 96% methanol to achieve final concentrations of 0.01, 0.02, 0.05, 0.1, and 0.2 mg/mL. Such obtained mixtures were incubated at room temperature, and after 60 min, the characteristic purple color gradually shifted to yellow. Immediately thereafter, the absorbance was measured at 515 nm and the inhibitory concentrations (IC50) were calculated.
The reducing power of the extracts was determined according to the method of Oyaizu [33], which is based on the reduction of Fe3+ by the antioxidant compounds present in the tested samples. Extracts of different concentrations (from 0.1 to 1 mg/mL) were mixed with phosphate buffer and potassium ferricyanide, incubated at 50 °C, and then treated with trichloroacetic acid. After centrifugation, the supernatant was mixed with deionized water and 0.1% FeCl3 solution, and the absorbance was measured at 700 nm, with a blank sample prepared with water instead of the extract. Based on absorbance, EC50 concentrations of the extracts were calculated.
2.4. LC-PDA/MS Analysis
Extracts were analyzed qualitatively and quantitatively using an Agilent 1260 LC with PDA detector (Agilent Technologies, Santa Clara, CA, USA), coupled to an Agilent MSD 6100 mass spectrometer (ESI, single quadrupole, Agilent Technologies, Santa Clara, CA, USA). Separation was performed on a Zorbax SB-Aq column (150 × 2.1 mm, 3.5 µm; Agilent Technologies, Santa Clara, CA, USA) at 27 °C. Extracts were dried, reconstituted in water, and 5 µL of 10 mg/mL solution was injected at 0.3 mL/min. Gradient elution used 0.1% formic acid (A) and acetonitrile (B): 0 min 10% B, 20 min 35% B, 25 min 50% B, 33 min 90% B, and 33.5 min 90% B, returning to initial conditions over 1.5 min. Chromatograms were recorded at 220, 280, 320, 350, 370, and 530 nm. UV spectra were collected from 190 to 640 nm. ESI-MS spectra were recorded in positive and negative modes (70–1150 m/z) with the ion chamber at 350 °C, nitrogen flow of 10 L/min, pressure of 40 psi, and capillary voltage of 3500 V; fragmentor voltages of 100 and 250 V were applied.
Compounds were identified by comparing their retention times, UV–vis spectra, and mass spectral data with those of authentic standards and literature data. Quantification was performed using external calibration curves. Compounds were quantified using calibration curves of the corresponding aglycone or structurally related standards and expressed as aglycone equivalents. Specifically, phlorizin was used for the quantification of phlorizin pentoside, and isoquercitrin was used for quercetin glycosides such as spiraeoside. Additional standards used included chlorogenic acid, hesperidin, eriocitrin, naringin, and protocatechuic acid. Details of the analytical conditions and calibration curves are provided in Table S1.
2.5. Statistical Analysis
Statistical analysis, including ANOVA, principal component analysis, cluster analysis, artificial neural network modeling, and sensitivity analysis of the experimental data, was performed using the StatSoft Statistica 14.1.0® software, L-12421988, serial number: JPZ009K288211FAACD-Q. R software v.4.0.3 (64-bit version) was used for color plots.
2.5.1. ANN Modeling
The four ANN models were created to predict and optimize the parameters: TPC, TFC, IC50, and EC50, depending on the by-product material (apple, lemon, and tangerine peels, and onion skins) and extraction technique (UAE, MAE, MAC1, and MAC2).
A multilayer perceptron (MLP) model with input, hidden, and output layers was used to build ANN models with high potential for estimating nonlinear functions, using normalized input and output data to improve performance [34,35].
The artificial neural networks were trained according to the methodology previously described by Brandic et al. [36]. The database collected for the creation of ANN was stochastically divided into training and test sets (with 70% and 30% of the data, respectively). The weight coefficients and biases with respect to the hidden and output layers are represented as matrices and vectors W1 and B1, and W2 and B2, respectively. The structure of the ANN models can be described as follows:
where Y is the output matrix, f1 and f2 are the transfer functions of the hidden and output layers, and X is the input matrix [37].
The weight coefficients W1 and W2 were optimized during the learning cycle to minimize the differences between the data and the ANN models [38].
2.5.2. Global Sensitivity Analysis
Yoon’s global sensitivity equation [39] was used to evaluate the relative influence of selected by-product materials and extraction techniques used on the output variables, including TPC, TFC, IC50, and EC50, in conjunction with the weight coefficients of ANN models:
where w—weight coefficient in ANN model, i—input variable, j—output variable, k—hidden neuron, n—number of hidden neurons, and m—number of inputs.
2.5.3. Error Analysis
The performance of the ANN models was evaluated using several statistical metrics, including the coefficient of determination (r2), reduced chi-square (χ2), mean bias error (MBE), root mean square error (RMSE), mean percentage error (MPE), sum of squared errors (SSE), and average absolute relative deviation (AARD). These indices, calculated using the equations below, quantify the agreement between predicted and observed values and provide an assessment of the model’s accuracy and predictive capability (Šumić et al.) [40]:
where xexp,i denotes the experimental values and xpre,i denotes the present value obtained by the model, and N and n are the number of observations and constants, respectively.
3. Results and Discussion
Total phenolic and flavonoid content and antioxidant activities were determined from concentration–response curves obtained by plotting inhibition percentage against extract concentration. Linearity of the results was evaluated with six-point calibrations over dilutions between 5 and 30% for TPC and TFC, and 3–40% dilutions for EC50 and IC50. The results show a clear concentration-dependent increase in absorbance values for both TPC and TFC across all peels and extraction methods, indicating a consistent and proportional accumulation of phenolic and flavonoid compounds with increasing extract concentration. The similarity between TPC and TFC absorbance values at corresponding concentrations further suggests a strong co-occurrence of these antioxidant constituents. The inhibition percentages for EC50- and IC50-related assays increase monotonically with concentration, approaching complete inhibition (≈100%) at the highest tested levels for all samples. Minor differences among extraction techniques are observed at lower concentrations, where UAE and MAE generally show slightly higher inhibitory effects than MAC-based extractions.
The linear regression analysis demonstrates excellent linearity between extract concentration and both total phenolic content (TPC) and total flavonoid content (TFC) for all peels (Table 1) and extraction techniques, as evidenced by perfect correlation coefficients (r = 1.000). The similarity of the slopes across peels (TPC: 0.016–0.019; TFC: 0.015–0.016) indicates a highly consistent analytical response, suggesting that neither botanical origin nor extraction method significantly affects the linear quantification of phenolic and flavonoid compounds within the studied concentration range. In contrast, the dose–response relationships for EC50 and IC50 values show slightly lower, yet still strong correlations (r = 0.873–0.920), reflecting the expected biological variability inherent in antioxidant activity assays. Among the samples, onion and lemon peels extracted by UAE and MAE exhibit lower EC50 slopes (≈1.39–1.50), indicating higher antioxidant efficiency, as smaller increases in concentration are required to achieve 50% activity. Apple peel extracts, particularly those obtained using MAC1 and MAC2, display higher EC50 slopes (up to 2.066), suggesting comparatively weaker antioxidant responses.

Table 1.
Linearity parameters for TPC, TFC, EC50, and IC50 analysis: correlation coefficients (R), slope, and intercept values of calibration curves.
The influence of extraction techniques (UAE, MAE, and MAC) on bioactive compound extraction from apple, lemon, and tangerine peels, and onion skins, with emphasis on total phenolic content (TPC), total flavonoid content (TFC), and antioxidant activities shown in Table 2. The UAEs consistently showed the highest TPC and TFC values, especially for onion skins (TPC: 5.735 ± 0.558 CAE mg/g; TFC: 1.973 ± 0.112 RE mg/g) and tangerine peels (TPC: 5.399 ± 0.325 CAE mg/g; TFC: 0.921 ± 0.101 RE mg/g), in addition to strong antioxidant activities with IC50 values of 1.080 ± 0.049 mg/mL and 0.118 ± 0.099 mg/mL, respectively. MAE gave competitive results, especially for tangerine peel (TPC: 5.128 ± 0.436 CAE mg/g; TFC: 0.951 ± 0.035 RE mg/g; IC50: 1.429 ± 0.005 mg/mL) and onion skin (TPC: 5.368 ± 0.311 CAE mg/g; TFC: 1.866 ± 0.160 RE mg/g; IC50: 0.140 ± 0.078 mg/mL). In contrast, the maceration methods showed significantly lower extraction efficiency, with apple peels under MAC1 exhibiting the lowest TPC (1.034 ± 0.026 CAE mg/g) and TFC (0.272 ± 0.019 RE mg/g). The antioxidant activities followed a similar trend, with UAE outperforming the other methods in terms of reducing power and DPPH radical scavenging. The observed differences in extraction efficiency may be attributed to the milder operating conditions typical of UAE, in contrast to MAE. Specifically, the high energy input during MAE can lead to the system overheating, potentially degrading thermolabile compounds. In maceration, the choice of solvent appears to play a crucial role. The NADES employed (MAC1 and MAC2) did not demonstrate superior performance compared to water. Although NADES offer certain advantages over conventional organic solvents, water remains a greener and more cost-effective option. Additionally, the lower yields observed in MAC may also be attributed to the absence of auxiliary mechanisms (such as cavitation or electromagnetic interactions), rather than enhanced mass transfer in UAE and MAE. These results emphasize the superiority of UAE for extracting functional compounds, followed by MAE, while maceration proved less effective. NADES have been reported to enhance polyphenol extraction, and their efficiency strongly depends on solvent composition and extraction conditions. In the present study, the selected NADES system likely exhibited higher viscosity than water, which may have reduced mass transfer and solvent penetration into the plant matrix. Additionally, the pH and polarity of the NADES may not have been optimal for the predominant phenolic compounds, and the mild extraction conditions applied for comparability may have further limited its performance. Consequently, under the applied conditions, water proved to be a greener and more cost-effective extraction medium.
Table 2.
Antioxidant activities (experimental design 4 level, 2 factors Graeco-Latin square design).
The analysis by liquid chromatography coupled with UV and MS detection revealed that the UAE extracts of the four starting materials, which showed preferable features compared to MAE and MAC extracts, contained polyphenolic compounds, mostly phenolic acids, flavonoids, and related compounds, as the main constituents (Table 3).
Table 3.
The main phenolic compounds identified in UAE extracts. Flavonoid glycosides were quantified using calibration curves of the corresponding aglycone standards and are expressed as aglycone equivalents.
The predominant constituents identified in the apple peel extract analyzed in this study were phlorizin, its pentoside derivative, and chlorogenic acid, which have also been reported in substantial amounts in the peels of several apple varieties [41,42]. Other compounds, mainly the flavonol quercetin glycosides and procyanidines, were present in minor quantities (Supplementary Material Figure S1, Table S2). Previous research demonstrated that phlorizin and chlorogenic acid correlate only partially with DPPH scavenging and FRAP activity, with other constituents exerting significant influence [43]. These findings suggest that the specific phytochemical composition of the extract examined here may account for its relatively modest antioxidant activity.
The composition of the lemon and tangerine UAE extracts analyzed in this study reflected the typical profile of Citrus flavonoids. This flavonoid group primarily comprises flavanone glycosides, such as hesperidin, eriocitrin, or naringin, which were major compounds in the currently analyzed Citrus peel extracts, accompanied by several flavone and flavonol derivatives and polymethoxylflavones, and are well recognized for their pronounced bioactivities, particularly their antioxidant properties [44,45]. The similar TPC and TFC values and comparable antioxidant efficacy—with the tangerine UAE extract performing slightly better than the lemon UAE extract—are consistent with previous comparisons of Citrus peel extracts [45,46,47].
The most abundant compound in onion skin extract was protocatechuic acid, followed by oxidative products of flavonols and flavonols, among which the most abundant was quercetin glucoside spiraeoside. UV and MS analysis of onion skins extract constituents enabled the identification of several compounds, which are considered as oxidation products of quercetine and its glycosides [48,49,50], as well as only trace amounts of anthocyanin (Supplementary Material Figure S4, Table S4). The oxidative transformation of flavonols, which naturally occurs in onion skins and is related to the preserved activity of certain enzymes [51], significantly affects the composition of the extracts and influences their bioactivity. In several studies, it was found that the presence of oxidation products of quercetin enhances antioxidant and cytoprotective properties of a preparation compared to the initial values [52], which is also confirmed for onion skin extract and quercetin oxidation metabolite 2-(3,4-dihydroxybenzoyl)-2,4,6-trihydroxy-3(2H)-benzofuranone naturally occurring in it [53]. These findings, along with the highest absolute concentrations of the polyphenolic compounds in the onion UAE extract compared with extracts of other materials tested in this study, may explain the best performance of the onion skin extract.
3.1. Correlation Analysis
The results of the color correlation analysis are shown in Figure 1. The size and color of the circles represent the correlation coefficients: blue means positive correlations, red means negative correlations, and the size of the circles increases with the absolute value of the coefficient [54].
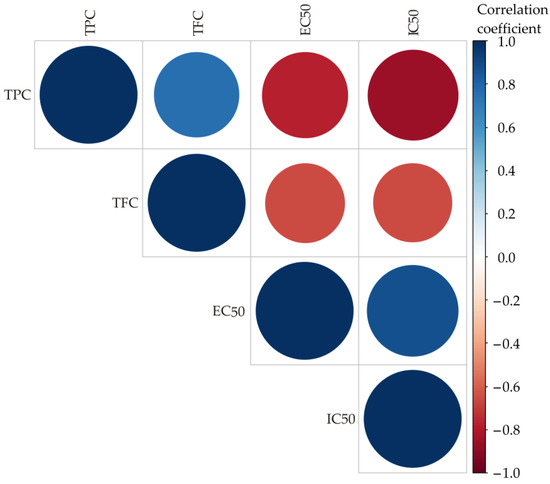
Figure 1.
Color correlation diagram for the TPC, TFC, EC50 and IC50 of the observed samples.
Correlation analysis revealed a strong positive relationship between TPC and TFC (r = 0.7596, p = 0.001), indicating that higher total phenolic content is strongly associated with higher flavonoid content. In addition, TPC correlates negatively with IC50 (r = −0.8581, p = 0.016), indicating that higher phenolic content increases free radical scavenging activity. Similarly, TFC shows a moderate negative correlation with IC50 (r = −0.6507, p < 0.05), emphasizing its contribution to antioxidant activity. In addition, the correlations between TPC and EC50 (r = −0.7769, p < 0.05) and between TFC and EC50 (r = −0.6564, p <0.05) are also negative. In addition, the relationship between EC50 and IC50 is positive (r = 0.8731, p < 0.05). These results emphasize the roles of TPC and TFC in antioxidant properties, especially in radical scavenging, while the reducing power may depend on other constituents present in the extracts as well as other factors.
3.2. Cluster Analysis
Cluster analysis was performed, and the obtained diagram is shown in Figure 2. Cluster analysis of the experimental data revealed two main clusters, showing that the cluster patterns reflect differences depending on the extraction method. The first cluster contained UAE and MAE samples, as these methods were efficient in extracting bioactive compounds, while the second cluster organized maceration methods (MAC1 and MAC2 samples), probably due to their less efficient extraction process. The linkage distance between the main clusters was almost 50.
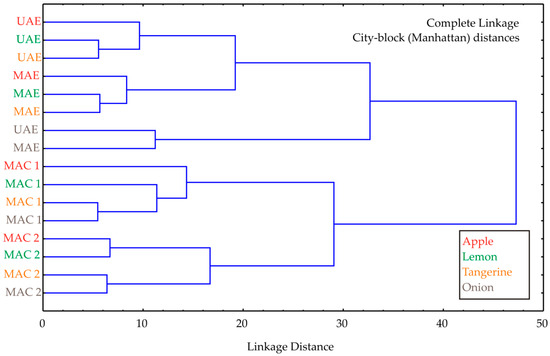
Figure 2.
Cluster analysis of the observed extraction techniques used for the by-product materials investigated.
The cluster analysis was not intended as a primary modeling tool, but rather as a complementary exploratory method to visually confirm grouping trends already indicated by the experimental and ANN results. Its role was to illustrate the similarity patterns among extraction methods and to support the interpretation of how different extraction techniques influence the extraction efficiency of bioactive compounds.
3.3. PCA
The PCA plot of the relationships between TPC, TFC, IC50, and EC50 of the investigated by-product material extracts indicated that 84.48% of the total variance in the observed variables was captured by the first two principal components (Figure 3). PCA analysis showed that the extract samples are grouped by the extraction technique; the UAE and MAE samples are mainly located in the upper left side, while MAC 1 and MAC 2 are located on the right side of the graph. According to the PCA results, the TPC, TFC, and IC50 (which contributed 28.26%, 32.58%, and 27.95% of the total variance, respectively, based on correlations) showed a negative influence on the PC1 coordinate. On the other hand, the EC50 (78.94% of the total variance, based on correlations) negatively influenced the calculation of the PC2. The results indicate that reducing power (EC50) is a distinct antioxidant mechanism, largely independent of TPC and TFC.
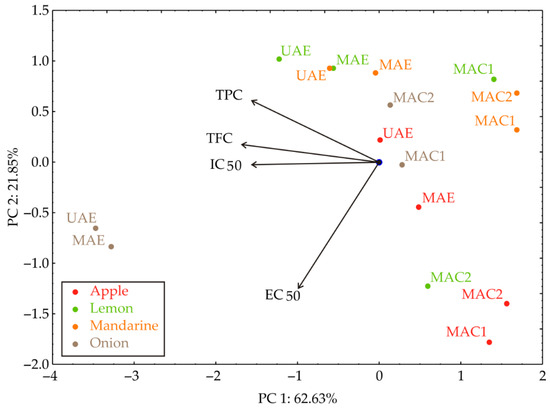
Figure 3.
PCA biplot diagram of the relationships between TPC, TFC, IC50, and EC50 for the observed extracts.
The PCA was not intended as a predictive tool, but rather as an exploratory multivariate method to visualize the interrelationships among antioxidant activity parameters (TPC, TFC, IC50, and EC50) and to confirm grouping tendencies consistent with the extraction techniques. The analysis was included to illustrate how the measured parameters jointly contribute to sample differentiation and to highlight that EC50 represents a distinct antioxidant mechanism, which is less correlated with TPC and TFC, as reflected by its influence along PC2.
3.4. ANN Modeling
The response variables exhibit nonlinear behavior that cannot be fully captured by linear or GLM models. Preliminary analysis showed that many relationships between the two categorical factors and the measured chemical parameters were not adequately described by additive or multiplicative linear terms. In several cases, both the main effects and interactions were statistically significant but did not account for the curvature observed in the response surfaces. Linear models produced high residual errors and poor descriptive ability, indicating that the response variation was not linear across factor levels. Also, in this investigation, the predictors are categorical, and the responses exhibit complex patterns arising from strong interactions between peel type and extraction technique. Linear and GLM models assume additively (or, at most, a limited set of interaction terms), but they were unable to capture the observed multidimensional variation in the chemical and functional response parameters. Residual errors were high and model fit was unsatisfactory for several key responses.
The ANN was not used as a general predictive model, but as a nonlinear “response-surface tool” within a fixed factorial space. Although ANNs include more parameters, their role in this study is not to predict beyond the dataset. Instead, the ANN approximates the multivariate response patterns across the 16 discrete experimental conditions × 3 replications, functioning analogously to a flexible response-surface model.
The ANN structure was deliberately constrained to minimize overfitting. Hidden-layer size was limited to a maximum of 3–6 neurons, and training epochs were restricted based on the inflection point of the learning curves. Repeated training (100,000 independent initializations) was used to ensure stability and reproducibility. These measures significantly reduce the risk of overfitting despite the modest dataset.
The total number of samples is inherently constrained by the experimental design: two categorical factors—peel type (4 levels, i.e., 4 peel types) and extraction technique (4 levels, i.e., 4 extraction techniques) yielded exactly 4 × 4 = 16 unique combinations. Small datasets inherently increase the risk of overfitting in ANN modeling. For this reason, several measures were implemented to minimize overfitting and ensure stable model behavior. Each ANN topology was trained 100,000 times with different random initializations of weights and biases. The topology with 3–6 hidden neurons consistently yielded the highest and most reproducible r2 values across repeated runs. Training behavior (accuracy and loss curves) was closely monitored.
Model applicability was explicitly limited to the studied domain. ANN models with categorical inputs are intended only for interpolation within the narrow experimental domain (in this case, four by-products × four extraction techniques). The models are not extrapolated beyond this range and should be interpreted as nonlinear prediction tools rather than generalized predictors.
The ANN architecture, including biases and weight coefficients, is strongly influenced by the initial assumptions regarding the matrix parameters, which play a critical role in constructing the network and fitting it to the experimental data. Additionally, variations in the number of neurons within the hidden layer can affect the behavior of the model. To address this, each network topology was executed 100,000 times to minimize the impact of random correlations resulting from initial parameter assumptions and weight initialization. Using this strategy, the highest r2 value during the training cycle was achieved with nine neurons in the hidden layer (Figure 4a).
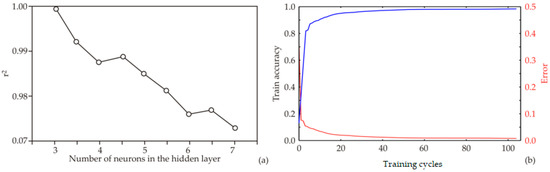
Figure 4.
ANN calculation for HD 205 W: (a) relationship between the r2 value and the number of neurons in the hidden layers of the ANN model; (b) ANN training outcomes for every epoch.
The model was trained over 100 epochs, and the training outcomes—namely, training accuracy and loss—are shown in Figure 4b. Training accuracy improved steadily as the number of epochs increased, reaching an approximately stable value around the 70th to 80th epoch. Maximum training accuracy and minimum loss were observed within this range. Beyond the 80th epoch, minor fluctuations in accuracy and loss suggested the onset of overfitting. Therefore, training for 70 epochs is sufficient to attain high model accuracy while avoiding overfitting, whereas extending training beyond 80 epochs may compromise model generalization. The training accuracy plateaued between the 70th and 80th epoch for all models. Beyond this point, accuracy increased only marginally while loss continued to decrease, a characteristic sign of overfitting. To prevent this, the model was restricted to 70 training epochs, a stage at which the curves still indicate stable learning without divergence. Thus, the final model was explicitly selected before significant overfitting occurred.
For the observed responses (TPC, TFC, EC50, and IC50), four ANN models were conducted separately. Constructing individual models for each response allowed for better prediction accuracy, as each network could specifically capture the unique patterns, scales, and variability inherent to that particular response. This approach ensures that the model parameters, hidden-layer structures, and weight adjustments are optimally tuned for each output, rather than compromising performance by attempting to fit multiple outputs simultaneously with a single network. All developed ANN models and their elements are given in Table 4, Table 5, Table 6, Table 7, Table 8, Table 9, Table 10, Table 11, Table 12, Table 13, Table 14 and Table 15. The developed models are presented in Table 4, Table 7, Table 10, and Table 13, showcasing favorable generalization properties, enabling accurate predictions of observed parameters. The weight coefficients and biases used for ANN model calculations for input parameters are given in Table 5, Table 8, Table 11, and Table 14, while the weight coefficients and biases used for ANN models calculations for output parameters are presented in Table 6, Table 9, Table 12, and Table 15. Based on the ANN model calculations, the optimal number of neurons in the hidden layers was found to be 5, 6, 5, and 7, corresponding to the MLP 8-5-1, MLP 8-6-1, MLP 8-5-1, and MLP 8-7-1 network structures. Additionally, these models demonstrated a high coefficient of determination (r2), with values reaching 0.972, 0.988, 0.969, and 0.975 during the training and 0.995, 0.994, 0.994, and 0.988 for testing phases for ANN1, ANN2, ANN 3, and ANN4, respectively, underscoring the robustness and validity of the models.
Table 4.
Artificial Neural Network model summary (ANN1) (performance and errors) for training and testing cycles for the TPC.
Table 5.
Weight coefficients and biases W1 and B1 for ANN1.
Table 6.
Weight coefficients and biases W2 and B2 for ANN1.
Table 7.
Artificial Neural Network model summary (ANN2) (performance and errors) for training and testing cycles for TFC.
Table 8.
Weight coefficients and biases W1 and B1 for ANN2.
Table 9.
Weight coefficients and biases W2 and B2 for ANN2.
Table 10.
Artificial Neural Network model summary (ANN3) (performance and errors) for training and testing cycles for EC50.
Table 11.
Weight coefficients and biases W1 and B1 for ANN3.
Table 12.
Weight coefficients and biases W2 and B2 for ANN3.
Table 13.
Artificial Neural Network model summary (ANN4) (performance and errors) for training and testing cycles for IC50.
Table 14.
Weight coefficients and biases W1 and B1 for ANN4.
Table 15.
Weight coefficients and biases W2 and B2 for ANN4.
3.4.1. Model Validation
The performance of the proposed ANN models was assessed using several metrics, including reduced chi-square (χ2), root mean square error (RMSE), mean bias error (MBE), mean percentage error (MPE), total squared error (SSE), average absolute relative deviation (AARD), and the coefficient of determination (r2) (Table 16). The lower values of χ2 indicating better agreement between predicted and experimental data (values below 10 were considered acceptable for ANN model performance). Although ANN4 exhibited slightly higher χ2 value (6.172) compared to the other models, it remained within the acceptable range and was accompanied by low RMSE and high r2 values, confirming its satisfactory predictive capability.
Table 16.
“Goodness of fit” tests for the created ANN models.
The results indicate that all ANN models successfully passed minor lack-of-fit tests, demonstrating their effectiveness in predicting the analyzed parameters. The ANN1 model achieved slightly higher coefficients of determination for TPC prediction. However, all ANN models provided accurate predictions for the observed parameters (Figure 5).
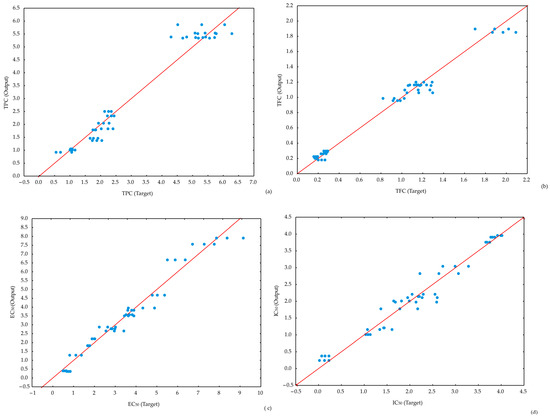
Figure 5.
Experimentally obtained and ANN models delivered value comparison for: (a) TPC, (b) TFC, (c) EC50, and (d) IC50.
All MLP architectures exhibited comparable trends in learning curves and stability across repeated trainings, indicating that the high r2 values are not artifacts of a single overfitted model but reflect the strong inherent structure of the experimental dataset.
3.4.2. Global Sensitivity Analysis
Figure 6 illustrates the effects of different by-product materials used for extraction and extraction techniques on bioactive compounds and antioxidant activities using a sensitive analysis—Yoon’s interpretation method. The sensitivity analysis revealed that among the selected by-product materials, onion skin exhibited the most positive influence, with the highest for TFC (+21.78%) and antioxidant activity, IC50 (+21.08) and EC50 (+16.62). On the other hand, tangerine peel showed the highest negative relative influence, especially in reducing power with EC50 (−30.41%) and TCF (−14.02%).
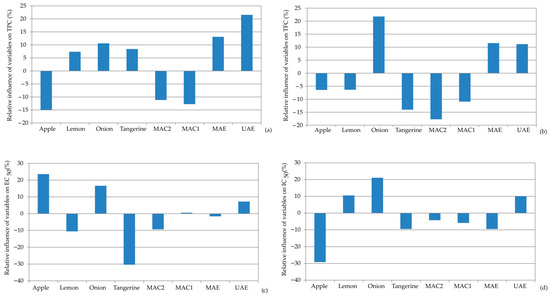
Figure 6.
Relative importance of the by-product waste material used for extraction and the extraction techniques on: (a) TPC, (b) TFC, (c) EC50, and (d) IC50.
Among the extraction methods, UAE was the most influential, demonstrating the highest relative influence on TPC (+21.55%) and TCF (+11.17%), along with antioxidant capacity for EC50 (+7.22%) and IC50 (+10.08%). MAE also showed a positive relative influence on TPC (+13.10%) and TFC (+11.55%), but a negative influence on antioxidant activity (EC50: −1.61% and IC50: −9.50%). The maceration extraction techniques (MAC1 and MAC2) showed a negative relative influence for all observed parameters.
3.4.3. Optimization
In this investigation, a simple optimization procedure, such as using standard scores, could have been applied to identify the best-performing sample. However, after the ANN model was developed, the purpose of optimization was not merely to determine the optimum, but to evaluate whether the ANN model can consistently reproduce the experimental ranking and support multivariate decision-making. The optimization step was used as a nonlinear validation test of the ANN, to maximize the outputs of all four ANN models. By integrating all output variables simultaneously through the trained networks, the procedure examines whether the model can reconstruct the experimentally observed optimum without relying on single ANN model. The fact that the ANN-based optimization identified the same best condition confirms that the model captures the multivariate structure of the data and is internally consistent with the experimental results.
The optimization of the ANN outputs was performed by employing the results presented in Table 4, Table 5 for ANN1, Table 7 and Table 8 for ANN 2, Table 10 and Table 11 for ANN 3, and Table 13 and Table 14 for ANN 4, using Equation (1). One of the aims of this research was to optimize the TFC, TPC, EC50, and IC50, with the ANN models by utilizing the input variables (extraction technique and the type of plant waste material). The optimization was achieved using ANN1, ANN2, ANN3, and ANN4 models with the number of generations reaching 87, 63, 74, and 82, respectively. The population size for each input variable was defined as 100, and the Pareto front was represented by 50 points. Optimization using the ANN model identified sample 13 as the most favorable. To validate this result, the Standard Score method was applied, calculating the optimal score as the average across all measured parameters. Sample 13 achieved the highest overall Z-score of 0.994, indicating the best combination of the evaluated responses (Figure 7). Sample 14 was also highly rated with a combined Z-score of 0.972.
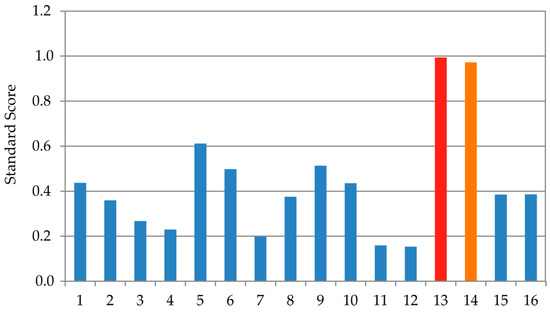
Figure 7.
Evaluation of the samples 1–16 using Z-score methodology.
Analysis through ANN optimization together with the Standard Score approach pointed to the same result: sample 13 prepared using UAE for the onion skin sample. The observed values for antioxidant assays for an optimal sample of onion skin extract were found to be TPC 5.735 ± 0.558 CAE mg/g, TFC 1.973 ± 0.112 RE mg/g, EC50 0.549 ± 0.076 mg/mL, and IC50 0.108 ± 0.049 mg/mL. The optimized onion skin extracts, i.e., sample 13 obtained by UAE procedure and sample 14 obtained by MAE, had a very similar qualitative composition, with only minor quantitative differences. The most abundant compound in both extracts was protocatechuic acid (283 µg/mL UAE and 299 µg/mL MAE), followed by quercetin glucoside spiraeoside (170 µg/mL UAE and 168 µg/mL MAE).
3.4.4. ANN Models Limitations
Although the developed ANN models demonstrated high predictive performance within the available dataset, certain limitations should be acknowledged. The relatively small number of experimental data points restricted the model’s capacity for broad generalization and increased the risk of overfitting. Consequently, the ANN predictions should be interpreted primarily as interpolations within the tested experimental domain rather than as universally applicable forecasts. In addition, since the input data were obtained under controlled laboratory conditions and represent a limited range of extraction techniques and plant materials, the model’s applicability to other systems or operational scales remains to be verified. Despite these constraints, the ANN approach effectively captured nonlinear interactions among variables and provided valuable insights into parameter importance and optimal extraction trends. Future studies using larger, more diverse datasets are necessary to improve model robustness and ensure greater predictive reliability.
3.4.5. Practical Applications
Although ultrasound-assisted extraction (UAE) and microwave-assisted extraction (MAE) showed higher efficiencies than maceration, their large-scale implementation remains challenging. The scale-up of UAE may be limited by equipment cost and non-uniform ultrasonic energy distribution in large volumes, while MAE requires careful control of microwave heating and presents safety and economic constraints at higher scales. In contrast, maceration, despite its lower efficiency, remains easier to implement industrially. In addition, the availability, variability, and regulatory status of agricultural by-products such as onion skins and fruit peels may limit their industrial use. Variations in raw material composition and compliance with local regulations concerning sourcing, safety, and traceability must be considered when transferring laboratory-scale extraction protocols to commercial applications. Nevertheless, the high efficiency of UAE, particularly for onion skin, combined with ANN-based optimization, highlights its strong potential for sustainable by-product valorisation, warranting further pilot-scale and techno-economic studies.
4. Conclusions
This study revealed that among modern extraction techniques, ultrasound-assisted extraction is the most suitable for recovering bioactive compounds from selected by-product materials, especially for onion skin and tangerine peels. The slightly less efficient technique was microwave-assisted extraction, while macerations demonstrated significantly lower extraction efficiencies.
The results of the cluster and principal component analyses confirmed distinct patterns for different extraction techniques and by-product materials, highlighting the differences in the efficiency of ultrasound-assisted extraction and microwave-assisted extraction compared to maceration.
The correlation analysis exhibited a strong positive correlation between total phenolic content and total flavonoid content, as well as their negative correlations with radical scavenging activity, and with reducing power for the observed samples.
All developed ANN models were highly effective at predicting and optimizing extraction outcomes, with models exhibiting high accuracy and minor errors.
The sensitivity analysis results showed that the onion skin was the most beneficial by-product material, while UAE was the most influential extraction technique, significantly improving TPC, TFC, and antioxidant capacity.
Based on the results, the optimal sample was prepared using the ultrasound-assisted extraction technique for the onion skin.
These findings underscore the potential ANN-based optimization for the efficient utilization of agricultural by-products, contributing to the revalorization of food processing residues.
Future studies could further improve ANN modeling and apply this approach to other by-product materials and bioactive compounds.
Supplementary Materials
The following supporting information can be downloaded at: https://www.mdpi.com/article/10.3390/separations13010009/s1, Table S1. Calibration curves of standard compounds used quantitave LC-PDA/MS analysis; Table S2. Retention time (Rt), UV (λmax) and MS (m/z) spectral data of the compounds identified in apple peel UAE extract; Table S3. Retention time (Rt), UV (λmax) and MS (m/z) spectral data of the compounds identified in lemon peel UAE extract; Table S4. Retention time (Rt), UV (λmax) and MS (m/z) spectral data of the compounds identified in tangerine peel UAE extract; Table S5. Retention time (Rt), UV (λmax) and MS (m/z) spectral data of the compounds identified in onion skins UAE extract; Figure S1. Chromatogram of apple peel UAE extract recorded at 280 nm (peak numberings correspond to those in Table S2); Figure S2. Chromatogram of apple peel UAE extract recorded at 280 nm (peak numberings correspond to those in Table S3; Figure S3). Chromatogram of tangerine peel UAE extract recorded at 280 nm (peak numberings correspond to those in Table S4); Figure S4. Chromatogram of onion skins UAE extract recorded at 280 nm (peak numberings correspond to those in Table S5).
Author Contributions
Conceptualization, M.P. and A.C.K.; methodology, B.L., A.C.K. and J.A.; software, B.L.; validation, S.P.; formal analysis, B.L., A.C.K., J.A. and M.P.; investigation, B.L., A.C.K., J.A. and M.P.; resources, M.P.; data curation, B.L.; writing—original draft preparation, B.L., J.A., S.Đ.M. and S.R.; writing—review and editing, B.L., A.C.K., J.A., M.P. and S.R.; visualization, M.P.; supervision, S.P. and S.R.; project funding acquisition and project leadership, S.R. All authors have read and agreed to the published version of the manuscript.
Funding
This research was supported by the Science Fund of the Republic of Serbia, #GRANT No 7464, Novel Bio-linked Magnetite/geopolymer Composites in Phenol-containing Wastewater Treatment: Toward Zero-waste Technology-BioCompWaterClean.
Institutional Review Board Statement
Not applicable.
Informed Consent Statement
Not applicable.
Data Availability Statement
The original contributions presented in this study are included in the article/Supplementary Materials. Further inquiries can be directed to the corresponding author.
Conflicts of Interest
The authors declare no conflicts of interest.
References
- Jiang, H.; Zhang, W.; Xu, Y.; Chen, L.; Cao, J.; Jiang, W. An advance on nutritional profile, phytochemical profile, nutraceutical properties, and potential industrial applications of lemon peels: A comprehensive review. Trends Food Sci. Technol. 2022, 124, 219–236. [Google Scholar] [CrossRef]
- Villamil-Galindo, E.; Piagentini, A.M. Sequential ultrasound-assisted extraction of pectin and phenolic compounds for the valorisation of ‘Granny Smith’apple peel. Food Biosci. 2022, 49, 101958. [Google Scholar] [CrossRef]
- FAO. Apple Production—FAOSTAT Statistical Database. Food and Agriculture Organization of the United Nations. 2024. Available online: https://www.fao.org/faostat/en/#data/QCL (accessed on 12 June 2025).
- Zahid, H.F.; Ali, A.; Ranadheera, C.S.; Fang, Z.; Ajlouni, S. Identification of phenolics profile in freeze-dried apple peel and their bioactivities during in vitro digestion and colonic fermentation. Int. J. Mol. Sci. 2023, 24, 1514. [Google Scholar] [CrossRef]
- Van Nguyen, S.; Lee, B.K. Multifunctional nanocomposite based on polyvinyl alcohol, cellulose nanocrystals, titanium dioxide, and apple peel extract for food packaging. Int. J. Biol. Macromol. 2023, 227, 551–563. [Google Scholar] [CrossRef]
- Dambuza, A.; Rungqu, P.; Oyedeji, A.O.; Miya, G.M.; Kuria, S.K.; Hosu, S.Y.; Oyedeji, O.O. Extraction, Characterization, and Antioxidant Activity of Pectin from Lemon Peels. Molecules 2024, 29, 3878. [Google Scholar] [CrossRef]
- Meydanju, N.; Pirsa, S.; Farzi, J. Biodegradable film based on lemon peel powder containing xanthan gum and TiO2–Ag nanoparticles: Investigation of physicochemical and antibacterial properties. Polym. Test. 2022, 106, 107445. [Google Scholar] [CrossRef]
- Rahman, M.N.; Islam, M.N.; Mia, M.M.; Hossen, S.; Dewan, M.F.; Mahomud, M.S. Fortification of set yoghurts with lemon peel powders: An approach to improve physicochemical, microbiological, textural and sensory properties. Appl. Food Res. 2024, 4, 100386. [Google Scholar] [CrossRef]
- Al hamza Hasoon, B.A.; Mahmood, B.S.; Mohamed, E.A.; Jabir, M.S.; Jawad, K.H.; Hussein, N.N.; Sulaiman, G.M.; Dewir, Y.H.; Mendler-Drienyovszki, N. Tangerine fruit peel extract mediated biogenic synthesized silver nanoparticles and their potential antimicrobial, antioxidant, and cytotoxic assessments. Green Process. Synt. 2024, 1, 20240126. [Google Scholar] [CrossRef]
- El Barnossi, A.; Moussaid, F.; Housseini, A.I. Tangerine, banana and pomegranate peels valorisation for sustainable environment: A review. Biotechnol. Rep. 2021, 29, e00574. [Google Scholar] [CrossRef]
- Ben Hsouna, A.; Sadaka, C.; Generalić Mekinić, I.; Garzoli, S.; Švarc-Gajić, J.; Rodrigues, F.; Morais, S.; Moreira, M.M.; Ferreira, E.; Spigno, G.; et al. The chemical variability, nutraceutical value, and food-industry and cosmetic applications of citrus plants: A critical review. Antioxidants 2023, 12, 481. [Google Scholar] [CrossRef]
- USDA-NASS. Vegetables 2022 Summary. 2023. Available online: https://www.nass.usda.gov/AgCensus/ (accessed on 14 May 2025).
- Bayar, Y.; Gavriletea, M.D.; Sauer, S.; Paun, D. Impact of municipal waste recycling and renewable energy consumption on CO2 emissions across the European Union (EU) member countries. Sustainability 2021, 13, 656. [Google Scholar] [CrossRef]
- Cvetanović, A.; Švarc-Gajić, J.; Zeković, Z.; Jakšić, A. Chemical and biological insights on aronia stems extracts obtained by different extraction techniques: From wastes to functional products. J. Supercrit. Fluids 2017, 124, 18–28. [Google Scholar] [CrossRef]
- Mansouri, F.E.; Silva, J.C.E.; Cacciola, F.; Asraoui, F.; Tayeq, H.; Ben Amar, Y.M.; Lovillo, M.P.; Chouaibi, N.; Brigui, J. Evaluation of different extraction methods on the phenolic profile and the antioxidant potential of Ceratonia siliqua L. pods extracts. Molecules 2022, 27, 6163. [Google Scholar] [CrossRef] [PubMed]
- Nebolisa, N.M.; Umeyor, C.E.; Ekpunobi, U.E.; Umeyor, I.C.; Okoye, F.B. Profiling the effects of microwave-assisted and soxhlet extraction techniques on the physicochemical attributes of Moringa oleifera seed oil and proteins. Oil Crop Sci. 2023, 8, 16–26. [Google Scholar] [CrossRef]
- Pavlić, B.; Mrkonjić, Ž.; Teslić, N.; Kljakić, A.C.; Pojić, M.; Mandić, A.; Stupar, A.; Santos, F.; Duarte, A.R.C.; Mišan, A. Natural deep eutectic solvent (NADES) extraction improves polyphenol yield and antioxidant activity of wild thyme (Thymus serpyllum L.) extracts. Molecules 2022, 27, 1508. [Google Scholar] [CrossRef]
- Teslić, N.; Santos, F.; Oliveira, F.; Stupar, A.; Pojić, M.; Mandić, A.; Pavlić, B.; Kljakić, A.C.; Duarte, A.R.C.; Paiva, A.; et al. Simultaneous hydrolysis of ellagitannins and extraction of ellagic acid from defatted raspberry seeds using natural deep eutectic solvents (NADES). Antioxidants 2022, 11, 254. [Google Scholar] [CrossRef]
- Bello, U.; Amran, N.A.; Ruslan, M.S.H.; Yáñez, E.H.; Suparmaniam, U.; Adamu, H.; Abba, S.I.; Tafida, U.I.; Mahmoud, A.A. Enhancing oxidative stability of biodiesel using fruit peel waste extracts blend: Comparison of predictive modelling via RSM and ANN techniques. Results Eng. 2024, 21, 101853. [Google Scholar] [CrossRef]
- Cao, F.; Chen, X.; Huang, A.; Hu, J.; Yang, D. Optimisation of ultrasonic-assisted enzyme extraction to analyse total flavonoids and antioxidant activity of purple potato using response surface and artificial neural networks model. Int. Food Res. J. 2025, 32, 552. [Google Scholar] [CrossRef]
- Chy, M.W.R.; Ahmed, T.; Iftekhar, J.; Islam, M.Z.; Rana, M.R. Optimization of microwave-assisted polyphenol extraction and antioxidant activity from papaya peel using response surface methodology and artificial neural network. Appl. Food Res. 2024, 4, 100591. [Google Scholar] [CrossRef]
- Aklilu, E.G. Modeling and optimization of pectin extraction from banana peel using artificial neural networks (ANNs) and response surface methodology (RSM). J. Food Meas. Charact. 2021, 15, 2759–2773. [Google Scholar] [CrossRef]
- Rakshit, M.; Srivastav, P.P. Optimization of pulsed ultrasonicimization extraction of punicalagin from pomegranate (Punica granatum) peel: A comparison between response surface methodology and artificial neural network multiobjective genetic algorithm. J. Food Process. Preserv. 2021, 45, e15078. [Google Scholar] [CrossRef]
- Gupta, R.; Singh, A.; Nema, P.K.; Roy, T.; Kumar, S.; Kumar, A.P. Implementation of RSM and ANN Optimization Approach for Natural Deep Eutectic Solvents-Based Extraction of Bioactive Compounds from Orange Peel. ACS Omega 2024, 9, 34880–34892. [Google Scholar] [CrossRef]
- Al-Gheethi, A.; Sundram, N.; Crane, R.; Alburihi, A.; Mohamed, R.M.S.R.; Al-Shaibani, M.M.; Noman, E.A.; Ponnusamy, S.K.; Kamil, N.A.F.M. Metronidazole photocatalytic degradation by zinc oxide nanoparticles synthesized in watermelon peel extract; advanced optimization, simulation and numerical models using machine learning applications. Environ. Res. 2022, 212, 113537. [Google Scholar] [CrossRef]
- Raj, G.B.; Dash, K.K. Ultrasound-assisted extraction of phytocompounds from dragon fruit peel: Optimization, kinetics and thermodynamic studies. Ultrason. Sonochemistry 2020, 68, 105180. [Google Scholar] [CrossRef]
- Elez Garofulić, I.; Malin, V.; Repajić, M.; Zorić, Z.; Pedisić, S.; Sterniša, M.; Smole Možina, S.; Dragović-Uzelac, V. Phenolic profile, antioxidant capacity and antimicrobial activity of nettle leaves extracts obtained by advanced extraction techniques. Molecules 2021, 26, 6153. [Google Scholar] [CrossRef]
- Saptarini, N.M.; Pratiwi, R.; Maisyarah, I.T. Colorimetric method for total phenolic and flavonoid content determination of fig (Ficus carica L.) leaves extract from West Java, Indonesia. Rasayan J. Chem. 2022, 15, 600–605. [Google Scholar] [CrossRef]
- Foss, K.; Przybyłowicz, K.E.; Sawicki, T. Antioxidant activity and profile of phenolic compounds in selected herbal plants. Plant Foods Hum. Nutr. 2022, 77, 383–389. [Google Scholar] [CrossRef] [PubMed]
- Horax, R.; Hettiarachchy, N.; Islam, S. Total phenolic contents and phenolic acid constituents in 4 varieties of bitter melons (Momordica charantia) and antioxidant activities of their extracts. J. Food Sci. 2005, 70, C275–C280. [Google Scholar] [CrossRef]
- Dias, M.C.; Pinto, D.C.; Silva, A.M. Plant flavonoids: Chemical characteristics and biological activity. Molecules 2021, 26, 5377. [Google Scholar] [CrossRef]
- Espin, J.C.; Soler-Rivas, C.; Wichers, H.J. Characterization of the total free radical scavenger capacity of vegetable oils and oil fractions using 2,2-diphenyl-1-picrylhydrazyl radical. J. Agric. Food Chem. 2000, 48, 648–656. [Google Scholar] [CrossRef] [PubMed]
- Oyaizu, M. Studies on products of browning reaction—Antioxidative activities of products of browning reaction prepared from glucosamine. Jpn. J. Nutr. Diet. 1986, 44, 307–315. [Google Scholar]
- Sahoo, M.; Dey, S.; Sahoo, S.; Das, A.; Ray, A.; Nayak, S.; Subudhi, E. MLP (multi-layer perceptron) and RBF (radial basis function) neural network approach for estimating and optimizing 6-gingerol content in Zingiber officinale Rosc. in different agro-climatic conditions. Ind. Crops Prod. 2023, 198, 116658. [Google Scholar]
- Jawad, J.; Hawari, A.H.; Zaidi, S.J. Artificial neural network modeling of wastewater treatment and desalination using membrane processes: A review. Chem. Eng. J. 2021, 419, 129540. [Google Scholar] [CrossRef]
- Brandić, I.; Pezo, L.; Bilandžija, N.; Peter, A.; Šurić, J.; Voća, N. Artificial neural network as a tool for estimation of the higher heating value of miscanthus based on ultimate analysis. Mathematics 2022, 10, 3732. [Google Scholar] [CrossRef]
- Puntarić, E.; Pezo, L.; Zgorelec, Ž.; Gunjača, J.; Kučić Grgić, D.; Voća, N. Prediction of the production of separated municipal solid waste by artificial neural networks in Croatia and the European Union. Sustainability 2022, 14, 10133. [Google Scholar] [CrossRef]
- Hassanien, A.E.; Abouelmagd, L.M.; Mahmoud, A.S.; Darwish, A. An optimized backpropagation neural network models for the prediction of nanomaterials concentration for purification industrial wastewater. Eng. Appl. Artif. Intell. 2023, 126, 107010. [Google Scholar] [CrossRef]
- Yoon, G.H. Transient sensitivity analysis and topology optimization of particle suspended in transient laminar fluid. Comput. Methods Appl. Mech. Eng. 2022, 393, 114696. [Google Scholar] [CrossRef]
- Šumić, Z.; Tepić Horecki, A.; Pezo, L.; Pavlić, B.; Nastić, N.; Milić, A. Comprehensive Analysis and Optimization of Peach (Prunus persica) Vacuum Drying: Employing Principal Component Analysis, Artificial Neural Networks and the Standard Score Approach. Processes 2024, 12, 2643. [Google Scholar] [CrossRef]
- Vitiello, M.; Braca, A.; De Leo, M.; Fraternale, D. Profiling specialized metabolites of two Malus domestica Borkh. varieties: In vitro pulp callus culture vs fruit peel and pulp. Sci. Hortic. 2024, 338, 113821. [Google Scholar] [CrossRef]
- Horvacki, N.M.; Milinčić, D.D.; Jović, M.D.; Dramićanin, A.M.; Fotirić-Akšić, M.M.; Pešić, M.B.; Milojković-Opsenica, D.M. Bioassay-guided evaluation of antimicrobial properties and profile of bioactive compounds from leaf, peel and mesocarp of four apple cultivars (Malus domestica Borkh.) grown in Serbia: Application of HPTLC-EDA and UHPLC Q-ToF MS techniques. Food Chem. 2025, 467, 142336. [Google Scholar] [CrossRef]
- Cvetković, B.; Bajić, A.; Belović, M.; Pezo, L.; Dragojlović, D.; Šimurina, O.; Djordjević, M.; Korntheuer, K.; Philipp, C.; Eder, R. Assessing antioxidant properties, phenolic compound profiles, organic acids, and sugars in conventional apple cultivars (Malus domestica): A chemometric approach. Foods 2024, 13, 2291. [Google Scholar] [CrossRef]
- Schlappack, T.; Kappacher, C.; Rainer, M.; Huck, C.W.; Bonn, G.K. New sensitive ambient mass spectrometric method combined with chemometric modelling for the analysis of Equisetum palustre L. contaminations in the traditional herb Equiseti herba. J. Appl.Res. Med. Aromat. Plants 2022, 30, 100396. [Google Scholar] [CrossRef]
- Li, P.; Xu, Y.; Qingqing, Z.; Xia, M.; Tao, Z.; Qing, G. Citrus peel flavonoid extracts: Health-beneficial bioactivities and regulation of intestinal microecology in vitro. Front. Nutr. 2022, 9, 888745. [Google Scholar] [CrossRef]
- Chen, Q.; Wang, D.; Tan, C.; Hu, Y.; Sundararajan, B.; Zhou, Z. Profiling of Flavonoid and Antioxidant Activity of Fruit Tissues from 27 Chinese Local Citrus Cultivars. Plants 2020, 9, 196. [Google Scholar] [CrossRef]
- Carullo, G.; Ramunno, A.; Sommella, E.M.; De Luca, M.; Belsito, E.L.; Frattaruolo, L.; Brindisi, M.; Campiglia, P.; Cappello, A.R.; Aiello, F. Ultrasound-assisted extraction, chemical characterization, and impact on cell viability of food wastes derived from Southern Italy autochthonous Citrus fruits. Antioxidants 2022, 11, 285. [Google Scholar] [CrossRef]
- Elattar, M.M.; Hammoda, H.M.; Ghareeb, D.A.; Abdulmalek, S.A.; Abdelrahim, F.A.; Seif, I.A.K.; Dawood, H.M.; Darwish, R.S. Insights into bioactive constituents of onion (Allium cepa L.) waste: A comparative metabolomics study enhanced by chemometric tools. BMC Complement. Med. Ther. 2024, 24, 271. [Google Scholar] [CrossRef]
- Veiko, A.G.; Lapshina, E.A.; Zavodnik, I.B. Comparative analysis of molecular properties and reactions with oxidants for quercetin, catechin, and naringenin. Mol. Cell. Bioch. 2021, 476, 4287–4299. [Google Scholar] [CrossRef]
- Sagar, N.A.; Pareek, S.; Benkeblia, N.; Xiao, J. Onion (Allium cepa L.) bioactives: Chemistry, pharmacotherapeutic functions, and industrial applications. Food Front. 2022, 3, 380–412. [Google Scholar] [CrossRef]
- Celano, R.; Docimo, T.; Piccinelli, A.L.; Gazzerro, P.; Tucci, M.; Di Sanzo, R.; Carabetta, S.; Campone, L.; Russo, M.; Rastrelli, L. Onion peel: Turning a food waste into a resource. Antioxidants 2021, 10, 304. [Google Scholar] [CrossRef]
- Speisky, H.; Arias-Santé, M.F.; Fuentes, J. Oxidation of quercetin and kaempferol markedly amplifies their antioxidant, cytoprotective, and anti-inflammatory properties. Antioxidants 2023, 12, 155. [Google Scholar] [CrossRef]
- Fuentes, J.; Arias-Santé, M.F.; Atala, E.; Pastene, E.; Kogan, M.J.; Speisky, H. Low nanomolar concentrations of a quercetin oxidation product, which naturally occurs in onion peel, protect cells against oxidative damage. Food Chem. 2020, 314, 126166. [Google Scholar] [CrossRef]
- Petković, M.; Filipović, V.; Lončar, B.; Filipović, J.; Miletić, N.; Malešević, Z.; Jevremović, D. A comparative analysis of thin-layer microwave and microwave/convective dehydration of chokeberry. Foods 2023, 12, 1651. [Google Scholar]


Disclaimer/Publisher’s Note: The statements, opinions and data contained in all publications are solely those of the individual author(s) and contributor(s) and not of MDPI and/or the editor(s). MDPI and/or the editor(s) disclaim responsibility for any injury to people or property resulting from any ideas, methods, instructions or products referred to in the content. |
© 2025 by the authors. Licensee MDPI, Basel, Switzerland. This article is an open access article distributed under the terms and conditions of the Creative Commons Attribution (CC BY) license.