Abstract
The extensive use of antiviral substances (SASs) during and after the COVID-19 pandemic has increased their release into wastewater systems, raising concerns regarding their persistence and potential ecotoxicological effects. The primary objective of this study was to isolate bacterial strains from activated sludge (AS) that possess the ability to biodegrade SASs. From the AS sample, three bacterial species, Comamonas testosteroni (I2), Bacillus amyloliquefaciens (I3) and Bacillus mycoides (I4), were successfully isolated and identified. These strains were subsequently applied in biodegradation experiments targeting seven SASs: daclatasvir (DCV), darunavir (DRV), favipiravir (FAV), lopinavir (LOP), remdesivir (REM), ritonavir (RIT), and umifenovir (UMI). During the experiments, residual SAS concentrations, microbial growth parameters, physicochemical indicators and ecotoxicity were monitored. All three strains demonstrated substantial biodegradation potential, achieving reductions exceeding 90% for most tested compounds, with particularly low toxicity observed in experiments conducted with AS and Bacillus amyloliquefaciens. These findings highlight the relevance of AS-derived bacteria as promising candidates for enhancing SAS removal in wastewater treatment processes.
1. Introduction
The global outbreak of COVID-19 greatly accelerated the development, approval, and large-scale use of antiviral substances (SASs). During this period, several substances, including interferon-based therapies, lopinavir/ritonavir (LOP/RIT), ribavirin, chloroquine phosphate, arbidol, remdesivir (REM), and more recently nirmatrelvir/RIT and molnupiravir were introduced, repurposed, or clinically evaluated for their antiviral activity [1,2]. Recent analyses further indicate that the global annual demand for key SASs increased dramatically during the pandemic, with favipiravir (FAV) alone reaching production levels exceeding 10,000 tons per year due to large-scale national procurement programs, while REM, LOP/RIT and darunavir (DRV) collectively accounted for several thousand tons annually [3,4]. Although their clinical use has declined in the post-pandemic period, multiple environmental monitoring studies report that several of these pharmaceuticals, including REM, RIT, LOP and umifenovir (UMI), continue to be detected in wastewater, indicating ongoing environmental inputs and potential ecological risks. These trends underscore the relevance of SASs as an emerging group of environmental contaminants and a significant focus of current research.
A review of the available research papers highlights a significant lack of data regarding the presence, fate, and behavior of SASs in the environment. Such data are essential for accurately assessing the environmental risks posed by these compounds. SASs present in the environment commonly originate from three main sources: pharmaceutical manufacturing effluents, hospital wastes, and their direct disposal into water (unused, unwanted, or out-of-date) [5]. In addition to the parent compounds of SASs, their metabolites and unmetabolized forms can also be discharged into wastewater systems, since they are metabolized in the human body only by 60%. Due to the absence of specialized removal units, municipal wastewater treatment plants (WWTPs) are not completely efficient at removing pharmaceuticals and compounds such as SASs [6]. Concentrations in the environment before the COVID-19 pandemic of selected daclatasivir (DCV), DRV, FAV, LOP, REM, RIT, and UMI are largely unknown, since their usage was low, and there was no need for their monitoring at the time. Available data for surface waters before 2019 shows detected low amounts of FAV (40–60 ng/L) in Japan and LOP (305 ng/L) in South Africa. Their concentrations, as well as those of DRV, REM, RIT, and UMI, were studied after the peak of the COVID-19 pandemic at the main sources of various WWTPs and were found to be very low, ranging from ng/L to high μg/L levels (Table 1) [7]. Nevertheless, even at low concentrations, several SASs exhibit persistent behavior in the environment and have the potential to contribute to the development of antiviral-resistant viral strains [2]. This is largely attributed to their chemical structures (Figure 1) and physicochemical properties, particularly the octanol–water partition coefficient (logP), which ranges from 1.76 to 5.22 for the selected SASs, except for FAV, for which it is 0.49. This parameter reflects hydrophobicity and, in this case, lipophilicity, values above zero indicate a tendency for bioaccumulation, sorption to solids, and persistence in aquatic environments [8]. Furthermore, the reported removal efficiencies for several SASs remain limited, and for some substance, such as DCV, environmental occurrence and degradation behavior have not yet been investigated. These gaps highlight the importance of understanding the biodegradation potential of microorganisms capable of transforming or removing SASs from wastewater systems, especially because their high bioactivity and toxicity mean that even low environmental concentrations may pose risks to aquatic organisms and ecosystem stability [2,9]. This further reinforces the need to elucidate their biodegradation pathways, a concern supported by studies and recent in silico models demonstrating pronounced toxic effects. Khan et al. (2023) [9] predicted very low EC50 values for algae ranged from 10.55 mol/L for LOP, 11.72 mol/L for RIT and 9.42 mol/L for UMI. Similarly, predicted EC50 values for Daphnia magna ranged from 6.91 mol/L for LOP, 11.72 mol/L for RIT, and 9.42 mol/L for UMI, while predicted LC50 values for fish ranged between 16.58 mol/L for LOP, 6.33 mol/L for RIT, and 6.21 mol/L for UMI. These values reflect harmful effects at minimal doses and highlight the environmental relevance of SASs [9].

Table 1.
Concentrations of SASs detected in environment and wastewater before and after the peak of COVID-19 pandemic [8,10,11,12,13].
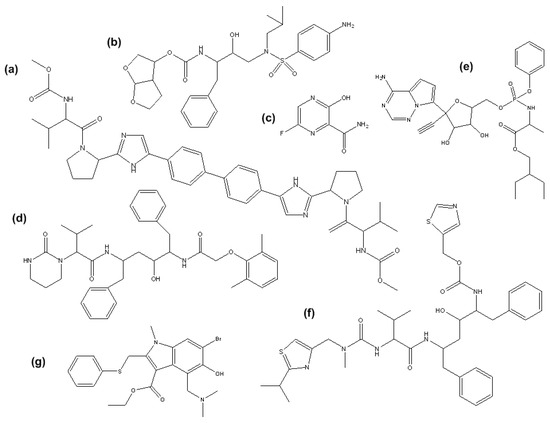
Figure 1.
Chemical structures of: (a) DCV; (b) DRV; (c) FAV; (d) LOP; (e) REM; (f) RIT; (g) UMI.
Microorganisms represent a key removal pathway for SASs in wastewater environments, as these compounds can undergo metabolic and co-metabolic transformation mediated by diverse enzymatic activities [14,15,16,17]. Reported removal efficiencies of SASs by activated sludge (AS) vary considerably, with very low removal of FAV (1.9%) and REM (2.1%), but much higher biodegradation observed for LOP (92%), RIT (93%), and UMI (87%) [8]. Although numerous studies have demonstrated that microalgae and aquatic plants (e.g., Chlorella vulgaris, Scenedesmus obliquus, Lemna minor) can remove or transform various pharmaceuticals, particularly antibiotics and other commonly detected contaminants, no experimental data to date report the removal or biodegradation of the SASs examined in this work by these organisms. This highlights a significant knowledge gap and underscores the central role of microbial degradation in SAS removal, given that insufficient elimination in WWTPs may lead to the continuous release of bioactive and potentially ecotoxic compounds into aquatic environments, posing risks to ecosystem health and public safety [18].
The aim of this work was to conduct two experiments: the isolation and identification of bacteria from AS polluted with SASs (P1), and the biodegradation of SASs by isolated bacteria and AS (P2), to determine the most effective bacterial strain for the biodegradation of SASs under controlled laboratory conditions over 48 h. To evaluate removal efficiency in the P2 experiments, it was also important to accurately determine the low concentration values of SASs due to their poor water solubility. For this purpose, ultra-high-performance liquid chromatography (UHPLC) methods were developed for each SAS and used for their detection and quantification.
2. Materials and Methods
2.1. Materials
The SASs used in this study were: DCV (98%, p.a., Angene Chemicals, Secunderabad, India), DRV (98% p.a., AmBeed, Buffalo Grove, IL, USA), FAV (98% p.a., Indagoo Research Chemicals, Madrid, Spain), LOP (98% p.a., Indagoo Research Chemicals, Madrid, Spain), REM (98% p.a., Biosynth, Bratislava, Slovakia), RIT (98% p.a., Indagoo Research Chemicals, Madrid, Spain), and UMI (98% p.a., Indagoo Research Chemicals, Madrid, Spain). SASs stock solutions were prepared in sterile volumetric flasks by weighing the required amount of each SASs into the appropriate medium. Working solutions were prepared by diluting stock solutions. For the P1 experiment, the SASs were dissolved in water, while for the P2 experiments they were dissolved in mineral medium [19]. The maximum water-soluble concentrations of the SASs, determined by water solubility testing, were as follows: LOP, REM, and RIT at 2.00 μmol/L; FAV and DRV at 0.20 mmol/L; DCV at 0.10 mmol/L; and UMI at 0.10 μmol/L. To enhance the solubility of UMI in mineral medium, 1% dimethyl sulfoxide (DMSO, Thermo Fischer Scientific, USA) was used.
AS was collected at the municipal WWTP in Zagreb, Croatia. The AS consisted of 99.52% water.
2.2. Methods
2.2.1. Determination of SAS Concentrations by UHPLC
SAS concentration during the experiment was determined by UHPLC analysis using the Vanquish Core HPLC system (Thermo Fisher Scientific, USA) equipped with a Vanquish Pump (Binary Pump F, VF-P10-A-01), Vanquish Solvent Monitor, Vanquish Sampler (Split Sampler FT, VF-A10-A-02), Vanquish Column Compartment (Vanquish Column Compartment C, VC-C10-A-03), and Vanquish Detector (Diode Array Detector FG, VF-D11-A-01). The mobile phases used were Milli-Q water with 0.1% formic acid (phase %A) and acetonitrile (phase %B). The concentration of SASs was determined using methods with an XBridge C18 3.5 μm (2.1 × 150 mm) column at a flow rate of 0.250 mL/min for each SAS, except for UMI, for which the flow rate was 0.500 mL/min. Table 2 shows the analysis parameters of the developed methods, including their corresponding UV absorption wavelengths for detection and percentages of mobile phase %B. Sample preparation included filtering 1 mL through sterile round filter paper (0.45 µm) with the addition of 10% methanol immediately before filtration to ensure the solubility of SASs. The exact initial concentrations of DRV, DCV, FAV, LOP, REM, RIT, and UMI were 0.68, 1.30, 0.80, 0.65, 0.60, 0.78, and 0.80 μmol/L, respectively. The concentrations of SAS were quantified using compound-specific calibration curves prepared from standard solutions diluted in methanol. The dilution effect introduced by the addition of 10% methanol prior to sample filtration was incorporated into all calculations. Each sample was analyzed in triplicate, and final concentrations were expressed as the arithmetic mean ± standard deviation.
Table 2.
UHPLC analysis parameters of developed methods for SASs (DCV, DRV, FAV, LOP, REM, RIT, UMI).
2.2.2. Determination of Ecotoxicity
The assessment of acute toxicity before and after the biodegradation process (Experiment P2) was performed using the Gram-negative marine bacterium Aliivibrio fischeri, following the procedure outlined in ISO 11348-1:2007, Water Quality—Determination of the inhibitory effect of water samples on the light emission of Aliivibrio fischeri (luminescent bacteria test). Prior to analysis, samples were filtrated by membrane filtration through sterile 0.45 µm pore-size filter papers (ReliaDisc™; Ahlstrom-Munksjö, Helsinki, Finland) to obtain the aqueous fraction suitable for testing.
Temperature control for all measurements was ensured with a LUMIStherm thermostat, while luminescence generated by the bacterial cells was recorded using a LUMIStox 300 luminometer (Dr. Lange GmbH, Hannover, Germany). A linear dilution series was applied, and each toxicity test was conducted over a 30 min exposure period.
The bacterial culture used in the assay was subcultured 24 h prior to testing on a growth medium formulated specifically for A. fischeri, ensuring optimal viability and standardized physiological conditions. Before initiating the measurements, the baseline luminescence of the bacterial suspension was confirmed to be approximately 3000 relative light units for all assays to maintain consistency across experiments.
A 2% NaCl solution served as the control. The ratio between the initial and final (30 min) luminescence values of bacteria in the control solution was used to derive a correction factor (f) for adjusting the initial luminescence (L0) of the test samples. Following the 30 min exposure, the luminescence of each test sample (L30) was recorded, and the percentage of luminescence inhibition (INH) was calculated using Equation (1). All toxicity measurements were performed in triplicate to ensure reproducibility, and mean values were used for data interpretation.
2.2.3. Physical and Chemical Characterization of AS
To characterize the AS, the pH value, dissolved oxygen concentration (DO), conductivity, temperature, moisture content, dry matter and volatile matter content, were determined. The concentration of DO, conductivity and pH value were measured using DO electrode, conductivity electrode and pH electrode to the WTW Multi 340i, WTW, Weilheim, Germany. Mixed liquor suspended solids (MLSS) and mixed liquor volatile suspended solids (MLVSS) were also determined [20]. To achieve a higher initial MLSS, the AS was concentrated by centrifugation (Universal 320/320R, Hettich®, Tuttlingen, Germany) at 3500× g rpm and 0 °C for 10 min.
2.2.4. Determination of Colony Forming Unit (CFU) and Optical Density (OD)
Colony forming unit (CFU) of bacteria and fungi were determined using the pour plate method [21]. Nutrient agar was used for growth of bacteria and malt agar for fungi. The plates were incubated at 37 °C for 24–48 h to cultivate bacteria and at 28 °C for 3–5 days to cultivate fungi. After incubation, the number of colonies on the agar plates was counted.
The optical density (OD) of the suspensions was determined spectrophotometrically (DR/2400 Portable Spectrophotometer, Hach, Loveland, CO, USA) at a wavelength of λ = 600 nm so that the initial CFU was 106 cells/mL.
2.3. Experiments
2.3.1. Isolation and Identification of SASs-Tolerant Microorganisms from AS (P1)
The isolation and identification of SAS-tolerant microorganisms (Experiment P1) was carried out in sterilized 250 mL Erlenmeyer flasks containing 86 mL of AS and 2 mL of each SAS at its maximum soluble concentration, resulting in a final working volume of 100 mL. No additional carbon source was supplied to the system. The flasks were incubated for 48 h at room temperature under continuous shaking (160 rpm) (PSU-20i, Biosan, Riga, Latvia) to ensure homogeneous exposure, and the initial physicochemical conditions are summarized in Table 3. Upon completion of the experiment, the CFU was determined as described in Section 2.2.4. Subsequently, morphologically distinct and highly dominant bacterial and fungal colonies were selected and transferred to appropriate agar media. Bacterial isolates were incubated at 37 °C for 24–48 h, whereas fungal isolates were incubated at 28 °C for 3–5 days to allow for sufficient growth and differentiation. Transfers to new plates were repeated until pure cultures were obtained. Pure isolates were stored on slant agar for characterization. Biochemical tests (catalase, oxidase, and nitrate reductase), KOH test, Gram and Schaeffer-Fulton staining, and motility test were performed on the pure bacterial cultures. Bacterial cell morphology of the bacteria was observed under a light microscope (Olympus B 201, Tokyo, Japan), and identification was carried out using API (Analytical profile index, bioMérieux, Lyon, France), API 20 NE for Gram-negative bacteria and API 50 CHB for Gram-positive bacteria. The identification was performed using the online software available at https://apiweb.biomerieux.com/login. The final stage of bacterial identification was carried out using matrix-assisted laser desorption/ionization time-of-flight mass spectrometry (Microflex LT MALDI-TOF MS, Bruker Daltonics, Bremen, Germany). This technique relies on protein profiling from a pure microbial culture through pulsed ionization of analytes, combined with a TOF mass analyzer, allowing for accurate determination of protein masses. Yeast was identified using API 20 C AUX (Analytical Profile Index, BioMérieux, Lyon, France), while the morphological characteristics of mold were determined using procedures described in the Introduction to Industrial Mycology [22]. Isolates were labeled as I1-I6. Although bacterial isolate I1 was successfully identified, it was not used in the P2 experiment. This was due to its slow growth on nutrient agar and persistant contamination of the culture. Furthermore, since the focus of this work was on the bacterial potential for biodegradation of SASs, the fungal isolates (I5, I6) were not investigated further. Accordingly, bacterial isolates were cultivated on nutrient agar at 37 °C for 24 h. For the preparation of suspensions, 24 h bacterial cultures were used, and suspensions were prepared in mineral medium.
Table 3.
Initial conditions in exp. P1.
2.3.2. Biodegradation of SASs by Autohtonus Bacteria and AS (P2)
In the P2 experiment, the biodegradation potential of the isolated bacterial strains and AS was evaluated. Three identified bacterial cultures, Comamonas testosteroni (I2), Bacillus amyloliquefaciens (I3), and Bacillus mycoides (I4), and AS were used as inocula. For each SAS, six experimental setups were prepared in triplicate: (i) bacterial culture I2 with mineral medium and SAS, (ii) bacterial culture I3 with mineral medium and SAS, (iii) bacterial culture I4 with mineral medium and SAS, (iv) AS with mineral medium and SAS, (v) blank controls consisting of each bacterial isolate or AS in mineral medium without SAS, and (vi) negative controls containing each SAS in mineral medium without microorganisms. The working volume was 100 mL. Sterile 250 mL flasks contained 50 mL of SAS stock solution, an appropriate volume of bacterial culture suspension or AS, and mineral medium. Mineral medium has been prepared according to Kyaw et al. [19], with the composition of (1 L): 12.5 g K2HPO4, 3.8 g KH2PO4, 1 g (NH4)2SO4, 0.1 g MgSO4 · 7 H2O, and 5 mL of trace elements including H3BO3, ZnSO4 · 6 H2O, FeSO4(NH4)2SO4 · 6 H2O, CoSO4 · 7 H2O, (NH4)6Mo7O24 · 4 H2O, CuSO4 · 5 H2O, MnSO4 · 4 H2O. The initial concentrations were 1.00 μmol/L for all tested SASs except UMI, for which it was 0.10 μmol/L. The flasks were covered with foil to prevent possible photodegradation of the SASs and placed on a rotary shaker at 160 rpm (Heidolph Unimax 1010, Heidolph Incubator 1000, Schwabach, Germany) for 48 h at room temperature. The initial conditions are shown in Table 4. During the experiment, the following parameters were determined: CFU, OD, SAS concentration, DO concentration, pH, conductivity, MLSS, and MLVSS. Permanent smears of bacteria and native smears of AS were microscopically examined every 24 h using a light microscope (Olympus B 201, Tokyo, Japan). CFU of bacteria was monitored every 24 h by the pour plate method [21].
Table 4.
Initial conditions for biodegradation of SASs by autohtonus bacteria and AS (exp. P2).
2.4. Data Analysis
All experiments were conducted in biological triplicates. Data are expressed as mean ± standard deviation (SD), calculated from the three independent biological replicates. Experimental data were processed in Excel 2016 software (Microsoft Corporation, Redmond, WA, USA).
3. Results and Discussion
3.1. Characterization of the AS
Before setting up the isolation (P1) and biodegradation (P2) experiments, the physicochemical characterization of the AS was performed. The results (Table 5) show a high percentage of water in the AS, low dry matter, and moderate volatile matter content [23]. Volatile matter is crucial for the biological activity of the AS process, as it provides the energy source for microorganisms that degrade pollutants [24]. Other parameters are presented in Table 3 of Section 2.3.1, including pH, which is also a crucial parameter for controlling biological processes in wastewater treatment and should be in the range of 6.5–8.5. Neutral pH is suitable for the growth of bacteria, and accordingly, the concentration of dissolved oxygen is low because bacteria consume the oxygen for their growth [25,26]. Furthermore, the conductivity of AS is a key indicator of water quality, reflecting the concentration of dissolved ions and salts [27]. The results show that the AS sample has a neutral pH value, low conductivity, and low oxygen levels.
Table 5.
Results of the physicochemical characterization of the AS.
Microscopic observations were conducted to examine the morphology and structure of the flocs, as well as the presence of organisms in the AS before and after SASs exposure (Figure 2). AS is in the form of flocs, which are aggregates of suspended solids containing various groups of microorganisms and organic or inorganic particles. [28] Microscopic examination showed that the floc structure remained compact after exposure to the SASs, with no observable disruption or disintegration. Furthermore, no negative effects were detected on the microorganisms present within the activated sludge, indicating that the tested SAS concentrations did not adversely affect the integrity or viability of the microbial community.
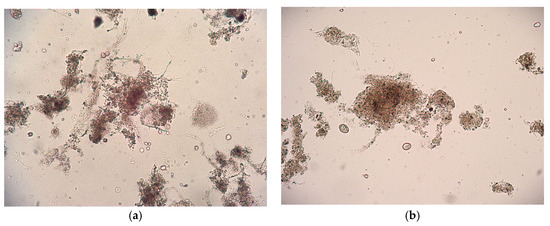
Figure 2.
Microphotograph of AS (a) before biodegradation experiments; (b) after SASs exposure obtained by light microscope at magnification, M = 100×.
3.2. Isolation and Identification of Microorganisms from AS Polluted with SASs
In the first experiment, P1, microorganisms were isolated from AS containing SASs. Isolation was performed by serial dilutions (from 10−1 to 10−7) and the most frequent microorganisms at each dilution were purified using the streaking method. The isolated microorganisms are listed in Table 6.
Table 6.
The list of isolated and identified microorganisms from AS that contained SASs.
The most frequent microorganisms in AS were bacteria, as confirmed by CFU values. The CFU for bacteria was 1.1·105 cells/mL, while the CFU for fungi (including molds and yeasts) was 2.6·104 cells/mL. This is not surprising, since bacteria are the main microorganisms in the AS community [29]. In addition to bacteria, other organisms such as fungi, algae, protozoa and metazoa are also present in AS. However, AS contains more than 95% bacteria [21]. The most dominant bacterial genera in AS are Alcaligenes, Bacillus, Brevibacterium, Comamonas, Pseudomonas, and Zoogloea [30].
After obtaining pure cultures, the next step was to identify each isolated microorganism. Pure bacterial cultures were streaked on nutrient agar plates to examine their morphological characteristics (Figure 3 and Figure 4). Colonies of isolate I1 had a regular round shape and an orange color due to an intracellular pigment. This bacterium grew slowly on nutrient agar. Isolate I2 showed better growth on nutrient agar, forming translucent colonies with smooth surfaces and regular round shapes. Isolate I3 produced white to cream-colored, flat, mucoid colonies with a ground-glass appearance on nutrient agar. Isolate I4 formed distinctive, hairy, expansive colonies with swirling patterns (Figure 3). Yeast I5 formed cream-colored, dry, and wrinkled colonies with radial fissures. Mold I6 exhibited white mycelial growth with a pink center (Figure 4).
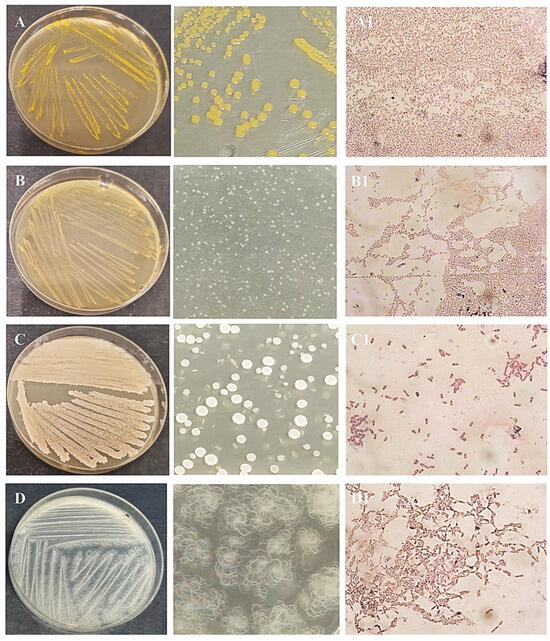
Figure 3.
Obtained pure culture by streaking method and microphotographs of Gram staining of bacteria isolates I1 (A,A1), I2 (B,B1), I3 (C,C1), and I4 (D,D1), M = 1000×.
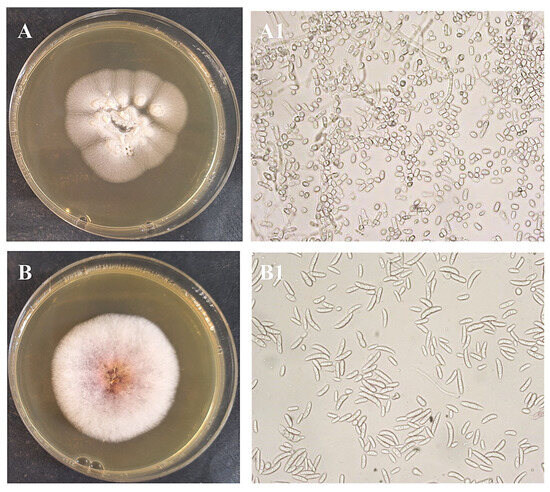
Figure 4.
Obtained pure culture by streaking method and microphotographs of fungi isolates I5 (A,A1), and I6 (B,B1), M = 400×.
According to cell morphology observed under a light microscope, all four bacteria (I1-I4) were rod-shaped. This was determined by Gram staining, an essential technique in microbiology that is based on their cell wall structure. After staining, cells of isolates I1 and I2 appeared red, while cells of isolates I3 and I4 appeared purple. Accordingly, I1 and I2 were Gram-negative bacteria, while I3 and I4 were Gram-positive bacteria. These results were also confirmed by the KOH test. Furthermore, Schaeffer-Fulton is important for visualizing spores, which microorganisms with resistance to various pollutants and conditions [31]. Endospore formation was observed in isolates I3 and I4, but not in I1 and I2. Another important property for bacteria is motility, which allows them to move from harmful to non-harmful environments. Bacteria are motile if they possess flagella [32]. Isolates I1-I3 were motile, while I4 lacked this ability. The motility test was performed using semisolid agar and the stab technique.
Biochemical tests catalase, oxidase and nitrate-reductase were performed for each bacterial isolate. The results of these tests are listed in Table 7. Oxidase is an enzyme that protects cells from oxidative stress, isolates I1, I2, and I4 possess this enzyme, while I3 not. Catalase is an enzyme that enables bacteria to resist H2O2, while nitrate-reductase facilitates the reduction in nitrate to nitrite. Isolate I1 have catalase but lacks nitrate-reductase. Isolates I2 and I3 have all three tested enzymes. In general, biochemical tests indicate the enzymatic content of bacteria, which is important because enzymes play a key role in biochemical reactions and enable microorganisms to degrade pollutants.
Table 7.
Results of staining, KOH test, motility and biochemical tests for each isolate of bacteria.
Bacterial identification was performed according to the API database, the bacteria were identified as Brevundimonas vesicularis (93.7%), Comamonas testosteroni (86.8%), Bacillus subtilis/amyloliquefaciens (99.9%), and Bacillus mycoides (80.4%), respectively. Brevundimonas species are aerobic, Gram-negative, oxidase- and catalase-positive, non-fermenting rods motile by a single short polar flagellum [33]. Brevundimonas spp. have been isolated from various environments, including soils, aquatic habitats, and AS [33,34]. Given that Brevundimonas vesicularis has been recovered from a wide range of clinical sources, including eye, urine, wound, central nervous system, and cervical specimens [35], its detection in AS is consistent with its known ecological versatility. This species has also been identified as a potential bioremediator of polyaromatic hydrocarbons, capable of degrading SASs [36]. I2 is an aerobic, rod-shaped, Gram-negative bacterium that is oxidase positive, motile, nonspore-forming, non-glucose fermenting, and arranged singly or in pairs [37]. Formerly known as Pseudomonas testosteroni, but it was renamed as I2 because it can use testosterone as its sole carbon source [37]. I2 has also been detected in water from in use hospital oxygen humidifier reservoirs, urine, mucus, prostate tissue and stool [37]. This bacterium plays a key role in the biological cycling of nutrients in environments and in the bioremediation of polluted environments [38]. The I2 strain CNB-1 was isolated from AS, consistent with this study. It has also been investigated for the bioremediation of chloronitrobenzene-polluted soil, indicating its bioremediation potential [38]. I3 have been isolated from fruit fly larvae and soil and are known for their strong antagonistic activity against several soil borne fungal plant pathogens [39,40]. I3 has also been identified as one of the most efficient strains for the treatment of crude oily sludge, demonstrating a high capacity for hydrocarbon biodegradation [41]. I4, named for its fungal-like colony morphology on agar plates where chains of rod-shaped cells form radiating filaments that curve left or right [42], has been isolated from petroleum-contaminated soil and exhibits similar hydrocarbon-degrading potential [43].
Yeast identification was performed using the API 20 C AUX system. The cupules of the API strip were inoculated with a standardized yeast suspension, and the strips were incubated at 28 °C for 72 h. Following incubation, the results were interpreted according to the manufacturer’s instructions; cupules exhibiting greater turbidity than the control were considered positive reactions. Trichosporon mucoides (I5), a yeast-like fungus, was identified with a probability of 63.8%. Trichosporon spp., which are found in soil, vegetation, animal feces, and stagnant or fresh water, have a worldwide distribution. They may colonize human skin as well as the digestive, respiratory, and urinary tracts, and from there reach municipal wastewater and eventually WWTPs [44]. This yeast grows on either glucose or phenol and is able to transform biphenyl into smaller intermediate products indicating its biodegradation potential [45].
The identification of the mold isolate I6 (Figure 4) was performed by microscopic examination of native smears and by studying cell morphological characteristics using the procedures defined in the Introduction to Industrial Mycology. In this study, Fusarium sp. (I6) was also isolated from AS collected from a WWTP in China [46]. Moreover, I6 are increasingly recognized for their bioremediation potential, particularly in degrading hydrocarbons [47,48].
3.3. Biodegradation of SASs
The biodegradation of selected SASs was conducted using three bacteria isolated from AS: I2, I3, and I4, as well as experiments with AS.
Several factors influence the biodegradation process, including pH, oxygen concentration, substrate concentration, bacterial CFU, and the presence of ecotoxic substances that may inhibit bacterial growth and reduce biodegradation efficiency [49,50]. Therefore, the concentrations of DO, pH, and conductivity were monitored to gain better insight into the biodegradation process. Table A1. shows the concentration of DO during the P2 experiment. In all tests, oxygen levels increased until the 24th hour and then declined by the 48th hour. Compared to the controls, for I2, oxygen levels decreased for DRV, FAV, LOP, and RIT, while other SAS maintained stable oxygen levels. Oxygen levels for I3 experiments remained unchanged, while for I4 concentration of DO decreased for DCV, DRV, FAV, and UMI, and did not increase for LOP, REM, and RIT. For the AS sample, oxygen levels of DCV, REM, RIT, and UMI decreased compared to the control samples. The oxygen level data obtained during the process can be interpreted as an indicator of microbial oxygen consumption associated with biodegradation activity. During biodegradation, microorganisms utilize available oxygen, resulting in a measurable decrease in oxygen concentration. In the absence of biodegradation, oxygen levels remain relatively stable, showing only minor fluctuations [51]. The observed oxygen profiles were consistent with the increases in CFU and OD values of isolate I2 for DRV, as well as with the CFU values of isolate I4 for DCV and DRV.
The monitored pH and conductivity in all experiments showed little or no fluctuation. pH values remained consistently around 7.29 ± 0.21 for controls and 7.29 ± 0.22 for the I2, I3, I4, and AS samples. Conductivity for controls was 15.17 ± 3.72 mS/cm, while for I2, I3, and I4 samples it was approximately 15.16 ± 3.92 mS/cm. For the AS sample, conductivity was lower than in the isolated bacteria samples, as expected, with values of 14.44 ± 0.91 mS/cm for the AS control and 14.44 ± 1.27 mS/cm for the AS sample. (Table A1) pH is an important parameter for biodegradation because bacteria generally prefer a neutral pH range. Additionally, pH affects enzyme activity, which is crucial for the biochemical reactions involved in the process [52]. The highest pH value, 7.55, was detected for DRV of the I4 isolate after 48 h, compared to the control value of 7.25. A significant increase was also observed in the I2 sample for DCV, with a 0.10 difference between the sample and the control (sample 7.55; control 7.45). Conductivity is also an important parameter, as it indicates substrate mineralization and reflects the presence of degradation products in the solution. An increase in conductivity typically suggests the formation of ionic byproducts resulting from the breakdown of organic matter [53]. The highest increase in conductivity was observed for REM, with a difference of 2.43 for the I2 isolate and 2.15 for the I3 isolate compared to the control samples.
Based on the OD of the bacterial suspension, which was measured spectroscopically, the biodegradation experiment was set up. It was important that the OD was at an appropriate value so that initial CFU reached 106 cells/mL. This parameter was monitored over the 48 h of experiment P2 (Table A1). At 48th hour, the OD for isolate I2 increased compared to the control for DCV, DRV, and RIT, while lower values compared to the control were observed for FAV, LOP, and REM. The initial OD for the I2 bacteria was approximately 0.10, with the highest detected value being 0.18 for two SASs: for DRV after 5 h and RIT after 24 h. For isolate I3, the initial OD was 0.05, and the greatest increase was observed for REM after 48 h, with a value of 0.16 compared to the control at 0.09. In addition to REM, DRV also showed a higher OD for isolate I3 compared to other SASs, whose OD decreased relative to the control. Isolate I4 had an initial OD of approximately 0.15, and its value increased for all SASs except for FAV and UMI. The highest OD for isolate I4 was observed for REM (control 0.09; sample 0.16). To sum up, OD increased for bacteria I2 with three SASs, for I3 with two SASs, and for I4 with five SASs. In other words, the OD of I2 increased with DCV, DRV, and RIT. I3 showed increased OD compared to the control with DRV, and REM, while I4 showed increased OD for most of the selected SASs: DCV, DRV, LOP, REM, and RIT. However, OD is not a reliable parameter for monitoring bacterial growth during biodegradation, as it reflects the total cell density, including both viable and non-viable cells, whereas only viable cells contribute to biodegradation. Therefore, CFU determination provides a more accurate indicator of bacterial growth. Changes in CFU values were monitored during the 48 h of the SASs biodegradation experiment and are shown in Figure 5. In Figure 5g, a 1% DMSO control was included, as it was used as the initial solution for UMI due to its low water solubility. It was observed that 1% DMSO had no effect on the CFU of any tested isolates. The number of Gram-negative bacteria I2 after 48 h was higher compared to the control for REM (initial: 4.2 × 10⁶; 48 h: 7.3 × 10⁶ cells/mL), while for FAV, DCV, DRV, and UMI, did not change. LOP and RIT were exceptions, as the number of these bacteria declined compared to the control, especially for RIT (2.0 × 10⁵ cells/mL) which decreased significantly compared to the control (8.7 × 10⁵ cells/mL). The number of Gram-positive bacteria I3 increased for DCV (from an initial 9.5 × 10⁶ cells/mL to 1.0 × 10⁷ cells/mL at 48th hour), DRV (initial: 8.4 × 10⁶ cells/mL, 48 h: 9.4 × 10⁶ cells/mL), FAV (initial: 8.4 × 10⁶ cells/mL, 48 h: 8.7 × 10⁶ cells/mL), and LOP (from an initial 9.5 × 10⁶ cells/mL to 1.1 × 10⁷ cells/mL at 48th hour). In the experiment with REM, the CFU declined compared to the control, and for RIT and UMI, it remained the same. The number of Gram-positive bacteria I4 increased for DCV, DRV, and REM, but decreased for UMI, and did not significantly change for FAV (initial CFU value: 3.1 × 10⁶ cells/mL; 48 h: 3.7 × 10⁶ cells/mL), LOP (initial CFU: 1.7 × 10⁶ cells/mL; end of experiment: 5.4 × 10⁶ cells/mL), and RIT (initial: 3.9 × 10⁶ cells/mL; 48 h: 5.8 × 10⁶ cells/mL). These findings indicate that the tested bacterial isolates adapted to the conditions of the SASs and utilized them as sources of carbon and energy, consistent with previous reports on the removal of mixed pharmaceuticals by other researchers [54]. However, isolates I2, I3, and I4 did not exhibit the same level of efficiency and/or were unable to degrade all tested SASs, particularly in cases where CFU values were lower than those of the control [55,56].
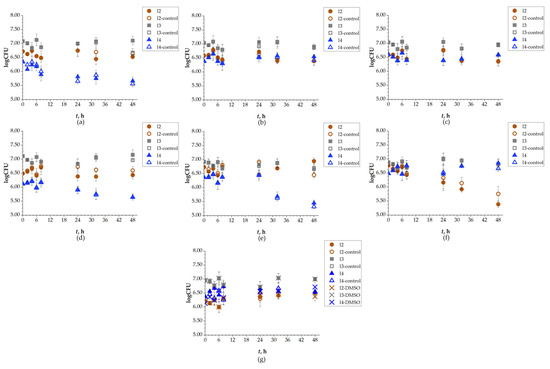
Figure 5.
Changes in logarithmic CFU values of isolates I2, I3 and I4, during 48 h of biodegradation of: (a) DCV; (b) DRV; (c) FAV; (d) LOP; (e) REM; (f) RIT; (g) UMI.
The concentration of AS in the system was monitored using the MLSS parameter (Figure 6). The initial MLSS values were selected based on the typical range, which generally varies between 2 and 3 g/L. The initial value in this experiment was 3.77 ± 0.48 g/L. In AS systems, MLSS tends to increase during active biodegradation due to the accumulation of both microbial biomass and inert solids. MLSS increased for all SASs during the 48 h of the P2 experiment compared to the controls. The highest MLSS was detected for LOP, with a value of 6.00 g/L compared to the control value of 5.43 g/L after 48 h. MLVSS also increased, ranging from 80% to 90%, as a result of the proliferation of active microorganisms involved in organic matter breakdown [51]. These MLVSS results indicate a successful active biodegradation process and higher activity of microorganisms, as well as their consumption of SASs [57]. Accordingly, the MLNVSS percentage decreased throughout the experiment. This can be compared to the measured conductivity, which correlates with MLNVSS, or, in other words, inorganic matter content. Conductivity, as previously discussed, showed no change or only a slight change in value for all SASs. For most samples, these values decreased slightly which correlates with the mentioned MLNVSS trend.
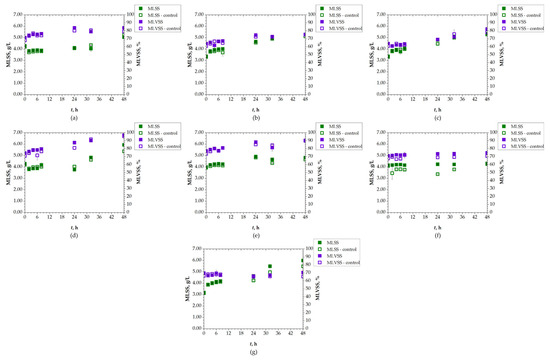
Figure 6.
Changes in MLSS and MLVSS of AS during 48 h of biodegradation of: (a) DCV; (b) DRV; (c) FAV; (d) LOP; (e) REM; (f) RIT; (g) UMI.
Permanent bacterial smears were examined under a light microscope throughout the P2 process (initial, 24 h, and 48 h), as well as native smears of AS, to observe any potential morphological changes. No changes were detected compared to the initial morphological microphotograph. In other words, the results at the 48th hour indicate that SASs have no effect and cause no changes in the shape, color, or size of the bacteria.
The concentration of SASs was determined by chromatographic analysis using seven methods developed on a Vanquish UHPLC system, all of which achieved satisfactory linearity coefficients (R2 ≥ 0.999). Although not all concentrations could be quantified due to the method’s limit of quantification, results can still be discussed from the perspective of SAS removal. Concentrations of SAS decreased in all P2 experiments, indicating successful removal by biodegradation. However, observed removal percentages varied for each studied SAS depending on the isolate used (I2, I3, I4, AS) (Figure 7). The most successful isolates for removal (>90%) were I2 and I4 for RIT (I2: 95.06%; I4: 91.16%), I2 for REM (93.33%), and AS for DRV (91.02%). High removal percentages (concentrations below LOQ) after 48 h were also observed for REM and FAV by I3 and by AS. All detected concentrations for UMI were below LOQ after 24 h. Comparing the results of the P2 experiment with detected concentrations of SASs after 48 h, a good correlation was observed with changes in increased CFU values. The lowest percentage for removal of LOP was observed by I4, at 10.58%, making LOP the most persistent SAS in terms of removal, followed by DCV with removal in the range of 69.53–70.81%, and RIT removal by I3 at 59.47%. Compared to literature data on removal of SASs in WWTPs, a good correlation was observed for the high removal rate of RIT and UMI, and the low removal rate of REM. In contrast, removal percentages of FAV and LOP did not correlate with the available data [8]. Although the UHPLC analysis results show high removal percentages by all isolated bacteria, the best removal results were mostly observed by AS for all selected SASs. It is known that AS has adsorption properties and can completely remove substances like SASs from aquatic matrices. Moreover, it contains mixed cultures (bacteria: Acinetobacter, Alcaligenes, Brevibacterium, Caulobacter, Comomonas, Cytophaga, Flavobacterium, Hyphomicrobium, Microbacterium, Pseudomonas and Sphaerotilus, and yeast: Debaromyces species), which possess a broad enzymatic system and usually achieve higher removal percentages of persistent pollutants [58,59].
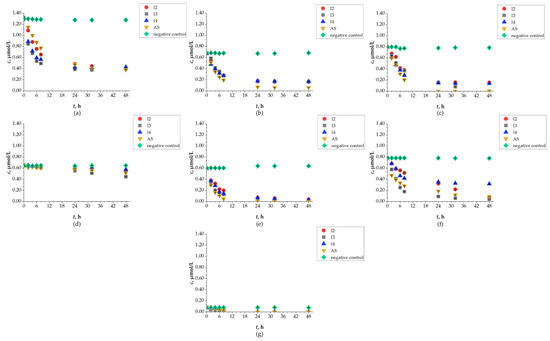
Figure 7.
Changes in concentration of (a) DCV; (b) DRV; (c) FAV; (d) LOP; (e) REM; (f) RIT; (g) UMI during 48 h of biodegradation by I2, I3, I4 and AS.
The toxicity of the selected SASs was examined to determine INH, effective concentrations causing 20% inhibition (EC20), and effective concentrations causing 50% inhibition (EC50) for initial solutions of SASs and their filtrates over 48 h of the biodegradation process. As shown in Table 8, toxicity after 48 h in the P2 experiments, compared to the EC20 of the initial SAS solutions, mostly increased for all filtrates. The highest INH of bioluminescence (56.35%) and the corresponding lowest EC50 value were observed for the REM isolate I2 filtrate, with an EC50 of 0.04 μmol/L, indicating high acute toxicity. Furthermore, this filtrate was more toxic than the initial REM solution, which had an EC50 of 0.58 μmol/L. In contrast, the lowest observed INH of bioluminescence was for UMI (0.08 μmol/L) at 3.95%, which also showed higher toxicity for filtrates in all P2 experiments. Filtrates of the I2 isolate had lower EC20 values than the initial solutions for all SASs, except for LOP, which had the lowest removal detected by UHPLC analysis and an I2 filtrate with low INH (10.19%). Isolate I3 filtrates showed lower INH (<20%) for RIT, LOP, and DCV, while REM, FAV, DRV, and UMI were more toxic, with low EC20 values. Filtrates for the I4 isolate all showed low EC20 values, except for LOP (INH = 17.78%) and DCV (INH = 15.33%). Toxicity of AS sample filtrates decreased after 48 h for LOP, DRV, and DCV, while it increased for RIT, REM, FAV, and UMI compared to the initial solution. The observed increase in bioluminescence INH and decreased EC20 values indicate the possible formation of toxic transformation and degradation products. For FAV, biodegradation by the marine-derived fungal strain Alternaria sp. D21 has been studied, and residual toxicity of FAV after removal was reported [60]. Allivibrio fischeri tests showed similar toxicity and accumulation of transformation and degradation products of FAV after ozonation and catalytic ozonation compared to the initial FAV solution [61]. Studies of forced degradation of REM, found only one degradation product (DP5) at neutral pH, which could explain the higher toxicity of all REM filtrates except for the I3 isolate filtrate [62]. Additionally, 14 degradation products of UMI were reported in laboratory experiments, but their toxicity was not mentioned [13]. Forced degradation products of DCV were also studied, but their toxicity was not reported [63]. To the best of our knowledge, there are no known degradation products or toxicity data for REM, LOP, and DRV.
Table 8.
Toxicity results of Allivibrio fischeri test, and evaluated INH of bioluminescence, EC20, and EC50 of isolates I2, I3 and I4, during 48 h of biodegradation of studied SASs.
Therefore, the most toxic isolate was I2 with INH of bioluminescence ranging from 31.27 to 56.35%, excluding LOP (10.19%). The least toxic isolates were I3 and the AS sample for most of the studied SASs, with no detected EC20 or higher EC20 in compared to other values. This is not surprising, as isolate I3 was one of the most frequently detected bacteria in AS samples during the P1 experiments. Accordingly, MLSS values increased and SAS concentrations declined for all SASs in experiments with the AS sample. For the I3 isolate, CFU also increased for most SASs, except for REM, and all SASs were successfully degraded.
To date, the specific degradation capacities of the isolated strains toward the selected SASs have not been comprehensively documented, which makes the interpretation of our results particularly relevant. When evaluating the biodegradation performance observed in this study, it is necessary to position these findings within the context of existing knowledge on the environmental fate of SASs, including their physicochemical characteristics and interactions within mixed microbial communities. A review of the available literature confirms a substantial knowledge gap regarding the biodegradation of the SASs investigated here. Most published studies focus on forced degradation pathways and the identification of transformation products [62,64,65,66,67,68], rather than on biologically mediated removal under environmentally relevant conditions. Only a few reports demonstrate effective removal mechanisms. For example, FAV has shown high susceptibility to ozonation, suggesting its potential role in WWTP upgrades [61], while biological removal has been associated with ammonia-oxidizing bacteria in granular AS systems [69]. In contrast, RIT exhibits efficient photodegradation under UV/H2O2 conditions; however, the observed removal is strongly influenced by rapid adsorption, indicating that the true extent of biodegradation remains unclear [70]. Furthermore, studies on photo-induced processes show divergent ecotoxicological outcomes: while RIT removal tends to reduce toxicity, LOP residuals in treated water have been associated with lethal effects on Danio rerio and Aliivibrio fischeri [71]. The difficulty of removing SASs from wastewater is consistent with the broader classification of many SASs as priority contaminants, given that their overall elimination efficiencies are often reported to be below 20% [71]. This behavior is strongly related to their physicochemical profiles, particularly the octanol–water partition coefficient (logP). For the SASs investigated in this work, logP values range from 1.76 to 5.22 (with the exception of FAV at 0.49) [2], indicating notable hydrophobicity and lipophilicity. Such characteristics suggest a high potential for bioaccumulation, sorption to solids, especially AS biomass, and long-term persistence in aquatic environments [8].
Consequently, any reduction in SAS concentrations observed in AS, a complex mixed microbial system, must be interpreted relative to the performance of the pure bacterial isolates examined in this study. Synergistic interactions among diverse microorganisms often enhance biotransformation rates [72], meaning that removal achieved by single strains does not necessarily reflect the full biodegradation potential of the AS community. Therefore, further investigation, including controlled bioaugmentation experiments, is required to draw definitive conclusions regarding the degradation capabilities of the isolated strains. Future research will focus on identifying transformation products using high-resolution analytical techniques such as Orbitrap LC-MS, as well as quantifying the contribution of adsorption processes in order to distinguish between the fractions of SASs that are truly biodegraded and those that are merely adsorbed onto AS.
4. Conclusions
Due to growing environmental concerns and the widespread use of SASs during the COVID-19 pandemic, it is important to observe and determine their persistence in wastewater, potential ecotoxicological effects, and efficient removal techniques. Biodegradation is a biological technique based on the metabolic activity of microorganisms and is an effective approach for removing persistent substances from the environment. This study conducted two experiments: isolation of bacteria from AS (P1) and assessment of biodegradation process parameters (P2). The results reveal that the selected bacterial isolates I2, I3, and I4 as well as the AS sample, possess promising ability to biodegrade a range of selected SASs under laboratory conditions. For monitoring SASs concentrations, seven UHPLC methods were developed. Significant concentration reductions were detected for all SASs studied: DCV, DRV, FAV, LOP, REM, RIT, and UMI, as well as corresponding changes in CFU values, OD, pH, conductivity, MLSS, MLVSS, and acute toxicity tests using Allivibrio fischeri. It was observed that AS is a particularly effective candidate for removal of SASs compared to bacterial isolates, with the lowest toxicity overall, the highest removal percentages of SASs, and increased MLSS and MLVSS values during the 48 h process. Additionally, bacterial isolate I3 also showed strong potential for the biodegradation process for removal of SASs from wastewater effluents. This is because this isolate had a suitable increase in CFU, decreased concentrations of each SASs, and the lowest detected toxicity for all included SASs among the bacterial isolates (I2 and I4). However, acute toxicity tests using Allivibrio fischeri showed elevated values for some of the SASs after P2 experiments, which may indicate the formation of toxic transformation and degradation products, requiring further investigation.
Overall, the results of this study provide preliminary information for future discussions on microbial degradation of SASs, treatment effectiveness for wastewater, and bridging the gap between laboratory experiments and environmental applications. Understanding microbial degradation pathways also contributes to better prediction of the fate of SASs in the environment and the course of biodegradation in ecosystems.
Author Contributions
Conceptualization, D.L., M.M.N., Š.U. and D.K.G.; Methodology, D.L. and D.K.G.; Investigation, I.Z.; Resources, D.L.; Writing – original draft, D.L. and M.M.N.; Writing – review & editing, M.M., T.B., Š.U. and D.K.G.; Visualization, M.M.N. and Š.U.; Supervision, M.M.N., M.M., T.B., Š.U. and D.K.G.; Project administration, D.K.G. All authors have read and agreed to the published version of the manuscript.
Funding
This research was funded by Croatian Science Foundation grant number EnA-SARS; IP-2022-10-2822.
Data Availability Statement
The original contributions presented in this study are included in the article. Further inquiries can be directed to the corresponding author.
Conflicts of Interest
The authors declare no conflicts of interest.
Abbreviations
The following abbreviations are used in this manuscript:
| CFU | Colony-forming units |
| DCV | Daclatasvir |
| DRV | Darunavir |
| FAV | Favipiravir |
| EC20 | Effective concentrations causing 20% inhibition |
| EC50 | Effective concentrations causing 50% inhibition |
| INH | Inhibition of bioluminescence |
| LOP | Lopinavir |
| MLSS | Mixed liquor suspended solids |
| MLVSS | Mixed liquor volatile suspended solids |
| OD | Optical density |
| REM | Remdesivir |
| RIT | Ritonavir |
| UHPLC | Ultra-high-performance liquid chromatography |
| UMI | Umifenovir |
| WHO | World Health Organization |
| WWTP | Wastewater treatment plant |
Appendix A
Table A1.
Changes in OD, pH, γ (O2) (mg/L), and ϗ (mS/cm) of isolates I2, I3 and I4, during 48 h of biodegradation of studied SASs.
Table A1.
Changes in OD, pH, γ (O2) (mg/L), and ϗ (mS/cm) of isolates I2, I3 and I4, during 48 h of biodegradation of studied SASs.
| Parameters | ||||||||||
|---|---|---|---|---|---|---|---|---|---|---|
| pH | γ (O2), mg/L | ϗ, mS/cm | OD | |||||||
| SAS | t, h | Isolate | C | S | C | S | C | S | C | S |
| DCV | 0 | I2 | 7.09 ± 0.06 | 7.09 ± 0.07 | 7.92 ± 0.18 | 7.92 ± 0.17 | 11.13 ± 0.29 | 11.13 ± 0.28 | 0.10 ± 0.01 | 0.10 ± 0.02 |
| 5 | 7.15 ± 0.05 | 7.09 ± 0.05 | 7.87 ± 0.11 | 7.94 ± 0.29 | 16.23 ± 0.36 | 16.50 ± 0.41 | 0.10 ± 0.02 | 0.08 ± 0.01 | ||
| 24 | 7.14 ± 0.08 | 7.13 ± 0.09 | 7.72 ± 0.25 | 7.70 ± 0.12 | 16.45 ± 0.24 | 16.20 ± 0.36 | 0.16 ± 0.00 | 0.15 ± 0.02 | ||
| 29 | 7.15 ± 0.08 | 7.16 ± 0.11 | 7.71 ± 0.14 | 7.75 ± 0.22 | 16.42 ± 0.41 | 16.18 ± 0.24 | 0.18 ± 0.01 | 0.14 ± 0.03 | ||
| 48 | 7.45 ± 0.10 | 7.55 ± 0.06 | 7.26 ± 0.10 | 7.78 ± 0.15 | 16.46 ± 0.33 | 16.68 ± 0.42 | 0.08 ± 0.02 | 0.12 ± 0.00 | ||
| 0 | I3 | 7.16 ± 0.09 | 7.16 ± 0.06 | 7.77 ± 0.28 | 7.77 ± 0.24 | 12.23 ± 0.31 | 12.23 ± 0.31 | 0.12 ± 0.04 | 0.12 ± 0.01 | |
| 5 | 7.05 ± 0.07 | 7.11 ± 0.09 | 8.08 ± 0.15 | 8.03 ± 0.16 | 15.80 ± 0.23 | 16.23 ± 0.25 | 0.03 ± 0.00 | 0.08 ± 0.02 | ||
| 24 | 7.17 ± 0.05 | 7.19 ± 0.13 | 7.90 ± 0.21 | 7.92 ± 0.28 | 16.33 ± 0.41 | 16.30 ± 0.38 | 0.07 ± 0.02 | 0.08 ± 0.01 | ||
| 29 | 7.21 ± 0.12 | 7.20 ± 0.07 | 7.91 ± 0.13 | 7.96 ± 0.11 | 16.36 ± 0.25 | 16.36 ± 0.33 | 0.08 ± 0.01 | 0.10 ± 0.02 | ||
| 48 | 7.49 ± 0.10 | 7.50 ± 0.11 | 7.80 ± 0.23 | 7.81 ± 0.20 | 16.79 ± 0.38 | 16.51 ± 0.26 | 0.12 ± 0.02 | 0.08 ± 0.01 | ||
| 0 | I4 | 7.15 ± 0.05 | 7.15 ± 0.08 | 7.07 ± 0.11 | 7.07 ± 0.14 | 15.97 ± 0.28 | 15.97 ± 0.39 | 0.17 ± 0.03 | 0.17 ± 0.04 | |
| 5 | 7.17 ± 0.10 | 7.19 ± 0.11 | 7.82 ± 0.19 | 7.86 ± 0.25 | 16.04 ± 0.24 | 16.17 ± 0.32 | 0.11 ± 0.01 | 0.13 ± 0.01 | ||
| 24 | 7.16 ± 0.08 | 7.19 ± 0.05 | 7.65 ± 0.10 | 7.61 ± 0.17 | 16.48 ± 0.33 | 16.50 ± 0.25 | 0.13 ± 0.02 | 0.18 ± 0.02 | ||
| 29 | 7.17 ± 0.12 | 7.17 ± 0.09 | 7.62 ± 0.26 | 7.59 ± 0.29 | 16.53 ± 0.25 | 16.52 ± 0.41 | 0.14 ± 0.00 | 0.18 ± 0.00 | ||
| 48 | 7.49 ± 0.07 | 7.51 ± 0.13 | 7.64 ± 0.17 | 7.57 ± 0.12 | 16.35 ± 0.37 | 16.41 ± 0.33 | 0.12 ± 0.01 | 0.14 ± 0.01 | ||
| 0 | AS | 7.10 ± 0.08 | 7.10 ± 0.08 | 2.90 ± 0.29 | 2.90 ± 0.22 | 14.96 ± 0.26 | 14.96 ± 0.37 | - | - | |
| 5 | 7.21 ± 0.05 | 7.17 ± 0.12 | 6.03 ± 0.12 | 5.07 ± 0.15 | 15.10 ± 0.38 | 15.53 ± 0.23 | - | - | ||
| 24 | 7.39 ± 0.10 | 7.39 ± 0.06 | 6.11 ± 0.22 | 5.60 ± 0.24 | 15.24 ± 0.34 | 15.10 ± 0.38 | - | - | ||
| 29 | 7.40 ± 0.14 | 7.39 ± 0.11 | 6.23 ± 0.15 | 5.33 ± 0.16 | 15.27 ± 0.23 | 15.04 ± 0.24 | - | - | ||
| 48 | 7.42 ± 0.07 | 7.42 ± 0.05 | 5.74 ± 0.24 | 4.76 ± 0.28 | 15.30 ± 0.35 | 15.02 ± 0.36 | - | - | ||
| DRV | 0 | I2 | 7.25 ± 0.07 | 7.25 ± 0.09 | 7.76 ± 0.16 | 7.76 ± 0.11 | 16.90 ± 0.38 | 16.90 ± 0.28 | 0.10 ± 0.02 | 0.10 ± 0.02 |
| 5 | 7.20 ± 0.13 | 7.19 ± 0.07 | 7.96 ± 0.28 | 7.86 ± 0.20 | 17.21 ± 0.34 | 16.06 ± 0.40 | 0.13 ± 0.01 | 0.18 ± 0.01 | ||
| 24 | 7.11 ± 0.06 | 7.19 ± 0.14 | 8.16 ± 0.11 | 8.15 ± 0.14 | 16.63 ± 0.33 | 15.76 ± 0.34 | 0.17 ± 0.02 | 0.11 ± 0.02 | ||
| 29 | 7.18 ± 0.11 | 7.12 ± 0.05 | 8.16 ± 0.20 | 8.11 ± 0.25 | 17.36 ± 0.26 | 15.53 ± 0.25 | 0.14 ± 0.01 | 0.16 ± 0.00 | ||
| 48 | 7.51 ± 0.09 | 7.55 ± 0.10 | 8.02 ± 0.14 | 7.92 ± 0.17 | 17.20 ± 0.37 | 16.18 ± 0.37 | 0.15 ± 0.02 | 0.17 ± 0.01 | ||
| 0 | I3 | 7.26 ± 0.08 | 7.26 ± 0.08 | 7.89 ± 0.25 | 7.89 ± 0.29 | 16.95 ± 0.28 | 16.95 ± 0.30 | 0.05 ± 0.01 | 0.05 ± 0.02 | |
| 5 | 7.20 ± 0.11 | 7.19 ± 0.06 | 7.75 ± 0.17 | 7.81 ± 0.12 | 17.35 ± 0.43 | 15.73 ± 0.43 | 0.09 ± 0.02 | 0.10 ± 0.01 | ||
| 24 | 7.19 ± 0.05 | 7.18 ± 0.13 | 7.98 ± 0.10 | 8.04 ± 0.22 | 17.40 ± 0.26 | 16.38 ± 0.33 | 0.08 ± 0.00 | 0.12 ± 0.02 | ||
| 29 | 7.21 ± 0.10 | 7.22 ± 0.07 | 8.19 ± 0.27 | 8.15 ± 0.15 | 17.48 ± 0.35 | 16.15 ± 0.26 | 0.14 ± 0.01 | 0.13 ± 0.01 | ||
| 48 | 7.61 ± 0.14 | 7.59 ± 0.11 | 8.06 ± 0.15 | 8.03 ± 0.24 | 17.52 ± 0.25 | 16.30 ± 0.39 | 0.15 ± 0.02 | 0.16 ± 0.04 | ||
| 0 | I4 | 7.24 ± 0.06 | 7.24 ± 0.05 | 7.84 ± 0.22 | 7.84 ± 0.16 | 16.80 ± 0.42 | 16.80 ± 0.28 | 0.15 ± 0.01 | 0.15 ± 0.01 | |
| 5 | 7.24 ± 0.09 | 7.20 ± 0.09 | 7.90 ± 0.13 | 8.03 ± 0.28 | 15.62 ± 0.23 | 15.26 ± 0.40 | 0.24 ± 0.02 | 0.24 ± 0.02 | ||
| 24 | 7.28 ± 0.05 | 7.23 ± 0.14 | 8.05 ± 0.24 | 8.03 ± 0.11 | 16.15 ± 0.39 | 15.66 ± 0.34 | 0.23 ± 0.01 | 0.20 ± 0.01 | ||
| 29 | 7.57 ± 0.13 | 7.25 ± 0.06 | 7.93 ± 0.16 | 7.85 ± 0.20 | 15.94 ± 0.30 | 15.07 ± 0.24 | 0.22 ± 0.03 | 0.20 ± 0.02 | ||
| 48 | 7.25 ± 0.07 | 7.55 ± 0.10 | 8.24 ± 0.28 | 7.89 ± 0.14 | 16.16 ± 0.27 | 15.74 ± 0.36 | 0.20 ± 0.01 | 0.21 ± 0.01 | ||
| 0 | AS | 7.22 ± 0.12 | 7.22 ± 0.07 | 5.90 ± 0.11 | 5.90 ± 0.25 | 13.64 ± 0.34 | 13.64 ± 0.29 | - | - | |
| 5 | 7.14 ± 0.06 | 7.27 ± 0.12 | 5.82 ± 0.21 | 5.26 ± 0.17 | 14.10 ± 0.24 | 14.08 ± 0.44 | - | - | ||
| 24 | 7.35 ± 0.10 | 7.30 ± 0.05 | 6.11 ± 0.14 | 6.04 ± 0.29 | 13.95 ± 0.35 | 13.60 ± 0.33 | - | - | ||
| 29 | 7.43 ± 0.05 | 7.48 ± 0.09 | 7.88 ± 0.25 | 7.74 ± 0.12 | 13.91 ± 0.28 | 13.93 ± 0.26 | - | - | ||
| 48 | 7.52 ± 0.11 | 7.50 ± 0.14 | 5.42 ± 0.17 | 6.38 ± 0.22 | 14.29 ± 0.36 | 13.99 ± 0.39 | - | - | ||
| FAV | 0 | I2 | 7.25 ± 0.09 | 7.25 ± 0.06 | 7.76 ± 0.29 | 7.76 ± 0.15 | 16.90 ± 0.29 | 16.90 ± 0.28 | 0.10 ± 0.03 | 0.10 ± 0.04 |
| 5 | 7.25 ± 0.12 | 7.17 ± 0.11 | 7.93 ± 0.12 | 7.99 ± 0.24 | 17.20 ± 0.43 | 16.05 ± 0.43 | 0.10 ± 0.00 | 0.09 ± 0.02 | ||
| 24 | 7.20 ± 0.06 | 7.13 ± 0.08 | 8.11 ± 0.22 | 8.11 ± 0.16 | 16.48 ± 0.33 | 16.01 ± 0.32 | 0.09 ± 0.01 | 0.10 ± 0.01 | ||
| 29 | 7.14 ± 0.08 | 7.17 ± 0.05 | 8.28 ± 0.15 | 8.18 ± 0.28 | 16.42 ± 0.26 | 16.70 ± 0.25 | 0.10 ± 0.02 | 0.12 ± 0.02 | ||
| 48 | 7.57 ± 0.07 | 7.56 ± 0.13 | 8.02 ± 0.24 | 7.96 ± 0.11 | 17.16 ± 0.37 | 16.44 ± 0.36 | 0.13 ± 0.01 | 0.09 ± 0.01 | ||
| 0 | I3 | 7.26 ± 0.07 | 7.26 ± 0.07 | 7.89 ± 0.16 | 7.89 ± 0.20 | 16.95 ± 0.23 | 16.95 ± 0.30 | 0.13 ± 0.02 | 0.05 ± 0.02 | |
| 5 | 7.18 ± 0.13 | 7.20 ± 0.12 | 7.75 ± 0.28 | 7.78 ± 0.14 | 17.15 ± 0.36 | 15.93 ± 0.41 | 0.05 ± 0.01 | 0.14 ± 0.01 | ||
| 24 | 7.21 ± 0.06 | 7.21 ± 0.05 | 7.97 ± 0.11 | 8.00 ± 0.25 | 16.88 ± 0.29 | 14.92 ± 0.33 | 0.18 ± 0.02 | 0.15 ± 0.02 | ||
| 29 | 7.17 ± 0.11 | 7.18 ± 0.10 | 8.17 ± 0.20 | 8.10 ± 0.17 | 17.56 ± 0.35 | 16.27 ± 0.26 | 0.16 ± 0.01 | 0.16 ± 0.03 | ||
| 48 | 7.55 ± 0.09 | 7.54 ± 0.09 | 7.97 ± 0.14 | 8.07 ± 0.29 | 17.64 ± 0.27 | 16.22 ± 0.37 | 0.14 ± 0.03 | 0.15 ± 0.01 | ||
| 0 | I4 | 7.24 ± 0.05 | 7.24 ± 0.06 | 7.84 ± 0.25 | 7.84 ± 0.12 | 16.80 ± 0.41 | 16.80 ± 0.24 | 0.16 ± 0.01 | 0.10 ± 0.02 | |
| 5 | 7.24 ± 0.10 | 7.32 ± 0.14 | 7.89 ± 0.17 | 7.92 ± 0.22 | 16.24 ± 0.25 | 15.43 ± 0.35 | 0.10 ± 0.02 | 0.09 ± 0.01 | ||
| 24 | 7.23 ± 0.08 | 7.21 ± 0.08 | 8.09 ± 0.10 | 8.07 ± 0.15 | 16.12 ± 0.38 | 15.42 ± 0.38 | 0.10 ± 0.01 | 0.10 ± 0.02 | ||
| 29 | 7.26 ± 0.14 | 7.22 ± 0.05 | 7.87 ± 0.27 | 7.89 ± 0.24 | 17.88 ± 0.33 | 15.45 ± 0.25 | 0.10 ± 0.02 | 0.12 ± 0.01 | ||
| 48 | 7.53 ± 0.07 | 7.58 ± 0.11 | 8.30 ± 0.15 | 8.16 ± 0.16 | 16.99 ± 0.25 | 15.62 ± 0.42 | 0.13 ± 0.01 | 0.09 ± 0.04 | ||
| 0 | AS | 7.22 ± 0.05 | 7.22 ± 0.09 | 5.90 ± 0.22 | 5.90 ± 0.28 | 13.64 ± 0.36 | 13.64 ± 0.34 | - | - | |
| 5 | 7.38 ± 0.12 | 7.36 ± 0.13 | 5.38 ± 0.13 | 3.69 ± 0.11 | 13.92 ± 0.24 | 13.71 ± 0.26 | - | - | ||
| 24 | 7.39 ± 0.06 | 7.35 ± 0.07 | 7.24 ± 0.24 | 5.71 ± 0.20 | 14.22 ± 0.37 | 13.76 ± 0.37 | - | - | ||
| 29 | 7.50 ± 0.08 | 7.68 ± 0.05 | 7.88 ± 0.16 | 8.03 ± 0.14 | 14.48 ± 0.26 | 14.36 ± 0.29 | - | - | ||
| 48 | 7.52 ± 0.05 | 7.48 ± 0.12 | 5.17 ± 0.28 | 6.80 ± 0.25 | 14.18 ± 0.34 | 14.02 ± 0.44 | - | - | ||
| LOP | 0 | I2 | 7.09 ± 0.12 | 7.09 ± 0.08 | 7.92 ± 0.11 | 7.92 ± 0.17 | 11.13 ± 0.29 | 11.13 ± 0.25 | 0.10 ± 0.02 | 0.10 ± 0.01 |
| 5 | 7.04 ± 0.08 | 7.13 ± 0.06 | 7.47 ± 0.20 | 7.62 ± 0.29 | 16.17 ± 0.40 | 16.48 ± 0.38 | 0.10 ± 0.01 | 0.11 ± 0.02 | ||
| 24 | 7.12 ± 0.05 | 7.12 ± 0.11 | 6.58 ± 0.14 | 7.81 ± 0.12 | 16.31 ± 0.34 | 16.01 ± 0.34 | 0.09 ± 0.02 | 0.08 ± 0.00 | ||
| 29 | 7.12 ± 0.09 | 7.12 ± 0.09 | 6.65 ± 0.25 | 7.83 ± 0.22 | 16.34 ± 0.24 | 16.04 ± 0.24 | 0.10 ± 0.01 | 0.09 ± 0.02 | ||
| 48 | 7.52 ± 0.07 | 7.43 ± 0.07 | 7.63 ± 0.17 | 7.05 ± 0.15 | 16.48 ± 0.36 | 16.29 ± 0.37 | 0.15 ± 0.02 | 0.10 ± 0.01 | ||
| 0 | I3 | 7.16 ± 0.14 | 7.16 ± 0.14 | 7.77 ± 0.29 | 7.77 ± 0.24 | 12.23 ± 0.25 | 12.23 ± 0.31 | 0.12 ± 0.01 | 0.12 ± 0.02 | |
| 5 | 7.13 ± 0.06 | 7.04 ± 0.05 | 7.93 ± 0.12 | 7.93 ± 0.16 | 16.13 ± 0.39 | 16.25 ± 0.27 | 0.18 ± 0.02 | 0.18 ± 0.01 | ||
| 24 | 7.19 ± 0.11 | 7.08 ± 0.10 | 7.94 ± 0.22 | 7.93 ± 0.28 | 16.25 ± 0.27 | 16.36 ± 0.40 | 0.08 ± 0.01 | 0.08 ± 0.02 | ||
| 29 | 7.20 ± 0.08 | 7.09 ± 0.06 | 7.93 ± 0.15 | 7.96 ± 0.11 | 16.33 ± 0.35 | 16.48 ± 0.32 | 0.09 ± 0.03 | 0.09 ± 0.01 | ||
| 48 | 7.52 ± 0.05 | 7.49 ± 0.13 | 7.74 ± 0.24 | 7.70 ± 0.20 | 16.21 ± 0.29 | 16.34 ± 0.25 | 0.14 ± 0.01 | 0.11 ± 0.03 | ||
| 0 | I4 | 7.15 ± 0.09 | 7.15 ± 0.09 | 7.07 ± 0.16 | 7.07 ± 0.14 | 15.97 ± 0.43 | 15.97 ± 0.41 | 0.17 ± 0.02 | 0.17 ± 0.01 | |
| 5 | 7.14 ± 0.07 | 7.13 ± 0.11 | 7.65 ± 0.28 | 7.91 ± 0.25 | 16.11 ± 0.31 | 16.29 ± 0.33 | 0.22 ± 0.01 | 0.22 ± 0.02 | ||
| 24 | 7.19 ± 0.10 | 7.11 ± 0.07 | 7.69 ± 0.11 | 7.70 ± 0.17 | 16.19 ± 0.25 | 15.60 ± 0.26 | 0.15 ± 0.02 | 0.21 ± 0.01 | ||
| 29 | 7.20 ± 0.11 | 7.12 ± 0.05 | 7.74 ± 0.20 | 7.72 ± 0.29 | 16.36 ± 0.38 | 15.81 ± 0.39 | 0.15 ± 0.01 | 0.22 ± 0.04 | ||
| 48 | 7.53 ± 0.08 | 7.52 ± 0.08 | 7.44 ± 0.14 | 7.42 ± 0.12 | 16.11 ± 0.24 | 16.28 ± 0.24 | 0.18 ± 0.04 | 0.23 ± 0.01 | ||
| 0 | AS | 7.10 ± 0.08 | 7.10 ± 0.07 | 2.90 ± 0.25 | 2.90 ± 0.25 | 14.96 ± 0.30 | 14.96 ± 0.37 | - | - | |
| 5 | 7.11 ± 0.13 | 7.17 ± 0.11 | 5.71 ± 0.17 | 4.09 ± 0.17 | 14.90 ± 0.45 | 15.03 ± 0.25 | - | - | ||
| 24 | 7.24 ± 0.06 | 7.32 ± 0.09 | 4.54 ± 0.29 | 4.92 ± 0.29 | 14.81 ± 0.22 | 15.04 ± 0.38 | - | - | ||
| 29 | 7.36 ± 0.11 | 7.38 ± 0.05 | 4.34 ± 0.12 | 5.06 ± 0.12 | 14.79 ± 0.37 | 15.00 ± 0.30 | - | - | ||
| 48 | 7.42 ± 0.05 | 7.46 ± 0.13 | 3.75 ± 0.22 | 5.04 ± 0.22 | 14.77 ± 0.30 | 15.46 ± 0.27 | - | - | ||
| REM | 0 | I2 | 7.37 ± 0.09 | 7.37 ± 0.06 | 7.63 ± 0.15 | 7.63 ± 0.15 | 13.92 ± 0.25 | 13.92 ± 0.35 | 0.17 ± 0.02 | 0.17 ± 0.02 |
| 5 | 7.04 ± 0.14 | 7.11 ± 0.12 | 7.75 ± 0.24 | 7.68 ± 0.24 | 18.09 ± 0.45 | 18.61 ± 0.47 | 0.14 ± 0.01 | 0.17 ± 0.01 | ||
| 24 | 7.13 ± 0.07 | 7.11 ± 0.08 | 7.91 ± 0.16 | 7.90 ± 0.16 | 16.25 ± 0.24 | 18.07 ± 0.27 | 0.13 ± 0.02 | 0.08 ± 0.02 | ||
| 29 | 7.09 ± 0.05 | 7.10 ± 0.05 | 7.83 ± 0.28 | 7.99 ± 0.28 | 15.75 ± 0.39 | 16.09 ± 0.40 | 0.11 ± 0.01 | 0.07 ± 0.00 | ||
| 48 | 7.08 ± 0.10 | 7.06 ± 0.10 | 7.94 ± 0.11 | 7.93 ± 0.11 | 16.06 ± 0.32 | 18.49 ± 0.37 | 0.14 ± 0.02 | 0.08 ± 0.01 | ||
| 0 | I3 | 7.36 ± 0.08 | 7.36 ± 0.07 | 7.76 ± 0.20 | 7.76 ± 0.20 | 10.36 ± 0.26 | 10.36 ± 0.26 | 0.09 ± 0.01 | 0.09 ± 0.02 | |
| 5 | 7.21 ± 0.12 | 7.11 ± 0.14 | 7.70 ± 0.14 | 7.72 ± 0.14 | 15.31 ± 0.46 | 20.19 ± 0.40 | 0.06 ± 0.02 | 0.05 ± 0.01 | ||
| 24 | 7.06 ± 0.06 | 7.17 ± 0.09 | 7.95 ± 0.25 | 8.00 ± 0.25 | 17.92 ± 0.27 | 23.50 ± 0.35 | 0.08 ± 0.01 | 0.07 ± 0.02 | ||
| 29 | 7.11 ± 0.14 | 7.11 ± 0.06 | 8.04 ± 0.17 | 8.01 ± 0.17 | 17.17 ± 0.34 | 22.32 ± 0.29 | 0.10 ± 0.03 | 0.11 ± 0.01 | ||
| 48 | 7.10 ± 0.09 | 7.12 ± 0.11 | 7.79 ± 0.29 | 7.89 ± 0.29 | 16.53 ± 0.25 | 18.68 ± 0.44 | 0.09 ± 0.01 | 0.16 ± 0.03 | ||
| 0 | I4 | 7.37 ± 0.05 | 7.37 ± 0.05 | 7.57 ± 0.12 | 7.57 ± 0.12 | 10.14 ± 0.41 | 10.14 ± 0.25 | 0.17 ± 0.02 | 0.17 ± 0.01 | |
| 5 | 7.10 ± 0.07 | 7.13 ± 0.08 | 7.79 ± 0.22 | 7.82 ± 0.22 | 19.33 ± 0.34 | 21.76 ± 0.38 | 0.15 ± 0.01 | 0.15 ± 0.02 | ||
| 24 | 7.15 ± 0.11 | 7.15 ± 0.13 | 7.88 ± 0.15 | 7.87 ± 0.15 | 19.78 ± 0.30 | 21.83 ± 0.33 | 0.15 ± 0.02 | 0.16 ± 0.01 | ||
| 29 | 7.08 ± 0.09 | 7.11 ± 0.07 | 8.02 ± 0.24 | 7.95 ± 0.24 | 18.26 ± 0.45 | 17.89 ± 0.26 | 0.13 ± 0.01 | 0.14 ± 0.04 | ||
| 48 | 7.09 ± 0.06 | 7.12 ± 0.09 | 7.85 ± 0.16 | 7.89 ± 0.16 | 18.86 ± 0.37 | 18.78 ± 0.47 | 0.04 ± 0.04 | 0.11 ± 0.01 | ||
| 0 | AS | 7.34 ± 0.05 | 7.34 ± 0.05 | 3.61 ± 0.28 | 3.61 ± 0.28 | 14.51 ± 0.22 | 14.51 ± 0.36 | - | - | |
| 5 | 7.63 ± 0.13 | 7.67 ± 0.10 | 4.15 ± 0.11 | 3.53 ± 0.11 | 14.54 ± 0.36 | 14.56 ± 0.24 | - | - | ||
| 24 | 7.63 ± 0.07 | 7.52 ± 0.14 | 3.25 ± 0.20 | 3.56 ± 0.20 | 14.25 ± 0.29 | 14.58 ± 0.37 | - | - | ||
| 29 | 7.02 ± 0.11 | 7.03 ± 0.07 | 5.85 ± 0.14 | 5.95 ± 0.14 | 10.14 ± 0.44 | 11.95 ± 0.30 | - | - | ||
| 48 | 7.01 ± 0.08 | 7.02 ± 0.06 | 6.02 ± 0.25 | 6.00 ± 0.25 | 13.73 ± 0.27 | 14.58 ± 0.45 | - | - | ||
| RIT | 0 | I2 | 7.75 ± 0.05 | 7.75 ± 0.11 | 7.89 ± 0.17 | 7.89 ± 0.17 | 15.72 ± 0.47 | 15.72 ± 0.28 | 0.13 ± 0.02 | 0.13 ± 0.01 |
| 5 | 7.96 ± 0.10 | 7.96 ± 0.08 | 7.98 ± 0.29 | 8.02 ± 0.29 | 15.19 ± 0.23 | 16.15 ± 0.40 | 0.15 ± 0.01 | 0.16 ± 0.02 | ||
| 24 | 7.12 ± 0.06 | 7.10 ± 0.05 | 8.21 ± 0.12 | 8.16 ± 0.12 | 14.67 ± 0.37 | 16.58 ± 0.32 | 0.12 ± 0.02 | 0.18 ± 0.00 | ||
| 29 | 7.15 ± 0.14 | 7.14 ± 0.13 | 8.00 ± 0.22 | 7.94 ± 0.22 | 14.34 ± 0.29 | 16.14 ± 0.25 | 0.11 ± 0.01 | 0.17 ± 0.01 | ||
| 48 | 7.13 ± 0.07 | 7.15 ± 0.09 | 8.06 ± 0.15 | 7.20 ± 0.15 | 14.02 ± 0.42 | 15.71 ± 0.38 | 0.11 ± 0.03 | 0.17 ± 0.02 | ||
| 0 | I3 | 7.78 ± 0.12 | 7.78 ± 0.06 | 7.72 ± 0.24 | 7.72 ± 0.24 | 6.33 ± 0.17 | 6.33 ± 0.16 | 0.09 ± 0.01 | 0.09 ± 0.01 | |
| 5 | 7.94 ± 0.05 | 7.95 ± 0.10 | 7.97 ± 0.16 | 8.01 ± 0.16 | 13.07 ± 0.33 | 9.14 ± 0.23 | 0.07 ± 0.02 | 0.07 ± 0.03 | ||
| 24 | 7.06 ± 0.09 | 7.08 ± 0.07 | 8.18 ± 0.28 | 8.21 ± 0.28 | 12.50 ± 0.25 | 11.94 ± 0.30 | 0.13 ± 0.01 | 0.18 ± 0.01 | ||
| 29 | 7.21 ± 0.10 | 7.06 ± 0.05 | 7.99 ± 0.11 | 7.97 ± 0.11 | 12.86 ± 0.38 | 12.79 ± 0.32 | 0.14 ± 0.02 | 0.04 ± 0.02 | ||
| 48 | 7.08 ± 0.06 | 7.13 ± 0.12 | 8.05 ± 0.20 | 8.10 ± 0.20 | 13.23 ± 0.33 | 13.64 ± 0.34 | 0.16 ± 0.01 | 0.15 ± 0.01 | ||
| 0 | I4 | 7.71 ± 0.13 | 7.71 ± 0.08 | 7.71 ± 0.14 | 7.71 ± 0.14 | 12.93 ± 0.26 | 12.93 ± 0.26 | 0.14 ± 0.04 | 0.14 ± 0.04 | |
| 5 | 7.96 ± 0.08 | 7.93 ± 0.13 | 7.97 ± 0.25 | 7.96 ± 0.25 | 13.18 ± 0.40 | 13.96 ± 0.35 | 0.19 ± 0.01 | 0.16 ± 0.01 | ||
| 24 | 7.07 ± 0.05 | 7.08 ± 0.09 | 8.36 ± 0.17 | 8.17 ± 0.17 | 12.90 ± 0.32 | 14.99 ± 0.37 | 0.24 ± 0.02 | 0.31 ± 0.02 | ||
| 29 | 7.14 ± 0.11 | 7.11 ± 0.07 | 8.02 ± 0.29 | 7.92 ± 0.29 | 16.50 ± 0.41 | 14.22 ± 0.24 | 0.23 ± 0.01 | 0.16 ± 0.01 | ||
| 48 | 7.13 ± 0.09 | 7.11 ± 0.11 | 8.02 ± 0.12 | 8.12 ± 0.12 | 20.10 ± 0.35 | 13.45 ± 0.34 | 0.16 ± 0.02 | 0.20 ± 0.02 | ||
| 0 | AS | 7.73 ± 0.08 | 7.73 ± 0.11 | 3.12 ± 0.17 | 3.12 ± 0.25 | 14.69 ± 0.36 | 14.69 ± 0.36 | - | - | |
| 5 | 7.88 ± 0.05 | 7.89 ± 0.06 | 4.35 ± 0.29 | 5.30 ± 0.17 | 14.65 ± 0.29 | 14.72 ± 0.29 | - | - | ||
| 24 | 7.82 ± 0.12 | 7.83 ± 0.09 | 5.47 ± 0.12 | 5.13 ± 0.29 | 14.76 ± 0.44 | 14.75 ± 0.44 | - | - | ||
| 29 | 7.80 ± 0.06 | 7.86 ± 0.14 | 4.70 ± 0.22 | 4.81 ± 0.12 | 14.65 ± 0.26 | 14.65 ± 0.26 | - | - | ||
| 48 | 7.85 ± 0.11 | 7.81 ± 0.05 | 4.56 ± 0.15 | 4.02 ± 0.22 | 14.53 ± 0.38 | 14.54 ± 0.38 | - | - | ||
| UMI | 0 | I2 | 7.20 ± 0.09 | 7.20 ± 0.12 | 7.79 ± 0.24 | 7.79 ± 0.15 | 15.83 ± 0.31 | 15.83 ± 0.31 | 0.12 ± 0.01 | 0.12 ± 0.02 |
| 5 | 7.22 ± 0.07 | 7.18 ± 0.08 | 7.93 ± 0.16 | 8.01 ± 0.24 | 15.93 ± 0.24 | 16.23 ± 0.24 | 0.10 ± 0.02 | 0.10 ± 0.01 | ||
| 24 | 7.17 ± 0.14 | 7.12 ± 0.07 | 7.86 ± 0.28 | 7.82 ± 0.16 | 16.14 ± 0.40 | 16.03 ± 0.40 | 0.11 ± 0.01 | 0.10 ± 0.02 | ||
| 29 | 7.20 ± 0.05 | 7.12 ± 0.10 | 7.84 ± 0.11 | 7.89 ± 0.28 | 16.23 ± 0.33 | 16.05 ± 0.33 | 0.08 ± 0.03 | 0.08 ± 0.01 | ||
| 48 | 7.38 ± 0.10 | 7.40 ± 0.05 | 8.00 ± 0.20 | 8.02 ± 0.11 | 16.37 ± 0.27 | 15.98 ± 0.27 | 0.07 ± 0.01 | 0.03 ± 0.04 | ||
| 0 | I3 | 7.22 ± 0.06 | 7.22 ± 0.13 | 8.03 ± 0.14 | 8.03 ± 0.20 | 15.81 ± 0.39 | 15.81 ± 0.39 | 0.05 ± 0.02 | 0.05 ± 0.01 | |
| 5 | 7.19 ± 0.13 | 7.25 ± 0.06 | 7.89 ± 0.25 | 7.96 ± 0.14 | 15.98 ± 0.32 | 15.39 ± 0.32 | 0.05 ± 0.01 | 0.06 ± 0.02 | ||
| 24 | 7.19 ± 0.08 | 7.20 ± 0.09 | 7.97 ± 0.17 | 8.00 ± 0.25 | 16.40 ± 0.41 | 15.99 ± 0.41 | 0.07 ± 0.04 | 0.07 ± 0.01 | ||
| 29 | 7.22 ± 0.05 | 7.22 ± 0.11 | 8.00 ± 0.29 | 8.05 ± 0.17 | 16.03 ± 0.24 | 16.01 ± 0.24 | 0.06 ± 0.01 | 0.06 ± 0.03 | ||
| 48 | 7.43 ± 0.11 | 7.42 ± 0.08 | 8.06 ± 0.12 | 8.09 ± 0.29 | 15.95 ± 0.35 | 15.78 ± 0.35 | 0.05 ± 0.02 | 0.01 ± 0.01 | ||
| 0 | I4 | 7.23 ± 0.07 | 7.23 ± 0.07 | 7.58 ± 0.22 | 7.58 ± 0.12 | 15.87 ± 0.28 | 15.87 ± 0.28 | 0.16 ± 0.01 | 0.16 ± 0.02 | |
| 5 | 7.27 ± 0.12 | 7.25 ± 0.11 | 7.74 ± 0.15 | 7.77 ± 0.22 | 15.69 ± 0.43 | 15.80 ± 0.43 | 0.12 ± 0.02 | 0.11 ± 0.01 | ||
| 24 | 7.23 ± 0.09 | 7.23 ± 0.05 | 7.49 ± 0.24 | 7.65 ± 0.15 | 15.97 ± 0.33 | 15.83 ± 0.33 | 0.15 ± 0.01 | 0.15 ± 0.02 | ||
| 29 | 7.22 ± 0.06 | 7.26 ± 0.09 | 7.58 ± 0.16 | 7.61 ± 0.24 | 15.99 ± 0.26 | 15.97 ± 0.26 | 0.16 ± 0.03 | 0.15 ± 0.01 | ||
| 48 | 7.38 ± 0.14 | 7.40 ± 0.13 | 8.11 ± 0.28 | 7.98 ± 0.16 | 16.52 ± 0.39 | 16.38 ± 0.39 | 0.18 ± 0.01 | 0.16 ± 0.04 | ||
| 0 | AS | 7.36 ± 0.05 | 7.36 ± 0.06 | 6.05 ± 0.11 | 6.05 ± 0.28 | 14.90 ± 0.30 | 14.90 ± 0.30 | - | - | |
| 5 | 7.20 ± 0.10 | 7.21 ± 0.12 | 4.98 ± 0.20 | 5.16 ± 0.11 | 14.87 ± 0.45 | 14.84 ± 0.45 | - | - | ||
| 24 | 7.31 ± 0.07 | 7.32 ± 0.08 | 7.48 ± 0.14 | 7.60 ± 0.20 | 15.11 ± 0.22 | 14.68 ± 0.22 | - | - | ||
| 29 | 7.29 ± 0.11 | 7.30 ± 0.05 | 7.44 ± 0.25 | 7.53 ± 0.14 | 15.07 ± 0.37 | 14.55 ± 0.37 | - | - | ||
| 48 | 7.27 ± 0.09 | 7.29 ± 0.10 | 6.97 ± 0.17 | 6.56 ± 0.25 | 14.86 ± 0.30 | 14.41 ± 0.30 | - | - | ||
References
- WHO. Timeline: WHO’s COVID-19 Response. Available online: https://www.who.int/emergencies/diseases/novel-coronavirus-2019/interactive-timeline (accessed on 26 June 2025).
- Nippes, R.P.; Macruz, P.D.; Da Silva, G.N.; Neves Olsen Scaliante, M.H. A Critical Review on Environmental Presence of Pharmaceutical Drugs Tested for the Covid-19 Treatment. Process Saf. Environ. Prot. 2021, 152, 568–582. [Google Scholar] [CrossRef] [PubMed]
- Favipiravir Market—Global Industry Analysis and Forecast (2023–2029). Available online: https://www.maximizemarketresearch.com/market-report/global-favipiravir-market/99335/ (accessed on 9 December 2025).
- Market Deep Dive: Exploring Remdesivir (COVID-19) Trends 2025–2033. Available online: https://www.datainsightsmarket.com/reports/remdesivir-covid-19-1166355#toc (accessed on 9 December 2025).
- Jain, S.; Kumar, P.; Vyas, R.K.; Pandit, P.; Dalai, A.K. Occurrence and Removal of Antiviral Drugs in Environment: A Review. Water. Air. Soil Pollut. 2013, 224, 1410. [Google Scholar] [CrossRef]
- Wang, R.; Luo, J.; Li, C.; Chen, J.; Zhu, N. Antiviral Drugs in Wastewater Are on the Rise as Emerging Contaminants: A Comprehensive Review of Spatiotemporal Characteristics, Removal Technologies and Environmental Risks. J. Hazard. Mater. 2023, 457, 131694. [Google Scholar] [CrossRef]
- Nannou, C.; Ofrydopoulou, A.; Evgenidou, E.; Heath, D.; Heath, E.; Lambropoulou, D. Antiviral Drugs in Aquatic Environment and Wastewater Treatment Plants: A Review on Occurrence, Fate, Removal and Ecotoxicity. Sci. Total Environ. 2020, 699, 134322. [Google Scholar] [CrossRef]
- Kuroda, K.; Li, C.; Dhangar, K.; Kumar, M. Predicted Occurrence, Ecotoxicological Risk and Environmentally Acquired Resistance of Antiviral Drugs Associated with COVID-19 in Environmental Waters. Sci. Total Environ. 2021, 776, 145740. [Google Scholar] [CrossRef]
- Khan, K.; Kar, S.; Roy, K. Are We Ready to Combat the Ecotoxicity of COVID-19 Pharmaceuticals? An in Silico Aquatic Risk Assessment. Aquat. Toxicol. 2023, 256, 106416. [Google Scholar] [CrossRef]
- Azuma, T.; Ishida, M.; Hisamatsu, K.; Yunoki, A.; Otomo, K.; Kunitou, M.; Shimizu, M.; Hosomaru, K.; Mikata, S.; Mino, Y. Fate of New Three Anti-Influenza Drugs and One Prodrug in the Water Environment. Chemosphere 2017, 169, 550–557. [Google Scholar] [CrossRef]
- Abafe, O.A.; Späth, J.; Fick, J.; Jansson, S.; Buckley, C.; Stark, A.; Pietruschka, B.; Martincigh, B.S. LC-MS/MS Determination of Antiretroviral Drugs in Influents and Effluents from Wastewater Treatment Plants in KwaZulu-Natal, South Africa. Chemosphere 2018, 200, 660–670. [Google Scholar] [CrossRef]
- Wood, T.P.; Duvenage, C.S.J.; Rohwer, E. The Occurrence of Anti-Retroviral Compounds Used for HIV Treatment in South African Surface Water. Environ. Pollut. 2015, 199, 235–243. [Google Scholar] [CrossRef] [PubMed]
- Ul’yanovskii, N.V.; Kosyakov, D.S.; Sypalov, S.A.; Varsegov, I.S.; Shavrina, I.S.; Lebedev, A.T. Antiviral Drug Umifenovir (Arbidol) in Municipal Wastewater during the COVID-19 Pandemic: Estimated Levels and Transformation. Sci. Total Environ. 2022, 805, 150380. [Google Scholar] [CrossRef] [PubMed]
- Bavumiragira, J.P.; Ge, J.; Yin, H. Fate and Transport of Pharmaceuticals in Water Systems: A Processes Review. Sci. Total Environ. 2022, 823, 153635. [Google Scholar] [CrossRef]
- Martinelli, F.; Thiele, I. Microbial Metabolism Marvels: A Comprehensive Review of Microbial Drug Transformation Capabilities. Gut Microbes 2024, 16, 2387400. [Google Scholar] [CrossRef] [PubMed]
- Omokhagbor Adams, G.; Tawari Fufeyin, P.; Eruke Okoro, S.; Ehinomen, I. Bioremediation, Biostimulation and Bioaugmention: A Review. Int. J. Environ. Bioremediation Biodegrad. 2020, 3, 28–39. [Google Scholar] [CrossRef]
- Silva, S.R.; Souza-Silva, G.; Moreira, C.P.D.S.; Vasconcelos, O.M.D.S.R.; Silveira, M.R.; Barbosa, F.A.R.; Magalhães, S.M.S.; Mol, M.P.G. Biodegradation of the Antiretroviral Tenofovir Disoproxil by a Cyanobacteria/Bacterial Culture. Toxics 2024, 12, 729. [Google Scholar] [CrossRef] [PubMed]
- Kümmerer, K. The Presence of Pharmaceuticals in the Environment Due to Human Use—Present Knowledge and Future Challenges. J. Environ. Manage. 2009, 90, 2354–2366. [Google Scholar] [CrossRef] [PubMed]
- Kyaw, B.M.; Champakalakshmi, R.; Sakharkar, M.K.; Lim, C.S.; Sakharkar, K.R. Biodegradation of Low Density Polythene (LDPE) by Pseudomonas Species. Indian J. Microbiol. 2012, 52, 411–419. [Google Scholar] [CrossRef]
- Eckenfelder, W. Activated Sludge: Process Design and Control, 2nd ed.; CRC Press: Boca Raton, FL, USA, 1998; ISBN 978-0-203-96856-7. [Google Scholar]
- Briški, F. Zaštita Okoliša, 1st ed.; Element: Zagreb, Croatia, 2016; ISBN 978-953-197-589-6. [Google Scholar]
- Smith, G.; Onions, A.H.S.; Allsopp, D.; Eggins, H.O.W. Smith’s Introduction to Industrial Mycology; Wiley: Hoboken, NJ, USA, 1981; ISBN 978-0-470-27294-7. [Google Scholar]
- Severo, I.A.; Siqueira, S.F.; Deprá, M.C.; Maroneze, M.M.; Zepka, L.Q.; Jacob-Lopes, E. Biodiesel Facilities: What Can We Address to Make Biorefineries Commercially Competitive? Renew. Sustain. Energy Rev. 2019, 112, 686–705. [Google Scholar] [CrossRef]
- Hansen, C.L.; Cheong, D.Y. Agricultural Waste Management in Food Processing. In Handbook of Farm, Dairy and Food Machinery Engineering; Elsevier: Amsterdam, The Netherlands, 2013; pp. 619–666. ISBN 978-0-12-385881-8. [Google Scholar]
- Mbamalu Ezeh, E.; Chinedu Agu, P.; Aworabhi, E. Biological Treatment Techniques for Sewage: Aerobic and Anaerobic Processes. In Sewage—Management and Treatment Techniques; Abu Hasan, H., Ed.; IntechOpen: London, UK, 2024; ISBN 978-1-83769-967-4. [Google Scholar]
- Yáñez-Hernández, O.; Ríos-Lira, A.J.; Pantoja-Pacheco, Y.V.; Ruelas-Santoyo, E.A.; Asato-España, M.L.; Valdovinos-García, E.M. Characterization of Wastewater in an Activated Sludge Treatment Plant of the Food Sector. Water 2024, 16, 2647. [Google Scholar] [CrossRef]
- Levlin, E. Conductivity Measurements for Controlling Municipal Wastewater Treatment. In Proceedings of a Polish-Swedish-Ukrainian Seminar; Kungliga Tekniska Högskolan: Stockholm, Sweden, 2007; Volume 15. [Google Scholar]
- Srivastava, N.; Chattopadhyay, J. Bacterial Community Structure, Composition and Their Role in Biological Wastewater Treatment Reactors Plants. In Wastewater Treatment Reactors; Elsevier: Amsterdam, The Netherlands, 2021; pp. 583–597. ISBN 978-0-12-823991-9. [Google Scholar]
- Xia, Y.; Wen, X.; Zhang, B.; Yang, Y. Diversity and Assembly Patterns of Activated Sludge Microbial Communities: A Review. Biotechnol. Adv. 2018, 36, 1038–1047. [Google Scholar] [CrossRef]
- Dias, F.F.; Bhat, J.V. Microbial Ecology of Activated Sludge: II. Bacteriophages, Bdellovibrio, Coliforms, and Other Organisms. Appl. Microbiol. 1965, 13, 257–261. [Google Scholar] [CrossRef]
- Oktari, A.; Supriatin, Y.; Kamal, M.; Syafrullah, H. The Bacterial Endospore Stain on Schaeffer Fulton Using Variation of Methylene Blue Solution. J. Phys. Conf. Ser. 2017, 812, 012066. [Google Scholar] [CrossRef]
- Bruslind, L. General Microbiology, 1st ed.; Oregon State University: Corvallis, OR, USA, 2020. [Google Scholar]
- Ryan, M.P.; Pembroke, J.T. Brevundimonas spp.: Emerging Global Opportunistic Pathogens. Virulence 2018, 9, 480–493. [Google Scholar] [CrossRef]
- Ryu, S.H.; Park, M.; Lee, J.R.; Yun, P.-Y.; Jeon, C.O. Brevundimonas aveniformis sp. Nov., a Stalked Species Isolated from Activated Sludge. Int. J. Syst. Evol. Microbiol. 2007, 57, 1561–1565. [Google Scholar] [CrossRef] [PubMed]
- Karadag, N.; Karagol, B.S.; Kundak, A.A.; Dursun, A.; Okumus, N.; Tanır, G.; Zencıroglu, A. Spectrum of Brevundimonas Vesicularis Infections in Neonatal Period: A Case Series at a Tertiary Referral Center. Infection 2012, 40, 509–515. [Google Scholar] [CrossRef]
- Gebreil, A.S.; Abraham, W.-R. Diversity and Activity of Bacterial Biofilm Communities Growing on Hexachlorocyclohexane. Water. Air. Soil Pollut. 2016, 227, 295. [Google Scholar] [CrossRef]
- Tiwari, S.; Nanda, M. Bacteremia Caused by Comamonas Testosteroni an Unusual Pathogen. J. Lab. Physicians 2019, 11, 087–090. [Google Scholar] [CrossRef] [PubMed]
- Wang, Y.-H.; Huang, Z.; Liu, S.-J. Chemotaxis Towards Aromatic Compounds: Insights from Comamonas Testosteroni. Int. J. Mol. Sci. 2019, 20, 2701. [Google Scholar] [CrossRef]
- Sidahmed, O.A.A.; Khider, M.M.; Taha, A.K.; Mahmoud, M.E.E.; Swicicka, I. Possibilities of Biological Control of Bactroceradorsalis(Hendel) (Diptera: Tephritidae) Using Bacillus Subtilis/Amyloliquefaciensand Bacillus Sphaericus in Sudan. J. Agric. Food Dev. 2018, 3, 27–33. [Google Scholar] [CrossRef]
- Luo, L.; Zhao, C.; Wang, E.; Raza, A.; Yin, C. Bacillus Amyloliquefaciens as an Excellent Agent for Biofertilizer and Biocontrol in Agriculture: An Overview for Its Mechanisms. Microbiol. Res. 2022, 259, 127016. [Google Scholar] [CrossRef]
- Liu, W.; Wang, X.; Wu, L.; Chen, M.; Tu, C.; Luo, Y.; Christie, P. Isolation, Identification and Characterization of Bacillus Amyloliquefaciens BZ-6, a Bacterial Isolate for Enhancing Oil Recovery from Oily Sludge. Chemosphere 2012, 87, 1105–1110. [Google Scholar] [CrossRef]
- Di Franco, C.; Beccari, E.; Santini, T.; Pisaneschi, G.; Tecce, G. Colony Shape as a Genetic Trait in the Pattern-Forming Bacillus Mycoides. BMC Microbiol. 2002, 2, 33. [Google Scholar] [CrossRef]
- Yudono, B.; Said, M.; Hakstege, P.; Suryadi, F.X. Kinetics of Indigenous Isolated Bacteria Bacillus Mycoides Used for Ex-Situ Bioremediation of Petroleum Contaminated Soil in PT Pertamina Sungai Lilin South Sumatera. J. Sustain. Dev. 2009, 2, 64–71. [Google Scholar] [CrossRef]
- Ilyas, M.; Sharma, A. Cutaneous Fungal Infections in Solid Organ Transplant Recipients. Transplant. Rev. 2017, 31, 158–165. [Google Scholar] [CrossRef] [PubMed]
- Sietmann, R.; Hammer, E.; Specht, M.; Cerniglia, C.E.; Schauer, F. Novel Ring Cleavage Products in the Biotransformation of Biphenyl by the Yeast Trichosporon mucoides. Appl. Environ. Microbiol. 2001, 67, 4158–4165. [Google Scholar] [CrossRef] [PubMed][Green Version]
- Wu, M.-L.; Zhu, C.-C.; Qi, Y.-Y.; Shi, Y.-X.; Xu, H.-N.; Yang, J.-R. [Isolation, Identification and Degradation Characteristics of a 17β-estradiol Degrading Strain Fusarium sp. KY123915]. Huan Jing Ke Xue Huanjing Kexue 2018, 39, 4802–4808. [Google Scholar] [CrossRef]
- Al-Otibi, F.; Al-Zahrani, R.M.; Marraiki, N. Biodegradation of Selected Hydrocarbons by Fusarium Species Isolated from Contaminated Soil Samples in Riyadh, Saudi Arabia. J. Fungi 2023, 9, 216. [Google Scholar] [CrossRef]
- Zhao, O.; Zhang, X.; Feng, S.-D.; Zhang, L.-X.; Shi, W.; Yang, Z.; Chena, M.-M.; Fanga, X.-D. Starch-Enhanced Degradation of HMW PAHs by Fusarium Sp. in an Aged Polluted Soil from a Coal Mining Area. Chemosphere 2017, 174, 774–780. [Google Scholar] [CrossRef]
- Bosu, S.; Rajamohan, N.; Al Salti, S.; Rajasimman, M.; Das, P. Biodegradation of Chlorpyrifos Pollution from Contaminated Environment—A Review on Operating Variables and Mechanism. Environ. Res. 2024, 248, 118212. [Google Scholar] [CrossRef]
- Wang, J.; Wang, S. Removal of Pharmaceuticals and Personal Care Products (PPCPs) from Wastewater: A Review. J. Environ. Manage. 2016, 182, 620–640. [Google Scholar] [CrossRef]
- Tchobanoglous, G.; Eddy, M.; Stensel, H.D.; Tsuchihashi, R.; Burton, F.L.; Abu-Orf, M.; Bowden, G.; Pfrang, W. Wastewater Engineering: Treatment and Resource Recovery; McGraw-Hill series in civil and environmental engineering; McGraw-Hill Education: Columbus, OH, USA, 2014; ISBN 978-1-259-25093-4. [Google Scholar]
- Das, N.; Chandran, P. Microbial Degradation of Petroleum Hydrocarbon Contaminants: An Overview. Biotechnol. Res. Int. 2011, 2011, 1–13. [Google Scholar] [CrossRef]
- Tahraoui, H.; Toumi, S.; Boudoukhani, M.; Touzout, N.; Sid, A.N.E.H.; Amrane, A.; Belhadj, A.-E.; Hadjadj, M.; Laichi, Y.; Aboumustapha, M.; et al. Evaluating the Effectiveness of Coagulation–Flocculation Treatment Using Aluminum Sulfate on a Polluted Surface Water Source: A Year-Long Study. Water 2024, 16, 400. [Google Scholar] [CrossRef]
- Aissaoui, S.; Ouled-Haddar, H.; Sifour, M.; Beggah, C.; Benhamada, F. Biological Removal of the Mixed Pharmaceuticals: Diclofenac, Ibuprofen, and Sulfamethoxazole Using a Bacterial Consortium. Iran. J. Biotechnol. 2017, 15, 135–142. [Google Scholar] [CrossRef]
- Alfonso-Muniozguren, P.; Serna-Galvis, E.A.; Bussemaker, M.; Torres-Palma, R.A.; Lee, J. A Review on Pharmaceuticals Removal from Waters by Single and Combined Biological, Membrane Filtration and Ultrasound Systems. Ultrason. Sonochem. 2021, 76, 105656. [Google Scholar] [CrossRef]
- Tóth, G.; Veres, Z.; Lakatos, G.; Balázsy, S. The Elimination of Pharmaceutical Agents with Microbiological Treatment from Municipal Sewage. Sustainability 2023, 15, 2991. [Google Scholar] [CrossRef]
- Trussell, R.S.; Merlo, R.P.; Hermanowicz, S.W.; Jenkins, D. Influence of Mixed Liquor Properties and Aeration Intensity on Membrane Fouling in a Submerged Membrane Bioreactor at High Mixed Liquor Suspended Solids Concentrations. Water Res. 2007, 41, 947–958. [Google Scholar] [CrossRef] [PubMed]
- Benedict, R.G.; Carlson, D.A. Aerobic Heterotrophic Bacteria in Activated Sludge. Water Res. 1971, 5, 1023–1030. [Google Scholar] [CrossRef]
- Rusch, M.; Spielmeyer, A.; Zorn, H.; Hamscher, G. Degradation and Transformation of Fluoroquinolones by Microorganisms with Special Emphasis on Ciprofloxacin. Appl. Microbiol. Biotechnol. 2019, 103, 6933–6948. [Google Scholar] [CrossRef] [PubMed]
- Toker, S.K.; Ali, K. First Report on the Biodegradation of Favipiravir, Oseltamivir, and Ciprofloxacin by a Marine-Derived 810 Alternaria sp. D21: A Sustainable Approach for Pharmaceutical Wastewater Treatment. SSRN 2025. [Google Scholar] [CrossRef]
- Dogruel, S.; Chavoshi, N.; Bilgin-Saritas, N.; Khataee, A.; Topuz, E.; Pehlivanoglu, E. Degradation and Ecotoxicity of Favipiravir and Oseltamivir in the Presence of Microplastics during Ozonation and Catalytic Ozonation of Synthetic Municipal Wastewater Effluents. J. Chem. Technol. Biotechnol. 2025, 100, 955–966. [Google Scholar] [CrossRef]
- Hoseininezhad-Namin, M.S.; Rahimpour, E.; Jouyban, A. Favipiravir, Remdesivir, and Lopinavir: Metabolites, Degradation Products and Their Analytical Methods. Drug Metab. Rev. 2024, 56, 127–144. [Google Scholar] [CrossRef]
- Zaman, B.; Hassan, W. Development of Stability Indicating HPLC–UV Method for Determination of Daclatasvir and Characterization of Forced Degradation Products. Chromatographia 2018, 81, 785–797. [Google Scholar] [CrossRef]
- Yamjala, K.; Atukuri, J.; Nagappan, K.; Shivaraju, N.H.; Nainar, M.S. Characterization of Oxidative Degradation Product of Darunavir by LC-MS/MS. Sci. Pharm. 2015, 83, 623–633. [Google Scholar] [CrossRef]
- Rao, R.N.; Ramachandra, B.; Vali, R.M.; Raju, S.S. LC–MS/MS Studies of Ritonavir and Its Forced Degradation Products. J. Pharm. Biomed. Anal. 2010, 53, 833–842. [Google Scholar] [CrossRef]
- Nalanda, R.B.; Priya, G.R.; Horan, A. Method Development and Stress Degradation Profile of Umifenovir by UV Spectrophotometry. J. Drug Deliv. Ther. 2024, 14, 74–82. [Google Scholar] [CrossRef]
- Huang, Y.; Su, B.-N.; Marshall, J.; Miller, S.A. Forced Oxidative Degradation Pathways of the Imidazole Moiety of Daclatasvir. J. Pharm. Sci. 2019, 108, 3312–3318. [Google Scholar] [CrossRef]
- Dadinaboyina, S.B.; Yerra, N.V.; Adimoolam, B.M.; Parsa, S.; Bathini, N.B.; Thota, J.R. Identification and Characterization of Degradation Products of Remdesivir Using Liquid Chromatography/Mass Spectrometry. New J. Chem. 2021, 45, 7217–7224. [Google Scholar] [CrossRef]
- Liang, X.; Liu, Y. Unraveling Biodegradation Mechanisms of Favipiravir by the Partial Nitritation Granular Sludge. E3S Web Conf. 2025, 625, 02011. [Google Scholar] [CrossRef]
- Ahmed, H.; Siddiqui, B.; Felis, E. Adsorption and Photodegradation as Processes Enabling the Removal of Antiviral Drug Ritonavir from the Aquatic Environment. J. Ecol. Eng. 2025, 26, 195–202. [Google Scholar] [CrossRef] [PubMed]
- Czech, B.; Krzyszczak, A.; Boguszewska-Czubara, A.; Opielak, G.; Jośko, I.; Hojamberdiev, M. Revealing the Toxicity of Lopinavir- and Ritonavir-Containing Water and Wastewater Treated by Photo-Induced Processes to Danio Rerio and Allivibrio Fischeri. Sci. Total Environ. 2022, 824, 153967. [Google Scholar] [CrossRef]
- Barra Caracciolo, A.; Topp, E.; Grenni, P. Pharmaceuticals in the Environment: Biodegradation and Effects on Natural Microbial Communities. A Review. J. Pharm. Biomed. Anal. 2015, 106, 25–36. [Google Scholar] [CrossRef]


Disclaimer/Publisher’s Note: The statements, opinions and data contained in all publications are solely those of the individual author(s) and contributor(s) and not of MDPI and/or the editor(s). MDPI and/or the editor(s) disclaim responsibility for any injury to people or property resulting from any ideas, methods, instructions or products referred to in the content. |
© 2025 by the authors. Licensee MDPI, Basel, Switzerland. This article is an open access article distributed under the terms and conditions of the Creative Commons Attribution (CC BY) license.