Abstract
In this study, a high-performance thin-layer chromatography (HPTLC)-based method was developed for the quantification of five water-soluble vitamins, B2, B3, B6, B12, and C, using ethanol–water (70:30, v/v) as the mobile phase. The method was validated according to the International Conference on Harmonisation (ICH) guidelines and the limits of detection/limits of quantification were determined as 5.27/15.97 ng (Vitamin B2), 13.03/39.47 ng (Vitamin B3), 59.61/180.64 ng (Vitamin B6), 14.17/42.93 ng (Vitamin B12), and 119.27/361.42 ng (Vitamin C) per band, respectively. The usefulness of the validated method for quality control was demonstrated with the successful quantitative analysis of the five vitamins in a range of nutraceuticals.
1. Introduction
Differences in their hydrophilic/lipophilic nature, molecular weight, ionization status, and different solubility profiles, as well as differences in their chromophore and other chemical characteristics that can be exploited in their detection, make the analysis of targeted molecules a sometimes challenging undertaking. This is particularly the case when several of these molecules are combined and when they are embedded in a complex carrier matrix, which in itself can be composed of often very different and at times poorly defined chemical constituents. Taking into account their diverse origins, these complex matrices can be classified into biological fluids, plant extracts, foods, environmental matrices (e.g., seawater, soil, and wastewater), and pharmaceutical preparations [1,2].
Vitamins play an important role in some metabolic processes (e.g., fat, protein, and carbohydrate metabolism) and contribute to the maintenance of health. However, as they occur naturally only in trace or microscopic amounts in regularly consumed food, it is difficult to know if dietary needs are met. Thus, some consumers revert to nutraceuticals, which are dietary supplements that support health, to ensure adequate vitamin intake. Planning a nutritious, well-balanced diet for maximum nutrient intake and evaluating dietary adequacy depends on having accurate information about the vitamin content of foods, as well as nutraceuticals that might complement a consumer’s nutrition. Thus, there is a need for analytical methods for the quantification of vitamins in a range of matrices, including food items and nutraceuticals. Previous studies reported on the use of capillary electrophoresis (CE), UV–Vis spectrophotometry, fluorimetry, chemiluminescence, atomic absorption, liquid chromatography (LC), thin-layer chromatography (TLC), gas chromatography (GC), and high-performance liquid chromatography (HPLC), sometimes coupled with liquid chromatography/mass spectrometry (LC/MS), for the analysis of nutraceuticals [3,4,5,6]. Similarly, a range of chromatographic techniques such as HPLC, reversed-phase HPLC, mass spectrometry (MS), LC/MS, and ultraperformance liquid chromatography systems (UPLCs) have been commonly employed specifically for the analysis of vitamins in food samples [7].
Nowadays, High-Performance Thin-Layer Chromatography (HPTLC) enjoys increasing popularity as an analytical tool because of its accuracy, reproducibility, and precision in many different qualitative and quantitative analyses. Compared to other, more established, chromatographic techniques, such as High-Performance Liquid Chromatography (HPLC) and Gas Chromatography (GC), HPTLC analysis appears to be often faster as it offers the option of analyzing a large number of samples simultaneously [8]. Another advantage is its low solvent and reagent input, which translates into a relatively cost-effective method of analysis that is often also claimed to be ‘greener’ than other analytical approaches [9]. An additional characteristic that sets HPTLC analysis apart from other analytical approaches is the wealth of information that is created to assist with compound identification and/or quantification. After their chromatographic separation, individual bands, which represent separated compounds, can be visualized at white light (254 nm and 366 nm), with or without derivatization, with a suitable reagent. The latter can also include derivatization with reagents that are indicative of in vitro bioactivity (e.g., combined with DPPH spraying for detection of antioxidant activity) [10]. Colors and associated hue values of individual bands can be used for the identification of compound classes (e.g., flavonoids and amino acids) or even individual compounds, and the recording of UV–Vis and/or fluorescence spectra of individual bands can further aid in the analysis [11]. Due to its advantages over other analytical tools, HPTLC has also been frequently used in the analysis of foodstuffs and nutraceuticals. As water-soluble vitamins are less stable compared to their fat-soluble counterparts, an HPTLC-based analytical tool was, for example, developed to track their loss in nutraceutical powder formulations during processing and storage [12]. Moreover, vitamin B12, which is found in high concentrations in animal-derived food items such as milk, egg, meat, or fish, has been demonstrated to be readily quantifiable by a ‘miniatured’ HPTLC method which features a short migration distance (4.5 cm) and development time (<45 min), while at the same time yielding high separation efficiency and sensitivity (>25 pmol at 254 nm) [13].
However, there are still some significant limitations to existing HPTLC-based methods for evaluating water-soluble vitamins. The previously published literature revealed that to detect and quantify a larger number of water-soluble vitamins in nutraceuticals and foods, or even when pure vitamin standards are employed, more than one mobile phase or multiple development steps [12,13,14,15,16], or a combination with other analytical techniques such as luminescence and Raman spectroscopy [15,17], might be necessary. Specifically, it appears that, to date, more than four water-soluble vitamins could not be analyzed simultaneously using a single mobile phase and a single development step (Table 1). These analytical challenges are not surprising considering the wide range of chemical characteristics found within water-soluble vitamins. Cyanocobalamin (B12), for example, is a coordination complex, pyridoxin (B6) and ascorbic acid (C) are characterized by high levels of hydrophilicity compared to other water-soluble vitamins, and riboflavin (B2) has both hydrophilic and lipophilic characteristics, whereas niacin (B3), despite being classified as a water-soluble vitamin, has relatively low solubility in water [14,18].

Table 1.
Published HPTLC-based studies used for analyzing water-soluble vitamins.
Given the limitations of previous HPTLC-based methods for the analysis of water-soluble vitamins, the aims of this study were (1) to develop an analysis system that allows for the simultaneous, accurate, and reproducible detection and quantification of vitamins B2, B3, B6, B12, and C using a single mobile phase, (2) to validate this method following the International Council for Harmonisation (ICH) guidelines, and (3) to successfully apply the method to the analysis of vitamins in nutraceutical complex matrices. The chemical structures of five water-soluble vitamins are visualized in Figure 1.
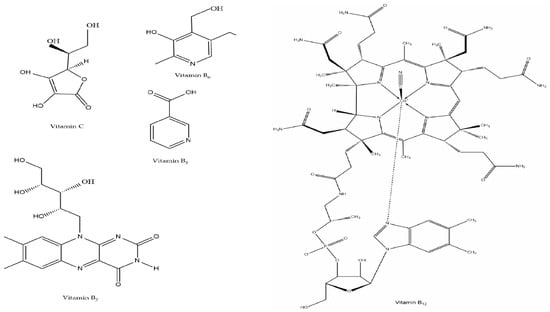
Figure 1.
Chemical structures of water-soluble vitamins [13].
2. Materials and Methods
2.1. Chemicals and Reagents
Analytical-grade chemicals and reagents were used throughout this study. The vitamin standards (riboflavin—Vitamin B2, niacin—Vitamin B3, pyridoxin—Vitamin B6, cyanocobalamin–Vitamin B12, and ascorbic acid—Vitamin C) were sourced from Sigma-Aldrich (St. Louis, MO, USA). Ethanol was purchased from Chem-Supply (Gillman, Adelaide, South Australia) and methanol from Scharlau (Barcelona, Spain). Silica gel 60 F254 HPTLC glass plates (20 cm × 10 cm) were bought from Merck KGaA (Darmstadt, Germany).
2.2. Commercial Samples
Five commercially available nutraceuticals in three different dosage forms (i.e., liquid, tablets, and effervescent tablets) were purchased from Chemist Warehouse, Australia and a local pharmacy in Dhaka, Bangladesh (Table 2). All samples were stored at 4 °C before their analysis.
Table 2.
List of analyzed nutraceuticals.
2.3. Sample Preparation
2.3.1. Standard and Mobile Phase Preparation
Aqueous standard solutions of various concentrations were prepared of all five water-soluble vitamin standards: 50–250 µg/mL for vitamins B2 and B12, 800–1600 µg/mL for B6 and C, and 100–500 µg/mL for B3 [12]. As water-soluble vitamins are very unstable, the standard solutions were freshly prepared for every analysis. Different mobile phases (MP) were trialed (Table 3) and a mixture of ethanol and water at a ratio of 70:30 (v/v) was found to be suitable for the simultaneous analysis of all five vitamins.
Table 3.
Trial experiments with different mobile phase compositions.
2.3.2. Sample Preparation
To assess the label-claimed content of vitamins in the liquid multivitamin sample, 1 mL of MV1 syrup was diluted with deionized water to 10 mL. For analyzing the other four multivitamin samples, randomly tablets from each brand were selected, weighed, crushed with a mortar and pestle, and thoroughly mixed. A total of 500 mg of the crushed powder of MV2 and MV3, 4.80 g of MV4, and 700 mg of MV5 were taken and dissolved in 100 mL of deionized water with shaking. The samples were filtered with a 0.20 µm syringe filter and the filtrate was stored at −80 °C before analysis. Each sample was analyzed in triplicate.
2.4. Instrumentation and HPTLC Method
2.4.1. Standard and Sample Application
Standard solutions of vitamins were applied using a semi-automated HPTLC application device (Linomat 5, CAMAG, Muttenz, Switzerland) with application volumes of 2–10 μL for vitamin B2, 1–5 μL for vitamins B3 and B12, and 4–8 μL for vitamins B6 and C at a rate of 30 nL/s at 8.0 mm from the lower edges and 13 mm from the side edges of the HPTLC plates to produce bands with a length of 8.0 mm 9.5 mm apart. Standard curves were produced with concentrations ranging from 50–250 ng, 100–500 ng, 800–1600 ng, 50–250 ng, and 800–1600 ng per band of vitamin B2, B3, B6, B12, and C, respectively.
2.4.2. Sample Development
Silica gel 60 F254 HPTLC plates (glass plates 20 × 10 cm) were used for the chromatographic separation. Development of the HPTLC plates with ethanol/water (70:30, v/v) was performed in a saturated and activated (33% relative humidity) automated development chamber (ADC2, CAMAG) at ambient temperature. The plates were pre-conditioned with the mobile phase for 5 min, the development chamber was saturated for 45 min, automatically developed with 10 mL of the mobile phase to a migration distance of 70 mm, and dried for 5 min. The HPTLC suite was operated by a specialized HPTLC software (visionCATS v3.1, CAMAG) and an HPTLC imaging device (TLC Visualiser 2, CAMAG) was used to document the chromatographic results obtained at 254 nm and 366 nm. After imaging, the developed plates were scanned using a TLC Scanner 4 (CAMAG) with a scanning speed of 20 mm/s at 264 nm (vitamin B3), 270 nm (vitamin B2), 296 nm (vitamin B6), 363 nm (vitamin B12), and 271 nm (vitamin C), which constitute the λmax values of the respective vitamins.
2.5. Method Validation
In accordance with the International Conference on Harmonisation (ICH) guidelines Q2 (R1), the developed method for the quantification of vitamins B2, B3, B6, B12, and C was validated for specificity, linearity, sensitivity, precision, accuracy, repeatability, and robustness [21].
2.5.1. Specificity
The specificity of an analytical procedure can be demonstrated by the ability of the method to measure the analyte of interest without the interference of potential substances or closely related compounds that may be present in the matrix. In this study, specificity was verified by simultaneously analyzing all five vitamin solutions, which yielded individual bands for vitamins B2, B3, B6, B12, and C with distinct retardation factors (RF).
2.5.2. Linearity
The linearity of an analytical procedure is the capability to achieve results within a given range which are directly proportional to the concentration of the analyte. In this study, the linearity of the method was evaluated by analyzing the standards of the targeted water-soluble vitamin solutions of different volumes (1–10 μL) in different concentration ranges, 50–250 ng/band, 100–500 ng/band, 800–1600 ng/band, 50–250 ng/band, and 800–1600 ng/band for vitamins B2, B3, B6, B12, and C, respectively. For each sample, three replicate measurements were conducted in three separate experiments. Five-point linear calibration curves were generated for each vitamin and peak heights were plotted against the corresponding concentrations of all the five vitamin standards and evaluated by linear regression analysis. The coefficient of determination (r2), slope (m), y-intercept (c), and standard deviation (SD) of the calibration curves were determined.
2.5.3. Sensitivity
The sensitivity of an analytical method is defined as the ability to identify and quantify small amounts of analyte in samples. Under the stated experimental conditions, the limit of detection (LOD) then refers to the lowest amount of the sample that can be detected but not necessarily quantified and the limit of quantification (LOQ) is defined as the lowest amount of analyte in a sample that can be quantitatively determined with suitable accuracy, precision, and reproducibility. Using three calibration curves each, LOD and LOQ values for all vitamin standards were calculated using the formulas stated in the ICH guidelines:
where σ is the standard deviation (SD) of the regression line and S is the average slope value of triplicate calibration curves.
LOD = 3.3 σ/S and
LOQ = 10 σ/S
2.5.4. Precision
The precision of an analytical procedure demonstrates the closeness of agreement between a series of results obtained from multiple samples when the method is applied repeatedly under the same prescribed conditions but at different times, on different instruments, and/or by different laboratories. Precision can be considered at three levels, namely repeatability (same operating conditions over a short interval of time), intermediate precision (within-laboratory variations, analyzing the sample on different days, by different analysts, and on different equipment), and reproducibility (between laboratories). The precision of this study was validated for intermediate precision and repeatability by carrying out triplicate analyses of three different concentrations of the respective water-soluble vitamin samples: 70, 140, and 210 ng/band for vitamins B2 and B12; 200, 300, and 400 ng/band for vitamin B3; 1000, 1250, and 1500 ng/band for vitamin B6; and 1000, 1200, and 1400 ng/band for vitamin C. The percent relative standard deviation (%RSD) of the results obtained from peak height was obtained to express the respective levels of intermediate precision and repeatability for each vitamin.
2.5.5. Accuracy
The accuracy of the method expresses the closeness of agreement between the value which is accepted either as a conventional true value or an accepted reference value and the value found. In this study, accuracy was established by analyzing the percentage recovery of each vitamin at three different concentration levels. The sample standards were applied with three known concentrations for each vitamin: 70, 140, and 210 ng/band for vitamins B2 and B12, 200, 300, and 400 ng/band for vitamin B3, 1000, 1250, and 1500 ng/band for vitamin B6, and 1000, 1200, and 1400 ng/band for vitamin C. Each experiment was conducted in triplicate and accuracy was measured by the % recovery and %RSD of standards.
2.5.6. Repeatability
Repeatability expresses the precision under the same operating conditions over a short interval of time. The repeatability of this method was studied by analyzing vitamin standard solutions five times at a concentration of 140 ng/band for vitamins B2 and B12, 300 ng/band for vitamin B3, 1250 ng/band for vitamin B6, and 1200 ng/band for vitamin C. Findings were expressed as %RSD of standards.
2.5.7. Robustness
Robustness is defined as the capacity of an analytical procedure to produce reliable and reproducible results when small deliberate changes to the experimental conditions are made. In this study, robustness was evaluated by analyzing three different concentrations of vitamin standards: 70, 140, and 210 ng/band for vitamins B2 and B12, 200, 300, and 400 ng/band for vitamin B3, 1000, 1250, and 1500 ng/band for vitamin B6, and 1000, 1200, and 1400 ng/band for vitamin C after (a) slightly changing the mobile phase volume in the development chamber (±2 mL); (b) after slight changes to the mobile phase composition (ethanol/water, 72:30 and 70:32, v/v); and (c) after changing the saturation time of the development chamber (±5 min). Results were expressed as the RF values of individual vitamins and their % recovery.
3. Results and Discussion
3.1. Mobile Phase Selection
In this study, the aim was to develop an HPTLC method for quantifying five water-soluble vitamins in complex matrices such as nutraceutical preparations. To achieve this goal, several mobile phases were trialed during the method development stage of this study (Table 3). Mobile phase (MP) 8 was found to be the optimum mobile phase, which ensured adequate separation of the five water-soluble vitamins B2, B3, B6, B12, and C, with individual bands based on their respective RF values (Figure 2). To date, this mobile phase was previously only used for the quantification of vitamin D3 (cholecalciferol) in commercial tablets [22].
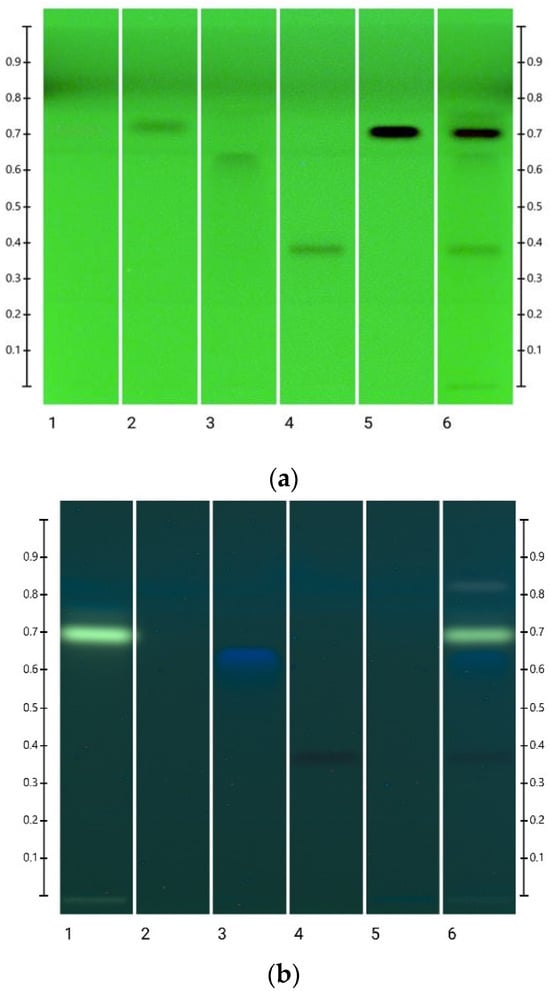
Figure 2.
HPTLC image visualized at (a) 254 nm and (b) 366 nm: track 1: Vit B2; track 2: Vit B3; track 3: Vit B6; track 4: Vit B12; track 5: Vit C; track 6: a mixture of vitamins B2, B3, B6, B12, and C.
3.2. Detection Wavelength Selection (Visual Image Evaluation) and Absorbance Peak Intensity
Five sets of images (R white—Remission at white light, T white—Transmission at white light, RT white—Remission and transmission at white light, 254 nm, and 366 nm) were taken for analysis and visionCATS v3.1 (CAMAG) software was used to analyse each set of images. Consistent results (i.e., % recovery and correlation coefficient (r2) values) were found for vitamins B3, B6, B12, and C at 254 nm and vitamin B2 at 366 nm over the entire concentration range of their respective calibration curves. Absorbance peak heights versus concentration of the respective vitamin standard curves were plotted for quantitative analysis. Over the entire calibration range, peak heights vs. concentration produced reliable and accurate results for all five vitamins.
3.3. Chromatographic Results and UV–Vis Spectra
HPTLC separated vitamins B2, B3, B6, B12, and C to produce distinct RF values: RF 0.70 (vitamin B2), 0.76 (vitamin B3), 0.64 (vitamin B6), 0.37 (vitamin B12), and 0.75 (vitamin C). The recording of the UV–Vis spectrum of each water-soluble vitamin (Figure 3) allowed us to determine the optimum wavelength (λmax) for analysis, which was 270 nm for vitamin B2, 264 nm for vitamin B3, 296 nm for vitamin B6, 363 nm for vitamin B12, and 271 nm for vitamin C. The RF values of vitamins B2, B3, and C were very similar, but as vitamin B2 could only be consistently seen at 366 nm, the similar RF did not interfere with its precise and accurate quantification in the presence of the other two vitamins. For vitamins B3 and C, their maximum wavelengths λmax were found at 264 nm (Figure 3b) and 271 nm (Figure 3e), which ensured their accurate and precise quantification at these wavelengths when peak height was used for analysis.
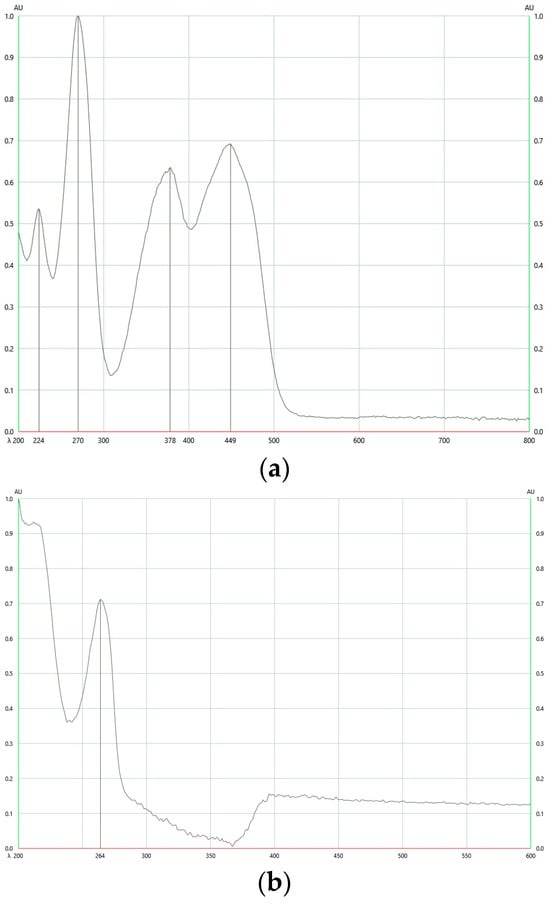
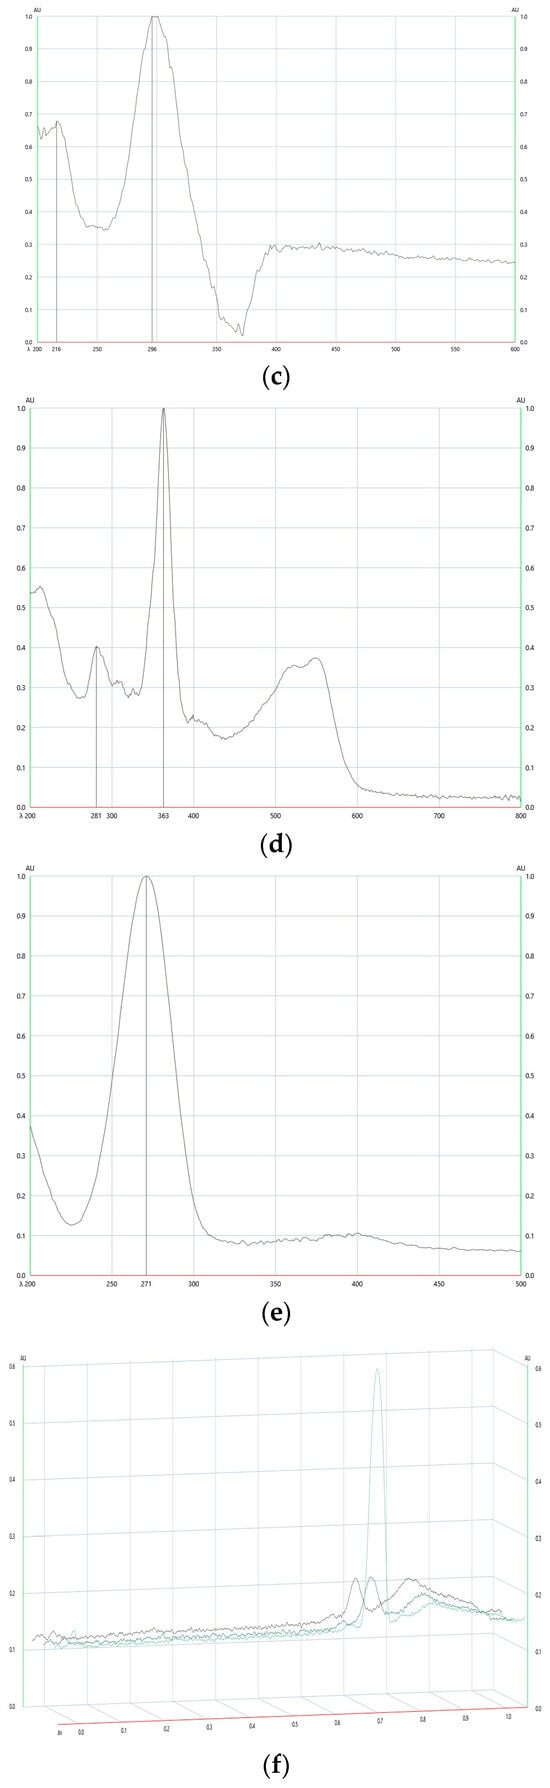
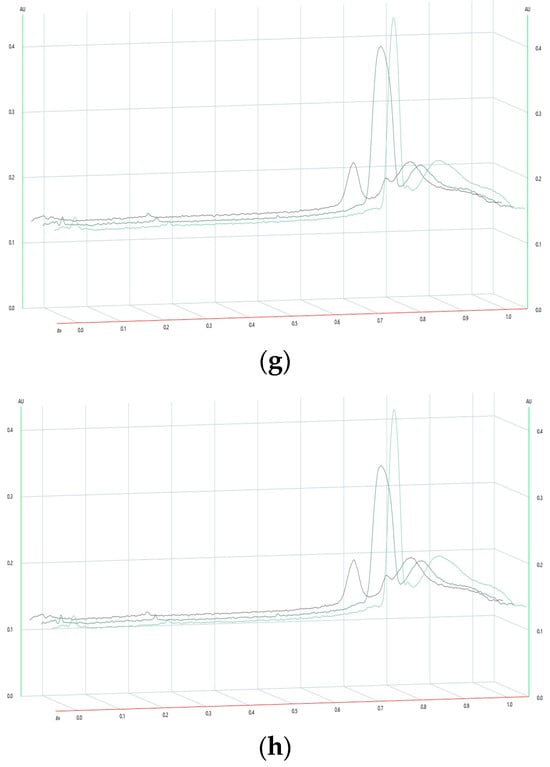
Figure 3.
The absorption maxima of vitamins (a) B2—270 nm, (b) B3—264 nm, (c) B6—296 nm, (d) B12—363 nm, and (e) C—271 nm, over a spotted standard spectrum at (f) 264 nm, (g) 270 nm, and (h) 271 nm for vitamins B2, B3, and C.
3.4. Method Validation
The specificity of the method was assessed by evaluating the bands at their specific RF values. Peak intensity was plotted against concentration for quantitative analysis. The linearity ranges were 50–250 ng/band, 100–500 ng/band, 800–1600 ng/band, 50–250 ng/band, and 800–1600 ng/band for vitamins B2, B3, B6, B12, and C, respectively. The linearity of the analytical method was validated by the linear regression and correlation coefficient (R) of the standard curves. The sensitivity of the analytical methods in terms of LOD and LOQ was calculated by using the trend line equation of the three different calibration curves. Three replicate HPTLC runs were performed for every vitamin and the r2 values of most runs for all the respective vitamins were found to be greater than 0.98. The LOD for vitamins B2, B3, B6, B12, and C was 5.27 ng/band, 13.03 ng/band, 59.61 ng/band, 14.17 ng/band, and 119.27 ng/band, and the LOQ was 15.97 ng/band, 39.47 ng/band, 180.64 ng/band, 42.93 ng/band, and 361.42 ng/band, respectively (Table 4). In comparison with other similar studies, the sensitivity of this method could be greatly improved [12,14].
Table 4.
Linear regression data for the calibration curves of vitamins B2, B3, B6, B12, and C.
The accuracy of the method was determined based on sample recovery. Using the standard addition method, the sample recovery was calculated by the % mean recovery of each of the vitamin samples. The results revealed that the level of accuracy was high with % mean recovery ranging from 97.83% to 100.78% for vitamin B2, 99.70% to 102.33% for vitamin B3, 96.46% to 102.61% for vitamin B6, 98.79% to 100.43% for vitamin B12, and 99.25% to 101.17% for vitamin C, which were all within the acceptable range according to the ICH Guidelines (Table 5).
Table 5.
Recovery of vitamins B2, B3, B6, B12, and C.
The repeatability (intra-day) and intermediate precision (inter-day) of the study were calculated based on %RSD values, which were all found to be less than 5% and within acceptable limits as per the ICH Guidelines (Table 6 and Table 7), indicating that the developed method has a high degree of precision.
Table 6.
Precision study of vitamins B2, B3, B6, B12, and C (intra-day).
Table 7.
Precision study of vitamins B2, B3, B6, B12, and C (inter-day).
Repeatability, which was expressed as SD and %RSD, is an indicator of system precision. The obtained results demonstrate that the %RSD was within acceptable limits as the range for all five vitamins was within 1.07% to 3.09% (Table 8), thus confirming high levels of confidence in the repeatability of the method.
Table 8.
Repeatability (System Precision).
For assessing the robustness of the method, the parameters of the optimized method were intentionally changed slightly. Specifically, the mobile phase volume, the saturation time, and the mobile phase composition were changed slightly to evaluate the robustness of the method. The obtained data on robustness are shown in Table 9, Table 10 and Table 11. As can be seen, small changes in mobile phase volume, saturation time, and mobile phase composition had only minimal effects on RF values and did not affect the quantification of all the analyzed vitamins.
Table 9.
Robustness: Change in mobile phase volume.
Table 10.
Robustness: Change in saturation time.
Table 11.
Robustness: Change in mobile phase composition.
4. Application of the Method
The objective of this study was to develop and fully validate an HPTLC tool for the simultaneous analysis of targeted water-soluble vitamins in nutraceuticals. Three different types of commercial samples (i.e., tablet, effervescent tablet, and liquid suspension—Table 2) were analyzed three times to identify and quantify the targeted water-soluble vitamins in order to demonstrate the suitability of the developed HPTLC method. The results of the quantitative analyses are summarised in Table 12. Sample MV1 was a liquid dosage form and contained other vitamins, minerals, and excipients that did not interfere with the analysis of vitamin C. An average of 1292.58 mg of vitamin C per 100 mL solution (n = 3) was found in MV1, which is 95.75% of the stated content. While this formulation claimed to also contain vitamin B2, its HPTLC fingerprint at 366 nm produced a bright yellow band with a much lower RF value than expected (RF of 0.4 rather than 0.7). Moreover, the UV spectrum of the band was found to differ from that of vitamin B2, although both bands shared an absorbance maximum at 270 nm. This indicates that the compounds are chemically related, possibly suggesting the band to be a degradation product of vitamin B2, although further analyses would be necessary to confirm this. Vitamin B12, which MV1 also contains, was not detectable due to its low concentration in the formulation. After analyzing the multivitamin tablet formulation MV2, vitamins B2, B3, and C were found at 101.27%, 95.24%, and 92.67% of their stated content, respectively. It was, however, impossible to detect vitamins B6 and B12 in this sample as their declared concentrations were below the LOD of the developed method. Analyzing another multivitamin tablet sample, MV3, which contains four of the targeted vitamins (B2, B6, B12, and C), only vitamin B2 could be detected and quantified at 101.82% of its stated amount. The other three vitamins in this formulation, vitamins B6, B12, and C, had concentrations below the detection limit of the developed method. Vitamins B2, B3, and C were found at 94.27%, 94.07%, and 100.72% of their stated content, respectively, in the nutraceutical MV4, which was an effervescent tablet. Moreover, a high vitamin B12-containing supplement tablet (MV5) that contains several other excipients (Table 12) yielded a recovery of 97.32% of the stated amount.
Table 12.
Determined Percentage Stated Content of vitamins B2, B3, B6, B12, and C in commercial samples.
While the objective of this study, to simultaneously detect all five vitamins in a single development step, was achieved, it was impossible to also simultaneously quantify all five compounds in all cases. As could be seen in the analysis of some of the nutraceuticals, the quantification failed for some low-concentration vitamins when others were present at the same time in much higher quantities. In this case, when a sample solution of a higher concentration was prepared containing the lower-concentration vitamin at levels above its LOQ, vitamins present at high levels in the formulation presented as rather overloaded bands, which were not adequately separated, thus making an accurate quantitative analysis impossible. This was particularly the case for vitamins B2, B3, and C, which have similar RF values with the chosen mobile phase. Despite this limitation, which only applies to formulations where the levels of vitamins relative to each other differ greatly, the method nonetheless has value for quality control, as has been demonstrated with the successful analysis of most vitamins in the investigated complex nutraceutical formulations.
As is demonstrated by the above findings, the developed HPTLC method can identify and quantify the five water-soluble vitamins in nutraceutical formulations using only a single development step. The respective LOD and LOQ values for each vitamin are low compared to previous studies [12,15,17]. Mukesh at el. [12], for example, analyzed vitamins B2, B3, B6, and C in pharmaceutical preparations with a LOD/LOQ of 78.71/238.53 (Vitamin B2), 74.62/226.14 (Vitamin B3), 94.76/287.15 (Vitamin B6), and 73.09/221.48 ng/band (vitamin C), respectively, whereas in the current study, these values were 5.27/15.97 ng (Vitamin B2), 13.03/39.47 ng (Vitamin B3), 59.61/180.64 ng (Vitamin B6), 14.17/42.93 ng (Vitamin B12), and 119.27/361.42 ng (Vitamin C) per band. In another study, only three water-soluble vitamins, vitamins B1, B2, and B6, were analyzed in bulk, using tablet formulations with a lower LOD and LOQ compared to the current method (3.75/11.36 for vitamin B1, 3.74/11.35 for vitamin B2, and 3.78/11.44 ng/band for vitamin B12). However, that particular approach was not suitable for other water-soluble vitamins [19]. Using a luminescence spectrophotometer with much lower detection limits for the analysis of three water-soluble vitamins (B1, B2, and B3) in foods was established in another study, but no quantification was performed [17].
5. Conclusions
This study successfully developed and validated an HPTLC method that can, in a single development step, simultaneously detect and also quantify the five water-soluble vitamins B2, B3, B6, B12, and C with low limits of detection and quantification, as long as their levels relative to each other do not vary too greatly. As such, this method offers a valuable new approach to the quality control of vitamin-containing formulations such as complex nutraceuticals. An advantage over other approaches is the convenience of this method as it only uses a single mobile phase in a single development step to simultaneously analyze the five water-soluble vitamins with adequate precision, accuracy, and robustness, along with LOD and LOQ levels that are lower than those reported in other comparable studies. Moreover, the developed method is also efficient as it allows for the simultaneous analysis of a number of samples in a single run.
Author Contributions
Conceptualization, C.L., L.Y.L. and K.M.Y.K.S.; methodology, K.M.Y.K.S., M.K.I., T.S. and C.L.; validation, K.M.Y.K.S., M.K.I., T.S. and C.L.; formal analysis, K.M.Y.K.S.; writing—original draft preparation K.M.Y.K.S.; writing—review and editing, C.L., L.Y.L., T.S. and M.K.I.; supervision, C.L. and L.Y.L. All authors have read and agreed to the published version of the manuscript.
Funding
This research received no external funding.
Data Availability Statement
The original contributions presented in the study are included in the article, further inquiries can be directed to the corresponding author.
Acknowledgments
The research was carried out while the author was in receipt of an International Fee Scholarship and a University Postgraduate Award from the University of Western Australia.
Conflicts of Interest
The authors declare no conflicts of interest.
References
- Locatelli, M.; Melucci, D.; Carlucci, G.; Locatelli, C. Recent Hplc Strategies to Improve Sensitivity and Selectivity for the Analysis of Complex Matrices. Instrum. Sci. Technol. 2012, 40, 112–137. [Google Scholar] [CrossRef]
- Tekkeli, S.E.K.; Durmus, Z. Magnetic Solid Phase Extraction Applications Combined with Analytical Methods for Determination of Drugs in Different Matrices Review. J. Chil. Chem. Soc. 2019, 64, 4448–4458. [Google Scholar] [CrossRef]
- Huang, H.C. Analyses of Multivitamins in Nutraceuticals by Reverse Phase HPLC with DAD, ELSD and MS. Master’s Thesis, Clemson University, Clemson, SC, USA, 2013. [Google Scholar]
- Bryant, C.; Nelson, L.C. Quantitative determination of folic acid in multivitamin/multielement tablets using liquid chromatography/tandem mass spectrometry. J. Chromatogr. A 2006, 1135, 203–211. [Google Scholar]
- Zafra-Gomez, A.; Garballo, A.; Morales, J.C.; Garcia-Ayuso, L.E. Simultaneous determination of eight water-soluble vitamins in supplemented foods by liquid chromatography. J. Agric. Food Chem. 2006, 54, 4531–4536. [Google Scholar] [CrossRef] [PubMed]
- Godoy, H.T. Simultaneous determination of nicotinamide, nicotinic acid, riboflavin, thiamin, and pyridoxine in enriched Brazilian foods by HPLC. J. High Resolut. Chromatogr. 2005, 20, 245–248. [Google Scholar]
- Aqel, A.; Yusuf, K.; Al-Rifai, A.; Alothman, Z.A. Vitamin Analysis in Food by UPLC–MS. In Ultra Performance Liquid Chromatography Mass Spectrometry; CRC Press: Boca Raton, FL, USA, 2014; pp. 243–277. [Google Scholar]
- Mahesh Attimarad, M.A.K.K.; Bandar, E. Aldhubaib and Sree Harsha. High-performance thin layer chromatography: A powerful analytical technique in pharmaceutical drug discovery. Pharm. Methods 2011, 2, 71–75. [Google Scholar] [CrossRef]
- Alqarni, M.H.; Alam, P.; Shakeel, F.; Foudah, A.I.; Alshehri, S. Highly Sensitive and Ecologically Sustainable Reversed-Phase HPTLC Method for the Determination of Hydroquinone in Commercial Whitening Creams. Processes 2021, 9, 1631. [Google Scholar] [CrossRef]
- Islam, M.K.; Sostaric, T.; Lim, L.Y.; Hammer, K.; Locher, C. Development and validation of an HPTLC-DPPH assay and its application to the analysis of honey. JPC J. Planar Chromatogr. Mod. TLC 2020, 33, 301–311. [Google Scholar] [CrossRef]
- Lawag, I.L.; Islam, M.K.; Sostaric, T.; Lim, L.Y.; Hammer, K.; Locher, C. Antioxidant Activity and Phenolic Compound Identification and Quantification in Western Australian Honeys. Antioxidants 2023, 12, 189. [Google Scholar] [CrossRef]
- Kher, M.N.; Dholakia, S.P.; Shah, G.G.; Sureja, D.K.; Bhatt, V.D.; Sheth, D.B. High-Performance Thin Layer Chromatography Method for Simultaneous Estimation of Water- Soluble Vitamins: Analytical Method Development, Validation and Applications. Anal. Chem. Lett. 2022, 12, 576–585. [Google Scholar] [CrossRef]
- Tomohiro Bito, F.W. Miniaturized HPTLC of Vitamin B12 Compounds in Foods. Chromatographia 2013, 76, 1333–1337. [Google Scholar] [CrossRef]
- Kartsova, L.A.; Koroleva, O.A. Simultaneous determination of water-and fat-soluble vitamins by high-performance thin-layer chromatography using an aqueous micellar mobile phase. J. Anal. Chem. 2007, 62, 255–259. [Google Scholar] [CrossRef]
- Cimpoiu, C.; Casoni, D.; Hosu, A.; Miclaus, V.; Hodisan, T.; Damian, G. Separation and Identification of Eight Hydrophilic Vitamins Using a New TLC Method and Raman Spectroscopy. J. Liq. Chromatogr. Relat. Technol. 2005, 28, 2551–2559. [Google Scholar] [CrossRef]
- Ponder, E.L.; Fried, B.; Sherma, J. Thin-layer chromatographic analysis of hydrophilic vitamins in standards and from Helisoma trivolvis snails. Acta Chromatogr. 2004, 14, 70–81. [Google Scholar]
- Díaz, A.N.; Paniagua, A.G.; Sánchez, F.G. Thin-layer chromatography and fibre-optic fluorimetric quantitation of thiamine, riboflavin and niacin. J. Chromatogr. A 1993, 655, 39–43. [Google Scholar] [CrossRef]
- Cimpoiu, C.; Hosu, A. Thin layer chromatography for the analysis of vitamins and their derivatives. J. Liq. Chromatogr. Relat. Technol. 2007, 30, 701–728. [Google Scholar] [CrossRef]
- Velmurugan, D.; Munusamy, J.; Subramaniam, A.T.; Karunakaran, A.; Mkm, A.L.; Dhanapal, K. Formulation, method development and validation of water soluble vitamins B1, B2 & B6 in bulk and tablet dosage form by HPTLC method. J. Pharm. Chem. 2018, 5, 1–4. [Google Scholar] [CrossRef][Green Version]
- Riswanto, F.D.O.; Lukitaningsih, R.E.; Martono, S. Analytical method validation and determination of pyridoxine, nicotinamide, and caffeine in energy drinks using thin layer chromatography-densitometry. Indones. J. Chem. 2015, 15, 9–15. [Google Scholar] [CrossRef]
- ICH Harmonized Tripartite Guideline: Validation of Analytical Procedures: Text and Methodology Q2(R1). In Proceedings of the International Conference on Harmonization (ICH), Geneva, Switzerland, 10 November 2005.
- Alqarni, M.H.; Shakeel, F.; Foudah, A.I.; Aljarba, T.M.; Alam, A.; Alshehri, S.; Alam, P. Comparison of Validation Parameters for the Determination of Vitamin D3 in Commercial Pharmaceutical Products Using Traditional and Greener HPTLC Methods. Separations 2022, 9, 301. [Google Scholar] [CrossRef]


Disclaimer/Publisher’s Note: The statements, opinions and data contained in all publications are solely those of the individual author(s) and contributor(s) and not of MDPI and/or the editor(s). MDPI and/or the editor(s) disclaim responsibility for any injury to people or property resulting from any ideas, methods, instructions or products referred to in the content. |
© 2024 by the authors. Licensee MDPI, Basel, Switzerland. This article is an open access article distributed under the terms and conditions of the Creative Commons Attribution (CC BY) license (https://creativecommons.org/licenses/by/4.0/).