Abstract
To address the complex calibration parameters and low optimization efficiency of dual-fuel engines, this paper innovatively proposes an optimization calibration method based on a simulation model and the Non-Dominated Sorting Whale Optimization Algorithm (NSWOA). Taking the YC6K dual-fuel engine as the research object, a high-precision simulation model was constructed within the GT-Power environment, and its reliability was confirmed through the external characteristic curve (the maximum deviation of torque and specific fuel consumption rate is less than 5%). A total of 260 parameter samples were generated using a Sobol sequence space-filling experimental design, and a performance prediction model was established by combining the Crested Porcupine Optimization algorithm and the Back-Propagation Neural Network (CPO-BP). The experimental results show that the CPO-BP model exhibits excellent predictive capability, with the coefficient of determination (R2) of nitrogen oxides (NOx) and brake-specific fuel consumption rate (BSFC) reaching 0.98964 and 0.99501 respectively. Based on this, the NSWOA algorithm was introduced to optimize key parameters such as speed, torque, main injection timing, and rail pressure, with the optimization objectives being NOx emissions and BSFC. The optimization results show that under 100% load conditions, the reduction in BSFC ranges from 1.5% to 4.3%, and NOx emissions are reduced by 48.6% to 67.1%. The effectiveness of the optimized parameters was also verified through bench tests, providing an efficient solution for complex engineering optimization problems.
1. Introduction
Amid the worldwide transition in energy infrastructure and the implementation of progressively stringent environmental policies [1], natural gas–diesel dual-fuel engines have become a research focus in the internal combustion engine field due to their potential for improved fuel efficiency, reduced emissions, and the diversification of energy sources [2,3]. The natural gas–diesel dual-fuel engine uses diesel as the ignition source to ensure ignition reliability and natural gas as the main fuel to supply energy [4]. Thanks to its structural characteristic of a high hydrocarbon ratio, natural gas can achieve complete combustion and significantly reduce nitrogen oxide (NOx) emissions [5]. Meanwhile, the unit price of natural gas is lower than that of diesel, with a substitution ratio of over 80%, which significantly reduces fuel costs [6]. These studies have thoroughly analyzed the performance issues of dual-fuel engines from various perspectives. Engine calibration is a method to further improve engine performance [7]. The defects of traditional engine calibration technologies are mainly reflected in their reliance on manual experience with long cycles, incomplete coverage of operating conditions with limited adaptability, and high costs with significant resource consumption [8]. Although technology has advanced, dual-fuel engines still face significant challenges in balancing economic efficiency and emissions performance [9].
To improve the economic–emission balance of natural gas–diesel dual-fuel engines and address the complexity of calibration parameters, it is necessary to introduce optimization algorithms for the optimized calibration of these engines [10,11]. In recent years, methods for simplifying calibration parameters through experimental design or simulation modeling have increased significantly. Recent advances in swarm intelligence optimization have enabled the utilization of sophisticated algorithms for the calibration of operational parameters in natural gas–diesel dual-fuel engines. This approach facilitates enhanced optimization efficacy, leading to significant improvements in thermodynamic efficiency and emission characteristics. Hong et al. established an engine simulation model in AVL-BOOST software while constructing a corresponding response surface model utilizing Design-Expert. Subsequently, an integrated framework coupling the Response Surface Methodology with the Non-Dominated Sorting Genetic Algorithm II was proposed for the multi-objective optimization of engine parameters. The optimization results demonstrated a 3.4% increase in power output, a 0.3% reduction in Indicated Specific Fuel Consumption, and a 6.2% decrease in NOx emissions, which improves the economic benefits of ship navigation and lowers the engine optimization cost [12]. After conducting the design of experiments, Bhowmik et al. employed a Multi-Objective Particle Swarm Optimization (MOPSO) algorithm to obtain the Pareto front of optimal results. Subsequently, the Technique for Order Preference by Similarity to Ideal Solution, a multi-attribute decision-making methodology, was employed to this front to identify a final optimal configuration. This study clearly defined the influence law of the fuel ratio and operating conditions on the engine’s comprehensive performance and successfully established a multi-objective optimized fuel configuration scheme [13]. Yujin et al. utilized a Multiple Nonlinear Regression model coupled with MOPSO to optimize the emission parameters of a low-speed two-stroke marine dual-fuel engine to enhance its performance. The optimization yielded a 0.34% increase in engine power, a 0.21% reduction in brake-specific fuel consumption (BSFC), and a 39.56% decrease in NOx emissions under dual-fuel operation [14]. By coupling the WAVE 2025.1 one-dimensional simulation environment with a nonlinear optimization algorithm, Tadros et al. developed a calibration framework that reduces the dependency on voluminous experimental datasets while maintaining high predictive accuracy and achieving minimized NOx emissions for dual-fuel marine engines [15]. Mehnatkesh et al. investigated a hydrogen/diesel dual-fuel (HDDF) engine and implemented a Nonlinear Model Predictive Controller utilizing a Deep Neural Network (DNN) as the process model for the coordinated control of diesel and hydrogen injection. The structural configuration and hyperparameters of the DNN-based HDDF process model were optimized via a two-stage Bayesian optimization strategy. This approach was designed to achieve high model accuracy, minimize descriptive complexity, fulfill real-time computational constraints, and effectively reduce engine emissions [16].
The aforementioned methods provided this research with an optimized calibration process for dual-fuel engines that integrates experimental design, simulation modeling, and optimization algorithms. Although the introduction of optimization algorithms for engine calibration has been extensively studied, most existing research suffers from issues such as the excessive complexity of optimization algorithms and low optimization efficiency in the optimization process. Furthermore, traditional gradient-based optimization and Pareto sorting techniques are susceptible to issues such as premature convergence and diminished solution diversity. In reconciling the inherent conflict between efficiency and computational accuracy, this study employs a YC6K natural gas–diesel dual-fuel engine as the experimental platform, building upon the aforementioned methodologies. The principal achievements of this work are outlined as follows.
- A full-engine simulation model of the dual-fuel engine is established, and the model’s reliability is verified using external characteristic curves.
- Sobol sequence sampling is performed according to the parameter range of the experimental design, obtaining test points that meet the requirements.
- Single-factor experiments are carried out at various engine speeds to investigate the effects of each key operating parameter on NOx emissions and BSFC.
- An efficient and high-precision engine performance prediction model is constructed by combining the CPO algorithm and the BP neural network.
- The NSWOA is developed directly toward the simultaneous enhancement of emission performance and fuel economy in dual-fuel engines.
2. Methodology and Experimental Design
2.1. Experimental Platform
This study takes the YC6K dual-fuel diesel engine—developed specifically for heavy-duty applications by Guangxi Yuchai United Power Co., Ltd., Yulin, China—as the core research object, and the primary specifications of this engine are detailed in Table 1. This diesel engine adopts a standard governor to achieve synchronized control of gas injection, diesel injection, and throttle opening. In the specific experimental design, to eliminate the interference of non-core variables on experimental results, the throttle was fixed at the fully open position as a standard practice, thereby preventing any indirect modulation of the in-cylinder air–fuel ratio. Additionally, based on the internal combustion engine load, the natural gas injection quantity was controlled in a linear relationship, and the pilot fuel was controlled via an independent Manifold Absolute Pressure (MAP) diagram. The configuration of the experimental test bench is shown in Figure 1. In addition, the specifications and corresponding accuracies of the measuring instruments used in the test are summarized in Table 2. This test bench is a custom-built performance testing platform for dual-fuel engines. It integrates the YC6K diesel engine body, a natural gas supply subsystem (including natural gas cylinders, pressure-reducing and -stabilizing devices, electronic injection units, and flow sensors), a diesel supply subsystem (including fuel tanks, high-pressure fuel pipes, fuel injectors, and fuel quantity measuring units), a dynamometer (used to simulate road loads and measure engine output power in real time), a high-precision data acquisition system (using an emission analyzer for quantitative analysis of NOx emissions), and a cooling system. As a whole, it can realize real-time monitoring, data recording, and closed-loop control of an engine under full operating conditions. In this experimental investigation, engine load is represented by torque, NOx emissions served as the primary metric for quantifying emission characteristics, and BSFC was employed to assess fuel economy. The engine operating conditions measured in the experiment are shown in Table 3.

Table 1.
Main parameters of YC6K dual-fuel engine.
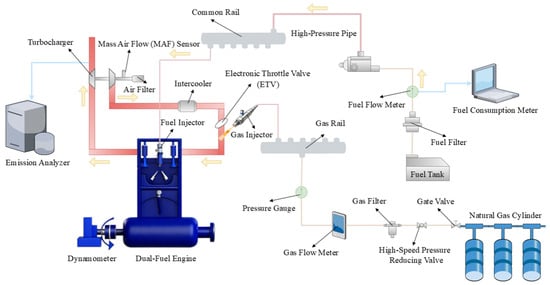
Figure 1.
The configuration of the experimental test bench.
Table 2.
Specifications of test instruments and their measurement accuracies.
Table 3.
Torque values of the engine at different speeds under 100% load condition.
2.2. GT-Power Model
The primary simulation tool, GT-Power (v2016) [17], was employed to construct a 1-D simulation model, covering key modules such as the intake and exhaust systems, the turbocharger, and the combustion process. This study used the Wiebe function to establish a semi-empirical model for the combustion process [18,19]. Given that the fuel delivery in dual-fuel engines comprises both pilot diesel and natural gas—where the pilot diesel constitutes approximately 5% of the total fuel mass—separate combustion models were established for the pilot and main combustion phases [20,21]. This approach accounts for the premixed combustion of natural gas and the ignition process initiated by the diesel pilot. High-precision combustion models were established by calibrating the combustion parameters using bench test data. In this study, both the real fuels used in the bench tests and their surrogate models in the GT-Power simulation are clearly defined based on standard specifications and compositional analysis.
The natural gas used in this study was primarily composed of methane (88% by volume), ethane (6%), and propane (6%), which is representative of pipeline natural gas in China and complies with the national standard GB 17820-2018 [22]. The methane number (MN) is a critical parameter for characterizing the knock resistance of gaseous fuels; a high value indicates a low propensity for abnormal combustion, which is essential for stable dual-fuel engine operation. Therefore, the key combustion parameter of natural gas is defined as the MN, and the calculated MN of the tested natural gas is 98.2. For diesel fuel, an average molecular formula of C13.5H23.6 was adopted, corresponding to a typical diesel fuel with a cetane number (CN) in the range of 50–55. The CN is a key indicator of the fuel’s auto-ignition quality and directly influences the ignition delay and subsequent combustion phasing. This range conforms to the China VI diesel fuel standard (GB 19147-2016 [23]). In the GT-Power simulation environment, the combustion process was modeled using surrogate fuels that replicate the ignition and combustion characteristics of the real fuels. For natural gas, the thermodynamic properties of methane, ethane, and propane were sourced from the NIST database, and the mixing process with air was governed by the built-in turbulence model. For diesel, a multi-component surrogate was employed to capture its evaporation and ignition behavior. The physical properties required for spray and evaporation modeling—such as liquid density, surface tension, vapor pressure, and distillation curve—were derived from standard fuel databases and adjusted to match a typical No. 2 diesel fuel. These settings ensured that the simulated evaporation and mixing processes were physically representative and aligned with real-world fuel behavior.
The mathematical expression of this semi-empirical combustion model is as follows:
The start of combustion (SOC) is as follows:
The Wiebe constant (WC) is as follows 19:
In these equations, CE stands for the combustion fraction, and when CE = 1, the fuel is completely burned; AA stands for the combustion midpoint angle, which corresponds precisely to the crank angle at the point when 50% of the fuel’s chemical energy is released during the combustion process; D stands for the combustion duration angle, which quantifies the total angular displacement of the crankshaft between the initiation and termination points of combustion; E stands for the Wiebe exponent; BM stands for the combustion midpoint, where it is assumed that 50% of the fuel’s chemical energy has been released during the combustion process at this point, and it is taken as BM = 0.5; BMC stands for the combustion midpoint constant, BMC = −Ln(1 − BM); BS stands for the fuel combustion start point, where it is assumed that 10% of the fuel has been burned at this point, and it is taken as BS = 0.1; BSC stands for the fuel combustion start-point constant, BSC = −Ln(1 − BS); BE stands for the fuel combustion end point, where, generally, 90% of the fuel’s chemical energy has been released through combustion at this point, and it is taken as BE = 0.9; and BEC stands for the fuel combustion end-point constant, BEC = −Ln(1 − BE).
Two Wiebe curves were used to establish the combustion model for diesel fuel and natural gas, as shown in Table 4. The combustion parameters required for this model include the combustion midpoint, the combustion duration, the Wiebe curve ratio and the Wiebe exponent. Since these chemical reactions occur simultaneously in the same physical space, the model must take into account the interaction between natural gas and diesel fuel. For example, take the coupling of ignition delay: The ignition delay of the natural gas main charge is directly influenced by the diesel pilot combustion. In the model, the start of combustion for natural gas is not prescribed independently but is triggered by the energy release from the diesel pilot. Specifically, the natural gas combustion begins when the cumulative heat release from the diesel pilot reaches 10% of its total energy. This physically represents the ignition of the surrounding natural gas–air mixture by the pilot flame.
Table 4.
Combustion parameters of YC6K dual-fuel engine in 100% working condition.
After modeling each component of the dual-fuel engine based on modeling theory, each simulation module was connected in an orderly manner in accordance with the gas flow direction during the working process. The overall model of the dual-fuel engine was thus established, as shown in Figure 2. In this engine, the intake air is compressed by the compressor into the intercooler for cooling and then delivered to the six cylinders through the intake ducts. Meanwhile, diesel and natural gas are injected into the intake manifold through gas injection valves, where they mix with the intake air before entering the cylinders. The mixture in the cylinders is ignited by pilot diesel, which drives the pistons to perform work and output torque. The exhaust gas generated by combustion is discharged into the atmosphere through the exhaust pipeline and turbine.
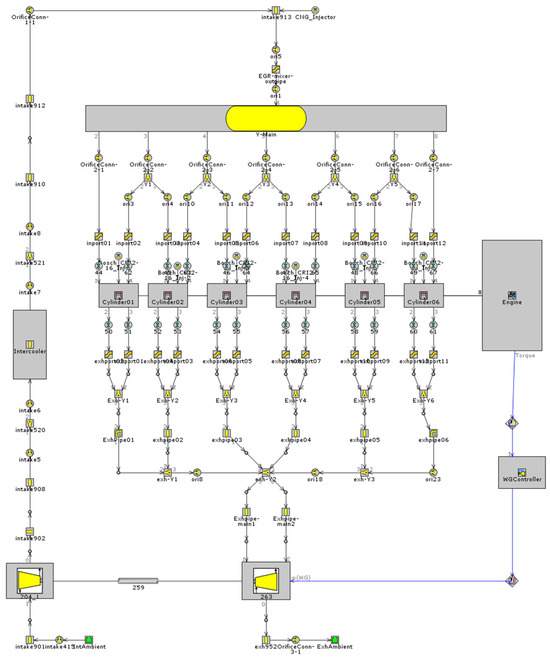
Figure 2.
YC6K dual-fuel engine model diagram.
2.3. Experimental Design
The parameters to be optimized in this test include two operating condition benchmark parameters (engine speed and torque) and five combustion process control parameters (pilot injection fuel quantity (PIFQ), main injection timing (MIT), pilot injection timing (PIT), rail pressure (RP), and air–fuel ratio (AFR)). The specific ranges of these parameters are shown in Table 5.
Table 5.
Parameters and boundary ranges.
The determination of the value ranges for each key operating parameter in this study was based on the feasible intervals of each parameter preliminarily screened out via preliminary bench pre-tests. On this basis, the initial intervals were then moderately expanded by combining the combustion characteristics of the dual-fuel engine with the parameter selection experience from existing studies.
The Sobol sequence is a class of low-discrepancy sequences [24]. Its generation mechanism is relatively sophisticated, and it is mainly constructed based on binary Gray code and direction numbers. The experimental design scheme based on the Sobol sequence is shown in Figure 3c. It can be seen from the figure that the generated sample points present an extremely uniform distribution. Since Latin Hypercube Sampling adopts random sampling when extracting sample points in the subspace, the sample points obtained by this method have no repeatability. In contrast, the sample points generated by the Halton sequence and Sobol sequence exhibit a more uniform distribution in the multidimensional space, which can effectively reduce the sampling error. Furthermore, the Sobol sequence has better uniformity and a lower discrepancy, as well as superior performance, especially in high-dimensional spaces; it is suitable for the simulation and optimization of high-dimensional problems and complex systems. In summary, the space-filling experimental design method based on the Sobol sequence was selected in this study. Its low-discrepancy mathematical properties can effectively ensure the uniform distribution of sampling points in the multidimensional space, and it has the universality advantage of requiring no preset model, which lays a solid foundation for the subsequent construction of a high-precision engine prediction model.
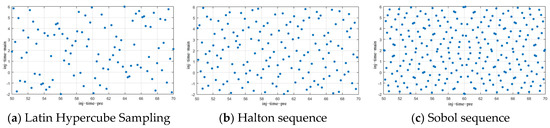
Figure 3.
Results of multiple space-filling test designs.
Sobol sequence sampling was performed based on the input parameters and their ranges in Table 5. To avoid outliers, a total of 260 sample points were selected, which is consistent with the range of the final multi-objective optimization. The distribution of these test points is shown in Figure 4. The four-dimensional parameter combination distribution diagram (Figure 4c) takes speed, RP, MIT, and PIT as examples. Unreasonable test points were removed according to the test results of the sample points to meet the design requirements, and the relevant simulation experiments were conducted in the GT-Power software.
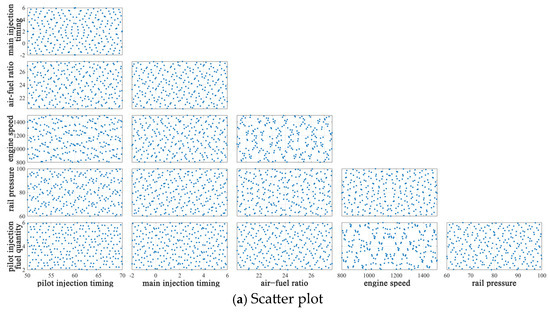
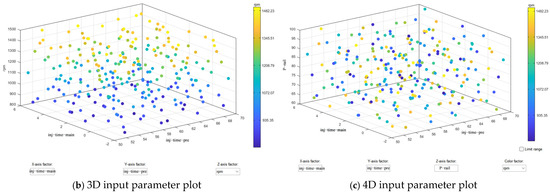
Figure 4.
Scatter plot of Sobol sequence space-filling experimental design.
After simulating the test points divided by the experimental design in the GT-Power simulation model, the obtained data were used for the establishment of the prediction model.
2.4. CPO-BP
The crested porcupine has sharp quills covering its dorsal region, which form a crucial defense system [25]. When an individual perceives an external threat, it adjusts the spatial arrangement and angle distribution of its spines to achieve an optimal defensive posture. This behavior can be abstracted as a search process in optimization problems, wherein parameters are iteratively adjusted to converge on a globally optimal configuration: the objective function is to maximize defense effectiveness (e.g., reducing the probability of successful contact by predators, increasing the damage caused by counterattacks), the decision variables including parameters such as spine angle, spacing, direction, and density, while satisfying constraints such as body structure and movement flexibility. Due to the uncertainty in the position and behavior of predators, the crested porcupine’s defense strategy manifests as a real-time search process based on environmental feedback, gradually approaching the optimal solution through local adjustments, which is similar to the application of heuristic optimization algorithms in dynamic environments. The basic steps of the CPO algorithm are shown in Figure 5. The key feature of the CPO algorithm lies in gradually approaching the global optimal solution through swarm intelligence and local adjustments, thereby enhancing the model’s predictive accuracy and generalization capability. In this study, we selected the input parameters (and their value ranges), shown in Table 5, as the input variables of the machine learning model. In addition, NOx emissions and BSFC were designated as output variables, representing the main objectives of optimization.
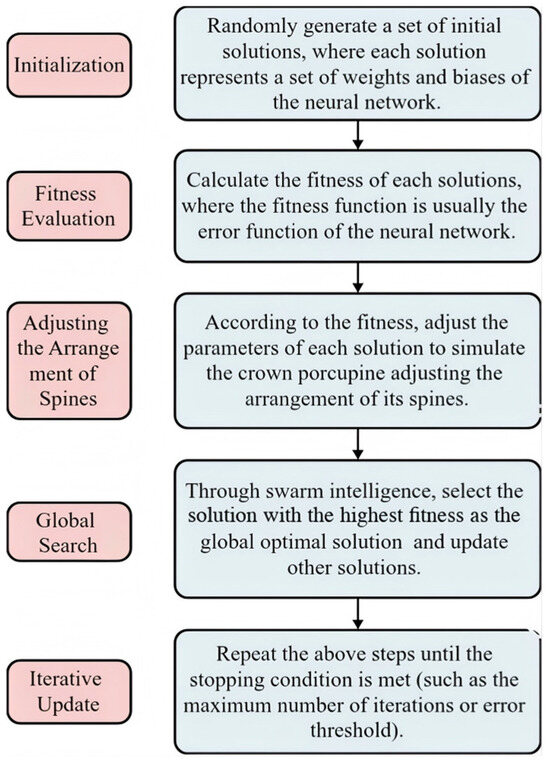
Figure 5.
Basic steps of the CPO algorithm.
The CPO-BP neural network has the same structure as the traditional BP Neural Network, adopting a standard three-layer configuration which consists of input, output and hidden layers [26,27]. The number of neurons in the hidden layer is determined as 12 by trial and error, and the activation function is the purelin function. The training parameters are set as follows: maximum iterations = 1000, error threshold = 1 × 10⁻⁴, learning rate = 0.01. Under these settings, the model performs optimally, and its performance does not change drastically within a certain range, indicating that the algorithm has good robustness. The structure of the BP neural network prediction model is illustrated in Figure 6. In the CPO-BP neural network, the initial weights and biases are randomly generated by the CPO algorithm. Each particle corresponds to a collection of distinct vectors of weights and biases, with its initial position randomly distributed in the search space. The output value of the network is calculated through forward propagation, and then the value of the error function is computed, which serves as the fitness of each particle. The position of each particle is adjusted based on the fitness, simulating the crested porcupine adjusting the arrangement of its spines. The adjustment formulas are defined as follows:
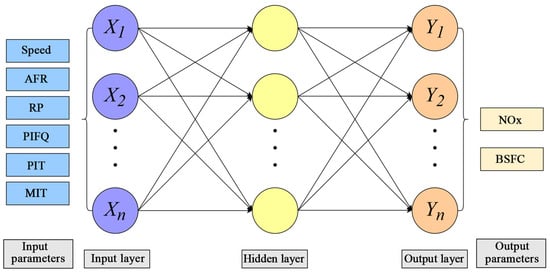
Figure 6.
Structure of BP neural network prediction model.
In this equation: xi(t) denotes the particle position at the t-th iteration, and vi(t) its velocity; Pbest,i denotes the historically optimal position for an individual particle, and the overall best position found by the swarm is gbest; c1 and c2 are acceleration coefficients; and r1 and r2 are independent stochastic quantities.
Through swarm intelligence, the solution exhibiting the highest fitness value is identified as the global optimum. Subsequent iterations then update the remaining solutions within the population. The update rule for the global optimal solution is defined by the following equation:
where fitness(xi(t + 1)) refers to the particle fitness value at iteration t + 1.
2.5. NSWOA
NSWOA is an innovative hybrid optimization framework that skillfully integrates the Whale Optimization Algorithm (WOA) with the multi-objective non-dominated sorting strategy [28,29]. The innovation lies not merely in combining existing methods, but in integrating an adaptive mechanism into the spiral foraging behavior of WOA, allowing the algorithm to automatically balance exploration and exploitation based on the real-time distribution of solutions. This dynamic balancing strategy is more intelligent than traditional WOA with fixed parameters or NSGA-II, which relies solely on crowding distance to maintain diversity. It enables NSWOA to achieve better convergence and a more uniformly distributed Pareto front. The core idea of this algorithm is to simulate the predation behavior of humpback whale groups in nature. The simulation results demonstrate that the algorithm successfully addresses the critical trade-off, harmonizing global search capability with precise, local grained search, and it is particularly suitable for multi-objective engineering optimization problems with high dimensionality, nonlinearity, and complex constraints. (The optimization process is shown in Figure 7).
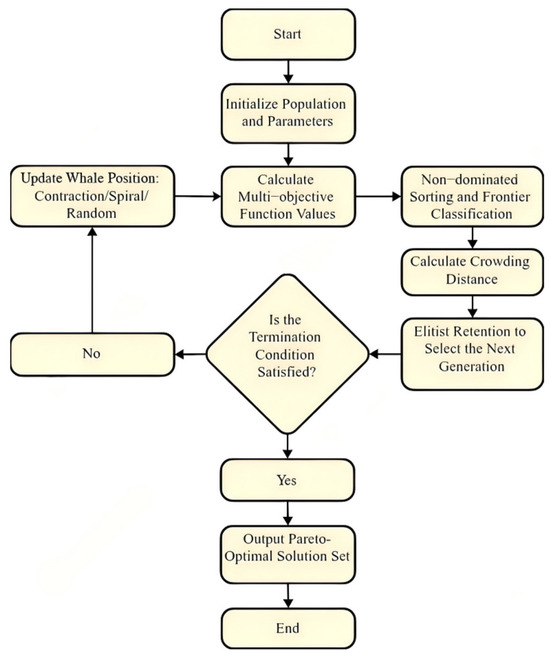
Figure 7.
NSWOA algorithm optimization flowchart.
In NSWOA, each solution is regarded as a whale individual, while the entire solution space is viewed as the whales’ ocean. At the start of the algorithm, a group of whales (i.e., a set of candidate solutions) are randomly distributed in the ocean. These whales explore the solution space by simulating the predatory patterns of humpback whales, namely, the spiral bubble-net feeding maneuver. During this process, the whales adjust their positions based on the positions of other whales and their own experience, thereby finding potential food sources—i.e., the optimal solutions to the problem. To further enhance the algorithm’s performance, NSWOA incorporates the multi-objective non-dominated sorting strategy. This strategy is based on the screening mechanism of the Pareto-optimal solution set and can identify and retain solutions that perform well across multiple objectives. For multi-objective optimization problems, NSWOA introduces the following key improvements based on WOA:
- (1)
- Non-dominated Sorting and Elite Preservation:
By adopting Fast Non-Dominated Sorting, the population is divided into multiple Pareto frontier ranks (Frontier), with lower-ranked individuals prioritized for retention. Combined with the elite strategy, non-dominated solutions are screened after merging the parent and offspring populations, ensuring the integrity and convergence of the Pareto frontier.
Crowding degree calculation:
In the equation, CDi is the crowding degree assigned to the i-th individual; M denotes the number of objective functions; fm(xi+1) and fm(xi−1) represent the function values of the two individuals adjacent to individual i on the m-th objective function; and fmmax and fmmin define the extreme values, the minimum value and maximum values respectively, attained by the m-th objective function across all candidate solutions in the present frontier layer.
- (2)
- Dynamic Parameter Adaptive Mechanism:
Nonlinear attenuation coefficient, a(t):
In this equation: t denotes the present iteration index, Tmax denotes the preset upper limit for iterations, and λ denotes the attenuation rate parameter. The linear attenuation of the original WOA algorithm tends to cause insufficient search momentum in the later stage; in the NSWOA algorithm, it is modified to an exponential attenuation form. By adjusting λ to control the attenuation rate, the local fine-tuning capability in the later stage of iteration is enhanced.
Adaptive spiral factor, b(t):
In this equation, N represents the population size and CDmax denotes the maximum crowding distance among individuals in the populations.
Adaptive spiral shape: when the solution set is sparsely distributed (the spiral factor can dynamically adjust the spiral degree based on the entropy of the population distribution), b(t) is increased to expand the search range; conversely, it is shrunk.
- (3)
- Constraint Handling:
The Feasibility Preferred Rule is adopted to handle complex constraints. When both solutions are feasible, the individual with a higher non-dominated rank and greater crowding degree is selected; when only one solution is feasible, the feasible solution is retained; when both solutions are infeasible, the solution with a smaller constraint violation degree (CVD) is selected based on the following calculation:
where CVDi is the constraint violation degree of the i-th individual; gj(xi) and hk(xi) denote the values of the j-th inequality constraint and the k-th equality constraint, respectively, for the i-th individual; and J and K denote the total numbers of inequality and equality constraints.
Additionally, this study integrates previous research findings and the characteristics of experimental data to configure the parameters of the NSWOA optimization algorithm [30]. For the NSWOA algorithm, the population size was configured as 100, the number of iterations was limited to a maximum of 300, and the external archive capacity was established at 150 to optimize global exploration and computational efficiency. In multi-objective optimization problems, due to the strong coupling effect among multiple optimized parameters, weight assignment for the parameters is required. Since emission regulations mainly restrict NOx emissions, NOx is designated as the primary optimization objective with a weight of 0.6, while the weight of BSFC is set to 0.4. Furthermore, the corresponding mathematical model for multi-objective optimization is constructed as follows:
- (1)
- Definition of Decision Variables:
Let the decision variable vector be
where nrpm is the engine speed, mpre represents the PIFQ, θmain is the MIT, θpre is the PIT, and Prail is the RP.
- (2)
- Objective Functions:
The optimization objectives are to minimize NOx emissions and BSFC, and the objective function expression is as follows:
where f1(x) and f2(x) are calculated based on the CPO-BP neural network prediction model established in the previous section.
- (3)
- Constraint Conditions:
Following the parametric bounds provided in Table 5, the constraint conditions are defined as
Meanwhile, they should satisfy the implicit constraints of emission regulations:
where TNOx is the standard value specified by emission regulations (referring to China National Phase VI Emission Standard for Heavy-Duty Diesel Engines (China VI)) and 0.9 is the safety factor (a safety margin between 0.8 and 0.95 is common in the industry; we selected 0.9 as a moderate value).
3. Results and Discussion
3.1. GT-Power Model Validation
The external characteristics of a dual-fuel engine refer to the performance characteristics of torque and BSFC varying with rotational speed when the engine is at full throttle, reflecting its output power performance and fuel economy, and therefore allowing evaluation of the overall performance of the engine. As shown in Figure 8 and Figure 9, in this study, tests were carried out at eight speed operating points selected in the speed range of 800 r/min to 1500 r/min, with a step size of 100 r/min; then, the simulated and experimental values of torque and BSFC were compared, with most errors being less than or equal to 4%. Furthermore, the in-cylinder pressure curves calculated by the simulation model and those measured experimentally are shown in Figure 10.
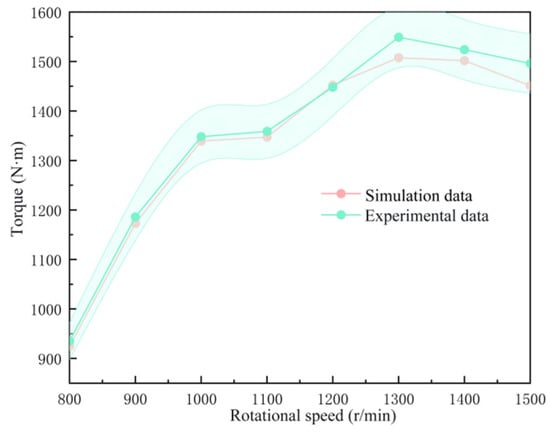
Figure 8.
Torque curve comparison.
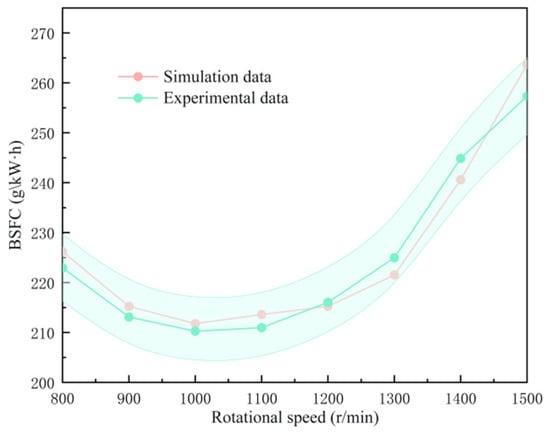
Figure 9.
BSFC curve comparison.
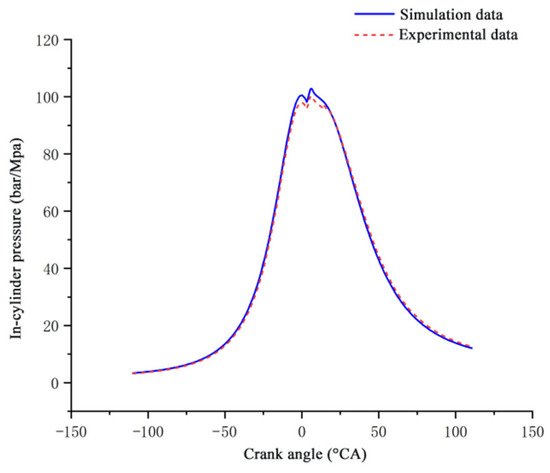
Figure 10.
In-cylinder pressure curve comparison.
As shown in the figures, the external characteristic curves of the dual-fuel engine model obtained via GT-Power simulation are generally consistent with the bench test results. The maximum deviation of torque characteristics is 2.9% at 1500 r/min; the maximum deviation of BSFC is 3.4% at 1500 r/min; and the simulated in-cylinder pressure curves show excellent phase consistency with the experimentally measured data, with a maximum error as low as 3%. All the maximum errors presented above do not exceed 5%, which is deemed acceptable for predicting engine performance trends and conducting subsequent optimization studies. Based on the above validation, the dual-fuel engine simulation model constructed by GT-Power can meet the calculation requirements under subsequent complex operating conditions.
3.2. Single-Factor Numerical Results and Analysis
According to the key parameters and their value ranges given in Table 5, in the variable control of speed operating conditions, the engine speed was increased step by step from 800 r/min to 1500 r/min, with a gradient step size of 100 r/min, so as to systematically investigate the combustion and performance response laws of the dual-fuel engine under different speed intervals. All data points presented in the figures and tables were acquired under steady-state operating conditions, and all the steady-state experiments conducted ultimately achieved convergence. Through single-factor experiments, the effects of various combustion process control parameters on NOx emissions and BSFC were analyzed.
As shown in Figure 11a, the NOx emissions increase significantly with the rise in PIFQ and show an overall increasing trend with the increase in engine speed, but the rising rate is affected by the PIFQ: compared with the low PIFQ (2 mg/cyc), at the high PIFQ (6 mg/cyc), the combustion is already in a high-temperature state, and an increase in engine speed will further push up NOx emissions, resulting in a steeper increase rate. As shown in Figure 11b, BSFC shows an overall trend of decreasing first and then increasing, with an optimal PIFQ (4 mg/cyc) and engine speed (1200 r/min) for fuel economy.
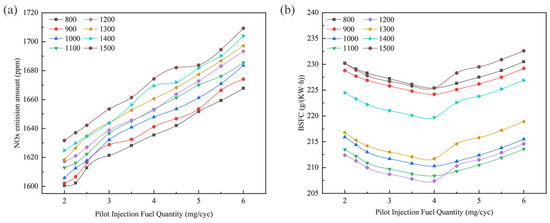
Figure 11.
Effect of PIFQ on the NOx emission amount (a) and BSFC (b).
As shown in Figure 12a, the NOx emissions increase significantly with the advance of MIT, with a more pronounced increase rate especially when the timing is greater than 0 °CA BTDC; they show a trend of a slight increase followed by a slight decrease with the rise in engine speed, and the overall variation range is relatively small. As shown in Figure 12b, BSFC shows a trend of decreasing first and then increasing with the advance of MIT, and the minimum value occurs at an engine speed of 1200 r/min with an MIT of 3 °CA BTDC.
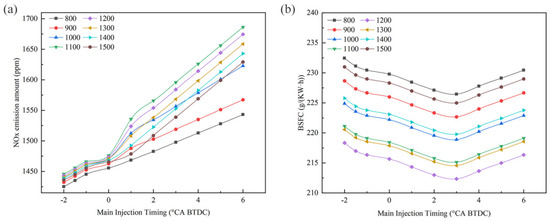
Figure 12.
Effect of MIT on the NOx emission amount (a) and BSFC (b).
As shown in Figure 13a, the NOx emissions first increase with the advance of PIT, then gradually decrease after reaching the peak value; they also exhibit the same trend with the increase in engine speed. As shown in Figure 13b, the optimal point of BSFC occurs at a moderate PIT (61 °CA BTDC) combined with an engine speed of 1100 r/min.
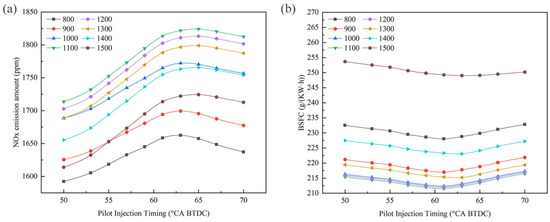
Figure 13.
Effect of PIT on the NOx emission amount (a) and BSFC (b).
As shown in Figure 14a, the NOx emission amount shows an overall increasing trend with the rise in RP, but the rising rate gradually slows down (nonlinear); they exhibit a tendency of first increasing and then slightly decreasing with the increase in engine speed. As shown in Figure 14b, BSFC first decreases and then tends to level off or slightly increase with the rise in RP, with insignificant overall variation; the optimal economic engine speed is 1100 r/min.
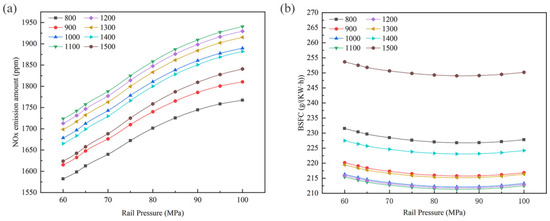
Figure 14.
Effect of RP on the NOx emission amount (a) and BSFC (b).
As shown in Figure 15a, NOx emissions decrease monotonically with the increase in the AFR, and they generally show a trend of slowly decreasing or remaining basically unchanged with the rise in engine speed. As shown in Figure 15b, BSFC shows a trend of decreasing first and then increasing with the increase in the air–fuel ratio. When the air–fuel ratio is excessively high, the excessively slow combustion speed, retarded combustion center of gravity and increased cycle-to-cycle variation result in a deterioration in thermal efficiency and a rebound in BSFC. Meanwhile, increased friction loss and decreased volumetric efficiency at high engine speeds also lead to an increase in BSFC.
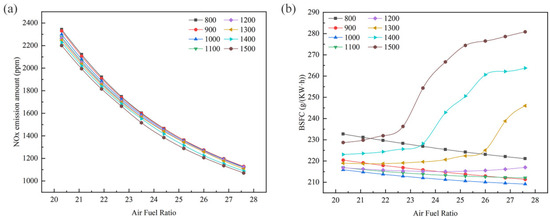
Figure 15.
Effect of AFR on the NOx emission amount (a) and BSFC (b).
3.3. Performance Assessment of the CPO-BP Model
To obtain the optimization effect of the generalization performance of the BP neural network after optimization by the CPO algorithm, an intuitive demonstration can be made by selecting some identical parameters in the dataset as samples and comparing the test set’s relative errors before and after optimization. As shown in Figure 16 and Figure 17, in the same samples, the test set’s relative errors for the two output parameters (NOx and BSFC) of the BP neural network optimized by the CPO algorithm are better than the prediction results of the BP neural network before optimization. This indicates that the generalization performance of the optimized CPO-BP neural network has been improved.
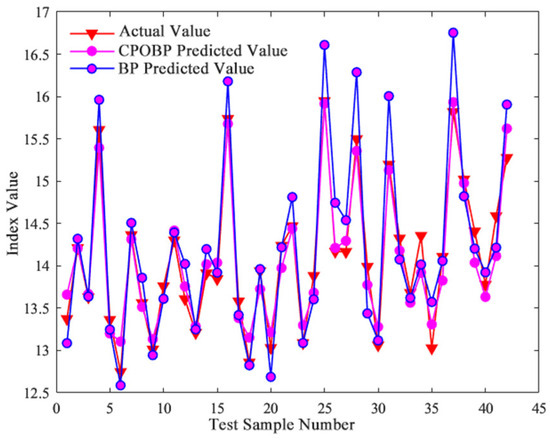
Figure 16.
Comparison of NOx prediction results.
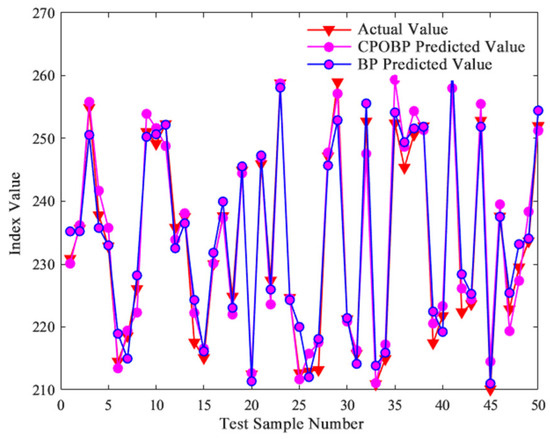
Figure 17.
Comparison of BSFC prediction results.
Furthermore, Table 6 presents the differences in the mean absolute error (MAE) and root mean square error (RMSE) of the test set for the BP neural network before and after optimization by the CPO algorithm.
Table 6.
Comparison of prediction accuracy of BP neural network before and after optimization.
As detailed in Table 6, the CPO-BP neural network outperforms the unoptimized BP neural network in both RMSE and MAE metrics, indicating that the CPO-BP neural network has a higher prediction accuracy for engine performance indicators. Furthermore, we performed 5-fold cross-validation on the 260 samples. Additionally, we utilized the coefficient of determination (R2) as a primary metric to assess the model’s goodness of fit. The results show that the CPO-BP neural network achieved an R2 value of 0.98964 for the NOx variable and 0.99501 for the BSFC variable, as shown in the Figure 18. These results indicate that the model has good stability and generalization capability, with no evidence of overfitting.
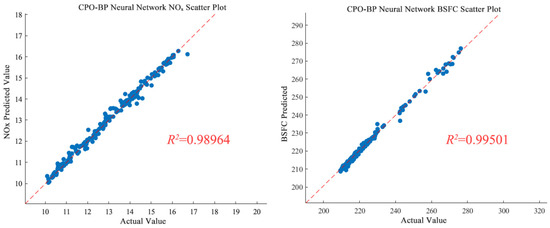
Figure 18.
Coefficient of determination values of CPO-BP neural network.
3.4. Multi-Objective Optimization Results Based on NSWOA
3.4.1. Calculation Results of Multi-Objective Optimization
Based on the initially set parameters, the NSWOA optimization algorithm was run. The obtained non-dominated sorting graph is illustrated in Figure 19, and the Pareto frontier solution set is presented in Figure 20. These findings suggest that the algorithm converges upon reaching 200 iterations, yielding a total of 56 non-dominated solutions on the obtained Pareto front. Consequently, the external archive capacity was configured as 100, with a termination criterion of 200 iterations, which can not only meet the optimization requirements but also save the computational costs.
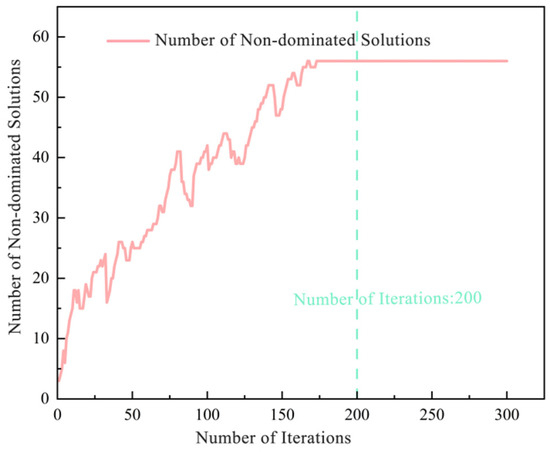
Figure 19.
Non-dominated sorting.
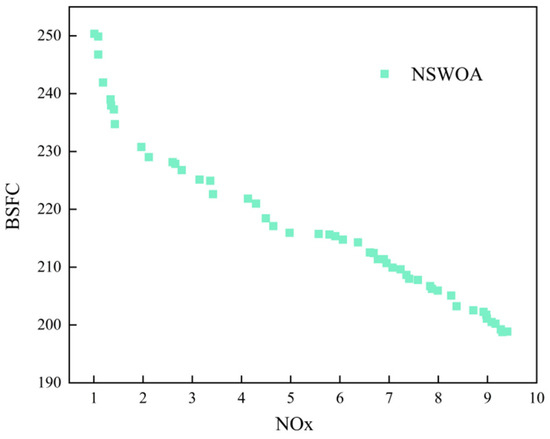
Figure 20.
Pareto frontier solution set.
Using the NSWOA algorithm to search for optimal solutions that meet the optimization conditions within the global scope, the optimization results under partial operating conditions are shown in Table 7.
Table 7.
Optimization results at selected operating points.
Under the 100% load propulsion condition, the comparison between the BSFC and NOx values optimized by the NSWOA algorithm and those before optimization is illustrated in Figure 21. The figure demonstrates that, within the range covering 75% of the speed interval (1000~1500 rpm), the optimized BSFC is significantly reduced, with a reduction range of 1.5% to 4.3% and an average reduction of 2.8% across the entire range. The optimization of NOx emissions is effective across the entire speed interval, with a reduction range of 48.6% to 67.1%, which meets the multi-objective optimization requirements for fuel consumption and emissions.
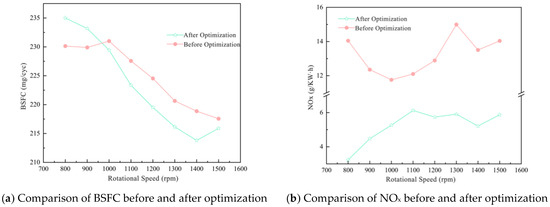
Figure 21.
Comparison of output parameters before and after optimization at 100% load.
3.4.2. Control Parameter MAP Structure of Dual-Fuel Engine
To achieve flexible control of the ECU and prevent the phenomenon of unstable engine status caused by sudden increases or decreases in electronic control parameters between discrete points, an interpolation operation is adopted between discrete points. In MATLAB R2023a, grid coordinates are generated via “meshgrid”, and “scatteredInterpolant” is used for interpolation to convert discrete data into regular grid data, meeting the requirement of drawing control parameter MAP diagrams with a high information density. The control parameter MAP structure of the dual-fuel engine optimized by the NSWOA algorithm is shown in Figure 22.
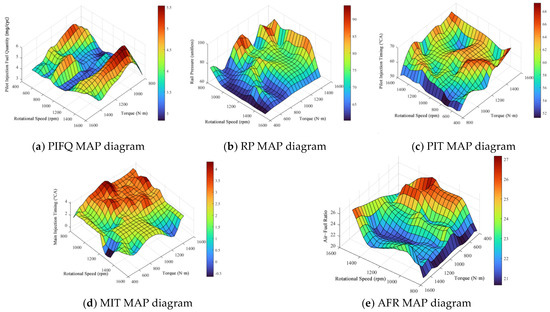
Figure 22.
NSWOA algorithm-optimized MAP structure for dual-fuel engine control parameters.
3.4.3. Validation of Control MAP Interpolation
To assess the reliability of the interpolated control MAPs shown in Figure 22, we performed a Leave-One-Out Cross-Validation (LOOCV) analysis. For each of the 260 simulation points, we temporarily removed it from the dataset, re-interpolated the MAP using the remaining 259 points, and compared the interpolated value at the removed point’s coordinates with its actual simulated value.
The results in Table 8 show excellent interpolation accuracy for all parameters, with R2 values above 0.98. The maximum errors occur at the boundaries of the operating range, which is expected. The interpolation method used (MATLAB’s scatteredInterpolant with natural neighbor interpolation) was chosen because it provides a smooth, C1-continuous surface that respects local data density without overshooting.
Table 8.
LOOCV interpolation error statistics.
To further validate the MAPs for hardware implementation, we selected 10 additional validation points not used in the original experimental design (5 within the convex hull of the data, 5 near the boundaries). The interpolated values at these points were compared with new GT-Power simulations: within convex hull: average error < 2% for all parameters; near boundaries: average error < 5% for all parameters.
These results confirm that the interpolated MAPs provide sufficiently accurate control parameter values for ECU implementation across the entire operating range.
3.5. Hardware Calibration and Verification
Using the calibration parameter storage file (.dcm) toolbox, import the A2L file for guiding the engine’s basic parameters and the control parameter MAP diagrams obtained in the previous section, and generate files in ECU-compatible formats (HEX/.s19). Via the programming tool, program the files into the dual-fuel engine controller. Figure 23 and Figure 24 demonstrate the programming site and the controller.

Figure 23.
Dual-fuel engine controller burn-in process.
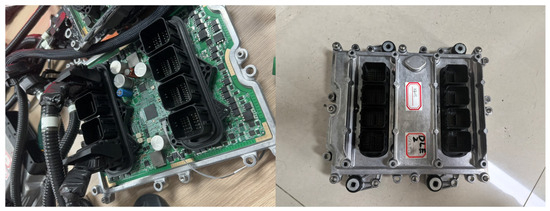
Figure 24.
Schematic of the inside and outside of a dual-fuel engine controller.
Experiments were conducted on the test bench using the control parameters before optimization and those optimized by the NSWOA algorithm. To visually demonstrate the effect comparison before and after optimization, the test bench experimental data were subjected to interpolation processing in MATLAB, and MAP diagrams of BSFC and NOx (both before and after optimization) were generated. The outcomes are presented in Figure 25 and Figure 26.
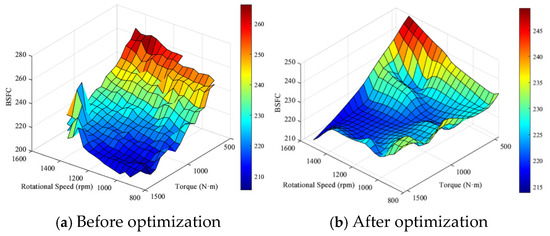
Figure 25.
MAP diagram before and after BSFC optimization.
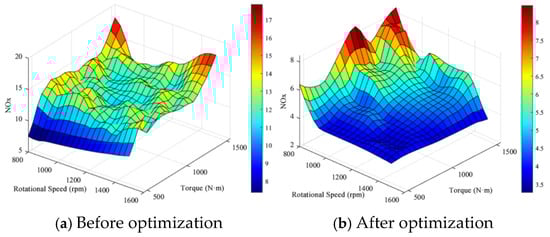
Figure 26.
MAP plot before and after NOx optimization.
4. Conclusions
This study focuses on the multi-objective optimization trade-off between emission performance and economic efficiency in natural gas–diesel dual-fuel engines. A detailed simulation model was established within the GT-Power environment, and its parameters were calibrated by benchmarking against experimental datasets. The Sobol sequence space-filling experimental design was adopted to obtain 260 sets of parameter samples, and a high-precision CPO-BP prediction model was constructed by combining the CPO algorithm and the BP Neural Network. On this basis, we proposed the NSWOA for holistic optimization of engine performance. The core research results are outlined as follows:
- (1)
- A GT-Power simulation model for the dual-fuel engine was established and experimentally verified. Its reliability was confirmed using experimental data under external characteristic and propulsion characteristic operating conditions. For both torque and fuel consumption, the simulation error relative to the experimental data remains below 5%, as evidenced by the results.
- (2)
- A total of 260 sets of parameter samples were generated based on the Sobol sequence space-filling experimental design. Through 3D and 4D visualization verification, it was confirmed that the test points are uniformly distributed in the input parameter space, providing high-information-density sample support for data modeling.
- (3)
- After careful adjustment of the parameters, the CPO-BP model exhibits a unique generalization ability and outstanding prediction accuracy. Before optimization with the CPO algorithm, the MAE values of NOx and BSFC were 0.11853 and 1.9415, respectively, and the RMSE values were 0.17115 and 2.4711, respectively. After optimization with the CPO algorithm, the MAE values of NOx and BSFC were 0.11444 and 1.5256, respectively, and the RMSE values were 0.14902 and 2.0718, respectively. These data fully demonstrate that the model has a better generalization ability. The R2 values for NOx and BSFC reached 0.98964 and 0.99501, respectively, which fully proves the model’s ability for fast and accurate prediction. These results not only verify that the CPO-BP model is capable of handling complex multi-objective optimization tasks in research on natural gas–diesel dual-fuel engines but also highlight its application value in the fields of energy system evaluation and digital simulation.
- (4)
- The NSWOA algorithm was developed for multi-objective optimization of key parameters such as speed, torque, and MIT to reduce NOx emissions and BSFC. The optimization results show that under 100% load conditions, the BSFC is reduced by 1.5% to 4.3%, and NOx emissions exhibit a notable decline, with reduction rates between 48.6% and 67.1%. The effectiveness of the optimization results is proven through test bench hardware calibration and verification.
In summary, this research not only constructed a robust, efficient, and high-precision GT-Power simulation model but proposed novel algorithmic approaches for simultaneous emission performance and economy efficiency optimization as well. These outcomes pave the way for future investigations to integrate a wider array of variables and metrics, thereby enhancing the predictive and optimization framework for dual-fuel engine design.
Author Contributions
Conceptualization, H.H.; software, H.H., Z.H., Z.L., J.Y. and W.W.; formal analysis, H.H., W.W., Z.L., J.Y. and Z.H.; investigation, H.H., Z.H., Z.L., W.W., J.Y., Q.M., J.H. and F.J.; resources, H.H.; writing—original draft preparation, H.H., Z.H. and W.W.; writing—review and editing, H.H., Z.H., Z.L., W.W., J.Y., Q.M., J.H. and F.J.; supervision, H.H.; funding acquisition, H.H., W.W., Q.M. and J.H. All authors have read and agreed to the published version of the manuscript.
Funding
This work was supported by the Guangxi Key Research and Development Program Project: GuiKeAB25069449; the “Jianfeng” Action Plan (Guangxi Key Special Project Program): GuiKeJF2503980004; and the Guangxi National Science and Technology Major Project: GuiKeAA24206064.
Data Availability Statement
All data used to support the findings of this study are included within the article.
Conflicts of Interest
Author Hongsheng Huang was employed by the Top Electrical Appliances Industrial Co., Ltd. The remaining authors declare that the research was conducted in the absence of any commercial or financial relationships that could be construed as a potential conflict of interest.
Nomenclature
| CE | The combustion fraction |
| AA | The combustion midpoint angle |
| D | The combustion duration angle |
| E | The Wiebe exponent |
| BM | The combustion midpoint |
| BMC | The combustion midpoint constant |
| BS | The fuel combustion start point |
| BSC | The fuel combustion start-point constant |
| BE | The fuel combustion end point |
| BEC | The fuel combustion end-point constant |
| xi(t) | The position of the particle at the t-th iteration |
| vi(t) | The grid load factor |
| ω | The inertia weight |
| Pbest,i | The personal best position of the particle |
| c1 | The learning factor |
| r1 | The random number |
| fitness(xi(t + 1)) | The fitness of the particle at the t + 1-th iteration |
| CDi | The crowding degree of the i-th individual |
| M | The number of objective functions |
| fm(xi+1) | The number of objective functions |
| t | The current iteration number |
| Tmax | The maximum iteration number |
| λ | The attenuation rate parameter |
| N | The population size |
| CVDi | The constraint violation degree of the i-th individual |
| gj(xi) | The value of the i-th individual for the j-th inequality constraint |
| J | The total number of inequality constraints |
| nrpm | The engine speed |
| mpre | The PIFQ |
| θmain | The MIT |
| θpre | The PIT |
| Prail | The RP |
| TNOx | The standard value specified by emission regulations |
References
- Khan, I.; Tariq, M.; Alabbosh, F.K.; Rehman, A.; Jalal, A.; Khan, A.A.; Farooq, M.; Li, G.; Iqbal, B.; Ahmad, N.; et al. Soil microplastics: Impacts on greenhouse gasses emissions, carbon cycling, microbial diversity, and soil characteristics. Appl. Soil Ecol. 2024, 197, 105343. [Google Scholar] [CrossRef]
- Babayev, R.; Morén, M.; Johansson, B. Comparative computational study of hydrogen and natural gas in high-pressure direct-injection (HPDI) compression-ignition engines: Combustion characteristics, thermal efficiency, and local pollutant and greenhouse gas emissions. Fuel 2025, 395, 135126. [Google Scholar] [CrossRef]
- Han, H.S.; Han, K.R.; Wang, Y.; Kim, C.J.; Sohn, C.H.; Nam, C. Effects of natural-gas blending on ignition delay and pollutant emission of diesel fuel for the condition of homogenous charge compression ignition engine. Fuel 2022, 328, 125280. [Google Scholar] [CrossRef]
- Algayyim, S.J.M.; Saleh, K.; Wandel, A.P.; Fattah, I.M.R.; Yusaf, T.; Alrazen, H.A. Influence of natural gas and hydrogen properties on internal combustion engine performance, combustion, and emissions: A review. Fuel 2024, 362, 130844. [Google Scholar] [CrossRef]
- Akhtar, M.U.S.; Asfand, F.; Mishamandani, A.S.; Mishra, R.; Khan, M.I. Hydrogen as a sustainable combustion fuel: Performance, challenges, and pathways for transition to low-carbon propulsion systems. Renew. Sustain. Energy Rev. 2025, 223, 116004. [Google Scholar] [CrossRef]
- Hasanov, J.F.; Javid, M.; Mikayilov, I.J.; Shabaneh, R.; Darandary, A.; Alyamani, R. Macroeconomic and sectoral effects of natural gas price: Policy insights from a macroeconometric model. Energy Econ. 2025, 143, 108233. [Google Scholar] [CrossRef]
- Meli, M.; Wang, Z.; Sterlepper, S.; Picerno, M.; Pischinger, S. Data-driven parametric optimization for pre-calibration of internal combustion engine controls. Appl. Energy 2025, 392, 125893. [Google Scholar] [CrossRef]
- Wang, Q.; Yang, R.; Sun, X.; Liu, Z.; Zhang, Y.; Fu, J.; Li, R. The Engine Combustion Phasing Prediction Based on the Support Vector Regression Method. Processes 2022, 10, 717. [Google Scholar] [CrossRef]
- Xi, D.; Jiang, L.; Cui, J.; Sun, X.; Long, W. Fuel economy-emission trade-off optimization for diesel/natural gas dual-fuel engine using many-objective many-population hybrid genetic algorithm. Energy 2025, 333, 137347. [Google Scholar] [CrossRef]
- Soltanalizadeh, S.; Yazdi, M.R.H.; Esfahanian, V.; Nejat, M. Prediction of emission and performance of internal combustion engine via regression deep learning approach. Proc. Inst. Mech. Eng. 2025, 239, 4362–4382. [Google Scholar] [CrossRef]
- Sun, W.; Shi, X.; Lu, X.; Hua, D.; Li, R.; Liu, H. Optimization Study of Shaft System Vibration and Broken Tooth Fault Under the Influence of 3D Mixed Lubrication of Marine Diesel Engine Timing Gear System. J. Vib. Eng. Technol. 2024, 12, 6053–6073. [Google Scholar] [CrossRef]
- Zeng, H.; Jiang, K.; Wu, Z.; Liu, X. Performance research and optimization of marine dual-fuel engine based on RSM and NSGA-II. Energy Sources Part A Recover. Util. Environ. Eff. 2023, 45, 12503–12519. [Google Scholar] [CrossRef]
- Bhowmik, S.; Paul, A.; Panua, R. Performance, exhaust emission and combustion of ethanol–diesel–compressed natural gas dual-fuel compression-ignition engine: A trade-off study. Clean Technol. Environ. Policy 2022, 24, 1417–1436. [Google Scholar] [CrossRef]
- Cong, Y.; Gan, H.; Wang, H.; Hu, G.; Liu, Y. Multiobjective Optimization of the Performance and Emissions of a Large Low-Speed Dual-Fuel Marine Engine Based on MNLR-MOPSO. J. Mar. Sci. Eng. 2021, 9, 1170. [Google Scholar] [CrossRef]
- Tadros, M.; Boulougouris, E. Calibration Procedures for NOx Emissions Model of a High-Speed Marine Diesel Engine Using Optimization Procedures. J. Mar. Sci. Eng. 2025, 13, 1585. [Google Scholar] [CrossRef]
- Mehnatkesh, H.; Winkler, A.; Sperling, E.; Kheyrollahi, J.; Shahbakhti, M.; Gordon, D.; Koch, C.R. Systematic framework for deep learning-based predictive injection control with Bayesian hyperparameter optimization for a hydrogen/diesel dual-fuel engine. Control Eng. Pract. 2025, 164, 106513. [Google Scholar] [CrossRef]
- Khanyi, N.; Inambao, L.F.; Stopforth, R. A Comprehensive Review of the GT-POWER for Modelling Diesel Engines. Energies 2025, 18, 1880. [Google Scholar] [CrossRef]
- Novella, R.; Soriano, G.J.; Barbery, I.; Martinez-Hernandiz, P. Exploring the passive the pre-chamber ignition concept for spark-ignition engines fueled with natural gas under EGR-diluted conditions. Energy 2024, 294, 130909. [Google Scholar] [CrossRef]
- Lee, Y.; Lee, S.; Min, K. Semi-empirical estimation model of in-cylinder pressure for compression ignition engines. Proc. Inst. Mech. Eng. Part D J. Automob. Eng. 2020, 234, 2862–2877. [Google Scholar] [CrossRef]
- Decan, G.; Lucchini, T.; D’Errico, G.; Verhelst, S. A novel technique for detailed and time-efficient combustion modeling of fumigated dual-fuel internal combustion engines. Appl. Therm. Eng. 2020, 174, 115224. [Google Scholar] [CrossRef]
- Zhu, J.; Liu, R.; Lin, H.; Jin, Z.; Qian, Y.; Zhou, D.; Yin, Y.; Li, Z.; Lu, X. Computational insights into flame development and emission formation in an ammonia engine with hydrogen-assisted pre-chamber turbulent jet ignition. Energy Convers. Manag. 2024, 314, 118706. [Google Scholar] [CrossRef]
- GB 17820-2018; Natural Gas. China Standards Press: Beijing, China, 2018.
- GB 19147-2016; Automobile Diesel Fuels. China Standards Press: Beijing, China, 2016.
- Luo, S.; Qian, J.; Huang, X.; Zhou, Q.; Hu, J. A dual-discriminator network based on Sobel gradient operator for digital twin-assisted fault diagnosis. Eng. Appl. Artif. Intell. 2025, 145, 110155. [Google Scholar] [CrossRef]
- Abdel-Basset, M.; Mohamed, R.; Abouhawwash, M. Crested Porcupine Optimizer: A new nature-inspired metaheuristic. Knowl.-Based Syst. 2024, 284, 111257. [Google Scholar] [CrossRef]
- Gao, Y.; Zhang, Y.; Xie, X. A neural network based on back-propagation and cooperative co-evolution. Appl. Soft Comput. 2025, 181, 113453. [Google Scholar] [CrossRef]
- Song, Y.; Chen, X.; Zhou, J.; Du, T.; Xie, F.; Guo, H. Research on performance of passive heat supply tower based on the back propagation neural network. Energy 2022, 250, 123762. [Google Scholar] [CrossRef]
- Cui, X.; Zhu, J.; Jia, L.; Wang, J.; Wu, Y. A novel heat load prediction model of district heating system based on hybrid whale optimization algorithm (WOA) and CNN-LSTM with attention mechanism. Energy 2024, 312, 133536. [Google Scholar] [CrossRef]
- Zeng, Z.; Ni, F. Research on the Optimal Scheduling Model of Energy Storage Plant Based on Edge Computing and Improved Whale Optimization Algorithm. Energy Eng. 2025, 122, 1153–1174. [Google Scholar] [CrossRef]
- Pan, X.; Guan, W.; Gu, J.; Wang, X.; Zhao, H. Optimization of the low-load performance and emission characteristics for a heavy-duty diesel engine fueled with diesel/methanol by RSM-NSWOA. Renew. Energy 2025, 245, 122819. [Google Scholar] [CrossRef]


Disclaimer/Publisher’s Note: The statements, opinions and data contained in all publications are solely those of the individual author(s) and contributor(s) and not of MDPI and/or the editor(s). MDPI and/or the editor(s) disclaim responsibility for any injury to people or property resulting from any ideas, methods, instructions or products referred to in the content. |
© 2026 by the authors. Licensee MDPI, Basel, Switzerland. This article is an open access article distributed under the terms and conditions of the Creative Commons Attribution (CC BY) license.