Abstract
To enhance the accuracy and timeliness of field testing for grounding impulse impedance in complex soil environments, this paper addresses the limitations of traditional peak-ratio methods—such as susceptibility to noise interference and the inability to reflect dynamic impedance variations—by proposing an identification method that combines an improved Hanning window with recursive least squares (RLS). During signal preprocessing, an improved Hanning window with adjustable parameters and energy normalization is employed to enhance the main-lobe energy concentration of impulse voltage and current signals while effectively suppressing high-frequency sidelobe leakage. In the parameter estimation stage, a low-order discrete linear model is established and an RLS algorithm with a forgetting factor is introduced to achieve full-time adaptive estimation of impulse impedance. Using a simulated surge test circuit, 18 sets of typical operating conditions with varying inductance and resistance parameters are designed. The same voltage and current data are processed using three processing methods: no windowing, standard Hanning windowing, and improved Hanning windowing. Results show that the average relative error of surge impedance is 9.16% without windowing, the standard Hanning window reduced the error to 3.78%, and the modified Hanning window further decreased the error to approximately 1.51%. Comparative analysis of different forgetting factor settings indicates that a value of approximately λ = 0.98 achieves an optimal trade-off between dynamic tracking capability and steady-state smoothness. The research results demonstrate that the proposed method achieves high identification accuracy for impact impedance and exhibits satisfactory parameter robustness under strong noise and multiple operating conditions, providing a reference for grounding impact characteristic testing and lightning protection design.
1. Introduction
The grounding grid of power plants and substations serves as the fundamental safeguard and critical measure for maintaining the safe and reliable operation of power systems, ensuring the safety of electrical equipment and personnel [1,2]. A well-grounded network with low surge impedance provides effective protection for personnel, electrical equipment, and facilities, thereby reducing accidents caused by lightning strikes, power system short-circuit faults, and other events. Traditional surge impedance measurement methods primarily rely on the peak ratio method, which requires high-voltage surge testing under laboratory conditions. These methods often fail to accurately reflect the dynamic response characteristics of grounding electrodes in complex soil environments and under nonlinear breakdown conditions. Furthermore, factors like noise interference and current peak asynchrony during field testing often cause significant distortion in voltage and current signals, resulting in low measurement accuracy for impulse impedance. The literature [3] indicates that significant deviations may exist between surge impedance and steady-state ground resistance due to factors such as soil ionization, frequency-dependent parameters, and inductive effects. When steady-state ground resistance falls within the range of 27 to 150 Ω, the difference between impulse impedance and ground resistance can reach 54% to 92%. This implies that substituting steady-state resistance or merely using peak values to represent transient impulse performance may introduce substantial bias in ground potential rise and step voltage assessments, thereby affecting safety margin determinations. For large grounding grids, ground potential rise may exhibit characteristics of high magnitude and uneven distribution, which directly impacts the safety and reliability of system operation during lightning strikes [4].
From an engineering testing perspective, traditional invasive ground impedance measurements often require high current injection and strict electrode placement, which are difficult to achieve in live substation environments. Relevant system reviews emphasize that the surface potential generated by high-current testing poses electric shock hazards and may trigger false protection device operations, leading to unplanned outages. In some cases, adjacent grounding electrodes must be disconnected or operations interrupted, adversely affecting power supply reliability and maintenance schedules [5]. To avoid power outages, high-frequency testing equipment may also be employed on-site, though its accuracy and applicability depend on operational conditions. Recent simulations and field verification indicate that under certain assumptions regarding line span and configuration, the high-frequency method can achieve an acceptable error margin of less than 10%. However, accuracy may significantly deteriorate when these methodological assumptions are not met [6]. Furthermore, extensive field measurements demonstrate that even for horizontal grounding conductors buried in high-resistivity soils (approximately 1100–1600 Ω·m), their transient response significantly varies with both the surge front duration (approximately 1.2–7 μs) and electrode configuration. This indicates that field waveforms exhibit a strong dependence on operating conditions [7]. Meanwhile, soil ionization is widely recognized as one of the key mechanisms causing a “decrease in equivalent ground resistance” during strong current transients, and this effect is more pronounced in non-uniform soil conditions [8]. Therefore, developing an algorithm capable of performing time-domain adaptive processing on impulse signals and enabling real-time estimation of grounding grid impulse impedance holds significant engineering importance for ensuring the safe and stable operation of grounding grids.
Currently, scholars both domestically and internationally primarily employ the following theoretical approaches for calculating the surge impedance of grounding systems: circuit theory, transmission line theory, electromagnetic field theory, and combined field-circuit theory. The circuit theory-based approach was proposed by Indian scholars Gupta and Thapar in the early 1980s. It treats the grounding body as lumped parameters containing inductance (L) and capacitance (G), deriving an empirical formula for the impact impedance of square ground grids [9]. However, this method neglects the internal impedance and capacitance to ground of the grounding body, as well as the coupling effects between conductors and the ionization effect of the soil. Gao Yanqing from Tsinghua University employed a soil breakdown-considering model in ground grid transient calculations [10], solving branch currents and node voltages through iterative methods based on Kirchhoff’s current and voltage laws. While this model offers higher accuracy, it disregards mutual inductance and mutual capacitance between conductors. In transmission line models based on transmission line theory, the grounding electrode is treated as a distributed parameter circuit. The impulse response of the grounding electrode is analyzed as a distributed parameter transmission line wave process [11,12], transforming the analysis of wave and field problems into circuit analysis problems. However, this approach cannot handle nonlinear issues. Methods based on electromagnetic field theory fundamentally involve formulating boundary condition equations for the grounding system to derive a generalized impedance matrix incorporating Sommerfeld integrals. Electromagnetic field solutions typically employ the method of moments, boundary element method, and finite element method [13,14,15]. Canadian researchers Dawalibi et al. conducted extensive, detailed studies and developed the initial version (version 1.0) of the CDEGS software for grounding safety design, [16,17,18,19]. This system can determine the response of grounding devices under surge currents and the electromagnetic field distribution around power plant ground grids. It can analyze electromagnetic interference generated in secondary equipment within power systems and account for electromagnetic mutual coupling between conductors. However, the system employs Fourier linear transformations during computation, which cannot address the nonlinear behavior of soil under surge currents. References [20,21,22,23] applied frequency-domain electromagnetic field numerical methods to grounding grid research, proposing an adaptive sampling method based on the complex mirroring technique to enhance computational efficiency. Nevertheless, significant challenges remain in addressing soil nonlinearity. Methods based on field-circuit coupling theory define the unknown quantity as the voltage values at discrete points on the conductors within the grounding grid. They simultaneously employ approaches based on electromagnetic field theory to account for mutual impedance relationships between conductors and circuit theory to solve node voltage equations [24]. Although the implementation processes in the above literature differ, they all follow the principle of first establishing equations using circuit analysis methods and then solving for relevant parameters using electromagnetic field analysis methods. Compared with the aforementioned electromagnetic field analysis method, the field-circuit coupling method has lower computational complexity and is applicable to transient response calculations within the 1 MHz current frequency range.
Based on existing research, to address the issues of low accuracy in strong noise environments, inadequate response to non-synchronous peaks, and difficulty in reflecting dynamic impedance changes during impact in traditional impact impedance calculation methods, this paper proposes an impact impedance algorithm for grounding networks based on the integration of an improved Hanning window and RLS. This algorithm enhances the main lobe energy concentration of surge voltage and current signals while suppressing high-frequency sidelobe interference by introducing a weighted improved Hanning window during signal preprocessing. Subsequently, it implements real-time adaptive estimation of surge impedance through parameter estimation by incorporating window function weighting and a dynamic forgetting factor into the recursive least squares (RLS) algorithm. This approach effectively reduces noise interference on estimation accuracy, improves the stability and timeliness of surge impedance calculations, and provides a highly accurate, implementable algorithmic pathway for parameter identification in grounding network surge response processes.
In summary, the main contributions of this paper include: (1) proposing a weighted improved Hanning window preprocessing scheme for impact grounding signals, enhancing robustness against noise and waveform distortion; (2) constructing a window-assisted RLS online estimation framework with a dynamic forgetting factor, mitigating peak desynchronization effects and enabling time-varying impact impedance tracking; (3) Establishing a feasible time-domain identification pathway supporting safety and reliability-related transient assessments. This approach complements high-precision time-domain modeling studies (e.g., maximum computational error reported <5.14%) [25] while addressing field requirements for convenient impact performance evaluation [26,27] and grounding impedance optimization applications in lightning protection systems [28].
2. Grounding Impulse Characteristics and Signal Feature Analysis
2.1. Definition and Physical Characteristics of Grounding Impact Impedance
When surge currents or lightning currents discharge into the ground through the grounding electrode, the equivalent resistance exhibited by the grounding electrode to the external circuit is referred to as surge impedance. Compared to grounding impedance under power frequency conditions, surge grounding impedance exhibits significant differences. On one hand, the peak value of surge current can reach tens to hundreds of kiloamperes, readily causing localized electrical breakdown in soil or nonlinear variations in its conductive properties. On the other hand, the equivalent frequency of surge current far exceeds the power frequency range, significantly enhancing the inductive characteristics of the grounding grid. When a surge current is injected into the grounding electrode, a series of complex transient electromagnetic processes occurs within the system, resulting in the grounding electrode exhibiting different equivalent impedance values at different time points. Furthermore, the peak values of voltage and current do not occur simultaneously; the instant of maximum voltage often lags behind the instant of peak current. This further underscores the dynamic time-varying nature of surge grounding impedance. The surge impedance Rch is defined as:
where Um represents the peak voltage and Im denotes the peak surge current. Since Um and Im may occur at different instants, Rch holds no clear physical meaning. However, Rch reflects the voltage-current dynamic response characteristics of the grounding electrode under surge current conditions, comprehensively capturing the coupled effects of multiple physical factors, including soil conductivity, grounding conductor geometry, parasitic inductance, and inductive phenomena. In engineering applications and lightning protection design, knowing Rch allows immediate calculation of the maximum voltage Um across the grounding electrode under a given Im. The ratio of the grounding network’s surge impedance Rch to its power frequency grounding impedance Rg is defined as the surge coefficient. This coefficient reflects the extent to which the grounding electrode’s impedance increases under surge current compared to power frequency conditions, serving as a key metric for evaluating its transient conductivity and current distribution characteristics.
2.2. Characteristics Analysis of Surge Current and Signal Features
2.2.1. Typical Waveform Characteristics of Surge Current
Surge current is a typical current form describing transient discharge processes in lightning strikes, electromagnetic pulses, or high-voltage testing equipment. Its primary characteristics include a rapid rise, an exponential decay, a short duration, and concentrated energy. In grounding system research, surge current serves not only as a crucial excitation source for analyzing surge impedance but also as the fundamental input signal reflecting the high-frequency dynamic characteristics of the conductor-soil system. Mathematically, surge current can be represented by a double exponential function, generally expressed as:
In the equation, Ip represents the peak current of the waveform, while α and β denote the reciprocals of the rise-time and fall-time constants, respectively. Common impulse current waveforms encountered in engineering applications include lightning impulse currents (typically 8/20 μs), operational surge currents (250/2500 μs), and simulated electromagnetic pulse currents (1/5 μs). All of these waveforms can be uniformly represented by the above model. These impulse currents are characterized by highly concentrated energy and strong transient behavior, with typical durations ranging from a few microseconds to milliseconds. The transient nature of surge currents causes rapid changes in ground electrode surface potential distribution, soil conductivity, and inductive coupling within very short time intervals. Consequently, accurate surge response analysis must account for the coupled effects in both the time and frequency domains. The impulse current was generated using a portable impulse current generator designed by Shanghai Suoxin Electronics Co., Ltd. (Shanghai, China). Data processing and numerical analysis were carried out using MATLAB R2022b (The MathWorks, Inc., Natick, MA, USA).
Figure 1 illustrates a typical 8/20 μs surge current waveform commonly used to represent lightning impulse excitation in grounding system studies. The waveform is characterized by a steep rising front and a relatively slow decaying tail, which leads to strong non-stationary behavior and broadband frequency components. These characteristics make conventional steady-state or peak-based impedance evaluation methods insufficient for accurately describing grounding transient responses.
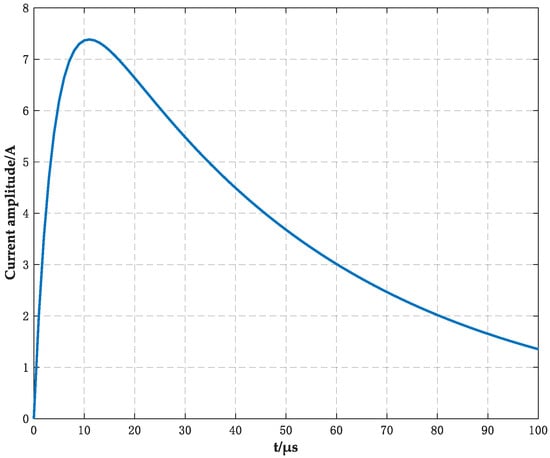
Figure 1.
8/20 μs surge current waveform.
2.2.2. Time-Frequency Characteristics of Surge Current
The broadband characteristics of the surge current determine the nonlinear response of the grounding system at high frequencies. To investigate its spectral characteristics, the Fourier transform of I(t) can be performed:
Frequency response characteristics:
The phase-frequency characteristics are:
From the frequency–phase characteristics, it can be seen that in the low-frequency range (ω ≪ α, β), the spectrum of the surge current is approximately constant, with energy being highly concentrated. In the high-frequency range (ω ≫ α, β), the amplitude decays with the square of the frequency. This indicates that although the surge current is extremely short in duration, its spectrum extends over an extremely wide range, making it a typical broadband, non-stationary excitation signal. This characteristic dictates that the variation in the grounding electrode’s equivalent impedance with frequency cannot neglect the effects of inductance and distributed parameters. Particularly in the high-frequency range, the influence of conductor self-inductance and mutual inductance causes the surge impedance to exhibit significant inductive characteristics.
3. Identification of Grounding Impulse Impedance Based on a Combined Improved Hanning Window and RLS Algorithm
3.1. Analysis of Hanning Window Characteristics and Improvement of Hanning Window Function Construction
In signal processing and spectral analysis, window functions serve as a common weighting method to truncate finite-length signals and suppress spectral leakage. When performing a discrete Fourier transform directly on a finite-duration signal, the truncation operation effectively multiplies the signal by a rectangular window. This generates significant sidelobes in the frequency domain, causing power leakage that disperses spectral energy between adjacent frequency points. Consequently, this affects the accuracy of signal amplitude and phase measurements. To mitigate this phenomenon, signals are typically multiplied by a smoothing window function prior to analysis or estimation. This causes the signal to gradually transition to zero at both ends of the time domain, achieving a smooth truncation and reducing spectral interference. Among various window functions, the Hanning window is widely used for signal weighting due to its advantages: time-domain continuity, rapid sidelobe attenuation in the frequency domain, and computational simplicity. This is particularly true in analyzing short-duration non-stationary signals like surge currents and lightning waves. The Hanning window effectively mitigates signal discontinuities at both ends, suppresses interference from out-of-window energy to the main frequency band, and enhances energy concentration of transient signals in the time-frequency domain. This provides more stable input for subsequent parameter estimation. The standard Hanning window is defined as:
The Hanning window function exhibits a broad main lobe and rapidly decaying side lobes in the frequency domain. This characteristic provides excellent smoothing properties for steady-state or quasi-steady signals. However, when processing signals with steep rising edges, narrow pulses, or concentrated transient energy, the broad main lobe may cause temporal localization ambiguity, making it difficult to accurately reflect the wavefront evolution process. Therefore, in impact impedance estimation, direct application of the standard Hanning window introduces minor smoothing errors in the peak segment, resulting in a dynamic impedance response that is slower than the actual behavior. To address the resolution limitations of the standard Hanning window in processing impact-type non-stationary signals, this paper proposes a structural modification. An adjustable parameter a is introduced to control the energy distribution of the window function, enabling a flexible trade-off between spectral sidelobe suppression and main-lobe width. The modified Hanning window is defined as:
As shown in Figure 2, the impulse current waveform processed by the improved Hanning window exhibits enhanced energy concentration around the main wavefront while maintaining smoother attenuation near both ends. Compared with the unprocessed waveform, the improved window suppresses high-frequency fluctuations without significantly distorting the impulse front, which is beneficial for subsequent time-domain parameter identification.
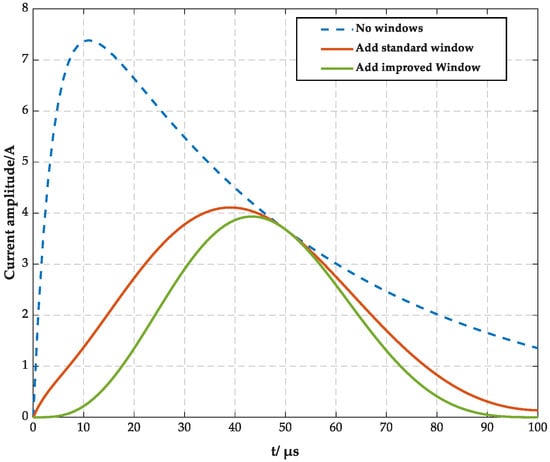
Figure 2.
8/20 μs Comparison of Impulse Current Waveform After Window Improvement.
Where a is an adjustable parameter, when a = 0.5, it degenerates into the standard Hanning window. When a > 0.5, the window’s center weight increases, the main lobe narrows, and time-domain resolution improves. When a < 0.5, the window’s frequency-domain sidelobes are lower, making it suitable for processing stationary signals. By adjusting a, the window’s weighting characteristics can be flexibly controlled for different signal patterns.
During signal windowing, the window function applies a weighted transformation to the original signal, altering its overall energy distribution. Without energy normalization, amplitude values across different window lengths and shapes may become incomparable, introducing bias in the magnitude accuracy of impedance estimation. To ensure energy consistency and algorithmic stability in signal processing, normalization must be applied after windowing to maintain constant average energy in the windowed signal. The normalized form of the modified Hanning window function ωa(n) is defined as:
In the equation, the denominator represents the energy normalization factor of the window function, ensuring that the average amplitude of the windowed signal matches that of the original signal. This normalization operation not only preserves signal energy conservation but also prevents amplitude drift in the output signal under different window parameters, enhancing the algorithm’s adaptability across varying signal lengths.
To validate the differences in time-domain and frequency-domain characteristics between the standard and improved Hanning windows, Figure 3 and Figure 4 present comparative results of their time-domain responses and frequency responses, respectively. Figure 3 and Figure 4 indicate that the improved Hanning window achieves a better compromise between time-domain resolution and frequency-domain leakage suppression, making it more suitable for processing short-duration impulse signals than the standard Hanning window. The time-domain distribution reveals that the improved Hanning window exhibits slightly higher amplitude in the central region, smoother attenuation at both ends, and stronger energy concentration. In contrast, the standard Hanning window demonstrates more uniform distribution across the entire window length with noticeable time-domain broadening. In the frequency domain, the main lobe width of the improved Hanning window is slightly narrower than that of the standard Hanning window, and the side lobe suppression is slightly reduced, though it remains around −30 dB. This result indicates that while sacrificing some spectral purity, the improved window significantly enhances temporal resolution, making it more suitable for weighting and parameter identification of short-duration signals such as impulse currents.
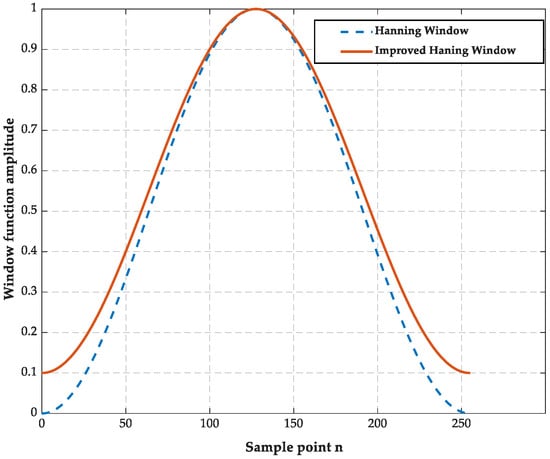
Figure 3.
a = 0.55 Time-domain waveform comparison.
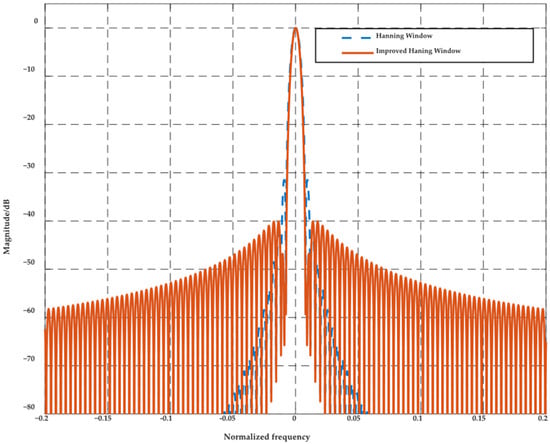
Figure 4.
Frequency response comparison at a = 0.55.
3.2. Impact Impedance Recursive Least Squares Identification Method
During the transient process of lightning current injection into the grounding grid, the grounding grid and soil system do not behave as static resistors with fixed values. Instead, they exhibit behavior resembling a dynamic system with memory. The conductor geometry and return paths impart equivalent inductive characteristics to the system, while the dielectric and polarization behaviors of the soil, corrosion layer, and pore water manifest as equivalent capacitance and damping effects. Current flow at the metal-soil interface and thermoelectric coupling cause the equivalent resistance to vary over time. For time-domain characterization, the equivalent dynamic equation of the grounding grid can be abstracted as a memory-dependent linear system:
When the soil is linear and the frequency is fixed, it can be approximated as:
The ground voltage V(t) responds to the input current I(t). Physically, this response originates from dissipation provided by resistance R, mutual inductance reflected by equivalent inductance L, and polarization embodied by equivalent capacitance C. When the shock wave front arrives and the current rises rapidly, soil ionization causes a sudden increase in microchannel conductivity, reducing the equivalent resistance term. while the high-frequency component enhances the skin effect, causing current to flow toward the outer layer of the conductor and shallow soil layers for return. Inductance and capacitance parameters also change accordingly. These two types of nonlinearity imply that system parameters vary with time. If characterized using static ratios with fixed parameters, both time-varying and frequency-varying effects would be folded into a distorted scalar. This approach struggles to explain peak misalignment and fails to reflect the differences between the rising edge and the decaying segment. To address this, this paper introduces a recursive least squares method with a forgetting factor and windowed weighting, building upon the Hanning window, to achieve continuous time-domain identification of transient impedance.
The sampled current sequence I(k) and voltage sequence V(k) can be approximated by a second-order discrete linear model within a short-time window:
Among these, a1 and a2 are autoregressive coefficients, collectively characterizing the system’s self-feedback and inertia; b0, b1, and b2 are input action coefficients, describing the direct and delayed effects of input current on output voltage; e(k) represents unmodeled disturbances and measurement noise. Physically, within the small interval (a1, a2) and (b0, b1, b2), these can be regarded as implicit functions of R(t), L(t), and C(t). When ionization and skin effect intensify, these coefficients drift slowly with k. The RLS recursion precisely tracks this drift in real time.
Before proceeding to parameter estimation, the original signal is first weighted using the improved Hanning window ωa(k):
Next, construct the data vector and parameter vector:
Here, ϕ(k) represents the data vector and θ(k) represents the parameter vector. Expressing them in standard linear regression form yields:
Define the cost function with a forgetting factor:
Here, λ represents the decay factor, whose effect can be understood from two perspectives: when λ→1, historical samples exhibit minimal attenuation, resulting in lower estimation variance but reduced responsiveness to rapid changes; when λ is slightly less than 1, the most recent tens to hundreds of sampling points receive higher weighting, enabling the algorithm to respond more swiftly to rising edges, ionization initiation points, and dynamic transitions from the main lobe to the tail.
The classic RLS recursion provides updates for the current gain K(k), parameters θ(k), and covariance matrix P(k):
Through this recursive process, {ai(k), bi(k)} is updated at each sampling point, dynamically mapping the time-varying equivalent R, L, and C components onto observable discrete coefficient trajectories. Based on the identified parameter vector θ(k), the system’s transfer function model can be reconstructed:
Then the frequency response of the system in steady state can be written as:
Zeq(k) represents the real-time estimated equivalent shock impedance, which reflects the dynamic response characteristics of the grounding grid under lightning current surges.
3.3. Overall Algorithm Flow
The overall process for identifying grounding grid surge impedance using a method combining an improved Hanning window and RLS is as follows:
(1) Simultaneously acquire ground voltage and surge current sequences, ensuring a unified time reference and sampling interval to guarantee voltage-current alignment.
(2) Apply an improved Hanning window to both signals and perform necessary amplitude normalization to suppress noise and sidelobe leakage, thereby highlighting the effective time-window features.
(3) Construct a low-order discrete model within the short-time window and enter the RLS online identification loop. Parameters are updated in real-time based on newly sampled points to track time-varying characteristics caused by ionization and skin effect.
(4) Calculate and record the transient impact impedance based on the current parameters. If termination conditions are not met, return to continue the recursive process. Upon satisfaction, output the full-duration results and corresponding statistical metrics.
4. Experimental Verification
4.1. Analog Measurement Circuit Model
A simulated measurement circuit was constructed in the laboratory as shown in Figure 5.
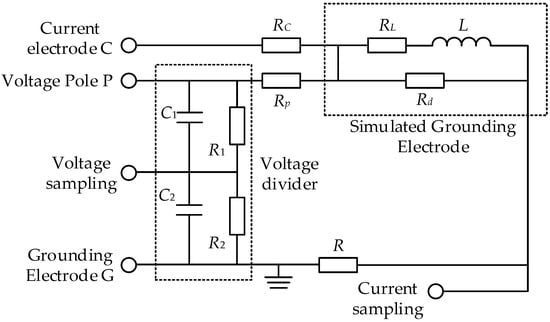
Figure 5.
Analog Measurement Circuit.
Among these, C represents the simulated current electrode, P the simulated voltage electrode, and G the simulated ground electrode. RC and RP denote the simulated equivalent resistances for the ground current electrode and voltage electrode, respectively, both set at 60 Ω. C1 and C2, along with R1 and R2, serve as the compensating capacitors and resistors for the voltage divider, satisfying R1 C1 = R2 C2, with R functioning as the current shunt. Based on laboratory conditions, a remote-positioning wiring method is adopted, where the current electrode, potential electrode, and ground electrode are aligned in a straight line with the potential electrode positioned centrally between the other two. Since the spark effect of the grounding body is disregarded, the grounding body is represented here by ordinary resistive and inductive components: Rd represents the resistive component of the simulated grounding body, and L represents the inductive component. RL represents the internal resistance of the inductor. The voltage across the grounding device is sampled via a voltage divider, while the current flowing through the grounding device is sampled using a current sensor. The experimental setup is illustrated in Figure 6. Figure 5 and Figure 6 show the equivalent laboratory test circuit and the experimental platform, respectively. This configuration enables independent control of resistive and inductive parameters while ensuring repeatability of impulse excitation and measurement, providing a reliable basis for validating the proposed impedance identification algorithm under different operating conditions.
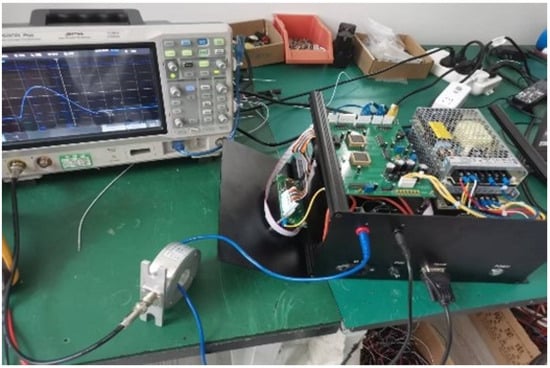
Figure 6.
Experimental Platform.
To validate the applicability of the proposed shock impedance identification method under various shock conditions, 18 sets of grounding grid shock test parameter combinations were designed, as shown in Table 1.

Table 1.
Grounding Impulse Test Parameter Settings.
It should be emphasized that the laboratory experimental setup employed in this study is designed to provide a controlled and repeatable environment for validating the effectiveness of the proposed identification algorithm, rather than to reproduce all environmental complexities encountered by practical grounding systems. Environmental factors such as soil moisture variation, temperature changes, corrosion development, and soil stratification primarily manifest themselves as time-varying electrical characteristics, including equivalent resistance, inductance, and transient voltage–current relationships. The proposed identification method does not explicitly model these environmental factors; instead, it captures their influence implicitly through the adaptive estimation of time-domain impedance parameters. Therefore, although the experimental validation is conducted under simplified conditions, the algorithmic framework remains applicable to grounding systems operating in complex environments, provided that the corresponding voltage and current responses reflect such environmental variations.
4.2. Improving the Impact Resistance Identification of Hanning Windows
To quantitatively evaluate the impact of the improved Hanning window on the accuracy of grounding grid surge impedance identification, 18 typical operating conditions from Table 1 were selected. The same set of surge voltage and current data was preprocessed under three different treatment methods: no window, standard Hannings window (a = 0.5), and improved Hannings window (a = 0.55). The same set of impulse voltage and current data underwent preprocessing under each windowing method, followed by impulse impedance identification with identical RLS parameters (λ = 0.98). The identification results under different windowing conditions are presented in Table 2.
Table 2.
Recognition Results Under Different Window Additions.
Calculating the average error for the three methods based on Equation (20), the relative error of the shock impedance under each operating condition was relatively large without windowing, with an average error of 9.16%. After applying the standard Hanning window, the error decreased to an average of 3.78%. The modified Hanning window further reduced the error to an average of approximately 1.51%.
Figure 7 shows that the grounding impulse impedance identification method combining the improved Hanning window with RLS exhibits superior error suppression and tracking performance compared with the cases of no windowing and standard Hanning windowing. The error comparison results indicate that the improved Hanning window effectively enhances signal energy concentration in the main lobe while suppressing high-frequency sidelobe leakage, thereby reducing the sensitivity of parameter estimation to noise interference. Under low-impedance operating conditions (e.g., Groups 1, 7, and 13), where the impulse current amplitude is relatively large and waveform distortion is more pronounced, the improved Hanning window maintains the relative error within 3.5%, demonstrating strong adaptability to severe transient conditions. This improvement arises because the modified window achieves a better balance between main-lobe width and sidelobe attenuation, which mitigates spectral leakage during rapid wavefront variations. As a result, the proposed method provides enhanced accuracy and robustness in grounding impulse impedance identification across multiple operating conditions.
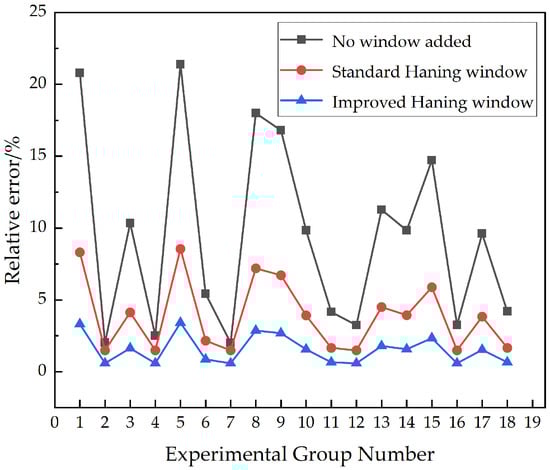
Figure 7.
Comparison Chart of Errors from Different Processing Methods.
4.3. The Influence of Forgetting Factors on Impact Resistance Identification
The forgetting factor λ in the recursive least squares identification method essentially reflects the algorithm’s “memory length” for historical data. When λ = 1, the algorithm possesses infinite memory capacity, treating all historical data equally. When λ < 1, the algorithm exhibits exponential forgetting characteristics, with older data carrying progressively smaller weights. To analyze the impact of different forgetting factors on impact impedance identification, 18 typical operating conditions from Table 1 were selected. Each condition underwent preprocessing with λ = 0.9, λ = 0.95, λ = 0.98, and λ = 0.99. Impact impedance identification was then performed on the same set of impact voltage and current data, all with an improved Hanning window (a = 0.55) applied. The identification results for different λ settings are shown in Table 3.
Table 3.
Recognition Results at Different Wavelengths.
Calculating the mean error for different values of λ according to Equation (20), the relative error peaks at λ = 0.9 with a mean error of 6.84%, indicating that an excessively small forgetting factor causes significant estimation fluctuations. At λ = 0.95, the mean error drops to 4.02%, representing a 43.1% reduction compared to λ = 0.9. Optimal performance is achieved at λ = 0.98, with an average error of only 1.51%. At λ = 0.99, the average error is 2.01%. Figure 8 shows that the results become more stable at λ = 0.99. This occurs because, as the forgetting factor approaches 1, the algorithm retains more historical data in its memory. Incorporating more historical data significantly averages out the impact of single-point noise or sudden disturbances on overall parameter estimation, resulting in minimal fluctuation. However, this stability comes at the cost of reduced dynamic response speed. λ = 0.99 indicates the algorithm forgets old data very slowly. When surge current wavefronts arrive or grounding system characteristics change rapidly, the algorithm requires more time to track these changes. Consequently, during intense transient phases like wavefront arrival, the tracking speed at λ = 0.99 becomes slightly sluggish. This results in its overall accuracy being marginally inferior to that achieved at λ = 0.98, which strikes the optimal balance between stability and estimation precision.
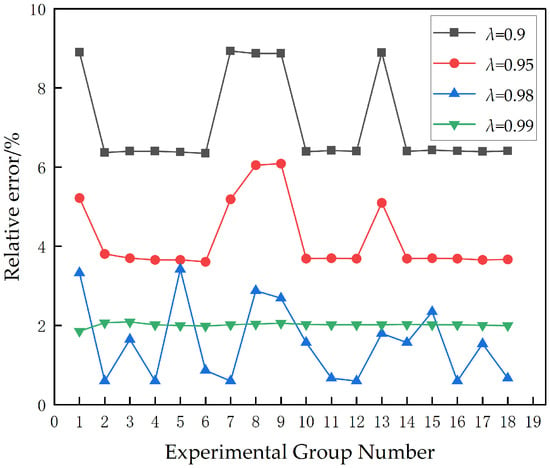
Figure 8.
λ Non-Simultaneous Error Comparison Chart.
4.4. Engineering Implications and Reliability-Oriented Assessment
In practical grounding system assessment, maintenance and operational decisions are commonly based on threshold-oriented diagnostic criteria, where the identified impulse impedance is compared with predefined safety or warning limits. Under such frameworks, identification errors are directly translated into uncertainty intervals surrounding the evaluated grounding condition.
When conventional identification methods exhibit relative errors on the order of 8–10%, the resulting uncertainty bands may overlap adjacent condition categories, particularly for grounding systems operating near critical threshold values. This overlap increases the likelihood of diagnostic misclassification, potentially leading to unnecessary maintenance actions or premature equipment replacement.
By contrast, reducing the identification error to approximately 1.51% significantly narrows the uncertainty interval associated with impulse impedance evaluation. For identical threshold criteria, the proposed method improves the separation between neighboring grounding condition levels, thereby reducing ambiguity in state classification. From an engineering decision-making perspective, the contraction of diagnostic uncertainty directly corresponds to enhanced maintenance decision reliability and reduced risk of false-positive judgments. Although the experimental validation in this study is conducted under controlled laboratory conditions, the above analysis demonstrates that the achieved improvement in identification accuracy provides a quantifiable reduction in diagnostic uncertainty.
5. Conclusions
This study proposes a grounding impulse impedance identification method based on a combined improved Hanning window and recursive least squares (RLS) algorithm, aiming to overcome the limitations of conventional grounding impulse evaluation approaches under non-stationary and noise-contaminated conditions. Unlike traditional calculation methods that focus on steady-state parameters or synchronous peak values, the proposed method emphasizes time-domain adaptive identification, enabling more reliable characterization of transient grounding behavior during impulse excitation.
Compared with classical peak-ratio-based methods reported in earlier studies [9,21,22], which are highly sensitive to peak misalignment and waveform distortion, the proposed approach utilizes full voltage–current time-domain information and therefore avoids errors caused by non-synchronous extrema. In contrast to frequency-domain and electromagnetic-field-based methods [4,16,17,18,19,25], which achieve high modeling accuracy at the cost of detailed environmental parameterization and significant computational complexity, the proposed method is measurement-oriented and directly applicable to practical impulse testing scenarios without requiring explicit soil or geometry modeling.
Quantitative experimental results further demonstrate the superiority of the proposed method over existing techniques. For the same impulse voltage and current data, the average relative error of impulse impedance identification is 9.16% without windowing, reduced to 3.78% using a standard Hann window, and further decreased to approximately 1.51% when the improved Hann window is combined with RLS identification. Compared with recent impulse grounding measurement and identification methods [26,27], the proposed method exhibits enhanced noise immunity and improved dynamic tracking capability, particularly under low-impedance and strongly non-stationary conditions.
From an engineering perspective, grounding impulse impedance identification is inevitably affected by measurement noise, waveform distortion, and uncertainty in impulse test conditions, which leads to non-negligible calculation errors in practical applications. Existing peak-based and frequency-domain methods reported in the literature commonly exhibit relative errors ranging from several percent to more than 10%, depending on signal quality and test configurations. In this context, the proposed method achieves an average relative error of approximately 1.51% under the same experimental conditions, which is significantly lower than the error levels commonly reported for conventional approaches. This result indicates that the proposed algorithm provides not only improved numerical accuracy but also a practically meaningful level of reliability for grounding system impulse performance evaluation. By integrating signal preprocessing using an improved Hann window with time-domain adaptive parameter identification, the proposed method achieves a favorable balance between accuracy, robustness, and implementation complexity, making it suitable for engineering-oriented impulse grounding assessment and related applications.
Future work will focus on extending the proposed framework to long-term and field-based applications, including the investigation of environmental influences such as soil moisture variation, temperature effects, and corrosion-induced parameter evolution. Incorporating measured field data and more complex grounding configurations will further enhance the applicability and generality of the proposed method in real power system environments.
Author Contributions
Conceptualization, J.W., Z.Y., F.Y.; methodology, J.W., Z.Y., F.Y., J.H., S.H., S.L.; software, J.W. and Z.Y.; validation, J.W., Z.Y., Y.W. and X.W.; formal analysis, Z.Y. and S.H.; investigation, J.W., Z.Y., Y.W. and X.W.; resources, J.H., S.H., Y.W., Z.Y.; data curation, J.W., Z.Y. and Y.W.; writing—original draft preparation, J.W.; writing—review and editing, Z.Y.; supervision, S.H., J.H. and X.W.; project administration, S.L., J.H. and X.W.; funding acquisition, Z.Y., S.L., J.H. and X.W. All authors have read and agreed to the published version of the manuscript.
Funding
This research was funded by State Grid Zhejiang Electric Power Co., Ltd. Science and Technology Project(No. 5211DS240005).
Data Availability Statement
The original contributions presented in this study are included in the article. Further inquiries can be directed to the corresponding author.
Conflicts of Interest
Authors Jiayuan Hu, Sen Liu and Xiaohan Wen were employed by State Grid Zhejiang Electric Power Corporation Research Institute. The remaining authors declare that the research was conducted in the absence of any commercial or financial relationships that could be construed as a potential conflict of interest.
References
- Heppe, R. Computation of Potential at Surface Above an Energized Grid or Other Electrode, Allowing for Nonuniform Current Distribution. IEEE Trans. Power Appar. Syst. 1979, 98, 1978–1989. [Google Scholar] [CrossRef]
- Pillai, P.; Dick, E. A Review on Testing and Evaluating Substation Grounding Systems. IEEE Trans. Power Deliv. 1992, 7, 53–61. [Google Scholar] [CrossRef]
- Nor, N. Review: Factors Affecting the Performance of Ground Electrodes under High Impulse Currents. Energies 2023, 16, 4236. [Google Scholar] [CrossRef]
- Grcev, L.; Markovski, B. Impulse Impedance and Effective Area of Grounding Grids. IEEE Trans. Power Deliv. 2021, 36, 1183–1192. [Google Scholar] [CrossRef]
- Leal, A.G.; Lazzaretti, A.E.; López-Salamanca, H.L. A systematic review on grounding impedance measurement in electrical installations. Electr. Power Syst. Res. 2023, 214, 9. [Google Scholar] [CrossRef]
- Segantini, R.; Alipio, R.; Paulino, J.O.S. Reliability of High-Frequency Earth Meters in Measuring Tower-Footing Resistance: Simulations and Experimental Validation. Energies 2025, 18, 1959. [Google Scholar] [CrossRef]
- Alipio, R.; Coelho, V.L.; Canever, G.L. Experimental analysis of horizontal grounding wires buried in high-resistivity soils subjected to impulse currents. Electr. Power Syst. Res. 2023, 214, 108761. [Google Scholar] [CrossRef]
- Mokhtari, M.; Abdul-Malek, Z.; Salam, Z. The effect of soil ionization on transient grounding electrode resistance in non-homogeneous soil conditions. Int. Trans. Electr. Energy Syst. 2016, 26, 1462–1475. [Google Scholar] [CrossRef]
- Gupta, B.; Thapar, B. Impulse Impedance of Grounding Grids. IEEE Trans. Power Appar. Syst. 1980, 99, 2357–2362. [Google Scholar] [CrossRef]
- Gao, Y.; He, J.; Chen, S.; Zou, J.; Zeng, R.; Lung, X.; PES, I. Lightning electromagnetic environments of substation considering soil ionization around grounding systems. In Proceedings of the International Conference on Power System Technology, Kunming, China, 13–17 October 2002; pp. 2096–2100. [Google Scholar]
- Mazzetti, C.; Veca, G. Impulse Behavior of Ground Electrodes. IEEE Trans. Power Appar. Syst. 1983, 102, 3148–3156. [Google Scholar] [CrossRef]
- Liu, Y.; Theethayi, N.; Thottappillil, R. An engineering model for transient analysis of grounding system under lightning strikes: Nonuniform transmission-line approach. IEEE Trans. Power Deliv. 2005, 20, 722–730. [Google Scholar] [CrossRef]
- Qi, L.; Cui, X.; Zhao, Z.; Li, H. Grounding performance analysis of the substation grounding grids by finite element method in frequency domain. IEEE Trans. Magn. 2007, 43, 1181–1184. [Google Scholar] [CrossRef]
- Stochniol, A. A General Transformation for Open Boundary Finite-Element Method for Electromagnetic Problems. IEEE Trans. Magn. 1992, 28, 1679–1681. [Google Scholar] [CrossRef]
- Habjanic, A.; Trlep, M. The simulation of the soil ionization phenomenon around the grounding system by the finite element method. IEEE Trans. Magn. 2006, 42, 867–870. [Google Scholar] [CrossRef]
- Dawalibi, F. Electromagnetic-Fields Generated by Overhead and Buried Short Conductors 2 Ground Networks. IEEE Trans. Power Deliv. 1986, 1, 112–119. [Google Scholar] [CrossRef]
- Dawalibi, F.; Selby, A.; Olsen, R. Electromagnetic-Fields of Energized Conductors. IEEE Trans. Power Deliv. 1993, 8, 1275–1284. [Google Scholar] [CrossRef]
- Dawalibi, F.; Xiong, W.; Ma, J. Transient Performance of Substation Structures and Associated Grounding Systems. IEEE Trans. Ind. Appl. 1995, 31, 520–527. [Google Scholar] [CrossRef]
- Xiong, W.; Dawalibi, F. Transient Performance of Substation Grounding Systems Subjected to Lightning and Similar Surge Currents. IEEE Trans. Power Deliv. 1994, 9, 1412–1420. [Google Scholar] [CrossRef]
- Hedman, D. Propagation on Overhead Transmission Lines 2 Earth-Conduction Effects and Practical Results. IEEE Trans. Power Appar. Syst. 1965, 84, 205–211. [Google Scholar] [CrossRef]
- Verma, R.; Mukhedkar, D. Impulse Impedance of Buried Ground Wire. IEEE Trans. Power Appar. Syst. 1980, 99, 2003–2007. [Google Scholar] [CrossRef]
- Verma, R.; Mukhedkar, D. Fundamental Considerations and Impulse Impedance of Grounding Grids. IEEE Trans. Power Appar. Syst. 1981, 100, 1023–1030. [Google Scholar] [CrossRef]
- Ramamoorty, M.; Narayanan, M.; Parameswaran, S.; Mukhedkar, D. Transient Performance of Grounding Grids. IEEE Trans. Power Deliv. 1989, 4, 2053–2059. [Google Scholar] [CrossRef]
- Ma, J.; Dawalibi, F. Modern computational methods for the design and analysis of power system grounding. In Proceedings of the 1998 International Conference on Power System Technology (Powercon 98), Beijing, China, 18–21 August 1998; pp. 122–126. [Google Scholar]
- Feng, Z.Q.; Zhang, Y.D.; Zhou, X.M.; Yao, Y.; Lu, H.L.; Li, Z.J.; Zhang, L.; Wang, X.K. Impulse characteristics of grounding devices considering soil ionization by the p-order time domain difference method. Electr. Power Syst. Res. 2025, 245, 7. [Google Scholar] [CrossRef]
- Dan, Y.H.; Zhang, R.X.; Wu, Y.Y.; Li, Y.Q.; Wang, X.M.; Yang, J. Tower impulse grounding resistance measurement based on multiple frequency impedance. IET Gener. Transm. Distrib. 2023, 17, 3488–3500. [Google Scholar] [CrossRef]
- Zhang, Y.; Cai, H.S.; Qi, R.H.; Hu, T.S.; Jia, L.; Liu, G.; Wu, Y.C.; Hu, S.M. Measurement and analysis of impulse grounding impedance of tower grounding device subjected to artificial lightning M-component. IET Gener. Transm. Distrib. 2023, 17, 209–218. [Google Scholar] [CrossRef]
- Huang, L.; Zhou, L.J.; Zhang, D.; Wang, D.Y.; Gu, W.F.; Chen, S.X. Research on impulse impedance model and protection optimization of transmission tower grounding device in mountainous area. IET Sci. Meas. Technol. 2021, 15, 632–644. [Google Scholar] [CrossRef]
Disclaimer/Publisher’s Note: The statements, opinions and data contained in all publications are solely those of the individual author(s) and contributor(s) and not of MDPI and/or the editor(s). MDPI and/or the editor(s) disclaim responsibility for any injury to people or property resulting from any ideas, methods, instructions or products referred to in the content. |
© 2026 by the authors. Licensee MDPI, Basel, Switzerland. This article is an open access article distributed under the terms and conditions of the Creative Commons Attribution (CC BY) license.