Abstract
Commercialization of natural gas hydrates still faces challenges. Before large-scale production becomes feasible, efficient exploitation methods must be continuously explored. Based on field data from China’s first trial production, a novel five-spot radial wells system design, combined with boundary sealing and wellbore heating, is proposed to improve production capacity. Simulation results indicate that boundary sealing can inhibit water invasion and concentrate energy, thereby promoting hydrate dissociation. The radial laterals significantly expand the drainage area and increase pressure propagation. Wellbore heating can accelerate the dissociation of hydrates while inhibiting secondary hydrate generation. The combined application of these technologies has significantly increased the cumulative gas production and gas-to-water ratio to 244.9% and 134.6% of the base case, respectively, providing theoretical references for the effective exploitation of Class 1 hydrate reservoirs.
1. Introduction
Natural gas hydrates (NGHs) are high-energy crystalline compounds formed by gas and water molecules under low-temperature, high-pressure environments [1,2,3,4]. They are widely found in oceans and permafrost zones, with estimated global reserves of approximately 1015–1018 m3 of CH4 [1,2,3,4]. As a clean and low-carbon unconventional energy source, they have great potential for development. According to Moridis et al., hydrate reservoirs can be classified into three types. Among them, Class 1 hydrate reservoirs consist of an upper hydrate layer (GHBL), a middle three-phase layer (TPL), and a lower free gas layer (FGL) and are currently the focus of research and trial production [5]. China successfully carried out NGH trial production in the Shenhu Sea area in 2017 and 2020, using vertical and horizontal wells, respectively [6,7]. Although horizontal well depressurization has increased the daily gas production to 2.87 × 10⁴ m3/d, there is still an order of magnitude gap compared to the commercial standard production [7,8].
At present, the combination of depressurization with one or more yield-increasing methods is generally considered the best way to increase natural gas production and achieve commercial exploitation. For example, complex structured wells, represented by horizontal wells, multilateral wells, and well-net, boost production by enlarging the drainage area [8,9]. Thermal stimulation, typified by hot water or steam injection, electromagnetic heating, and cable heating, etc., increases production by improving dissociation efficiency [8,9]. Reservoir stimulation, represented by hydraulic fracturing, high-pressure rotating water jets, network fracturing, and boundary sealing, increases production by changing seepage conditions [8,9]. Specifically, the principle of increasing production through boundary sealing is to seal the top and bottom of the reservoir, artificially construct traps in the vertical direction, enhance radial pressure propagation in the reservoir, and promote hydrate dissociation [8,9].
Studies show that cement, gel, polymer, nano particles, and other materials or technologies can be used for boundary sealing of NGH reservoirs, and there is an increasing amount of research on the combination of depressurization and boundary sealing to improve gas production in NGH reservoirs [10,11,12]. For example, Zhao et al. (2020) proposed to inject gel into the permeable layer to form an artificial barrier [13]. The simulation showed that gas production increased 137.2%, while water production decreased by 74.5% [13]. Wang et al. (2024) studied the effect of boundary sealing on the development of NGHs through a horizontal well combined with thermal injection [14]. Simulation results showed that boundary sealing inhibited water invasion, increased hydrate dissociation by 22.0~30.1%, and improved gas production efficiency by 63.9~85.1% [14]. Moreover, boundary sealing can be further combined with hydraulic fracturing to significantly increase production capacity. For example, Li et al. (2021) proposed a novel approach integrating hydraulic fracturing with sealing layers to boost gas production, and simulations showed that when sealing lengths exceed the fracturing radial length, this approach boosts gas production by 93.2% and reduces water production by 62.9% [15]. Guo et al. (2024) evaluated the yield-increasing effect of network fracturing under boundary sealing and confirmed that boundary sealing can prevent water invasion and improve pressure propagation, resulting in an increase of 11.1 times in gas production and 13.3 times in gas-to-water ratio [16]. However, most of the current research on increasing production through boundary sealing involves single vertical or horizontal wells, with few studies on complex structured wells such as well-net patterns [13,14,15,16,17,18,19].
The traditional five-spot well can significantly expand the drainage area and pressure propagation range through the synergistic depressurization of multiple vertical wells, improve production capacity, and have the potential for large-scale exploitation of NGHs [20]. Based on the traditional five-spot well, radial jet drilling (RJD) technology is introduced as an emerging method of increasing production, which drills multiple radial boreholes using high-pressure water jets, thereby significantly increasing the contact area and enhancing drainage capacity [21]. Therefore, this work established a 3D model of a novel five-spot radial wells system, and the synergistic effect of boundary sealing and wellbore heating in the development of Class 1 hydrate reservoirs is systematically evaluated. The results can provide new insights for the high-efficiency exploitation of Class 1 hydrate reservoirs.
2. Methodology
2.1. Geological Backround
The SHSC4 well is located in the South China Sea (Figure 1). The site features a water depth of 1266 m. The seabed temperature around 3.0 °C, and a geothermal gradient of 43.653 °C/km, provides favorable geological and thermodynamic conditions for the NGHs [6,22]. The reservoir can be subdivided into three distinct units based on physical properties and fluid composition: GHBL: Interval from 201 to 236 mbsf (meters below seafloor). This unit is characterized by high-saturation natural gas hydrate coexisting with pore water. TPL: Interval from 236 to 251 mbsf. This zone acts as a transition within the reservoir, coexisting with solid gas hydrate, high-saturation free gas, and pore water, demonstrating complex multi-phase equilibria. FGL: Interval from 251 to 278 mbsf. This unit is primarily composed of pore water and low-saturation free gas [6,22].
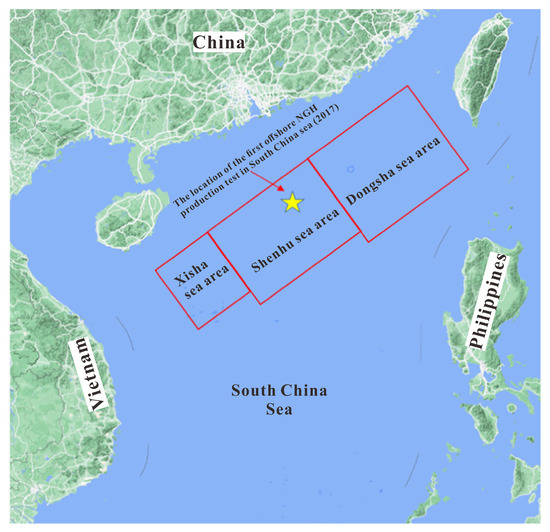
Figure 1.
SHSC4 well site (adapted from Hao et al., 2022. Copyright 2022 American Chemical Society) [23].
2.2. Simulation Code
TOUGH + HYDRATE V1.0 is a specialized numerical simulator for modeling NGH production prediction [24]. This code can effectively captures phase transitions and fluid migration during hydrate dissociation, offers comprehensive simulation capabilities, featuring robust multiphase-multicomponent support that accommodates four primary phases—aqueous (A), gas (G), hydrate (H), and ice (I)—along with multiple components including water (w), methane (m), salt (i), and hydrate (h).
In addition to depressurization, it can also simulate hydrate dissociation, such as thermal stimulation and inhibitor injection [24]. This code has been extensively validated against laboratory experiments and field tests [25,26]. The parallel version pT + H v1.0 addresses the computational limit of 50,000 grids in the TOUGH + HYDRATE V1.0, enabling large-scale field simulations [27]. This work employs the pT + H v1.0 and equilibrium model, and with the assumptions that Darcy’s law is valid, geological media remain undeformed, and sand production is controllable. The governing equations are given as follows [24,28]:
- 1.
- Mass Conservation Equation
- 2.
- Energy Conservation Equation:
2.3. Model and Cases Design
A 3D model was set up to systematically evaluate the impacts of boundary sealing, radial laterals, and wellbore heating on gas production (Figure 2a). The model spans 400 m in both the X and Y axes (ranging from −200 to 200 m, Figure 2b) and has a vertical extent (Z) of 137 m (Figure 2c). The discretization of the model domain was performed with a structured grid. The X-Y plane domain was discretized into 5329 grids and then extruded into 3D discretized grids along the z-axis, with a total of 527,571 grids. A local refinement strategy was adopted to enhance resolution in regions where physical properties undergo significant changes during gas production, which ensures accurate capture of changes in the physical properties of hydrate reservoirs.
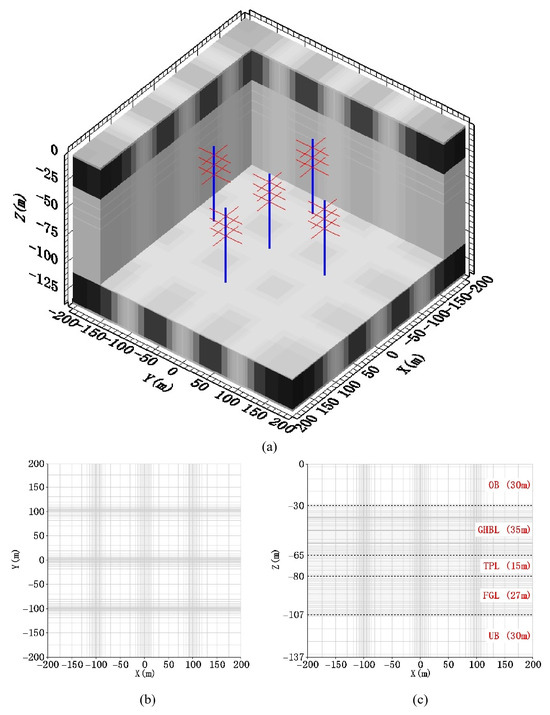
Figure 2.
Schematic of the model configuration: (a) five-spot radial wells system; (b) mesh discretization in the X-Y plane; (c) mesh discretization in the Y-Z plane.
Four simulation cases were established, as detailed in Table 1. Case 1 serves as the base case with no boundary sealing, radial laterals, or wellbore heating. Case 2 was configured to investigate the effect of boundary sealing. Case 3 was configured to investigate the combined effect of boundary sealing and radial laterals, with 12 radial laterals (each 30 m in length) located in the central part of the GHBL. Case 4 focuses on the influence of wellbore heating, maintaining the identical sealing and radial laterals settings as Case 3 while applying a heating power of 300 W/m.

Table 1.
Simulation cases.
2.4. Initial and Boundary Conditions
The pore-water pressure follows a hydrostatic pressure distribution, and it can be calculated using the empirical formula [29,30,31]:
Ppw = Patm + ρswg(H + Z) × 10−6
Within the formula, Ppw denotes porewater pressure (MPa), Patm standard atmospheric pressure (MPa), ρsw average seawater density (kg/m3), g gravitational acceleration (m/s2), H water depth (m), and Z sediment depth from the seabed (m). The initial equilibrium state of the model was obtained through the code’s self-balancing function, as shown in Figure 3 [32]. The model boundaries were set as the first type boundary [33]. The production well is treated as an internal boundary, and the well grids maintain a fixed pressure difference of 6.5 MPa.
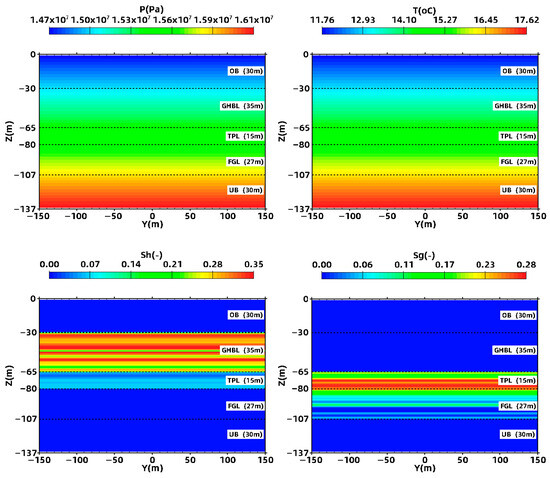
Figure 3.
Model’s initial conditions.
The multiphase flow adopted the van Genuchten capillary pressure model and the Stone relative permeability model. The specific parameters were as follows: for the capillary pressure model, the maximum reference water saturation SmxA was set to 1.0, the irreducible water saturation SirA was 0.30, the pore size distribution index λ was 0.45, and the initial capillary pressure P0 was 1 × 10⁴ Pa; for the relative permeability model, the irreducible water saturation SirA remained at 0.30, the irreducible gas saturation SirG was defined as 0.03, the water phase permeability reduction exponent nA was assigned a value of 3.5, and the gas phase permeability reduction exponent nG was set to 2.5. These parameters were based on previously validated research [34,35,36].
Table 2 specifies the physical properties of the model. The formation structure consists of a 30 m thick overburden (OB) and underburden (UB), a 35 m thick GHBL, a 15 m thick TPL, and a 27 m thick FGL. The permeabilities of the GHBL, TPL, and FGL were 2.9, 1.5, and 7.4 mD, respectively, with porosities of 0.35, 0.33, and 0.32. The permeability and porosity of the OB/UB were assumed to be 2.0 mD and 0.30, respectively [6]. Sealing layers with a thickness of 1 m and a permeability of 0.0001 mD were set at the top of the GHBL and the bottom of the FGL. The production well radius was 0.1 m, with a salinity of 3.5%. The initial hydrate saturation (GHBL, TPL) and free gas saturation (FGL) were derived from the logging curve. The grain density of the rock was 2600 kg/m3, and the geothermal gradient was 43.653 °C/km [6].
Table 2.
Basic physical properties for the model.
2.5. Model Validation
Gas production data from China’s first NGH trial production served to validate the numerical model. The model incorporates a vertical well that is positioned at the middle of the model, has a 70 m completion interval (−201 to −271 mbsf), with a constant pressure differential of 3 MPa [37]. As shown in Figure 4, the close agreement between the simulated and field data confirms the model’s reliability. Here, the model validation is based on historical trial production parameters. In order to fairly evaluate the production capacity of different simulation cases, a unified and larger production pressure difference of 6.5 MPa is used for comparative analysis.
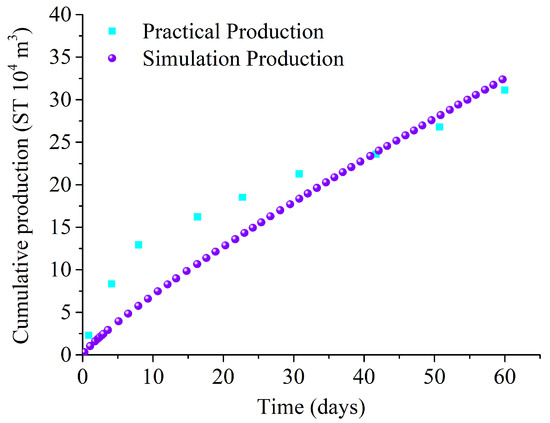
Figure 4.
Gas production history fitting.
3. Results and Discussion
3.1. Gas and Water Production
Figure 5a,b depict the evolution of gas production rate (Qg) and cumulative gas production (Vg) over 360 days for all cases with a production pressure difference of 6.5 MPa. Under the driving force of pressure difference, hydrates around the wellbore decompose rapidly, allowing large volumes of high-saturation free gas to flow into the wellbore in a short time. The gas production rate Qg of the four cases attained its maximum value during the initial stage, but showed different development trends in the subsequent evolution. In Cases 1 and 2, massive high-saturation free gas rapidly entered the TPL-located wellbore, and the strong Joule–Thomson effect induced the formation of secondary hydrates in the reservoir around TPL. As the bottom water gradually flowed into the wellbore, the driving force gradually weakened, and Qg showed a gradually decreasing trend in the later stage.
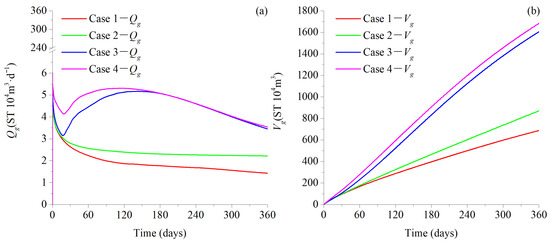
Figure 5.
Gas production performances over 360 days. (a) Evolution of gas production. (b) Evolution of cumulative gas.
However, due to the boundary sealing adopted in Case 2, its overall gas production rate is higher than that of Case 1. This is because the sealing boundary allows for a larger and more uniform distribution of wellbore pressure in the radial direction of the reservoir, and significantly reduces water invasion, allowing depressurization energy to concentrate on the hydrate layer, thereby accelerating the dissociation of hydrates and bringing more gas production.
Case 3 and Case 4 also use boundary sealing, and because of the presence of radial laterals, the Qg curves of Case 3 and Case 4 show a phenomenon of first decreasing and then increasing after reaching the peak in the initial stage (suddenly increasing around 20 days). After attaining their peak at around 120 days, they gradually weaken as a result of a weakened driving force. The sudden rise in gas production around 20 days is mainly due to the TPL free gas starting to arrive at and flow into the first group of radial laterals located at the bottom. In the initial 150 days, the Qg of Case 4 was higher than that of Case 1 because Case 4 used wellbore heating, which not only accelerated the dissociation of hydrates but also effectively prevented the generation of secondary hydrates in the reservoir adjacent to the TPL. After 150 days, the secondary hydrate in the TPL reservoir around Case 3 gradually decomposed under pressure difference, so the subsequent gas production curve tended to be consistent with Case 4.
When production reached 360 days, the Vg of the four cases were 687.1, 870.9, 1605.3, and 1683.2 × 104 ST m3, respectively. Compared with Case 1, Cases 2, 3, and 4 increased by 126.7%, 233.6%, and 244.9%, respectively. The simulation results show that using three techniques (boundary sealing, radial laterals, and wellbore heating) simultaneously in the five-spot well can greatly enhance the overall system productivity. The principle of increasing production is to seal the boundary so that the pressure around the wellbore has a larger and more uniform distribution in the radial direction of the reservoir. The radial laterals effectively increase the drainage area, especially greatly boosting free gas recovery. Wellbore heating accelerates the dissociation of surrounding hydrates and avoids secondary hydrate formation, thus ensuring the smooth inflow of free gas into the wellbore.
The evolution of water production rate (Qw) and gas-to-water ratio (Rgw) corresponding to gas production behavior over 360 days is shown in Figure 6a,b. The Qw of Case 1 shows a slow increasing trend overall as hydrates around the wellbore decompose and the invasion of upper and lower boundary water. Owing to the marked reduction of water invasion at the upper and lower boundaries induced by the sealed boundary, the water production rate of Case 2 shows an overall slow downward trend. The water production rates of Cases 3 and 4 were markedly higher than those of Cases 1 and 2 in the early stages, which is because the original water saturation was higher (about 66%) when radial laterals were placed in the GHBL; and the radial laterals greatly expand the contact area with the reservoir, forming a wide and uniform pressure propagation in the GHBL, promoting more extensive hydrate dissociation and producing more water. In the later stage, hydrate dissociation slows down as the pressure weakens, leading to a decreasing trend in Qw.
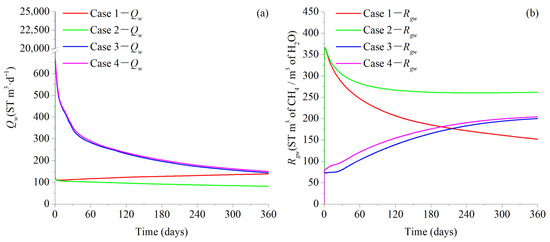
Figure 6.
Water production performances over 360 days. (a) Evolution of water production. (b) Evolution of gas-to-water ratio.
Rgw (ST m3 of CH4/ST m3 of water) is a key indicator for evaluating gas production efficiency, with higher Rgw indicating more economical. When production reached 360 days, the Rgw of the four cases were 151.6, 261.8, 200.1, and 204.2, respectively. Compared with Case 1, Cases 2, 3, and 4 increased by 172.6%, 131.9%, and 134.6%, respectively. Based on a comprehensive evaluation, Case 4 combines the advantages of multiple technologies such as boundary sealing, radial laterals, and wellbore heating, achieving more robust and sustainable efficient natural gas production.
3.2. Spatial Distribution of Reservoir Physical Parameters
3.2.1. Pore Pressure
The spatial distribution evolution of pore pressure in four cases over 360 days is shown in Figure 7. Clearly, the pore pressure distribution around the wellbore in four cases shows the characteristics of a large pressure gradient in the upper part of the wellbore and a small pressure gradient in the lower part. That is, the pressure gradient around the wellbore in GHBL is larger, while the pressure gradient around the wellbore in TPL and FGL is smaller. This is because solid hydrates in GHBL reduce initial permeability, leading to a larger pressure gradient, while gas expansion in the lower gas-bearing layer results in a smaller pressure gradient around TPL and FGL wellbores.
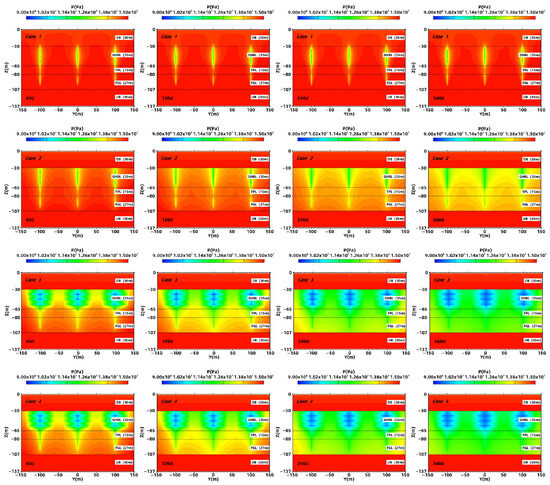
Figure 7.
Pore pressure within 360 days.
In addition, the reservoir around the central wellbore is observed to be most affected by the pressure drop of surrounding wellbores. The pressure superposition effect accelerates hydrate dissociation around the central GHBL wellbore. In contrast, the pressure superposition effect affects secondary hydrate formation around the central TPL wellbore, resulting in lower saturation. Therefore, compared to other wellbores, the pressure gradient at this location is smaller.
Compared with the boundary sealing cases, Case 1 exhibits a relatively small pressure drop distribution throughout the entire production process. The sealing layer in Cases 2, 3, and 4 effectively suppressed water invasion from the overlayer and underlayer, and the pressure drop energy was concentrated to drive hydrate dissociation, resulting in a larger pressure drop range. In addition, Cases 3 and 4 adopted a radial laterals approach to further expand the pressure drop range.
3.2.2. Reservoir Temperature
The spatial distribution evolution of reservoir temperature in four cases over 360 days is shown in Figure 8. It can be seen that Cases 1 and 2 formed a low-temperature area near the TPL wellbore reservoir, as a massive high-saturation free gas flowed into the wellbore from here, which resulted in the Joule–Thomson effect. Different from Cases 1 and 2, Cases 3 and 4 adopt radial laterals. The radial laterals expand the dissociation range of hydrates, thus forming a low-temperature area in the reservoir. The pressure superposition effect of the radial laterals located at the center is the strongest, leading to an expanded hydrate dissociation range (Figure 9) as well as a relatively larger low-temperature area. Over the entire production period, the dissociation of hydrates in the GHBL leads to a gradual expansion of the low-temperature area within the GHBL. Case 4 also adopts wellbore heating, which affects the reservoir area around the wellbore as production proceeds.
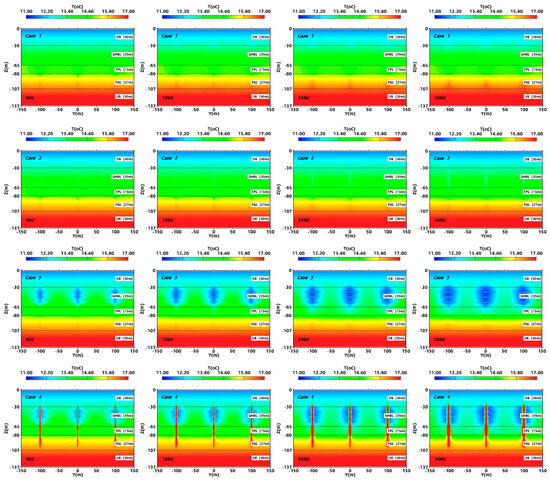
Figure 8.
Reservoir temperature within 360 days.
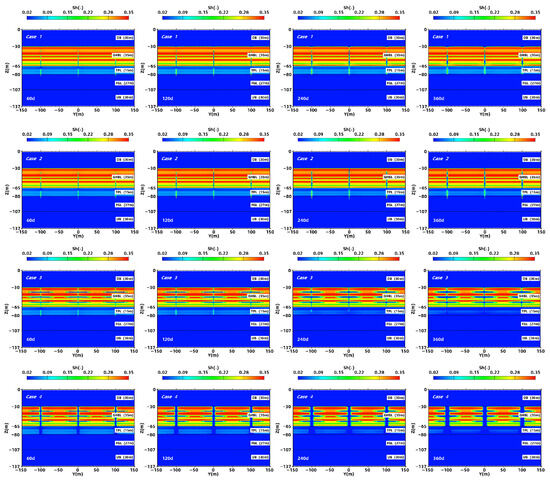
Figure 9.
Hydrate saturation within 360 days.
3.2.3. Hydrate Saturation
The spatial distribution evolution of hydrate saturation over 360 days for four cases is shown in Figure 9. It is observed that Cases 1, 2, and 3 formed secondary hydrates near the TPL wellbore reservoir. This is because a massive high-saturation free gas flowed into the wellbore from here, forming a Joule–Thomson effect. Moreover, due to the pressure superposition effect, secondary hydrate saturation formed around the central TPL wellbore is relatively low. In comparison with Case 1, Case 2 adopts boundary sealing to promote GHBL hydrate dissociation, resulting in a larger hydrate dissociation range around the upper wellbore simultaneously. Cases 3 and 4 adopt a lateral well design, so their hydrate dissociation range in GHBL is even larger. Case 4 assisted with wellbore heating, and its hydrate dissociation range in GHBL is the largest. As production proceeds, the hydrate dissociation range gradually expands across the four cases.
3.2.4. Gas Saturation
The spatial distribution evolution of gas saturation in four cases over 360 days is shown in Figure 10. In Cases 1 and 2, under the traction of the upper pressure difference, free gas in the TPL exhibits conical migration toward the upper wellbore. Hydrate dissociation around the upper wellbore also forms a low-saturation gas accumulation zone near the wellbore. Moreover, as production progresses, the range of conical free gas and the low saturation gas accumulation zone around the wellbore also become larger; Compared to Case 1, due to the adopt of boundary sealing in Case 2, the range of cone-shaped free gas migrating upwards at the same time is larger, the hydrate dissociation degree around the upper wellbore is higher, and the low saturation gas accumulation area formed around the wellbore is also larger.
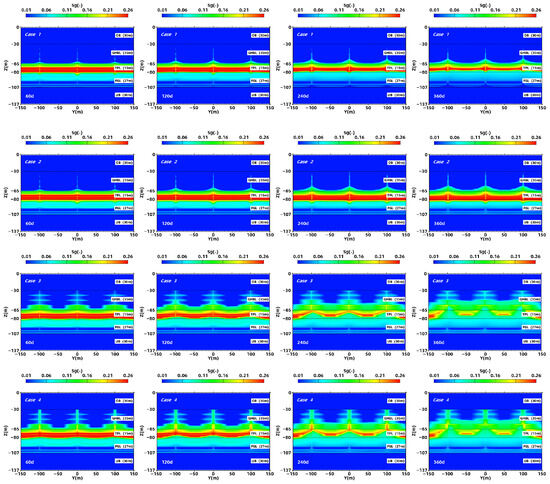
Figure 10.
Gas saturation within 360 days.
In addition to boundary sealing, Cases 3 and 4 also adopted a lateral well design. The radial laterals formed a wider and uniform pressure propagation in the GHBL, which not only accelerated the dissociation of hydrates around the laterals’ wellbore but also pulled the free gas in the TPL to migrate towards the upper wellbore. Moreover, as production progressed, the range of free gas in the square pyramid shape and the low saturation gas accumulation area around the wellbore also became larger. Compared to Case 3, Case 4 additionally adopts wellbore heating, resulting in a higher hydrate dissociation degree and a larger range around the main wellbore, as well as a larger low-saturation gas accumulation area there.
3.3. Implications and Future Recommendations
Although simulation results indicate that this method has the potential to improve production, its practical application still faces a series of technical and economic challenges. These factors include the difficulty of implementing precise boundary sealing and long-term sealing integrity in the target formation, wellbore stability and sand control during radial drilling of hydrate reservoirs, as well as energy consumption and reliability of wellbore heating systems. Its economic feasibility depends on striking a balance between construction costs, long-term maintenance, and additional natural gas recovery and shortened production cycles. In addition, this study was conducted using a fixed set of parameters, such as sealing layer properties, radial laterals layout, and heating power. Therefore, in order to implement this method on site, future work should combine detailed engineering design with systematic parameter sensitivity analysis and comprehensive cost-benefit evaluation. These studies will help optimize the technology configuration and clarify the commercial application threshold of this method. Moreover, data-driven approaches (e.g., machine learning techniques like Random Forest [38]) could be integrated with simulations to further enhance production forecasting accuracy and operational optimization.
4. Conclusions
Based on China’s first NGH trial production data, numerical simulation was employed to conduct a systematic analysis of the synergistic effect of boundary sealing, radial laterals, and wellbore heating on the depressurization development of Class 1 NGH reservoirs via a novel five-spot radial wells system. This research provides a theoretical basis for the development of Class 1 NGH reservoirs. The insights obtained from this study can be summarized as follows:
Compared with the traditional five-spot well depressurization, adopting a comprehensive development strategy that combines boundary sealing, radial laterals, and wellbore heating can significantly improve the recovery rate of Class 1 NGHs. In this work, when setting the sealing layers with a permeability of 0.001 mD and a thickness of 1 m, three sets of radial laterals (each set has four radial laterals, each with a length of 30 m) were uniformly arranged in the GHBL. Combined with a wellbore heating power of 300 W/m, the Vg and Rgw increased to 244.9% and 134.6%, respectively, compared with the base case. The low-permeability sealing layers allow for a wider and more uniform distribution of pressure in the radial direction of the reservoir, effectively suppressing water production and concentrating pressure energy to drive NGH dissociation and free gas recovery. The existence of radial laterals greatly increases the contact area with GHBL, forming a wider and uniform pressure drop, accelerating the dissociation of hydrates around the laterals, and widely pulling free gas migrate upward. Wellbore heating expands the hydrate dissociation front, accelerates dissociation, inhibits secondary hydrate formation, and ensures the smooth flow of free gas. The comprehensive use of the above methods can efficiently promote the more complete and uniform dissociation of Class 1 NGH reservoirs.
Author Contributions
J.W. (Jingli Wang): Conceptualization, Methodology, Software, Writing—Original Draft. Z.S.: Formal analysis, Investigation, Funding acquisition. Z.L.: Resources, Software. J.W. (Jianwen Wu): Data curation, Visualization. T.W.: Writing—review and editing, Supervision, Project administration. All authors have read and agreed to the published version of the manuscript.
Funding
This research was supported by the National Natural Science Foundation of China (42576254), Guangdong MEPP Fund (No. GDOE [2019]A39).
Data Availability Statement
The original contributions presented in this study are included in the article. Further inquiries can be directed to the corresponding authors.
Conflicts of Interest
The authors declare that they do not have any commercial of associative interest that represents conflicts of interest in connection with the submitted work.
References
- Sloan, E. Fundamental principles and applications of natural gas hydrates. Nature 2003, 426, 353–359. [Google Scholar] [CrossRef] [PubMed]
- Boswell, R. Is gas hydrate energy within reach? Science 2009, 325, 957–958. [Google Scholar] [CrossRef] [PubMed]
- Chong, Z.; Yang, S.; Babu, P.; Linga, P.; Li, X. Review of natural gas hydrates as an energy resource: Prospects and challenges. Appl. Energy 2016, 162, 1633–1652. [Google Scholar] [CrossRef]
- Boswell, R.; Collett, T.S. Current perspectives on gas hydrate resources. Energy Environ. Sci. 2011, 4, 1206–1215. [Google Scholar] [CrossRef]
- Moridis, G.; Collett, T.; Pooladi-Darvish, M.; Hancock, S.; Santamarina, C.; Boswell, R.; Kneafsey, T.; Rutqvist, J.; Kowalsky, M.; Reagan, M.; et al. Challenges, uncertainties, and issues facing gas production from gas-hydrate deposits. SPE Reserv. Eval. Eng. 2011, 14, 76–112. [Google Scholar] [CrossRef]
- Li, J.; Ye, J.; Qin, X.; Qiu, H.; Wu, N.; Lu, H.; Xie, W.; Lu, J.; Peng, F.; Xu, Z.; et al. The first offshore natural gas hydrate production test in South China Sea. China Geol. 2018, 1, 5–16. [Google Scholar] [CrossRef]
- Ye, J.; Qin, X.; Xie, W.; Lu, H.; Ma, B.; Qiu, H.; Liang, J.; Lu, J.; Kuang, Z.; Lu, C.; et al. The second natural gas hydrate production test in the South China Sea. China Geol. 2020, 3, 197–209. [Google Scholar] [CrossRef]
- Wu, N.; Li, Y.; Wan, Y.; Sun, J.; Huang, L.; Mao, P. Prospect of marine natural gas hydrate stimulation theory and technology system. Nat. Gas Ind. B 2021, 40, 173–187. [Google Scholar] [CrossRef]
- Huang, M.; Wu, L.; Ning, F.; Wang, J.; Dou, X.; Zhang, L.; Liu, T.; Jiang, G. Research progress in natural gas hydrate reservoir stimulation. Nat. Gas Ind. B 2023, 10, 114–129. [Google Scholar] [CrossRef]
- Zhu, D.; Peng, S.; Zhao, S.; Wei, M.; Bai, B. Comprehensive review of sealant materials for leakage remediation technology in geological CO2 capture and storage process. Energy Fuels 2021, 35, 4711–4742. [Google Scholar] [CrossRef]
- Sun, Y.; Cao, B.; Zhong, J.; Kan, J.; Li, R.; Niu, J.; Chen, H.; Chen, G.; Wu, G.; Sun, C.; et al. Gas production from unsealed hydrate-bearing sediments after reservoir reformation in a large-scale simulator. Fuel 2022, 308, 121957. [Google Scholar] [CrossRef]
- Sun, Z.; Li, N.; Jia, S.; Cui, J.; Yuan, Q.; Sun, C.; Chen, G. A novel method to enhance methane hydrate exploitation efficiency via forming impermeable overlying CO2 hydrate cap. Appl. Energy 2019, 240, 842–850. [Google Scholar] [CrossRef]
- Zhao, E.; Hou, J.; Liu, Y.; Ji, Y.; Liu, W.; Lu, N.; Bai, Y. Enhanced gas production by forming artificial impermeable barriers from unconfined hydrate deposits in Shenhu area of South China sea. Energy 2020, 213, 118826. [Google Scholar] [CrossRef]
- Wang, Y.; Zeng, Y.; Zhong, X.; Pan, D.; Chen, C. Investigation into the Effect of Permeable Boundary Sealing on the Behavior of Hydrate Exploitation via Depressurization Combined with Heat Injection. Energies 2024, 17, 5172. [Google Scholar] [CrossRef]
- Li, S.; Wu, D.; Wang, X.; Hao, Y. Enhanced gas production from marine hydrate reservoirs by hydraulic fracturing assisted with sealing burdens. Energy 2021, 232, 120889. [Google Scholar] [CrossRef]
- Guo, W.; Zhong, X.; Chen, C.; Zhang, P.; Liu, Z.; Wang, Y.; Tu, G. Stimulation effect of network fracturing combined with sealing boundaries on the depressurization development of hydrate reservoir. Energy 2024, 302, 131752. [Google Scholar] [CrossRef]
- Lv, T.; Pan, J.; Cai, J.; Li, R.; Shen, P. Adaptability of artificial barrier to depressurization production of marine stratified gas hydrate reservoir. Nat. Gas Ind. 2022, 42, 132–140. [Google Scholar] [CrossRef]
- Nie, S.; Liu, K.; Xu, K.; Zhong, X.; Tang, S.; Song, J.; Zhang, H.; Li, J.; Wang, Y. Numerical study on the stimulation effect of boundary sealing and hot water injection in marine challenging gas hydrate extraction. Sci. Rep. 2024, 14, 15280. [Google Scholar] [CrossRef]
- Qin, F.; Sun, J.; Cao, X.; Mao, P.; Zhang, L.; Lei, G.; Jiang, G.; Ning, F. Numerical simulation on combined production of hydrate and free gas from silty clay reservoir in the South China Sea by depressurization: Formation sealing. Appl. Energy 2025, 377, 124343. [Google Scholar] [CrossRef]
- Gu, Y.; Li, S.; Song, Z.; Lu, H.; Xu, C.; Sun, J.; Wang, Y.; Li, X.; Linga, P.; Yin, Z. Analysis on a five-spot well for enhancing energy recovery from silty natural gas hydrate deposits in the South China Sea. Appl. Energy 2024, 376, 124237. [Google Scholar] [CrossRef]
- Wan, T.; Yu, M.; Lu, H.; Chen, Z.; Li, Z.; Tian, L.; Wang, J. Numerical Simulation of Vertical Well Depressurization with Different Deployments of Radial Laterals in Class 1-Type Hydrate Reservoir. Energies 2024, 17, 1139. [Google Scholar] [CrossRef]
- Zhang, W.; Liang, J.; Lu, J.; Wei, J.; Su, P.; Fang, Y.; Guo, Y.; Yang, S.; Zang, G. Accumulation features and mechanisms of high saturation natural gas hydrate in Shenhu area, northern South China sea. Pet. Explor. Dev. 2017, 44, 708–719. [Google Scholar] [CrossRef]
- Hao, Y.; Yang, F.; Wang, J.; Fan, M.; Li, S.; Yang, S.; Wang, C.; Xiao, X. Dynamic analysis of exploitation of different types of multilateral wells of a hydrate reservoir in the South China sea. Energy Fuels 2022, 36, 6083–6095. [Google Scholar] [CrossRef]
- Moridis, G.; Kowalsky, M.; Pruess, K. TOUGH + Hydrate V1.0 User’s Manual; Report LBNL-0149E.; Lawrence Berkeley National Laboratory: Berkeley, CA, USA, 2008. [Google Scholar] [CrossRef]
- Su, Z.; Moridis, G.; Zhang, K.; Wu, N. A huff-and-puff production of gas hydrate deposits in Shenhu area of South China Sea through a vertical well. J. Pet. Sci. Eng. 2012, 86–87, 54–61. [Google Scholar] [CrossRef]
- Yin, Z.; Moridis, G.; Chong, Z.; Linga, P. Effectiveness of multi-stage cooling processes in improving the CH4-hydrate saturation uniformity in sandy laboratory samples. Appl. Energy 2019, 250, 729–747. [Google Scholar] [CrossRef]
- Zhang, K.; Moridis, G.; Wu, Y.; Pruess, K. A domain decomposition approach for large-scale simulations of flow processes in hydrate-bearing geologic media. In Proceedings of the 6th International Conference on Gas Hydrates, Vancouver, BC, Canada, 6–10 July 2008; ICGH: Vancouver, BC, Canada, 2009. [Google Scholar]
- Kowalsky, M.; Moridis, G. Comparison of kinetic and equilibrium reaction models in simulating gas hydrate behavior in porous media. Energy Convers. Manag. 2007, 48, 1850–1863. [Google Scholar] [CrossRef]
- Yu, T.; Guan, G.; Wang, D.; Song, Y.; Abudula, A. Numerical investigation on the long-term gas production behavior at the 2017 Shenhu methane hydrate production-site. Appl. Energy 2021, 285, 116466. [Google Scholar] [CrossRef]
- Sun, J.; Zhang, L.; Ning, F.; Lei, H.; Liu, T.; Hu, G.; Lu, H.; Lu, J.; Liu, C.; Jiang, G.; et al. Production potential and stability of hydrate-bearing sediments at the site GMGS3-W19 in the South China Sea: A preliminary feasibility study. Mar. Pet. Geol. 2017, 86, 447–473. [Google Scholar] [CrossRef]
- Yuan, Y.; Xu, T.; Xin, X.; Xia, Y. Multiphase Flow Behavior of Layered Methane Hydrate Reservoir Induced by Gas Production. Geofluids 2017, 2017, 7851031. [Google Scholar] [CrossRef]
- Sun, J.; Ning, F.; Li, S.; Zhang, K.; Liu, T.; Zhang, L.; Jiang, G.; Wu, N. Numerical simulation of gas production from hydrate-bearing sediments in the Shenhu area by depressurising: The effect of burden permeability. J. Unconv. Oil Gas Resour. 2015, 12, 23–33. [Google Scholar] [CrossRef]
- Feng, Y.; Chen, L.; Suzuki, A.; Kogawa, T.; Okajima, J.; Komiya, A.; Maruyama, S. Enhancement of gas production from methane hydrate reservoirs by the combination of hydraulic fracturing and depressurization method. Energy Convers. Manag. 2019, 184, 194–204. [Google Scholar] [CrossRef]
- Sun, Y.; Ma, X.; Guo, W.; Jia, R.; Li, B. Numerical simulation of the short- and long-term production behavior of the first offshore gas hydrate production test in the South China Sea. J. Pet. Sci. Eng. 2019, 181, 106196. [Google Scholar] [CrossRef]
- Ma, X.; Sun, Y.; Liu, B.; Guo, W.; Jia, R.; Li, B.; Li, S. Numerical study of depressurization and hot water injection for gas hydrate production in China’s first offshore test site. J. Nat. Gas Sci. Eng. 2020, 83, 103530. [Google Scholar] [CrossRef]
- Cao, X.; Sun, J.; Qin, F.; Ning, F.; Mao, P.; Gu, Y.; Li, Y.; Zhang, H.; Yu, Y.; Wu, N. Numerical analysis on gas production performance by using a multilateral well system at the first offshore hydrate production test site in the Shenhu area. Energy 2023, 270, 126690. [Google Scholar] [CrossRef]
- Qin, X.; Liang, Q.; Yang, L.; Qiu, H.; Xie, W.; Liang, J.; Lu, J.; Lu, C.; Lu, H.; Ma, B.; et al. The response of temperature and pressure of hydrate reservoirs in the first gas hydrate production test in South China Sea. Appl. Energy 2020, 278, 115649. [Google Scholar] [CrossRef]
- Ilyushin, Y.V.; Nosova, V.A. Development of Mathematical Model for Forecasting the Production Rate. Int. J. Eng. 2025, 38, 1749–1757. [Google Scholar] [CrossRef]


Disclaimer/Publisher’s Note: The statements, opinions and data contained in all publications are solely those of the individual author(s) and contributor(s) and not of MDPI and/or the editor(s). MDPI and/or the editor(s) disclaim responsibility for any injury to people or property resulting from any ideas, methods, instructions or products referred to in the content. |
© 2026 by the authors. Licensee MDPI, Basel, Switzerland. This article is an open access article distributed under the terms and conditions of the Creative Commons Attribution (CC BY) license.