Abstract
The large-scale integration of distributed photovoltaic power generation leads to increasingly scarce inertia carriers in new power systems. To prevent the frequency of the low-inertia system from dropping too quickly during faults, more extensive inertia response resources need to be urgently explored. Considering that photovoltaic arrays do not have mechanical rotors, it is necessary to configure energy storage with VSM control for photovoltaic power generation units to give them the ability to actively support frequency. Thus, from the perspective of inertia carriers, the contribution of each power generation unit to the stability of the system frequency is quantified, and an equivalent inertia assessment method is proposed for high-penetration distributed photovoltaic power generation connected to the grid considering virtual inertia transformation. Finally, simulation verification is carried out based on the DIgSILENT/Power Factory platform. This research shows that the equivalent inertia assessment method proposed in this paper can effectively reflect the overall inertia level and inertia distribution trend of the system.
1. Introduction
In the context of the continuous depletion of fossil energy and increasingly severe environmental pollution, determining how to transition from traditional energy to renewable and low-carbon energy is a key issue concerning the sustainability of China’s development [1,2,3,4,5]. Since the Chinese government proposed the long-term goals of “carbon peak by 2030” and “carbon neutrality by 2060”, China has made remarkable achievements in energy transformation. From 2020 to 2024, the total installed capacity of distributed photovoltaic power generation increased from 781.5 million to 375,000 million kilowatts, with an average annual increase of over 740 million kilowatts and an average annual growth rate of approximately 48%. In the foreseeable future, distributed photovoltaic power generation will continue to maintain a high growth trend. On one hand, this is in line with current development needs; on the other, as the installed capacity of energy provided by DERs (distributed energy resources) increases, a large number of power electronic devices will be used in the grid connection process, and the problem of low inertia and weak support in the new power system will become more prominent [6,7,8].
To alleviate the problem of insufficient inertia caused by the large-scale grid connection of asynchronous power sources, droop control and, Virtual Synchronous Machine (VSM) control, which are typical virtual inertia technologies, have emerged [9,10,11]. Droop control simulates the active power–frequency droop characteristics of traditional synchronous generators to achieve the supporting effect on grid frequency, while VSM control further simulates the rotor motion equations of synchronous generators [12], including inertia and damping characteristics, and is more similar to synchronous generators in dynamic behavior. The application of virtual inertia technology overcomes the limitation of traditional power systems where inertia carriers are synchronous machine rotors, and further expands the energy source of inertia response to various energy storage devices [13]. It can significantly improve the inertia level of energy provided by DER systems [14]. At the same time, the setting of virtual inertia should ensure that the overall inertia level of the system meets the actual inertia demand under the impact of active power, and if not, there may be a risk of instability under disturbances [15,16]. Therefore, the research on the assessment method of equivalent inertia of the energy provided by DER power generation systems is of great significance for ensuring the safe and stable operation of the power grid.
The current mainstream assessment methods for the active power support capacity of new grid-forming energy power stations mainly focus on three dimensions: state attributes (power/energy reserves), control characteristics (equivalent parameters), and support effects (frequency regulation effect or support power/energy).
- (1)
- The state attributes of a new energy power station refer to its own power/energy reserves, including mechanical energy, electromagnetic energy, electrochemical energy, and power reserves reserved through load shedding, among other forms [17,18]. On one hand, the power reserve of a new energy power station can be obtained by subtracting the theoretical power generation from the actual power generation under the current resource conditions: The authors of [19] proposed a theoretical power calculation method for wind farms based on cluster division and the Leonjef inverse matrix, which eliminates the multicollinearity of the cluster by using the Leonjef inverse matrix and establishes a non-parametric kernel regression wind speed–power fitting model to improve the calculation accuracy. The authors of [20] proposed a theoretical power calculation method for photovoltaic power stations based on data-driven methods, selecting inverters with high feature correlation as sample inverters and using linear regression and random forest to establish a prediction model, which can significantly improve the prediction accuracy. The authors of [21] proposed a theoretical power calculation method for wind farms based on non-parametric regression, correcting the power for periods without wind speed or with abnormal wind speed using the correlation coefficient weighting method, which can effectively fit the actual power curve of the wind turbines. On the other hand, the energy reserve of a new energy power station is mainly carried out by energy storage: The authors of [22] used the recursive least squares method with the forgetting factor and the unscented Kalman filter algorithm in combination to achieve online evaluation of the SOC of energy storage batteries, and this method has good accuracy and convergence under different initial SOC conditions. The authors of [23] quantitatively evaluate the inertia support potential of energy storage by establishing a relationship function between the output power of energy storage and SOC within the rise and fall time of frequency safety. The authors of [24], when predicting the SOC of lithium-ion batteries in energy storage, combined PSO with a Convolutional Neural Network (CNN) to effectively improve the model’s prediction accuracy and generalization ability.
- (2)
- The control characteristics of a new energy power station refer to its active power–frequency dynamic response characteristics, which can be characterized by equivalent inertia constants, droop coefficients, etc. [25]. The authors of [26] applied a recursive algorithm to calculate the equivalent inertia constant of the power system, which has a higher identification accuracy and calculation speed compared to non-recursive algorithms, and has good applicability in systems with a large number of nodes and complex structures. The authors of [27] proposed an online estimation method for grid-equivalent inertia based on the augmented recursive least squares method, which can maintain evaluation accuracy even in the case of insignificant external disturbances. The authors of [28] used the Tikhonov regularization algorithm to evaluate the equivalent inertia constant of aggregated power sources, which has a strong suppression ability for the measurement noise of a Phasor Measurement Unit (PMU), and can maintain evaluation accuracy even under extreme measurement noise conditions. The authors of [29] proposed a method for evaluating the equivalent inertia of power systems based on quasi-steady-state data, which uses the Akaike Information Criterion (AIC) to determine the order of the Auto-Regressive Moving Average with Extra Input (ARMAX) model. This method can solve the overfitting problem and has a higher identification accuracy than the traditional algorithm based on the Auto-Regressive Moving Average (ARMA) model. The authors of [30] applied the Adaptive Extended Kalman Filtering (AEKF) algorithm to identify the control parameters of the Doubly Fed Induction Generator (DFIG) of wind power, with fast convergence speed, strong anti-interference ability, and high calculation accuracy. The authors of [31] proposed a multi-algorithm hybrid neural network model based on modal decomposition and feature fusion, using different components of different seasons to model and train data for each season separately. Compared with traditional algorithms that do not consider seasonal changes, this method has a higher prediction accuracy. The authors of [32] considered the spatial distribution characteristics of inertia, used the spectral clustering algorithm to partition the power system, and defined the regional node frequency similarity index to determine the frequency measurement nodes of each region. This method has high evaluation accuracy and requires a small amount of measured data. The authors of [33] calculated the equivalent inertia of the regional power grid by accumulating the inertia of online generators and motors on both sides of the source and load, and introduced the regression fitting coefficient of historical data to represent the influence of the proportion of new energy generation. This significantly improved the calculation speed.
- (3)
- The supporting effect of new energy stations refers to the improvement effect on the frequency characteristics of the power grid or the level of power/energy provided during the frequency support stage [34]. Commonly used indicators to characterize this include the rate of change of frequency (ROCOF), maximum frequency deviation, and steady-state frequency deviation. The authors of [35] identified the inertia of the system using the ROCOF during the inertia response stage. The authors of [36] referred to the rotor motion equation of the synchronous machine, based on the electrical network structure and PMU measurement data; established the equivalent rotor motion equation of the power system; and derived the relationship function between the system inertia and ROCOF. The authors of [37] analyzed the influence of the proportion of new energy stations participating in frequency regulation on the frequency response characteristics of the power system based on the mapping relationship between the ROCOF, the lowest frequency point, and the system’s rotor kinetic energy. The experimental results in [38] show that, under the constraint condition of the maximum initial ROCOF, the minimum inertia requirement of the system is proportional to the maximum power disturbance it encounters. Therefore, by reducing the maximum power disturbance, the minimum inertia requirement can be reduced.
The method used in this study belongs to the second category, and such methods are applicable to systems with virtual inertia transformation and can be used to obtain data relatively easily, thus being widely promoted [39,40].
This study reasonably constructs the operation architecture of high-penetration distributed photovoltaic power generation connected to the power grid. Considering that photovoltaic arrays do not have mechanical rotors, photovoltaic power generation units are equipped with VSM control-enabled energy storage to enable them to have active frequency support capabilities. When assessing the equivalent inertia of the system, from the perspective of inertia carriers, in addition to the traditional rotors of synchronous generators, energy storage photovoltaic power stations are also considered. On this basis, a method for evaluating the equivalent inertia of high-penetration distributed photovoltaic power generation connected to the power grid considering virtual inertia transformation is proposed. Finally, simulation verification is carried out through the DIgSILENT/Power Factory platform.
2. Carriers of Power System Inertia
Power system inertia refers to the ability of the power grid to maintain its frequency stability with the help of various types of energy, including kinetic, potential, and electrochemical energy, when subjected to active power disturbances. These energies, which can be mobilized by the power grid and used to suppress frequency fluctuations, are usually stored in mechanical rotors or in various types of energy storage.
2.1. Conventional Power System
In a conventional power system, synchronous generators are the main producers of electrical energy and the main carriers of inertia. The rotor speed of the synchronous generator is coupled to power grid frequency, and the rotor will decelerate once the power grid frequency drops due to a shortage of active power, but this process cannot be performed instantaneously, due to the presence of inertia in the mechanical rotor, which enables the synchronous generator to maintain a high level of electromagnetic power output over a certain time scale, thus effectively slowing down the frequency drop. This ability to suppress frequency fluctuations is still applicable in scenarios where there is excess active power.
The rotor of a synchronous generator always follows the swing equation (damping has been neglected) during start-up and operation, as shown in Equation (1):
where is the rotational inertia; is the mechanical angular velocity; is time; is the mechanical moment; is the electromagnetic moment; and is the acceleration moment. Mechanical and electromagnetic moments are no longer balanced when subjected to active power perturbations, and the net moment remaining after the two are canceled out determines whether the rotor is accelerated or decelerated. In the case of a certain accelerating moment, the value of rotational inertia will directly determine the change rate of rotor speed, which ultimately manifests itself as the degree of suppression of frequency fluctuations.
The level of inertia of a synchronous generator is then commonly described by rotational inertia or rotor kinetic energy, and the length of time that a synchronous generator can continue to operate at its rated power after the primary energy source has disappeared is defined as the inertia constant, which, compared to the first two, takes into account the installed capacity and has a uniform significance when it comes to quantifying the contribution that the different units make to the frequency stability of the system. The following relationship exists between the rotational inertia, rotor kinetic energy, and inertia constant:
where is the rotor kinetic energy; is the inertia constant; is the rotor kinetic energy at the rated speed; and is the rated capacity.
2.2. New Power System
The new power system incorporating distributed photovoltaic power generation, on one hand, strongly relies on power electronic equipment in the grid connection process to achieve maximum power point tracking, resulting in the decoupling of its output power from the grid frequency and the inability to actively provide frequency support; on the other hand, since photovoltaic arrays have no mechanical rotor and no mechanical inertia, the inertia carrier of the system has become increasingly scarce as synchronous generators have been largely replaced.
To address the issues of low inertia and weak support in the new power system, the concept of virtual inertia was proposed. Virtual inertia establishes a coupling relationship with the grid frequency through certain control strategies, and is supplemented by rapid response equipment as the energy source during the frequency response process. As a result, the inertia carrier of the new power system has evolved from a single mechanical rotor to a diverse range of energy storage devices.
3. Operation Architecture and Control Scheme for Distributed Photovoltaic Power Generation Connected to Power Grid
3.1. Operation Architecture
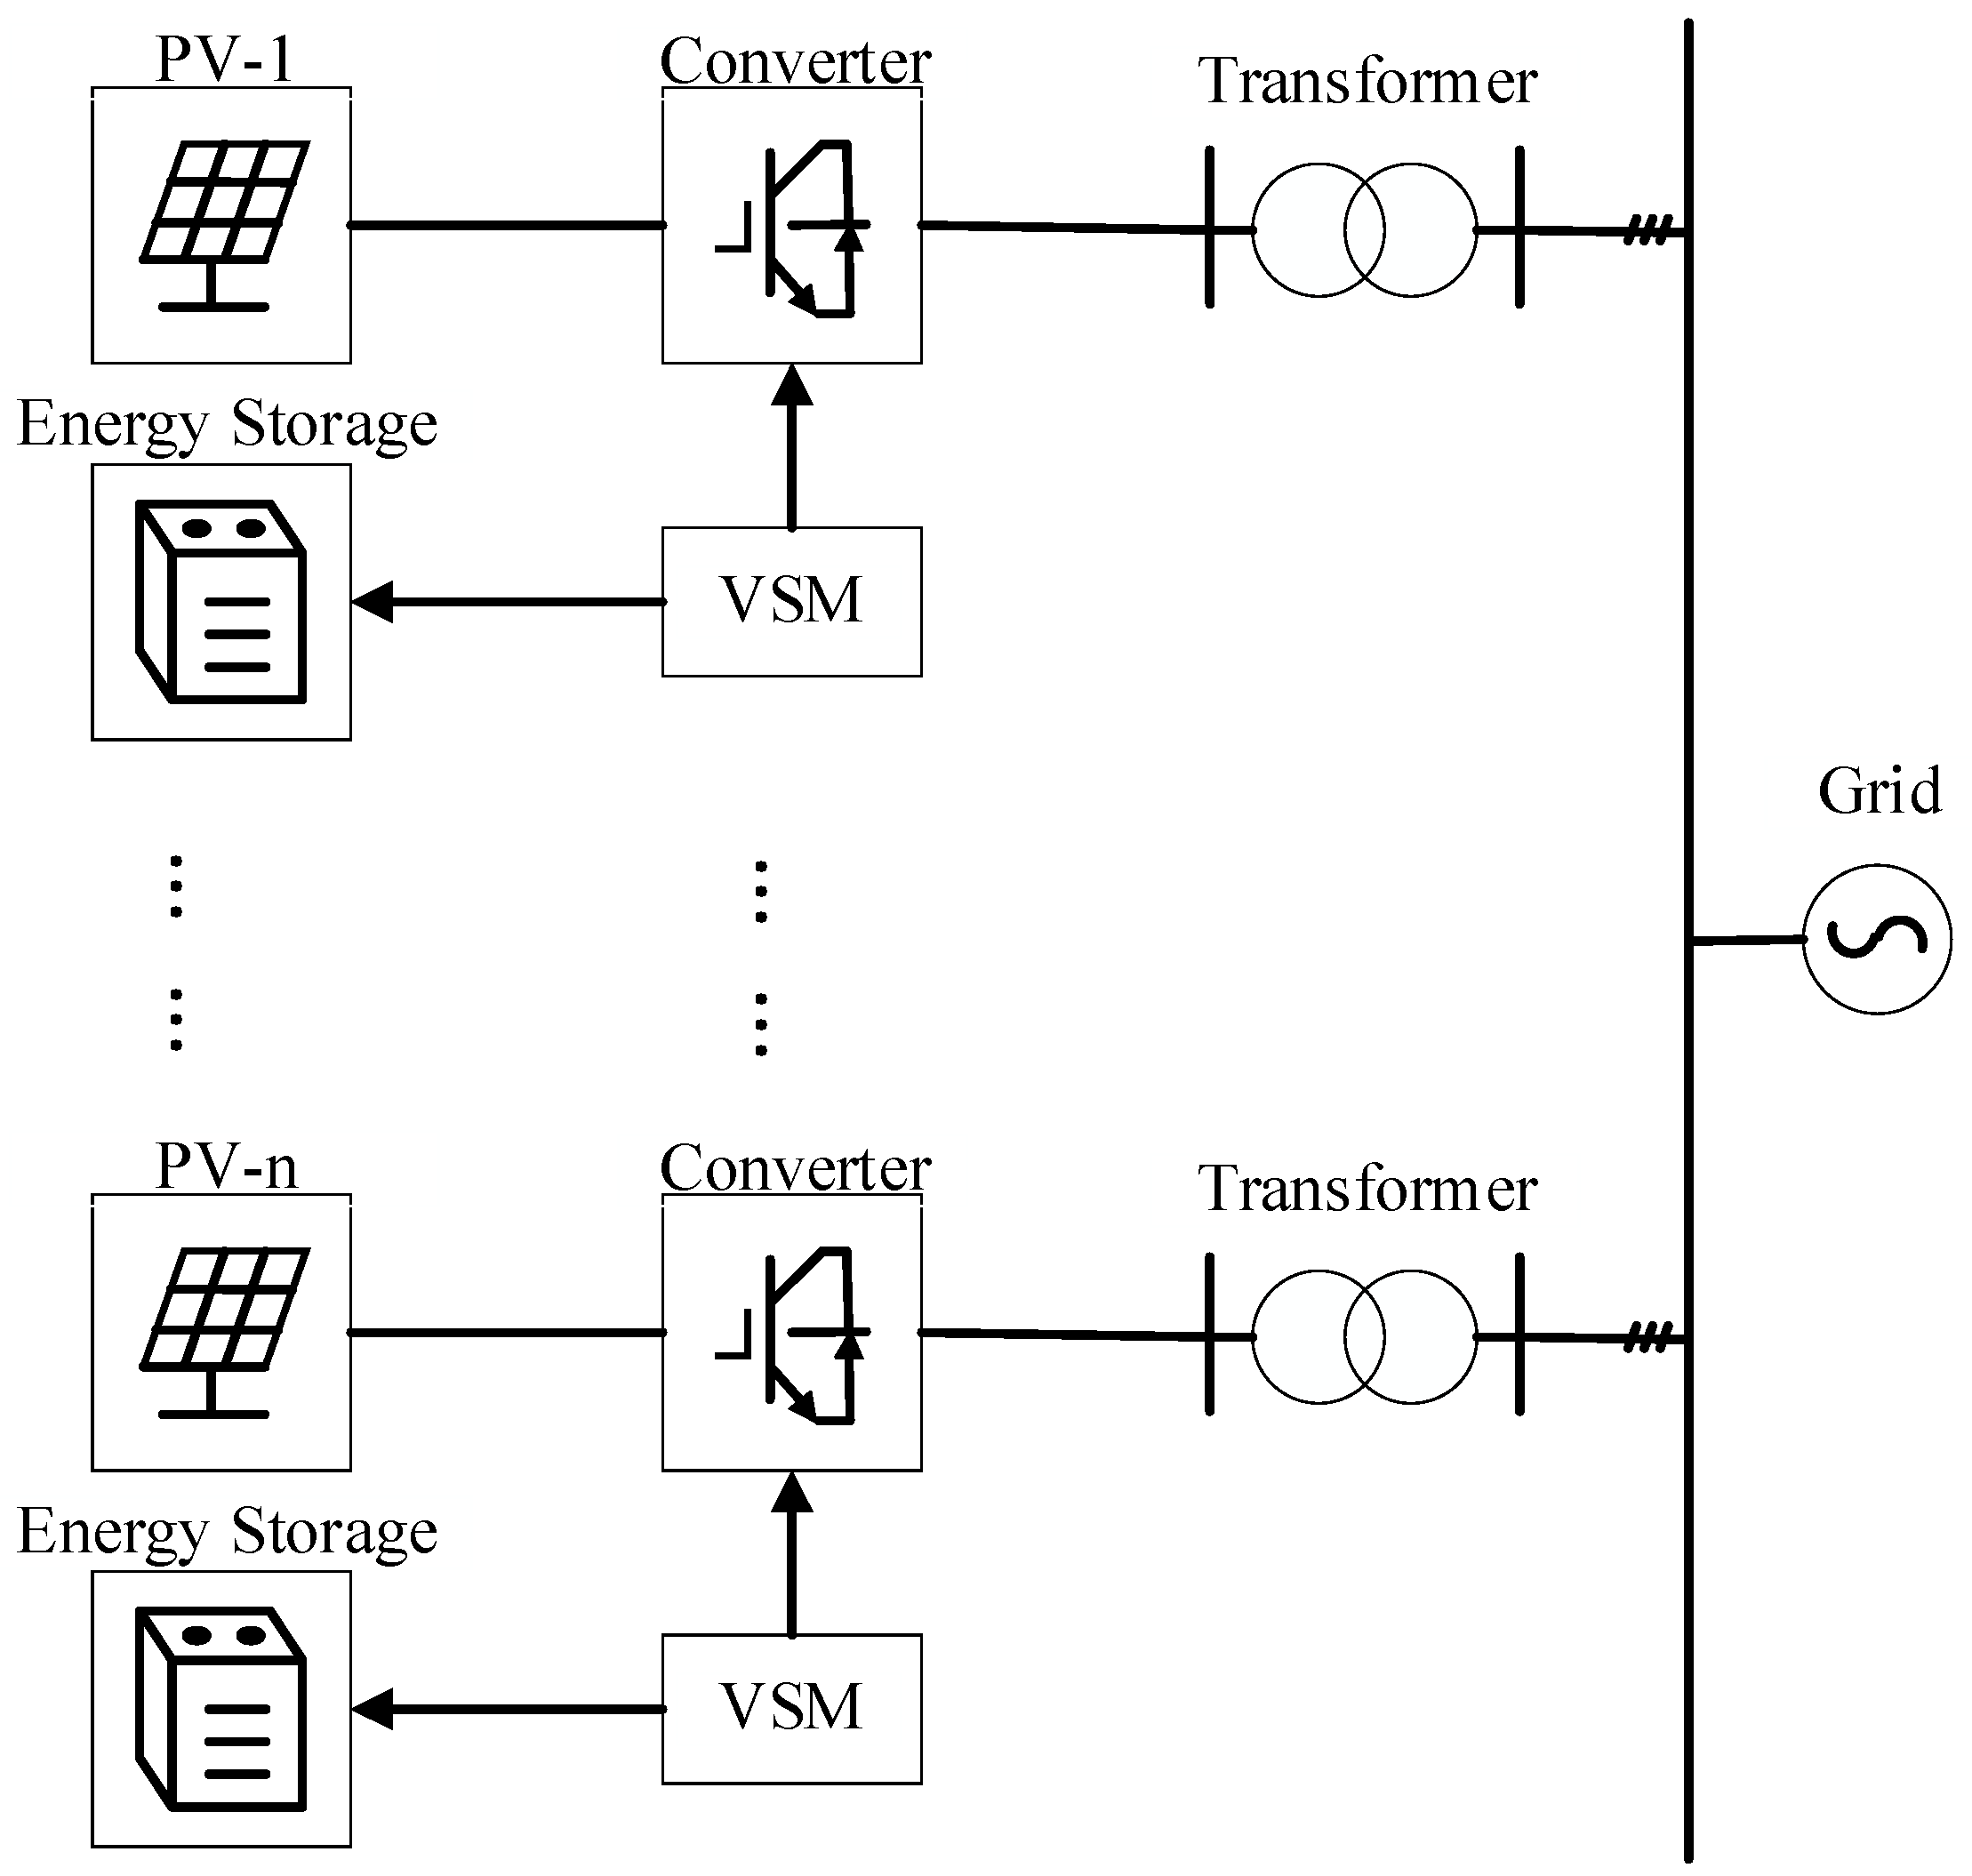
Since the photovoltaic array itself has no mechanical rotor, without additional equipment, the only way to retain the response margin is to reduce the output power. This approach has poor economic efficiency and a narrow response range. Therefore, energy storage is almost a standard component of photovoltaic power stations. On this basis, the converter of the energy storage is further equipped with VSM control. By simulating the inertia and damping characteristics of synchronous generators, the energy storage can respond quickly to frequency changes and provide a supporting effect similar to mechanical inertia. The corresponding operation architecture for distributed photovoltaic power generation connected to the grid is shown in Figure 1.

Figure 1.
Operating architecture for distributed photovoltaic power generation connected to grid.
3.2. Control Scheme
For the droop control applicable to grid-forming (GFM) converters, its essence is to adjust the output angular velocity and voltage of the converter according to the power exchanged with the grid, in order to support the stability of grid operation. The typical active power–frequency equation and reactive power–voltage equation of droop control, respectively, are as follows:
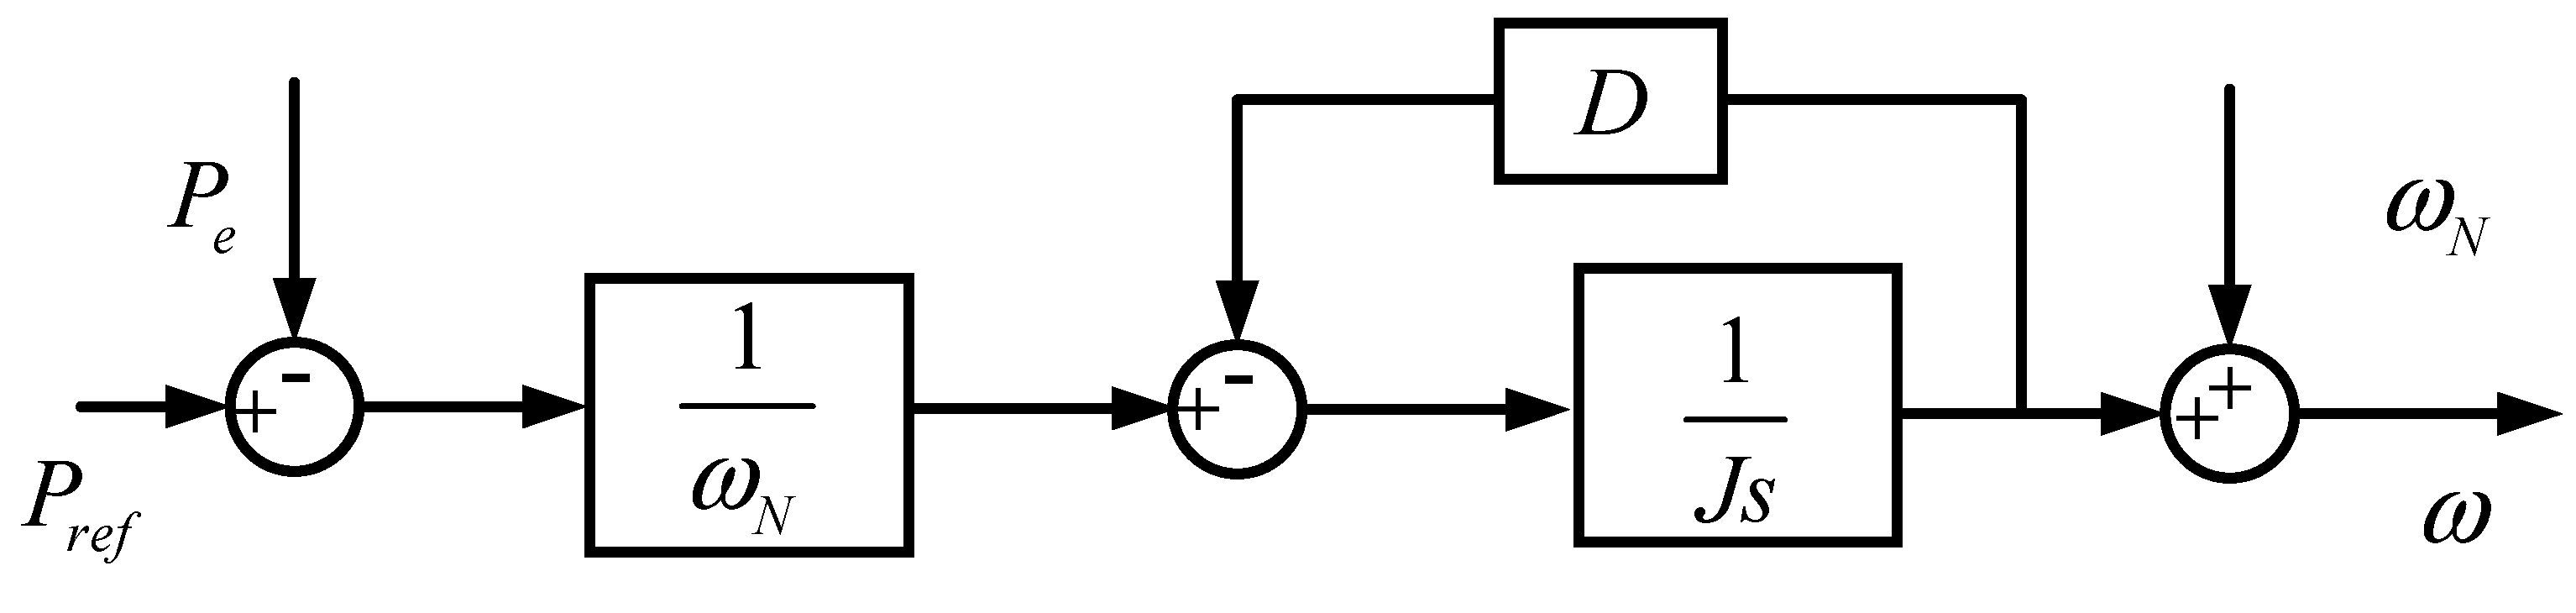
VSM control takes into account the inertia and damping characteristics of synchronous generators on the basis of droop control. The aim is to simulate the dynamic behavior of synchronous generators through power electronic converters. Referring to the rotor swing equation, the typical active power–frequency equation of VSM control is shown in Formula (6), and its Laplace transform is shown in Formula (7).
where is the synchronous electrical angular velocity; is the moment of inertia; is the damping coefficient; is the reference value of active power; is the electromagnetic power; and is the electrical angular velocity of the VSM control output. The control block diagram corresponding to the active power–frequency part is shown in Figure 2.
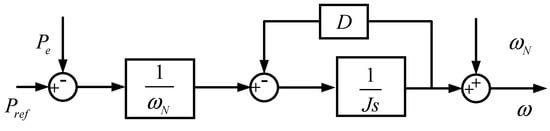
Figure 2.
The block diagram of the active frequency control of the VSM.
The reactive power–voltage equation controlled by the VSM is as follows:
where is the rated voltage amplitude; is the reactive-voltage coefficient; is the reactive-voltage integral coefficient; is the reactive power reference value; is the reactive power; and is the voltage output of VSM control. The control block diagram corresponding to the reactive-voltage part is shown in Figure 3.
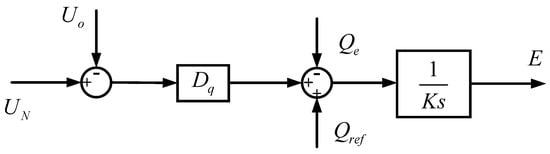
Figure 3.
Block diagram of reactive power–voltage control in VSM.
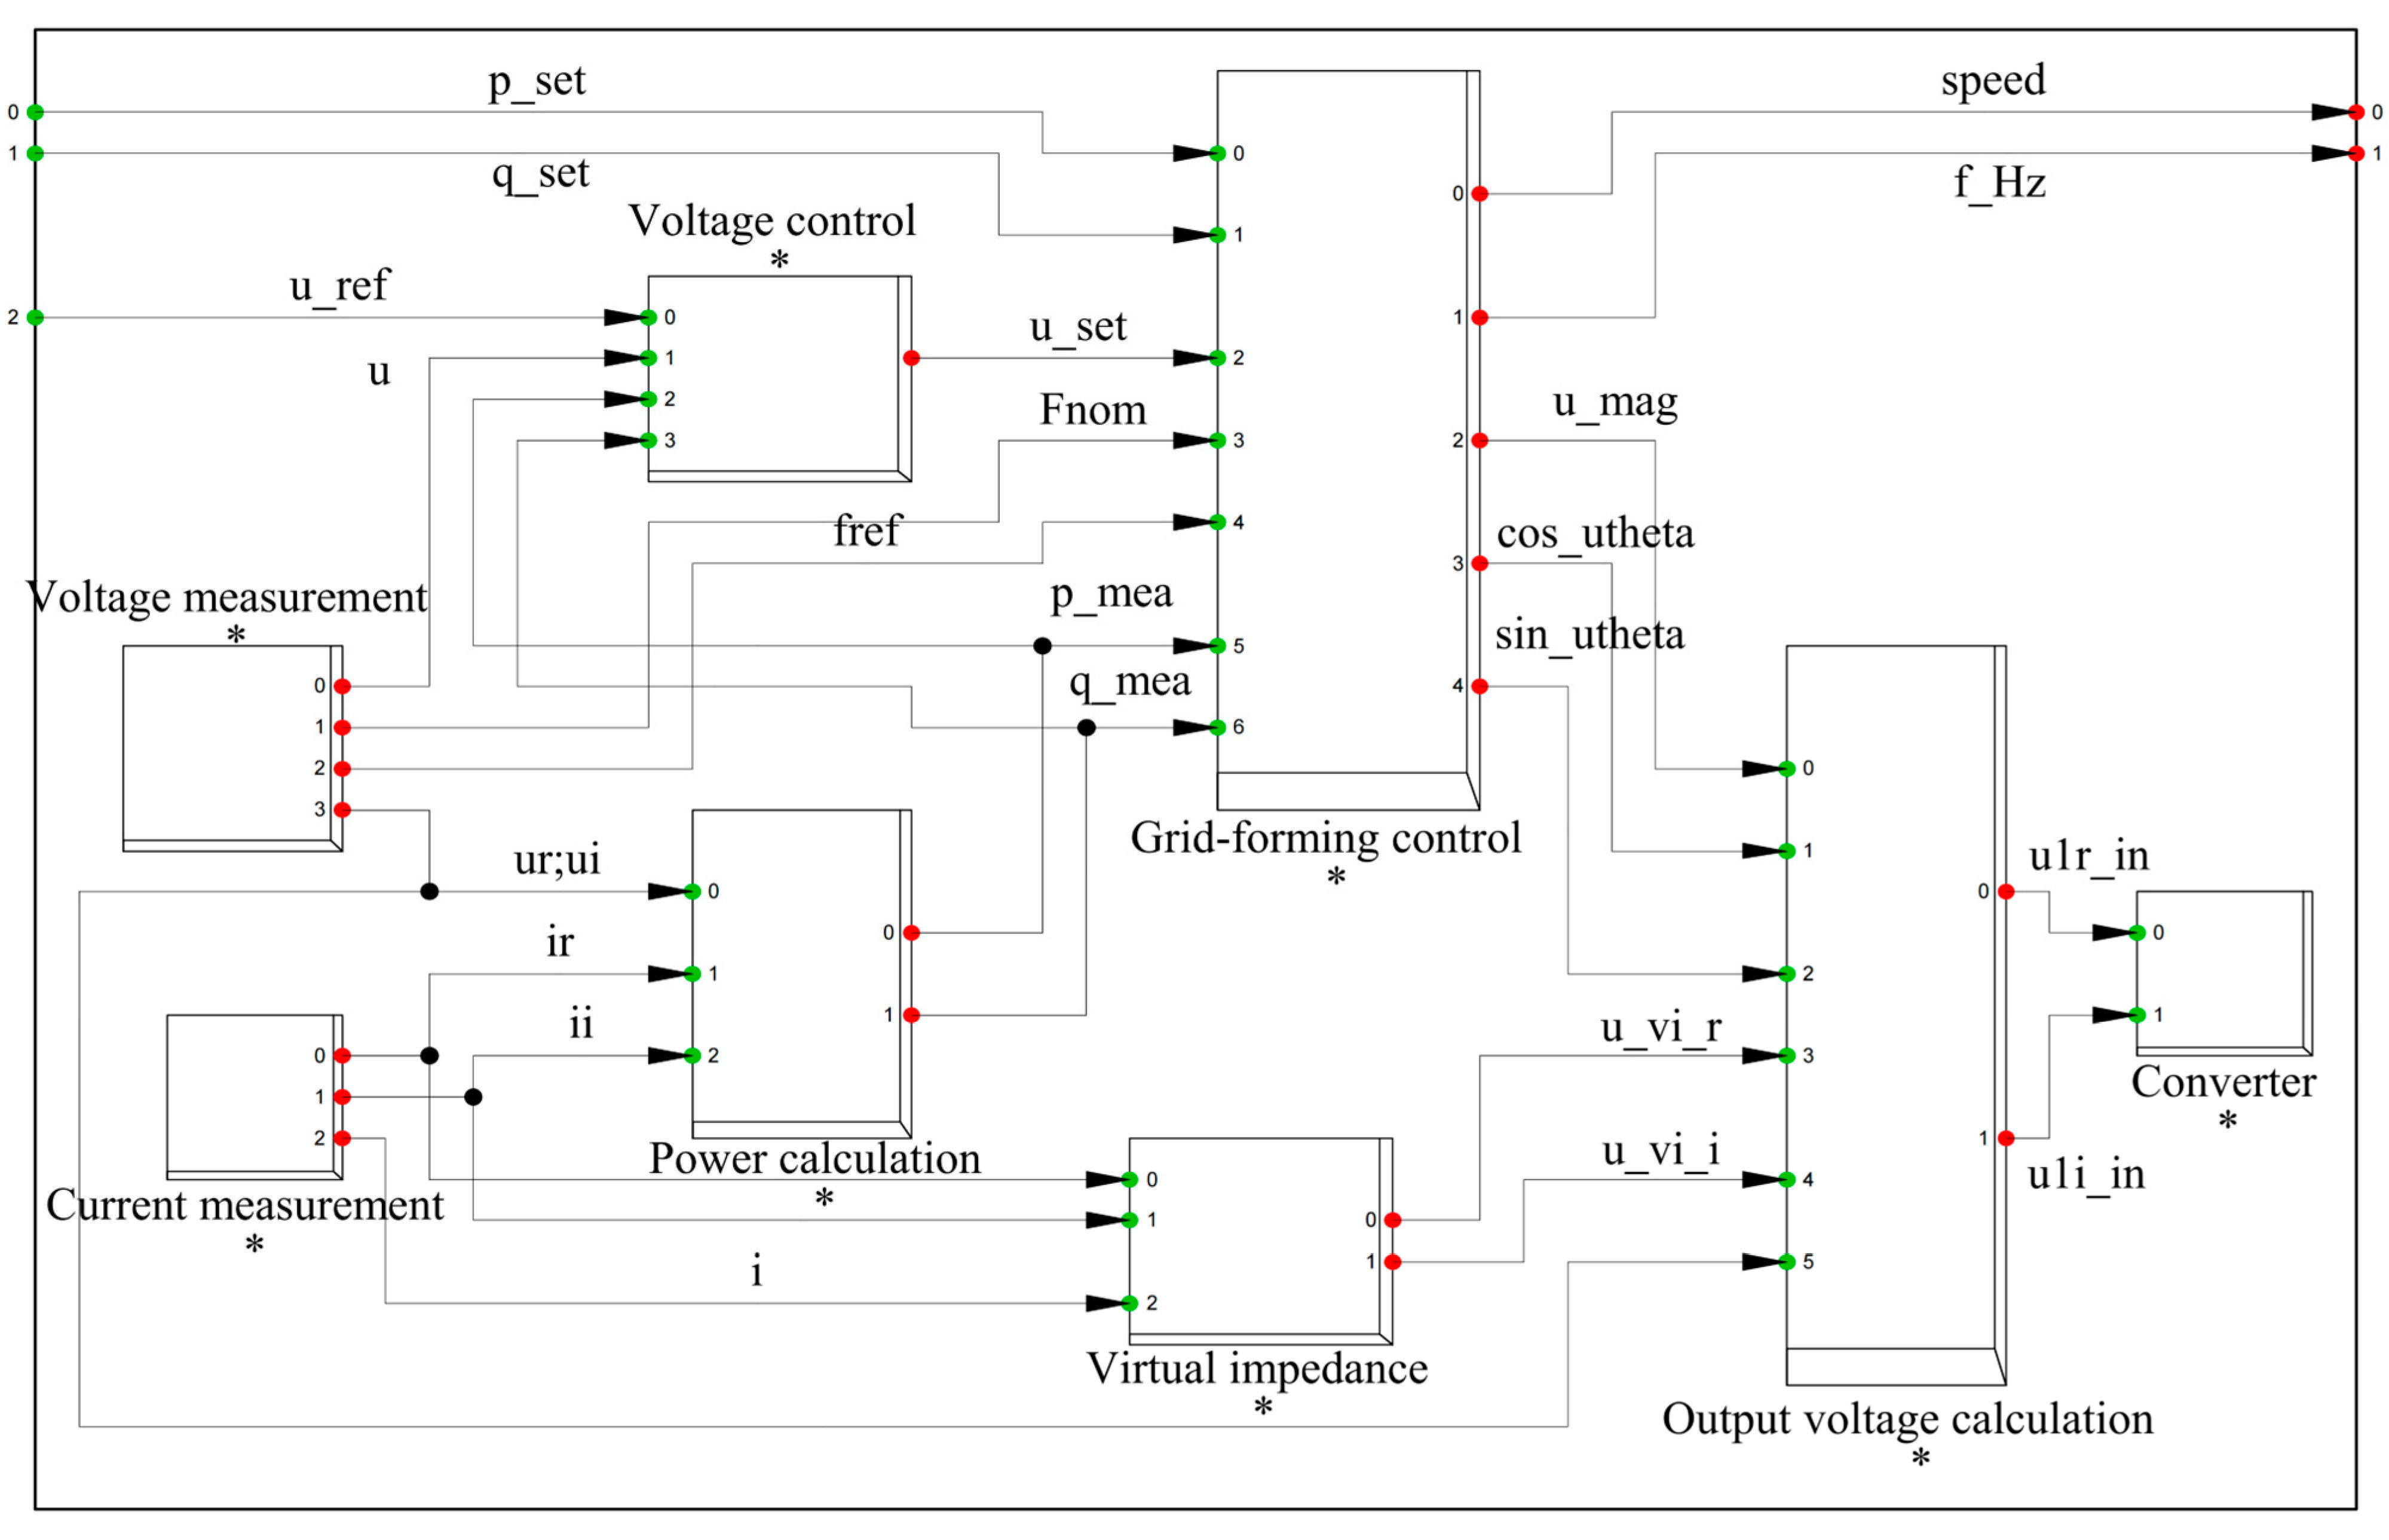
Ultimately, based on the pre-installed energy storage converter model in DIgSILENT, the framework of the energy storage converter with VSM control was realized, as shown in Figure 4.
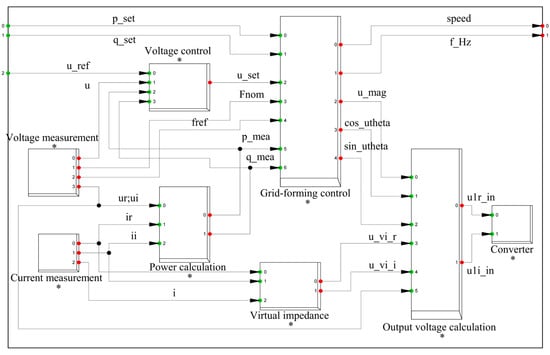
Figure 4.
The framework for implementing an energy storage converter with VSM control in DIgSILENT (The “*”, red and green dots in the figure respectively represent the name of the module, the output signal and the input signal).
4. Evaluation Method for Equivalent Inertia of High-Penetration-Rate Distributed Photovoltaic Power Generation Connected to Grid
4.1. Evaluation Model for Inertia of Photovoltaic Power Generation Unit
The photovoltaic power station has been equipped with energy storage with VSM control. The overall inertia of the photovoltaic–storage combined power generation unit can be adjusted by modifying the parameters of VSM control. The relationship formula is expressed as follows in DIgSILENT:
where is the acceleration time constant; is the inertia constant; is the moment of inertia; is the rated frequency; is the pole pair number; is the rated apparent power; is the power factor; and is the natural constant. At this point, the equivalent inertia constant of the photovoltaic power generation unit can be set independently.
4.2. Equivalent Inertia Assessment Method Without Considering Virtual Inertia Modification
Without considering the virtual inertia modification, the inertia of the new power system basically depends on the proportion of synchronous generators. Based on Equation (3), the equivalent inertia constant of the system containing synchronous generators and photovoltaic power stations can be expressed as follows:
where is the equivalent inertia constant of the system; is the rated capacity; is the rotor kinetic energy; , , and , respectively, refer to the system, synchronous machine, and photovoltaic array; and is the penetration rate of energy provided by the DER system. Clearly, before the introduction of virtual inertia, the higher the penetration rate of energy provided by DERs, the lower the inertia of the system.
4.3. Equivalent Inertia Assessment Method Considering Virtual Inertia Modification
4.3.1. Process of Equivalent Inertia Assessment
The first step is to introduce virtual inertia into the system and configure energy storage with VSM control for photovoltaic power stations. The specific implementation method can be found in Section 3.2.
The second step is to conduct an inertia assessment for each power generation unit. In a distributed photovoltaic power generation system, considering virtual inertia transformation, the inertia carrier not only includes the rotor of traditional synchronous generators but also includes photovoltaic power stations equipped with energy storage with VSM control. The specific inertia assessment method can be found in Section 4.1.
The third step is to improve the inertia center (Center of Inertia, COI) theory, taking into account the mechanical inertia of traditional power plants and the virtual inertia of energy provided by DER power plants, and calculate the inertia center frequency of the system as a weighted average of the two. The specific method can be found in Section 4.3.2.
The fourth step is to conduct an equivalent inertia assessment for the system. It includes two aspects: overall inertia assessment and inertia distribution assessment. (1) Based on the installed capacity of each power generation unit and the equivalent inertia constant, calculate the equivalent rotor kinetic energy of the system. (2) Based on the inertia center frequency of the system and the frequency of each busbar, calculate the inertia strength coefficient of each busbar. The specific method can be found in Section 4.3.3.
4.3.2. Improved Theory Center of Inertia
The swing equation can be written in the following form:
where is the inertia constant; is frequency; and are the mechanical and electromagnetic power, respectively; and is the power inequality measure.
Considering the distributed photovoltaic power generation system as a single-unit system, by analogy with the rotor swing equation, the swing equation of the entire system is defined as
where is the equivalent inertia constant of the system; is the total power imbalance of the system; and is the COI frequency of the system. The COI frequency is a weighted value of the bus frequency of all operating power plants in this region weighted by the equivalent rotor kinetic energy of each plant (determined jointly by the equivalent inertia constants and rated capacities of the power plants), calculated as shown in Equation (13).
where is the frequency of the th generator bus; is the equivalent rotor kinetic energy of the th power plant; is the sum of equivalent rotor kinetic energies of all power plants in operation; and the equivalent rotor kinetic energy is calculated as , of which and , respectively, represent equivalent inertia constants and rated capacities of the corresponding power plants (including energy provided by DER power plants).
4.3.3. System-Equivalent Inertia Evaluation
- (1)
- Overall inertia assessment
The rated capacity of each power plant including the energy provided by the DER power plant is known, and after the corresponding equivalent inertia constant is obtained by further evaluation, the equivalent rotor kinetic energy of each power plant can be calculated by Equation (3). The equivalent rotor kinetic energy of the whole system is the sum of the equivalent rotor kinetic energy of each power plant. The calculation formula is as follows:
where is the equivalent rotor kinetic energy of the whole system. There are a total of power plants in operation in the system. and are equivalent inertia constants and the rated capacity of the th power plant, respectively.
- (2)
- Evaluation of inertia distribution
Based on COI theory, the frequency offset of the th bus is defined as
where is the frequency offset of bus ; is the frequency of bus ; is the starting measurement time, i.e., the moment of perturbation; and is the length of assessment set autonomously.
Assuming that the maximum value of the frequency offset for all buses is and the minimum value is , then combining this with the stabilizing effect of inertia on frequency, the inertial strength factor for bus can be defined as
where is the inertia strength coefficient of the th bus, and its value is between 0 and 1. The larger this value, the higher the frequency stability of this bus. Based on the evaluation results of each bus’s inertia strength coefficient, the inertia distribution of the whole system can be understood, and the supervision of these weak links can be strengthened.
5. Simulation Analysis
5.1. Model Description
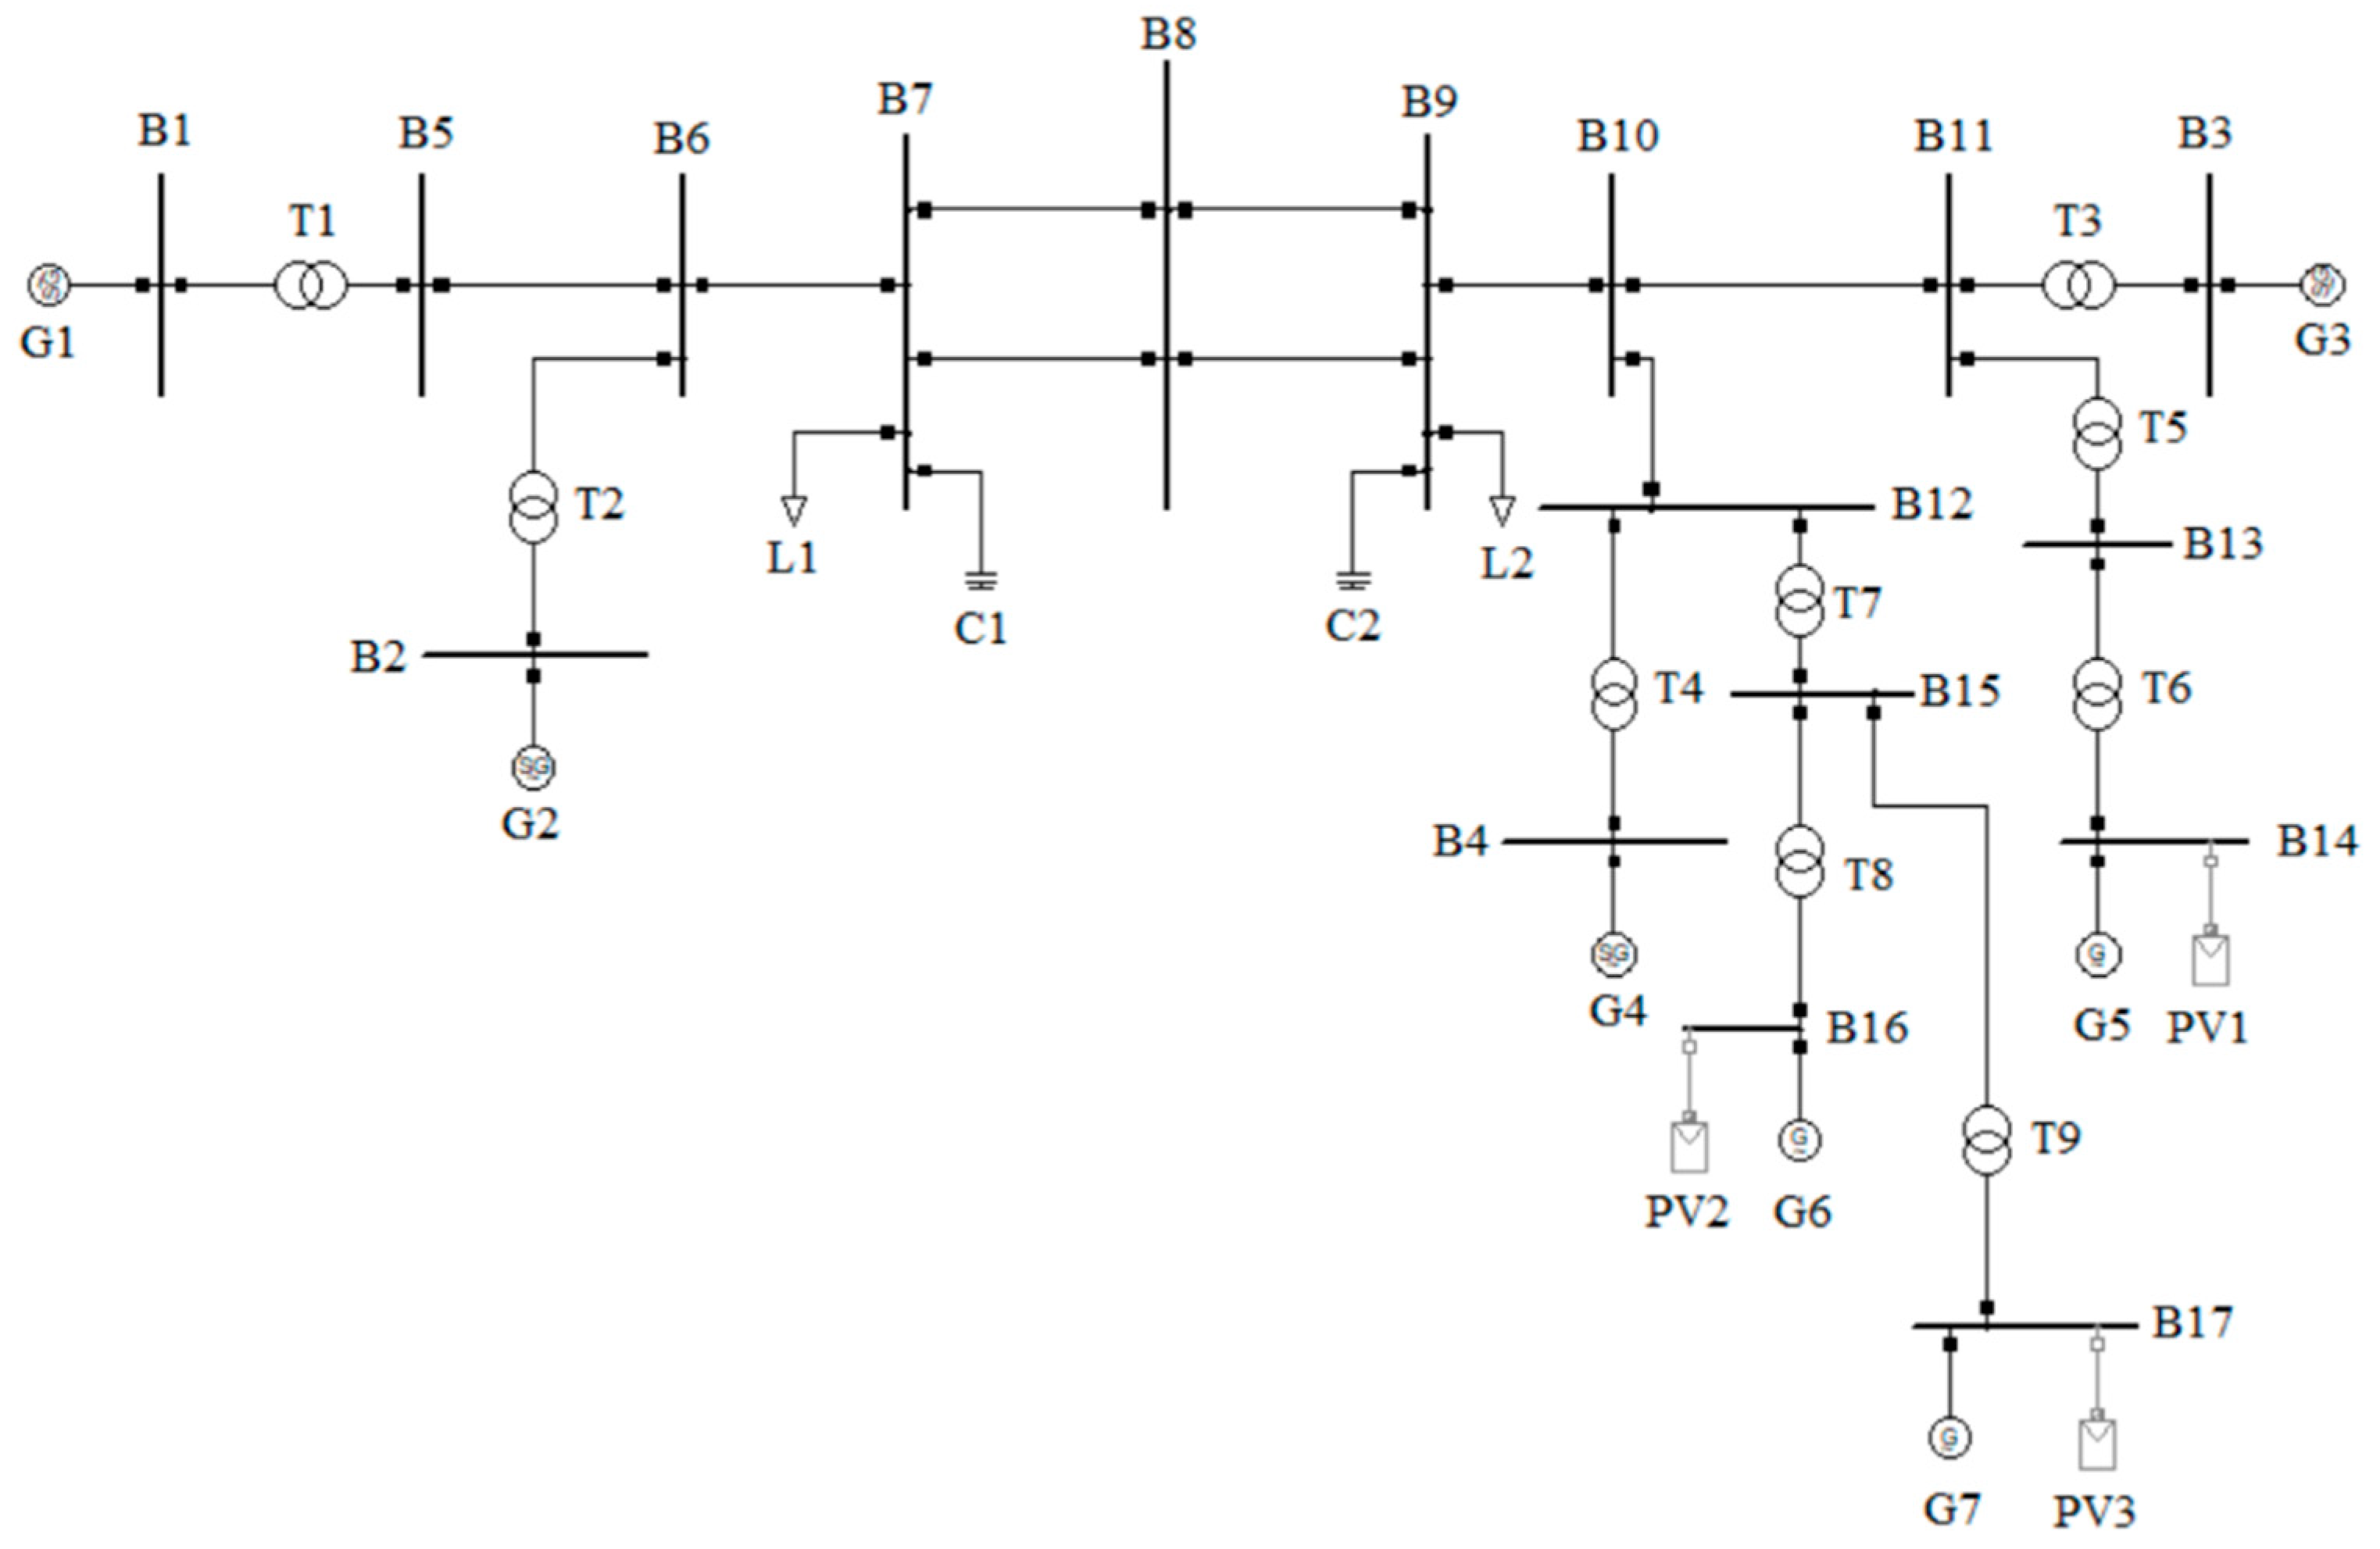
In the DIgSILENT–Power Factory V15.1 simulation software, an IEEE four-machine two-area model (the reference frequency is 50 Hz) was established, and on this basis, the model was modified (by adding G5, G6, and G7 synchronous generators, which would later be replaced by photovoltaic power sources to simulate systems with different penetration rates of energy provided by DER sources). Four stages were set up as follows: Stage A—when the energy provided by DERs has not been connected, the system is fully powered by synchronous generators; Stage B—when a part of the energy provided by DERs is connected, the output of synchronous generators is replaced by the equivalent capacity of PV1 (replacing G5), with a penetration rate of 16%; Stage C—when the energy provided by DERs is fully connected, the output of synchronous generators is replaced by the equivalent capacity of PV1, PV2, and PV3 (replacing G5, G6, and G7, respectively), with a penetration rate of 34%; and Stage D—on the basis of Stage C, virtual inertia is introduced. The schematic diagram of the simulation model is shown in Figure 5, and the parameters of each device included are shown in Table 1. Among them, B represents a bus (the interconnection lines between buses are represented by “line”), G represents a synchronous generator, T represents a transformer, L represents the load, C represents a filter, and PV represents photovoltaic.
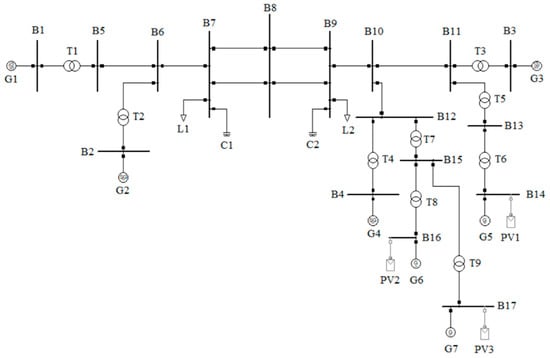
Figure 5.
Schematic diagram of simulation model.

Table 1.
Equipment parameter list.
5.2. Impact of Distributed Photovoltaic Grid Connection on Frequency Stability of Power System
In this section, the output of synchronous generators is gradually replaced by energy provided by DER sources, while keeping the total power generation unchanged. This is to simulate systems with different penetration rates of energy provided by DERs. By setting the same fault events in different stages, the impact of energy provided by the DER grid connection on the frequency stability of the power system is compared and analyzed.
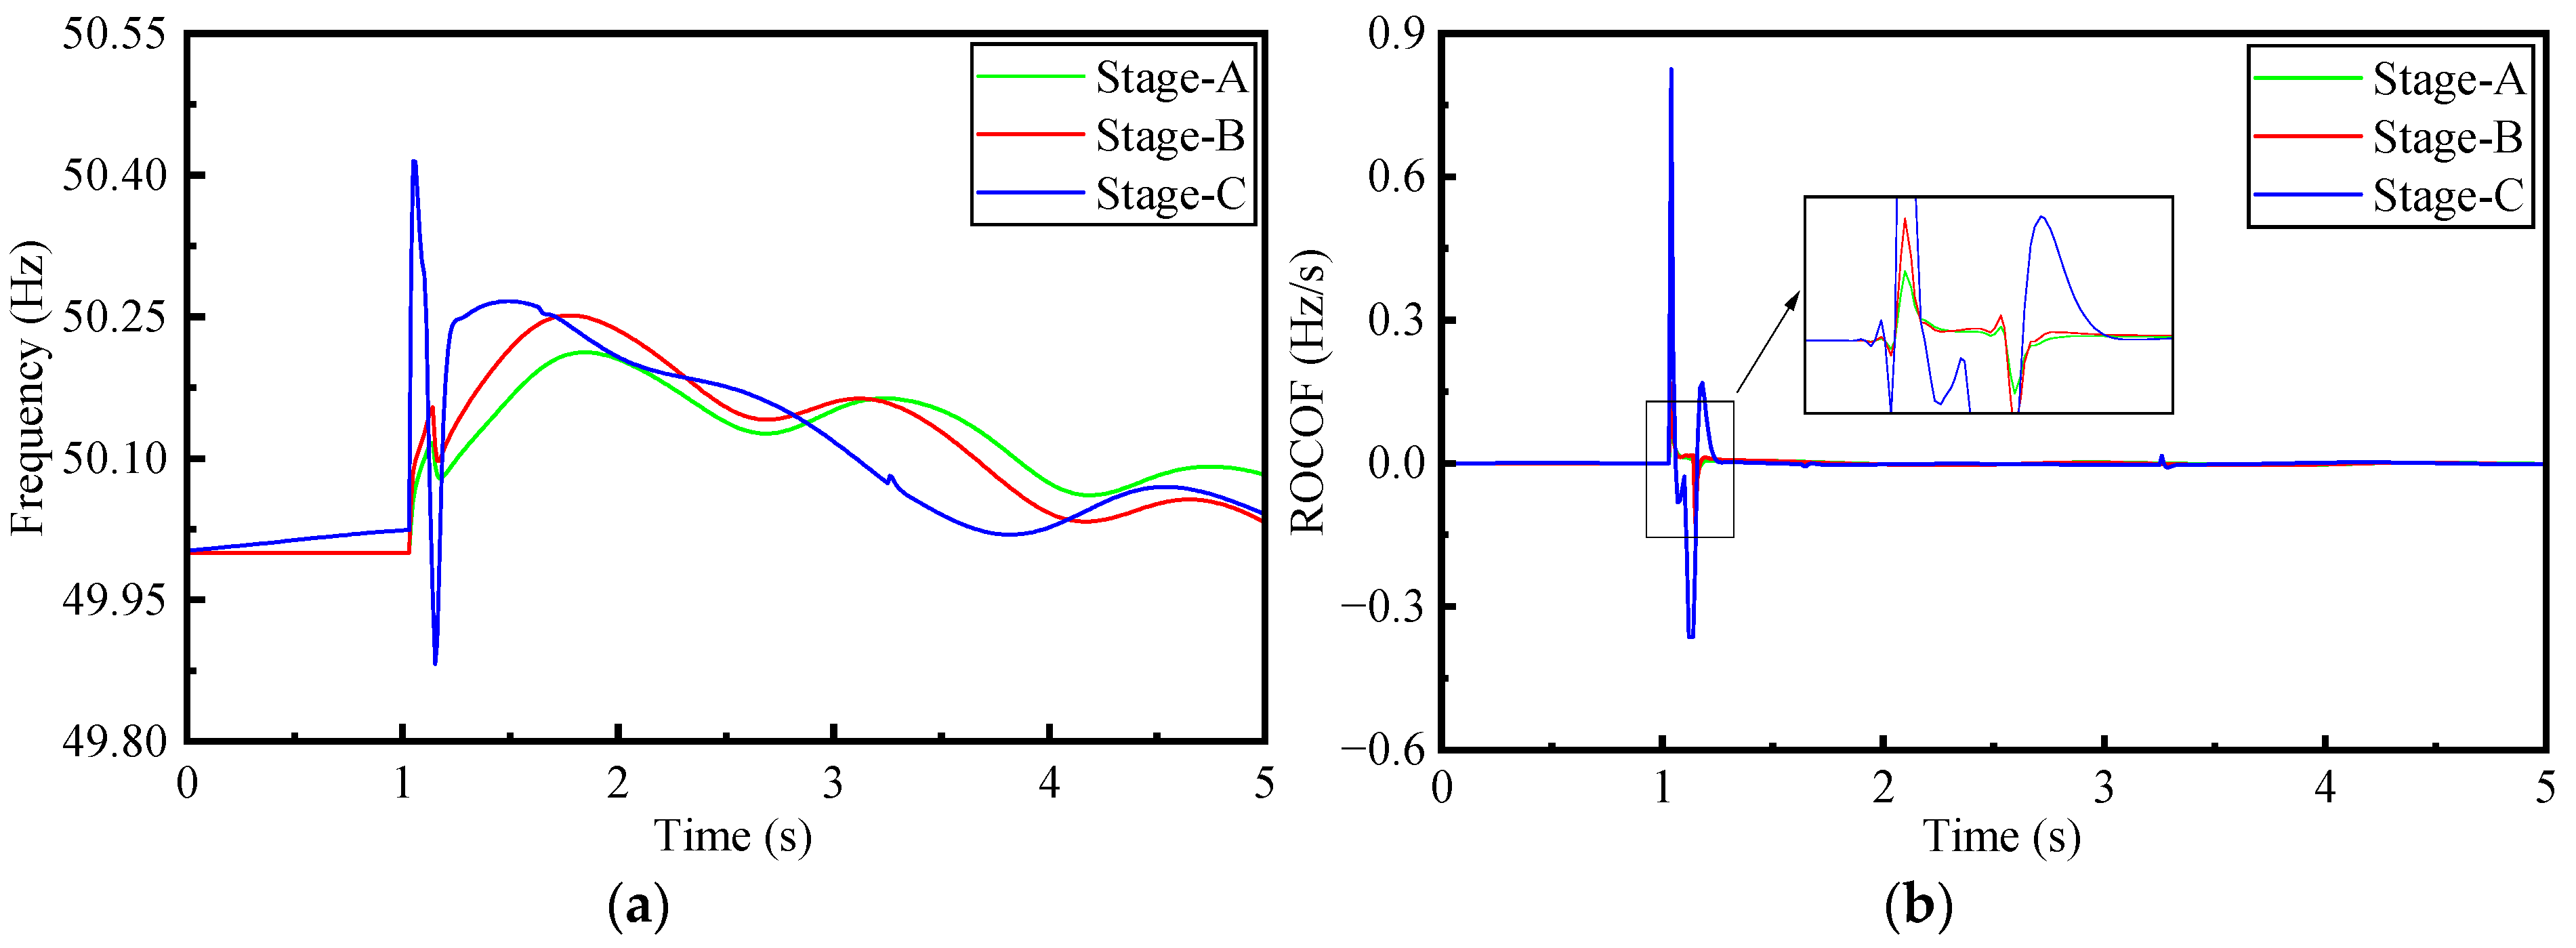
After 1 s of the start of the simulation, a three-phase short-circuit fault occurs at B5, and the fault is cleared at 1.1 s. The frequency and frequency change rate of B12 are measured in stages A, B, and C, and then summarized in Figure 6.
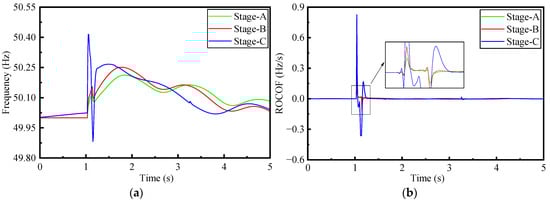
Figure 6.
Frequency response characteristics of B12: (a) frequency; (b) ROCOF.
The results show that in stages A, B, and C, the corresponding maximum frequency deviation of the system is 0.212357, 0.251655, and 0.414930 Hz when facing the same faults, and the corresponding maximum ROCOF (rate of change of frequency) is 0.095865, 0.167639, and 0.825416 Hz/s, respectively. This system’s frequency stability decreases continuously with the increase in energy provided by DER penetration.
5.3. Verification of the Effectiveness of the Virtual Inertia Modification Scheme
This section successfully introduces the virtual inertia in accordance with the operation architecture and control scheme proposed in Section 3. By comparing the frequency response characteristics of the system before and after the virtual inertia modification, the effectiveness of the virtual inertia modification scheme is verified.
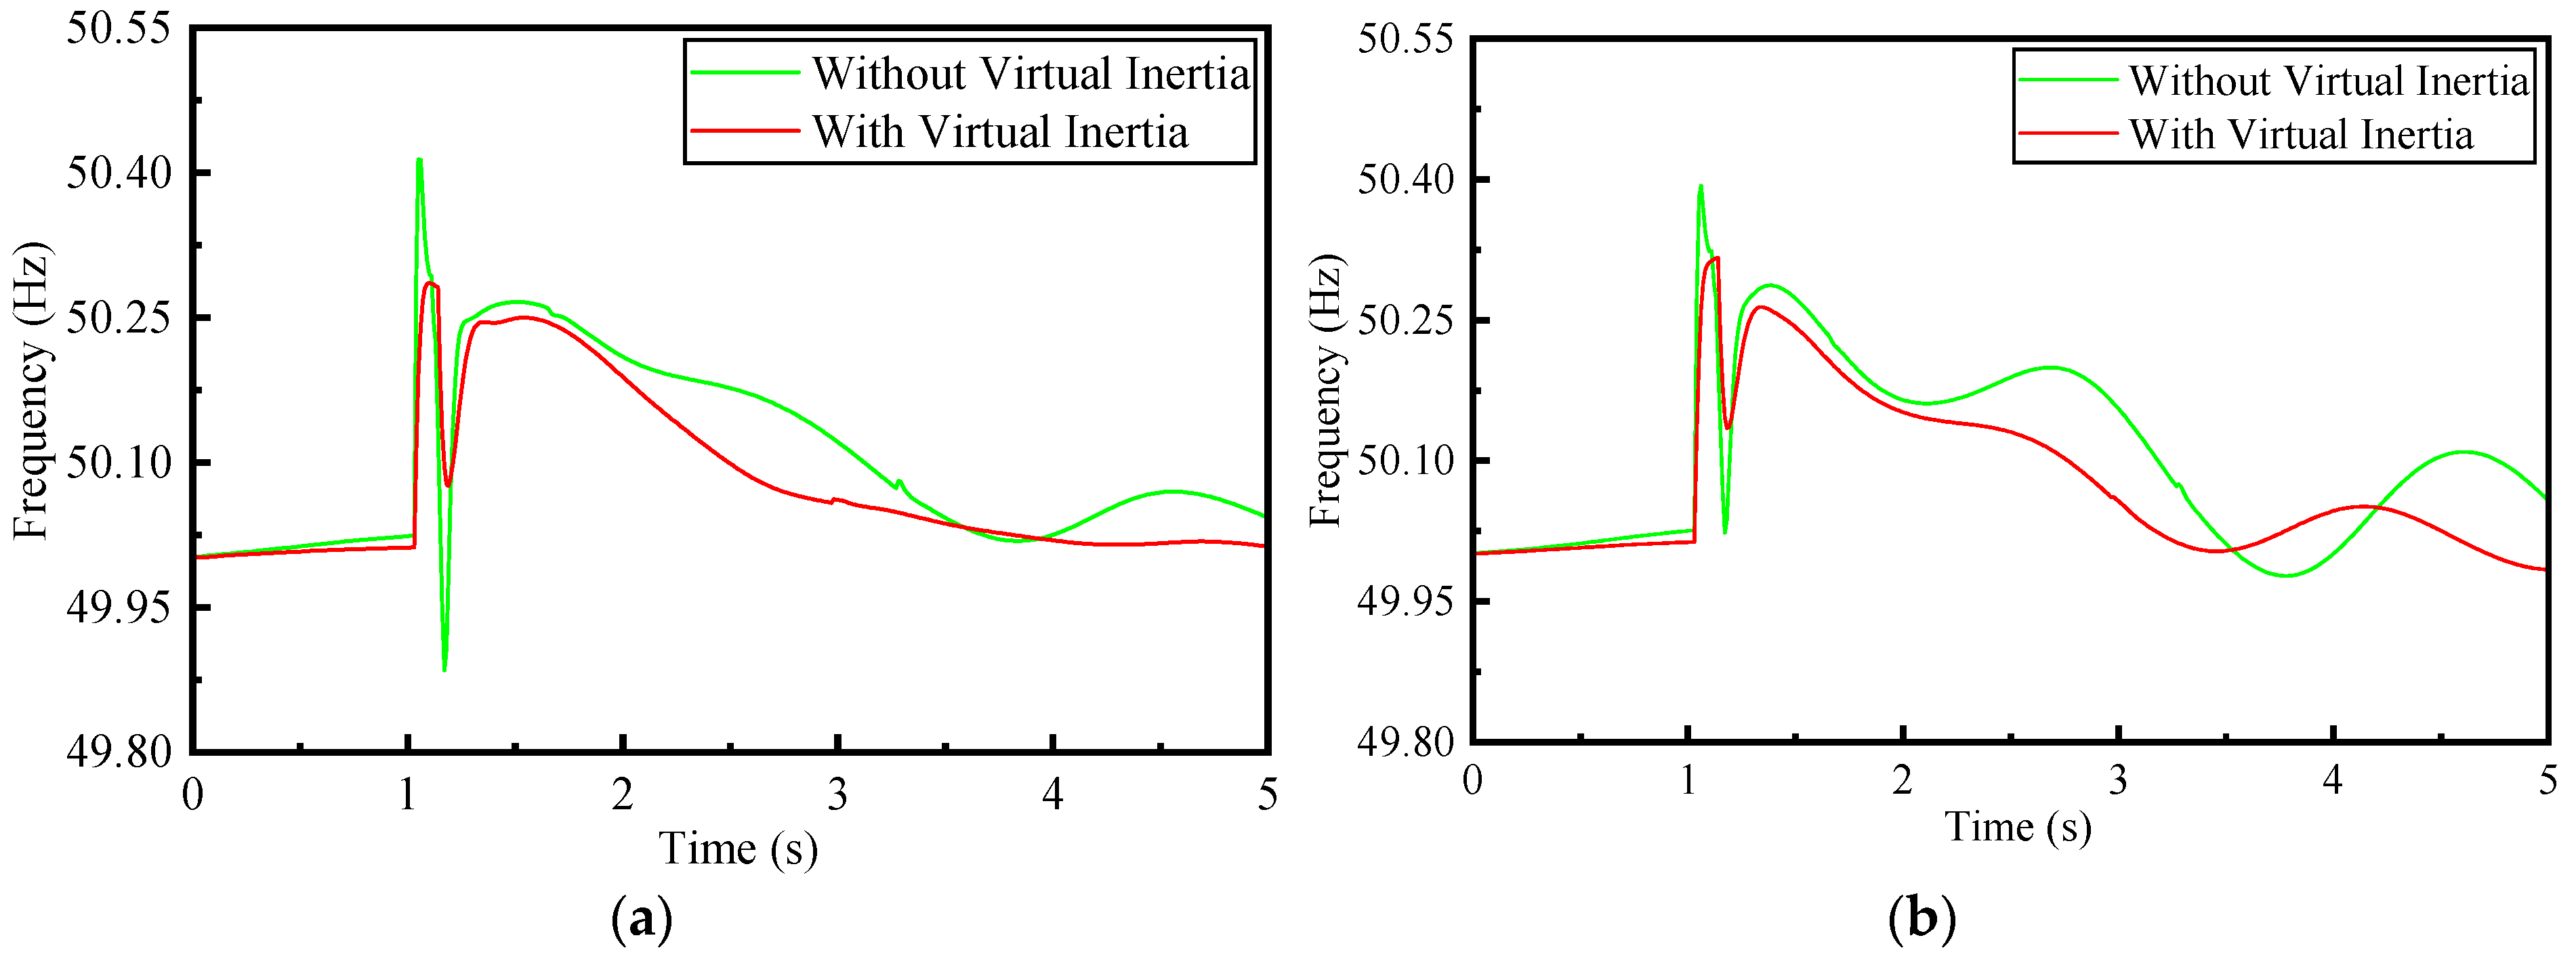
After 1 s of the start of the simulation, a three-phase short-circuit fault occurs at B5, and the fault is cleared at 1.1 s. In stages C and D (where PV1, PV2, and PV3 are, respectively, configured with 10% energy storage with VSM control), the frequencies at typical positions B8 (the inter-area tie line) and B10 (the bus where the energy provided by DERs is concentratedly connected) are measured. Figure 7 summarizes this process.
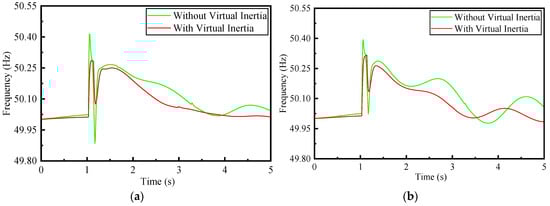
Figure 7.
Frequency response characteristics: (a) B10, (b) B12.
The results show that systems with virtual inertia exhibit stronger frequency stability. The maximum frequency deviations of B8 and B10 are 0.285 and 0.316 Hz, respectively. Compared with 0.413 and 0.393 Hz before the modification, they have decreased by 31% and 20%, respectively.
5.4. Comparison of the Response Capabilities of Energy Storage Under Different Access Locations
In this section, all the devices and lines connected to B12 are regarded as the B12 area, and the overall inertia level of this area is reflected by the frequency response characteristics of B12. By keeping the irrelevant conditions such as the configuration capacity of energy storage and the occurrence of fault events unchanged, and only changing the access position of energy storage, the correlation between the response capability of energy storage and the access position is compared and analyzed.
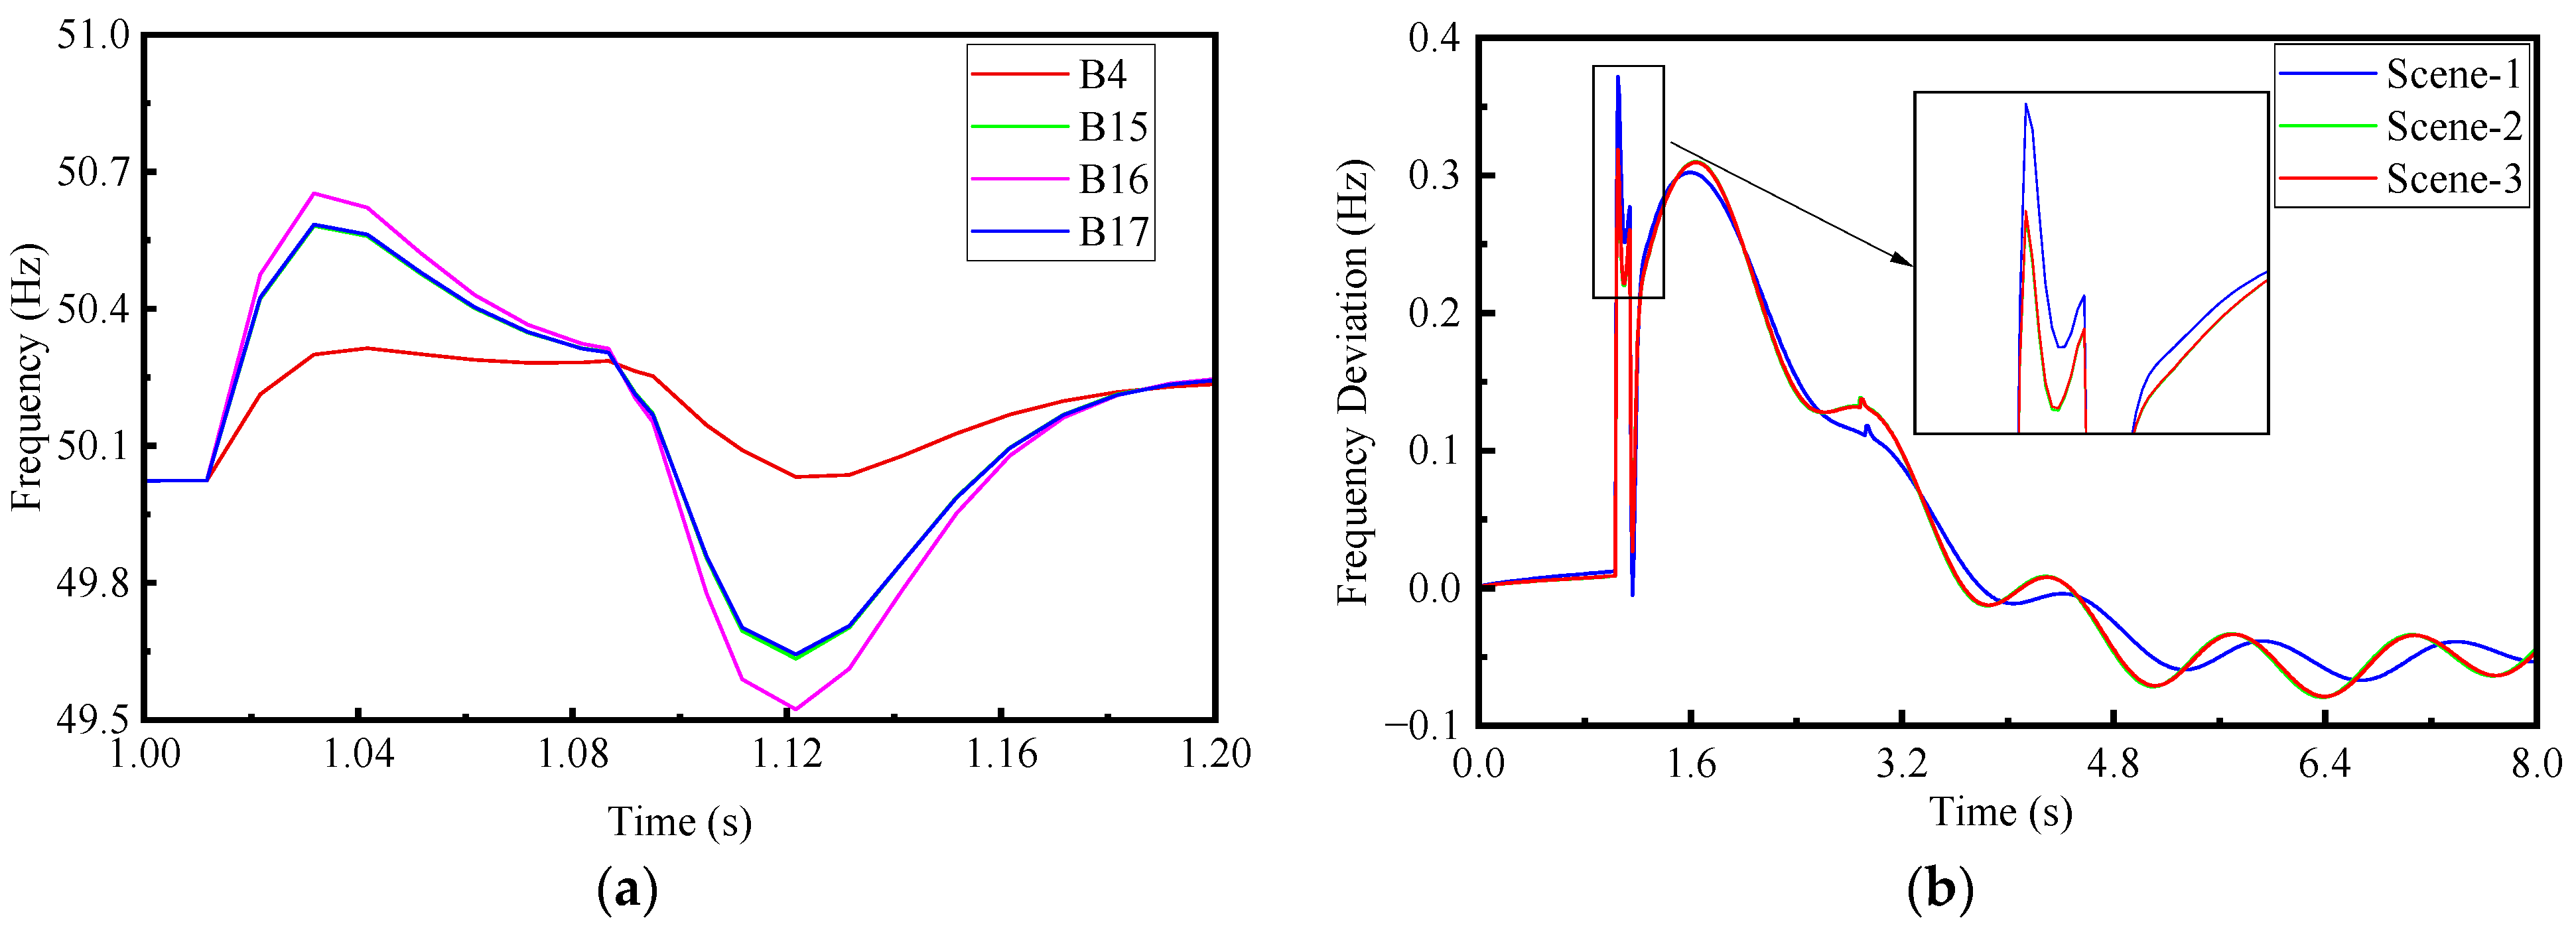
First, in stage C where virtual inertia has not been introduced, all the buses in this area are sorted according to the frequency stability. A three-phase short-circuit fault occurs at B5 at 1 s, and the fault is cleared after 0.1 s. The frequency response curves of B4, B15, B16, and B17 are summarized, as shown in Figure 8a. In terms of the frequency stability of the buses, B4 is the best, followed by B15 and B17, and B16 is the worst.
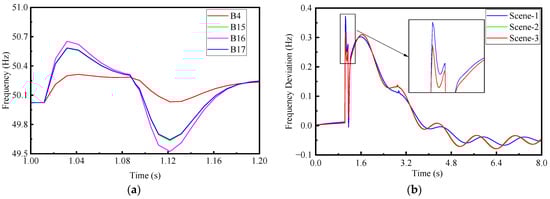
Figure 8.
Comparison of the frequency-supporting effects of grid-forming energy storage under different access locations: (a) comparison of the frequency stability of each bus in the B12 area; (b) the frequency response characteristics of the system after the energy storage is connected at different locations.
Subsequently, three types of energy storage connection schemes were set up, corresponding to the three scenarios of stage D: Scenario 1, a 50 MW grid-forming energy storage was connected to B4; Scenario 2, a 50 MW grid-forming energy storage was connected to B16; and Scenario 3, the total capacity of the grid-forming energy storage was 50 MW, with 15 MW connected to B15, 30 MW to B16, and 5 MW to B17. The fault settings remained unchanged. The frequency deviation curves of B12 under each scenario are summarized in Figure 8b. For Scenarios 1, 2, and 3, the maximum frequency deviation of B12 was 0.371636, 0.316713 (optimal), and 0.318714 Hz, respectively. Thus, it can be seen that the response effect of the grid-forming energy storage is affected by its location. When connected to the busbar with poor frequency stability, it will exhibit a stronger supporting capacity. For the B12 area, the optimal connection position is at B16.
5.5. Evaluation of Equivalent Inertia of High-Penetration-Rate Distributed Photovoltaic Power Generation Connected to Grid
This section evaluates the overall inertia and the inertia distribution of the high-permeability distributed photovoltaic power generation connected to the power grid based on the equivalent inertia assessment method proposed in Section 4.
This method belongs to the post-disturbance assessment. To obtain relevant data, a three-phase short-circuit fault occurs at B5 after 1 s of the start of the simulation, and the fault is cleared at 1.1 s. In addition, to verify the effectiveness of the assessment method, three scenarios are prepared in stage D: Scenario 1, configure a grid-forming energy storage system with a capacity of 10% for PV3; Scenario 2, configure a grid-forming energy storage system with a capacity of 10% for PV1 and PV2; Scenario 3, configure a grid-forming energy storage system with a capacity of 10% for PV1, PV2, and PV3.
- (1)
- Overall inertia assessment
Before evaluating the overall inertia of the system, the equivalent inertia constants of each power generation unit need to be calculated. The inertia constants of synchronous generators G1, G2, G3, and G4 are 4.16, 3.25, 3.175, and 3.175 s, respectively. The equivalent inertia constants of photovoltaic power generation units can be set independently, and the setting values are shown in Table 2.
Table 2.
The set values of equivalent inertia constants for each photovoltaic power generation unit.
After obtaining the equivalent inertia constants of each power generation unit including the energy provided by the DER power station (as given in Table 1); combining with their rated capacities; and substituting them into Formula (14); the equivalent rotor kinetic energy of the entire system can be calculated. A summary is shown in Table 3.
Table 3.
The evaluation results of equivalent rotor kinetic energy for the system as a whole.
- (2)
- Evaluation of inertia distribution
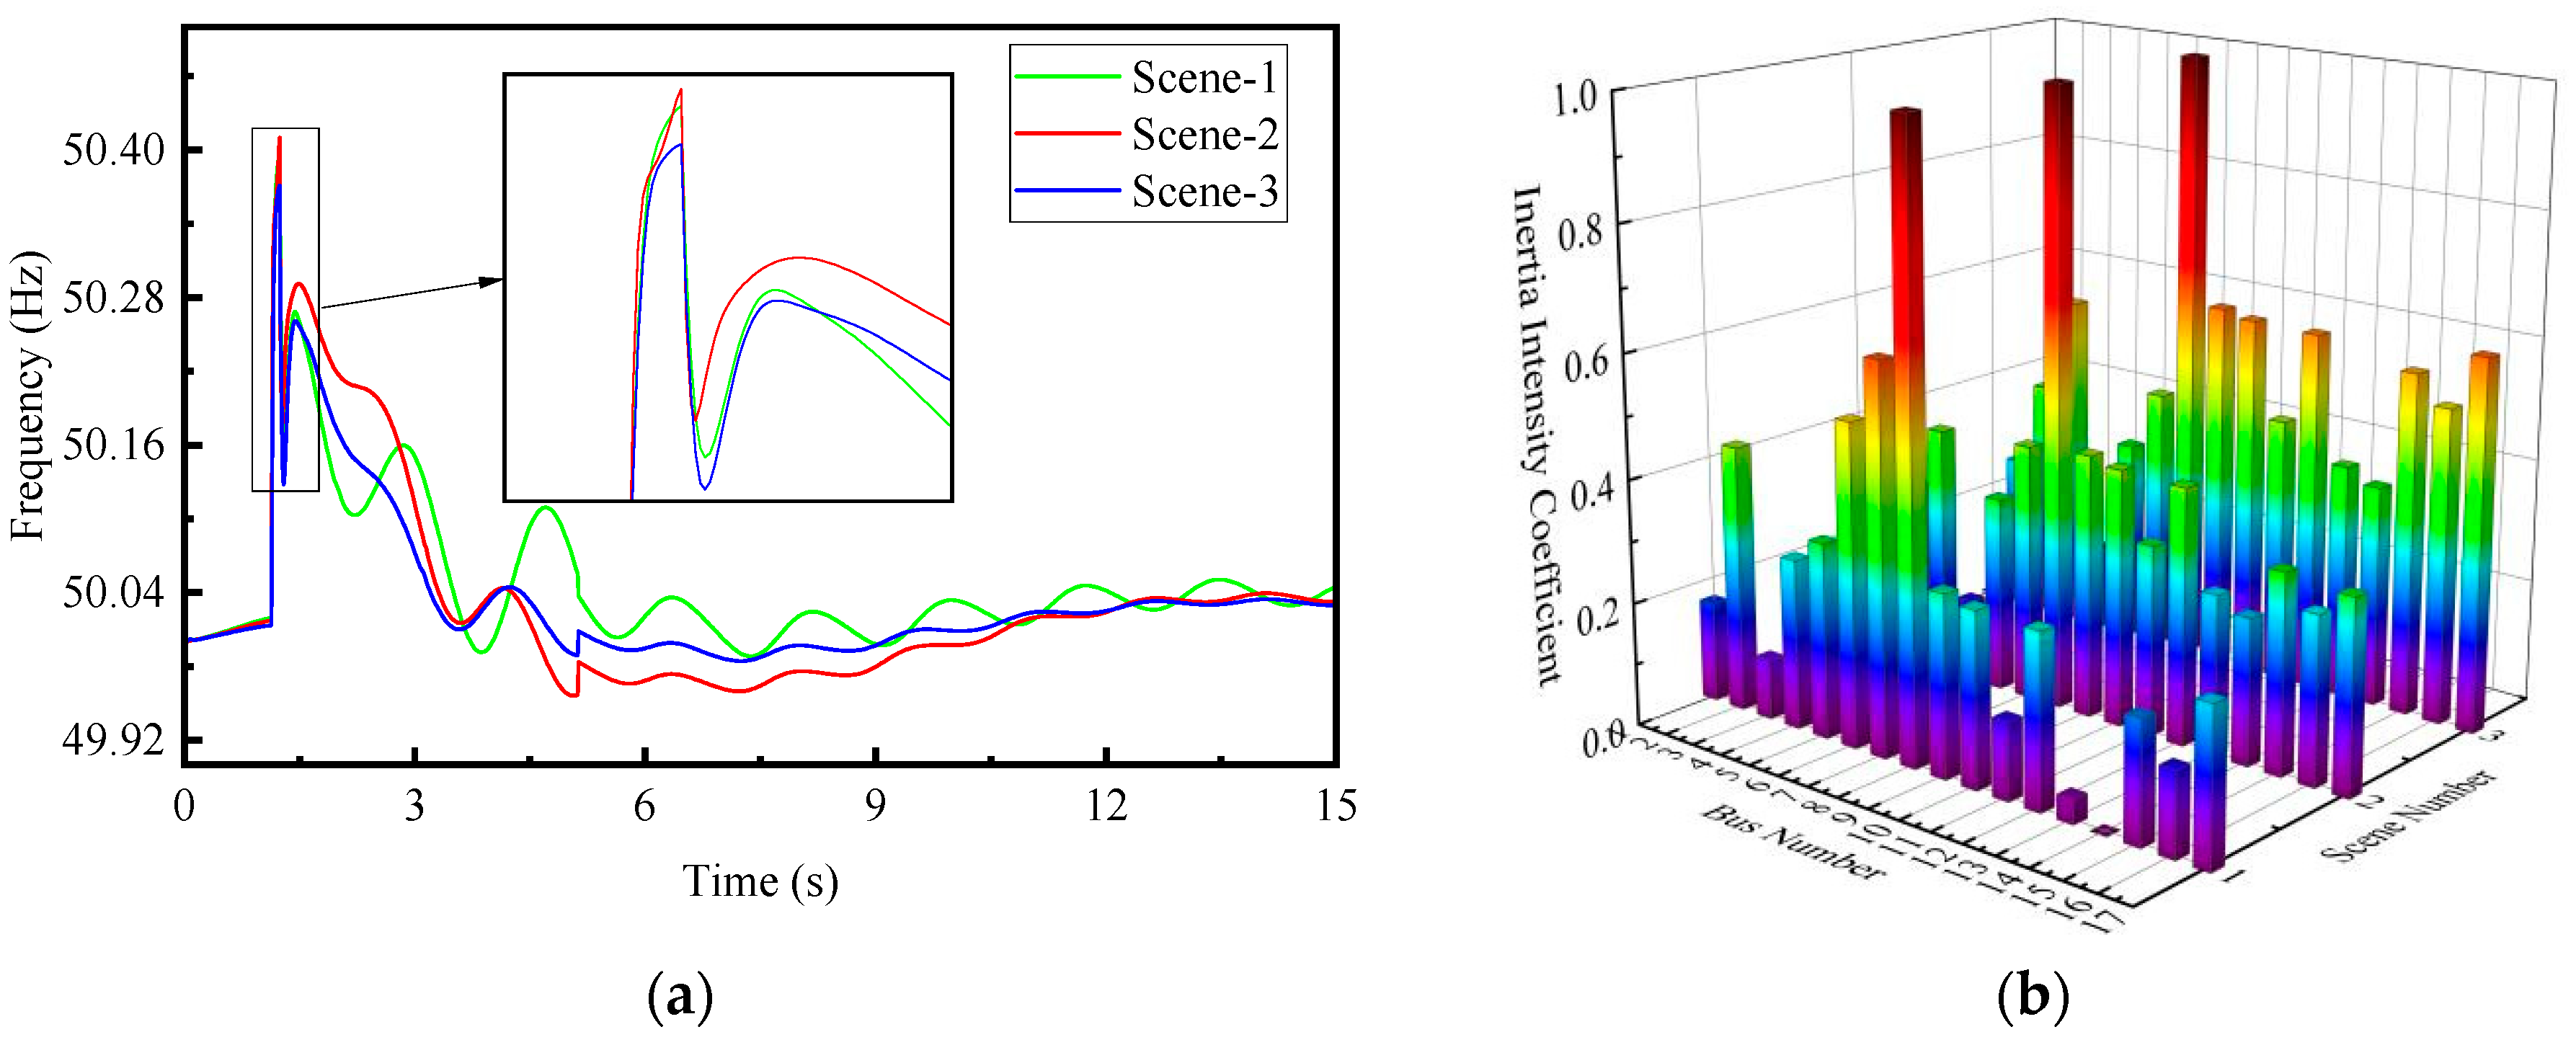
The frequency of each generator busbar can be measured. By combining the equivalent inertia constants and rated capacities of each power generation unit that is available, and substituting them into Formula (13), the inertia center frequency can be calculated. The results are summarized in Figure 9a.
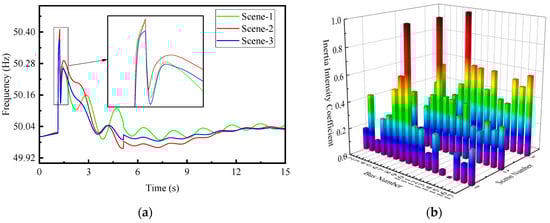
Figure 9.
The assessment results of the inertia distribution: (a) the calculation result of the center frequency of inertia; (b) the calculation results of the inertia strength coefficients of each busbar.
After determining the center frequency of inertia, the frequency offset of each bus can be calculated by Formula (15) (the evaluation time is set to 1 s after the simulation starts and the evaluation duration is 4 s). Then, substituting it into Formula (16), the inertia strength coefficient of each bus can be calculated. The summary is shown in Figure 9b, and the specific data are given in Table 4.
Table 4.
Specific data of inertia distribution assessment.
6. Conclusions
To alleviate the problems of low inertia and weak support in the new power system, virtual inertia has emerged. The proposed virtual inertia transformation scheme in this paper realizes the use of energy sources such as energy storage as inertia responses by reconfiguring the coupling relationship between output power and grid frequency. This can effectively suppress frequency fluctuations and improve the stability of system operation; the maximum frequency deviation has been suppressed by 20% to 31%. After virtual inertia transformation, in addition to the rotor of synchronous generators, inertia support can also be provided by energy storage with VSM control. Therefore, the equivalent inertia evaluation method proposed in this paper starts from the perspective of inertia carriers and evaluates the equivalent inertia of high-penetration distributed photovoltaic power generation connected to the grid, based on the calculation of the equivalent inertia of each power generation unit. The results show that the equivalent inertia evaluation method proposed in this paper can effectively reflect the overall inertia level and inertia distribution trend of the system.
Author Contributions
Conceptualization, H.Y.; formal analysis, S.G. and J.L.; funding acquisition, H.Y.; investigation, S.G. and J.L.; methodology, H.Y.; project administration, H.Y.; software, S.G.; supervision, J.L.; validation, S.G.; visualization, J.L.; writing—original draft preparation, H.Y.; writing—review and editing, H.Y. All authors have read and agreed to the published version of the manuscript.
Funding
The headquarters-level scientific and technological project of the China State Grid Corporation of China, titled “Research on the Construction Technology of Large-scale Distributed Photovoltaic Operation Modes Based on Resources and Predictive Information” (4000-202355095A-1-1-ZN).
Data Availability Statement
All data in this study are confidential and will not be publicly disclosed.
Conflicts of Interest
H.Y. was employed by China Electric Power Research Institute Co., Ltd. The remaining authors declare that the research was conducted in the absence of any commercial or financial relationships that could be construed as a potential conflict of interest.
References
- Zhang, Z.G.; Kang, C.Q. Challenges and Prospects of Building a New Power System under the Goal of Carbon Neutrality. Proc. CSEE 2022, 42, 2806–2819. [Google Scholar]
- Shu, Y.B.; Chen, G.P.; He, J.B.; Zhang, F. Research on the Framework of a New Power System with New Energy as the Main Body. Proc. CSEE 2021, 23, 61–69. [Google Scholar]
- Han, X.Q.; Li, T.J.; Zhang, D.X.; Zhou, X. New Issues and Key Technologies in the Planning of New Power Systems under the Dual Carbon Goals. High Volt. Tech. 2021, 47, 3036–3046. [Google Scholar]
- Wen, Y.F.; Yang, W.F.; Wang, R.H.; Xu, W.T.; Ye, X. Review and outlook for building a 100 per cent renewable energy power system. Proc. CSEE 2020, 40, 1843–1856. [Google Scholar]
- Tielens, P.; Van, H.D. The relevance of inertia in power systems. Renew. Sustain. Energy Rev. 2016, 55, 999–1009. [Google Scholar] [CrossRef]
- Lu, X.Z.; Jiang, J.H.; Qiao, Y. Review of generalized inertia analysis and optimization of new power system. Chin. J. Electr. Eng. 2023, 43, 1754–1776. [Google Scholar]
- Sun, H.D.; Wang, B.C.; Li, W.F.; Yang, C.; Wei, W.; Zhao, B. A study of the inertia system for the frequency response of high ratio power electronic power systems. Proc. CSEE 2020, 40, 5179–5192. [Google Scholar]
- Prabhakar, K.; Jain, S.K.; Padhy, P.K. Inertia estimation in modern power system: A comprehensive review. Electr. Power Syst. Res. 2022, 211, 1–17. [Google Scholar] [CrossRef]
- Cheema, K.M. A comprehensive review of virtual synchronous generator. Int. J. Electr. Power Energy Syst. 2020, 120, 1–10. [Google Scholar] [CrossRef]
- Meng, X.; Liu, J.; Liu, Z. A generalized droop control for grid-supporting inverter based on comparison between traditional droop control and virtual synchronous generator control. IEEE Trans. Power Electron. 2018, 34, 5416–5438. [Google Scholar] [CrossRef]
- Zhu, H.X.; Shang, L.; Wang, Z. Fault Recovery Analysis Based Droop Control Strategy for Constituent Grid Converter. Power Grid Technol. 2024, 1–11. [Google Scholar]
- Wang, Y.J.; Yang, L.B.; Ma, B.; Yu, R. Coordinated Optimisation of Inertia and Damping Coefficients for Virtual Synchronous Machines. Power Syst. Prot. Control. 2022, 88–98. [Google Scholar]
- Elwakil, M.M.; El, Z.H.M.; Sharaf, S.M. Adaptive virtual synchronous generator control using optimized bang-bang for Islanded microgrid stability improvement. Prot. Control. Mod. Power Syst. 2023, 8, 1–21. [Google Scholar] [CrossRef]
- Cheng, C.; Yang, H.; Zeng, Z.; Tang, S.Q.; Zhao, R.X. Adaptive control of rotor inertia for virtual synchronous generators. Autom. Electr. Power Syst. 2015, 82–89. [Google Scholar]
- Liu, Z.C.; Zhou, T.; Chen, Z.; Wang, Y.; Wang, Y.L. Minimum inertia demand estimation of new power system considering diverse inertial resources based on deep neural network. IET Energy Syst. Integr. 2023, 5, 80–94. [Google Scholar]
- Gu, H.; Yan, R.; Saha, T.K. Minimum synchronous inertia requirement of renewable power systems. IEEE Trans. Power Syst. 2017, 33, 1533–1543. [Google Scholar] [CrossRef]
- Rawn, B.G.; Gibescu, M.; Kling, W.L. Kinetic energy from distributed wind farms: Technical potential and implications. In Proceedings of the 2010 IEEE PES Innovative Smart Grid Technologies Conference Europe (ISGT Europe), Gothenburg, Sweden, 11–13 October 2010; pp. 1–8. [Google Scholar]
- Yan, C.; Tang, Y.; Dai, J.; Wang, C.; Wu, S. Uncertainty Modeling of Wind Power Frequency Regulation Potential Considering Distributed Characteristics of Forecast Errors. Prot. Control. Mod. Power Syst. 2021, 6, 1–13. [Google Scholar] [CrossRef]
- Xing, X.L.; Li, R.; Lai, X.L. A theoretical power calculation method for wind farms based on cluster division and Leonov’s inverse arra. Electrotechnics 2024, 59–64. [Google Scholar]
- Song, X.L.; Liu, Y.K.; Wu, Y.Y.; Guo, L. A data-driven theoretical power calculation method for photovoltaic power stations. Yunnan Electr. Power Technol. 2023, 51, 21–25. [Google Scholar]
- Wang, Z.; Liu, C.; Feng, S.L.; Wang, W.S. Theoretical power calculation method for wind farms based on non-parametric regression. Power Grid Technol. 2015, 39, 2148–2153. [Google Scholar]
- Luo, F.; Rao, J.X.; Wang, J.L.; Li, L.Q.; Chen, Y. Online assessment of the state of charge of energy storage batteries based on FFRLS-UKF. Sichuan Electr. Power Technol. 2025, 48, 47–56. [Google Scholar]
- Yang, L.; Lan, Y.X.; Lin, L. Evaluation of Energy Storage Virtual Inertia and Frequency Support Technology in Wind Energy Storage System. Zhejiang Electr. Power 2024, 52–60. [Google Scholar]
- Li, X.H.; Xiao, Y.Z.; Tian, Z.G.; Wang, J.; Li, J.J. Evaluation of the State of Charge of Energy Storage Lithium-Ion Battery Packs Based on PSO-CNN. Chin. J. Power Sources 2024, 48, 685–692. [Google Scholar]
- Huang, J.K.; Yang, Z.F.; Yu, J.; Li, Z.H.; Liu, Y.L. A Fast Frequency Response Low-Order Modeling Method for Wind Turbines for Frequency Stability Verification and Its Error Analysis. Proc. CSEE 2022, 18, 6752–6766. [Google Scholar]
- Li, S.C.; Liu, J.C.; Liu, M.E.; Yang, T.; Liu, L.; Li, Z.X. Seasonal Equivalent Inertia Short-Term Prediction Based on BiLSTM Multi-Algorithm Hybrid Neural Network Model. South. Power Grid Technol. 2025, 1–12. [Google Scholar]
- Zhang, B.; Zhang, C.J.; Zhang, J.; Wang, L.; Li, T.C. A rapid tracking method for the inertia constant of the new energy power system based on system identification. Power Autom. Equip. 2025, 45, 163–170. [Google Scholar]
- Liu, Y.G.; Wang, J.W.; Wu, J.B. An online estimation method for equivalent inertia of power grid based on augmented recursive least squares. Hunan Electr. Power 2024, 40–46. [Google Scholar]
- Mo, R.; Deng, X.Y.; Lin, H.; Liu, M.Y. Research on the Estimation Method of Aggregate Power Equivalent Inertia Constants Based on PMU Measurements at Collection Points. Smart Power 2023, 9, 81–87. [Google Scholar]
- Zeng, H.; Yu, C.Y.; Li, Z.W.; Zhang, Q.; Li, W.D. A practical and rapid estimation method for regional power grid inertia. Power Syst. Prot. Control. 2023, 51, 180–187. [Google Scholar]
- Li, D.D.; Dong, N.; Yao, Y.; Xu, B. Considering the dispersion of frequency response and the estimation of equivalent inertia of wind power systems in system partitioning. Power Syst. Prot. Control. 2023, 51, 36–45. [Google Scholar] [CrossRef]
- Cheng, D.Y.; Ma, H.; Qin, H.; Cao, Y.J.; Yang, D.; Zhang, B. An equivalent inertia assessment method for power systems based on quasi-steady-state data. Mod. Electr. 2023, 40, 434–440. [Google Scholar]
- Wang, T.; Xing, Q.P.; Li, H.E. Analysis of Online Evaluation and Response Characteristics of DFIG Equivalent Inertia Considering Virtual Inertia Control. Power Syst. Prot. Control. 2022, 52–60. [Google Scholar]
- Doherty, R.; Mullane, A.; Nolan, G.; Burke, D.J.; Bryson, A.; O’Malley, M. An Assessment of the Impact of Wind Generation on System Frequency Control. IEEE Trans. Power Syst. 2010, 25, 452–460. [Google Scholar] [CrossRef]
- Chang, W.; Liu, X.; Zhou, M.; Gao, J.; Han, Z. Least Squares Based Renewable Energy-Enrich Regional Inertia Evaluation Method for Interconnected Power Systems. In Proceedings of the 2023 IEEE 6th International Conference on Automation, Electronics and Electrical Engineering (AUTEEE), Shenyang, China, 15–17 December 2023; pp. 659–664. [Google Scholar]
- Panda, R.K.; Mohapatra, A.; Srivastava, S.C. Online Estimation of System Inertia in a Power Network utilizing Synchrophasor Measurements. In Proceedings of the 2021 IEEE Power & Energy Society General Meeting (PESGM), Washington, DC, USA, 26–29 July 2021; p. 1. [Google Scholar]
- Rakhshani, E.; Gusain, D.; Sewdien, V.; Torres, J.L.R.; Van Der Meijden, M.A.M.M. A Key Performance Indicator to Assess the Frequency Stability of Wind Generation Dominated Power System. IEEE Access 2019, 7, 130957–130969. [Google Scholar] [CrossRef]
- Ma, Q.; An, S.; Liu, M.; Jiao, J.; Zhou, T.; Song, D. Minimum Inertia Estimation of Power System Considering Frequency Modulation Characteristics of Wind Power-Photovoltaic-Energy Storage. In Proceedings of the 2022 4th International Conference on Electrical Engineering and Control Technologies (CEECT), Shanghai, China, 16–18 December 2022; pp. 968–973. [Google Scholar]
- Yun, W.F.; Lin, X.H. Assessment of minimum inertia requirements for microgrids in islanded versus grid-forming mode. Chin. J. Electr. Eng. 2021, 2040–2053. [Google Scholar]
- Li, D.D.; Zhang, J.L.; Xu, B.; Zhao, Y.; Yang, F. Evaluation of equivalent inertia of new energy power systems considering frequency distribution characteristics. Power Grid Technol. 2020, 44, 2913–2921. [Google Scholar]

Disclaimer/Publisher’s Note: The statements, opinions and data contained in all publications are solely those of the individual author(s) and contributor(s) and not of MDPI and/or the editor(s). MDPI and/or the editor(s) disclaim responsibility for any injury to people or property resulting from any ideas, methods, instructions or products referred to in the content. |
© 2025 by the authors. Licensee MDPI, Basel, Switzerland. This article is an open access article distributed under the terms and conditions of the Creative Commons Attribution (CC BY) license (https://creativecommons.org/licenses/by/4.0/).