The raw material used in this work is coal liquefaction asphalt. The macro-property analysis of the raw material and the results of elemental analysis are shown in
Table 2 and
Table 3, respectively, which provide reference for the analysis of the composition of subsequent products and reaction mechanism, where HS, HI-TS, TI-QS and QI represent the contents of n-heptane soluble matter; n-heptane insoluble and toluene soluble matter; toluene insoluble and quinoline soluble matter; and quinoline insoluble matter, respectively.
It can be found that the ash content of coal liquefaction asphalt is about 1000 ppm, and the entire experimental design does not consider the influence of changes in the ash content of raw materials on the properties of the products. The oxygen content of raw material is 2.184%, with lower sulfur content, which can be used to determine the degree of change in oxygen content of the product after the oxidative polymerization reaction.
3.4. Multiobjective Optimization
Whether the asphalt is used as spinnable asphalt or coated asphalt, the softening point of the product should not be too high. A too high softening point will make the fluidity of the product worse [
41,
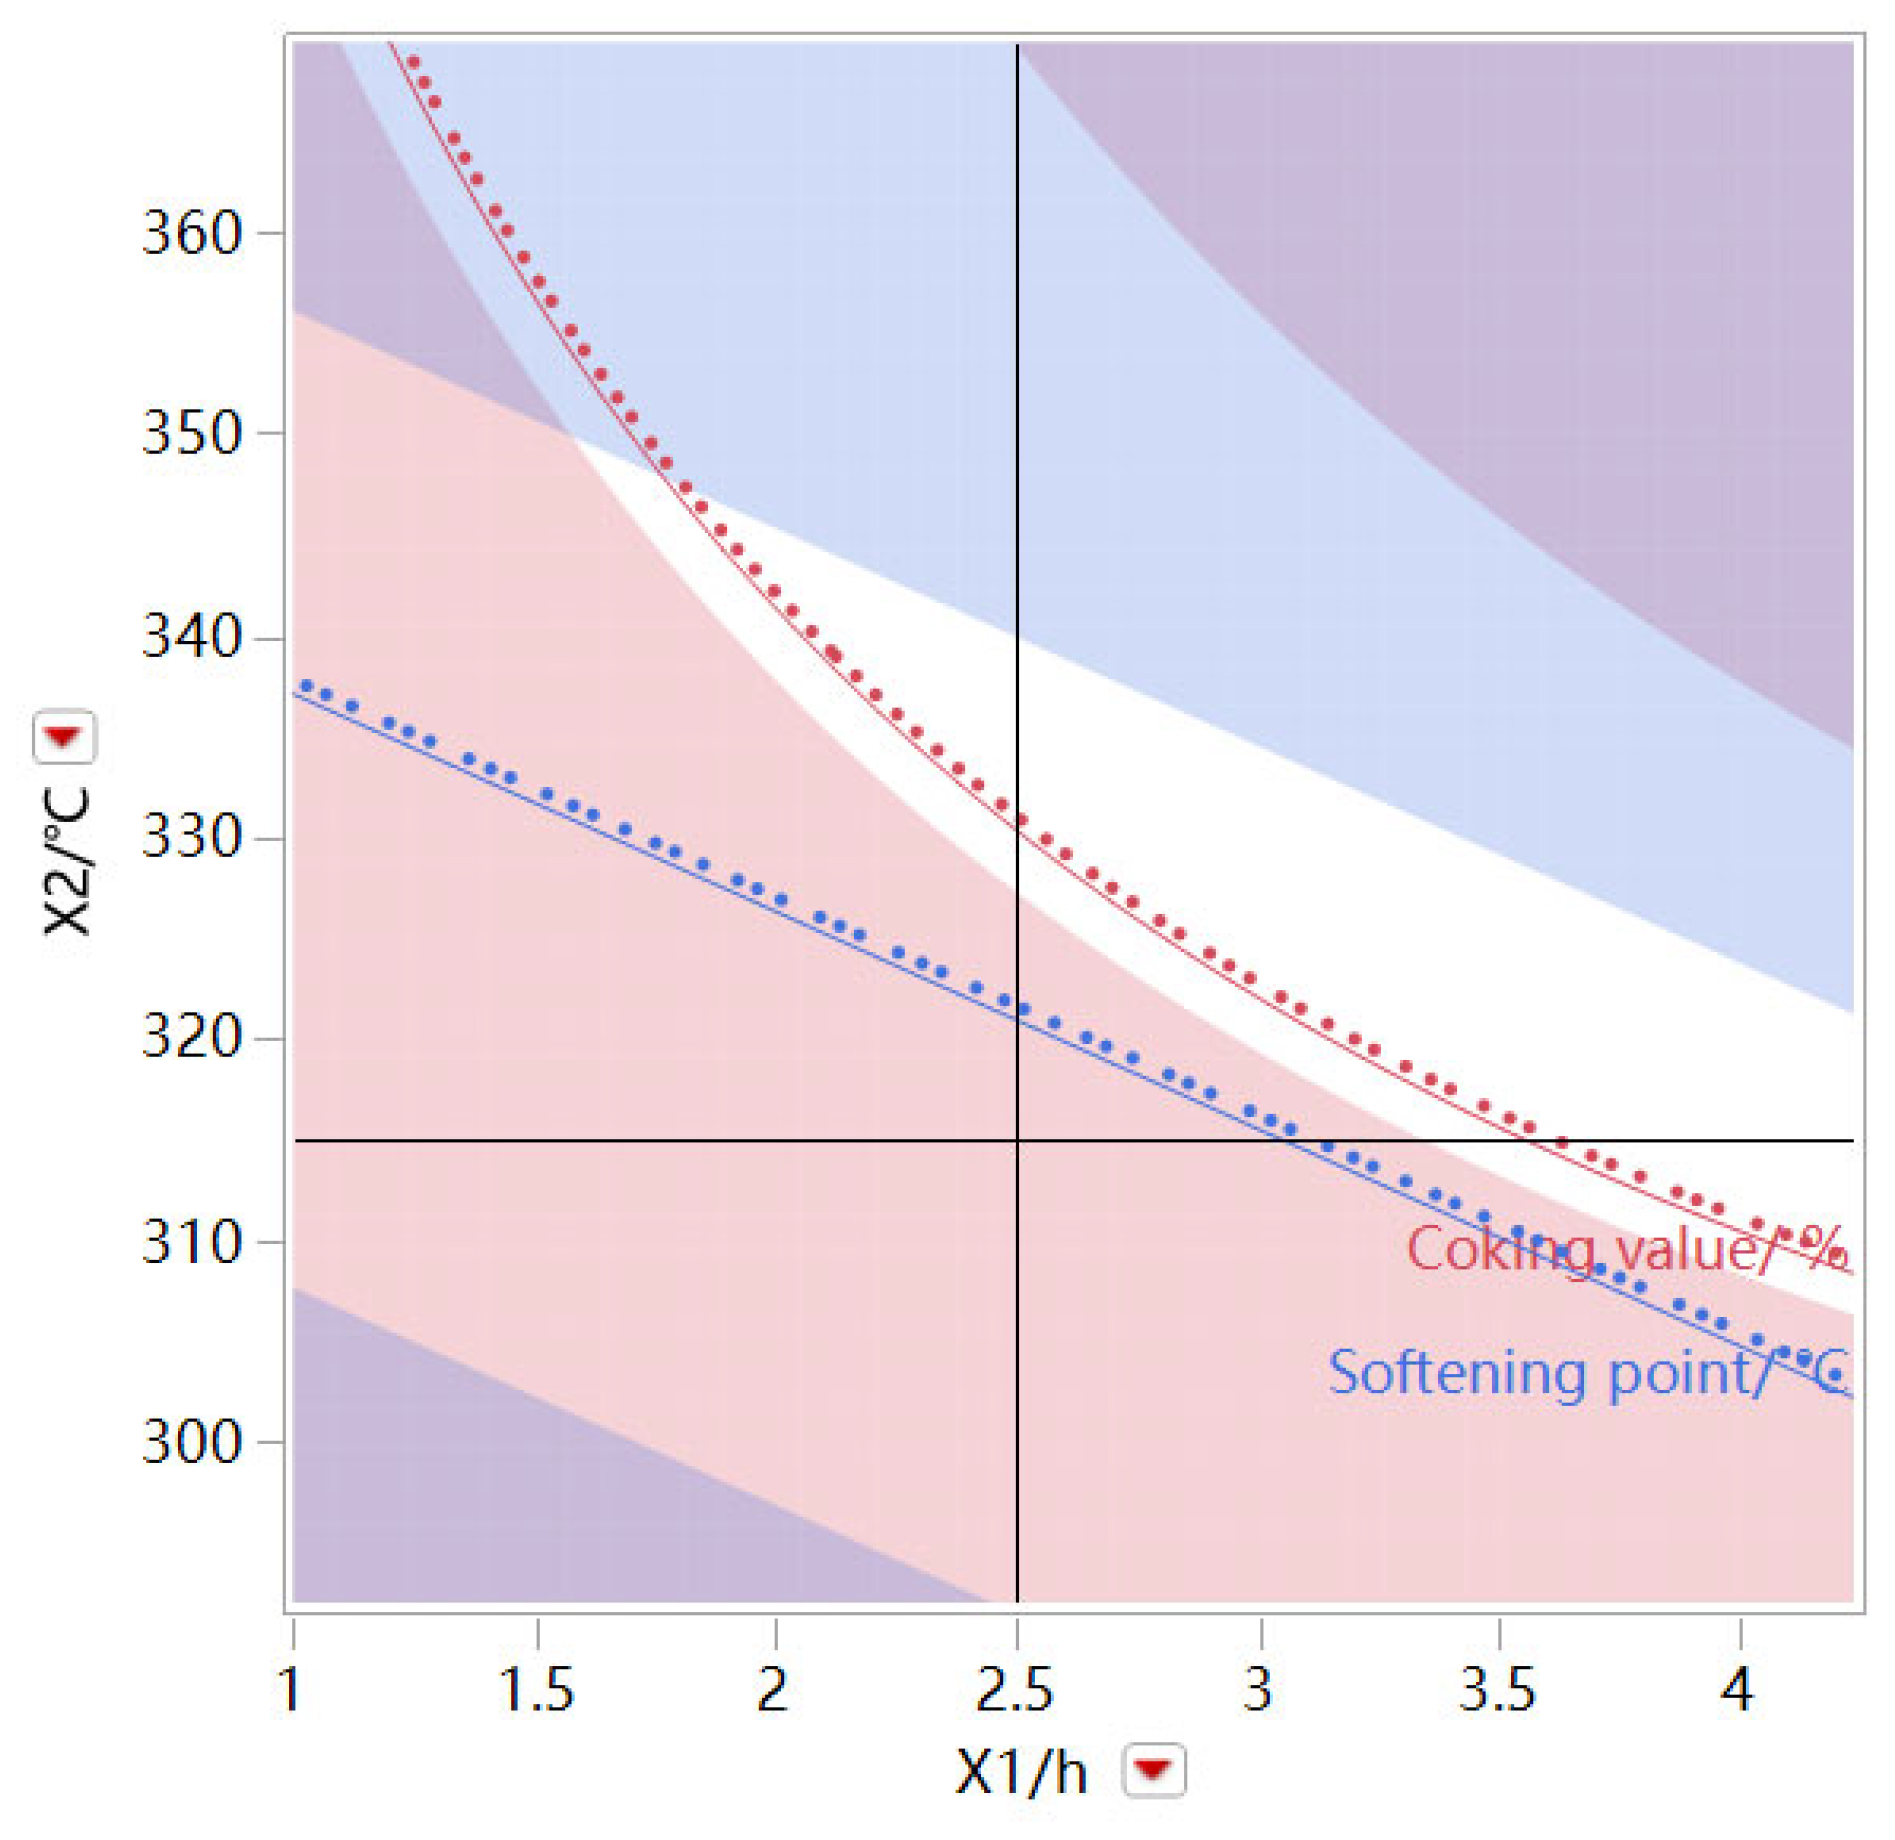
42]. According to the result of the DOE experiment, the softening point of products with a higher coking value is usually higher. Therefore, combined with the downstream application requirements of high softening point asphalt products, it is expected that the softening point of the product is not higher than 310 °C, and the coking value is not higher than 85%. Thus, the upper and lower limits of the two response values and the target values are defined, and the willingness is set by the predictive profiler. After the willingness is maximized, the preparation process parameters satisfying the production of the target product are obtained. Further, a contour profiler is used to provide a range of oxidation process parameters for the production of the target product, as shown in
Figure 7 and
Figure 8.
As shown in
Figure 7, taking the oxidation time and oxidation temperature as variables, the air flow rate is fixed at 1.25 L/min, and the white area is the operational interval of the oxidation time and oxidation temperature, which meets the coking value of the prepared modified asphalt product > 80% and the softening point > 240 °C.
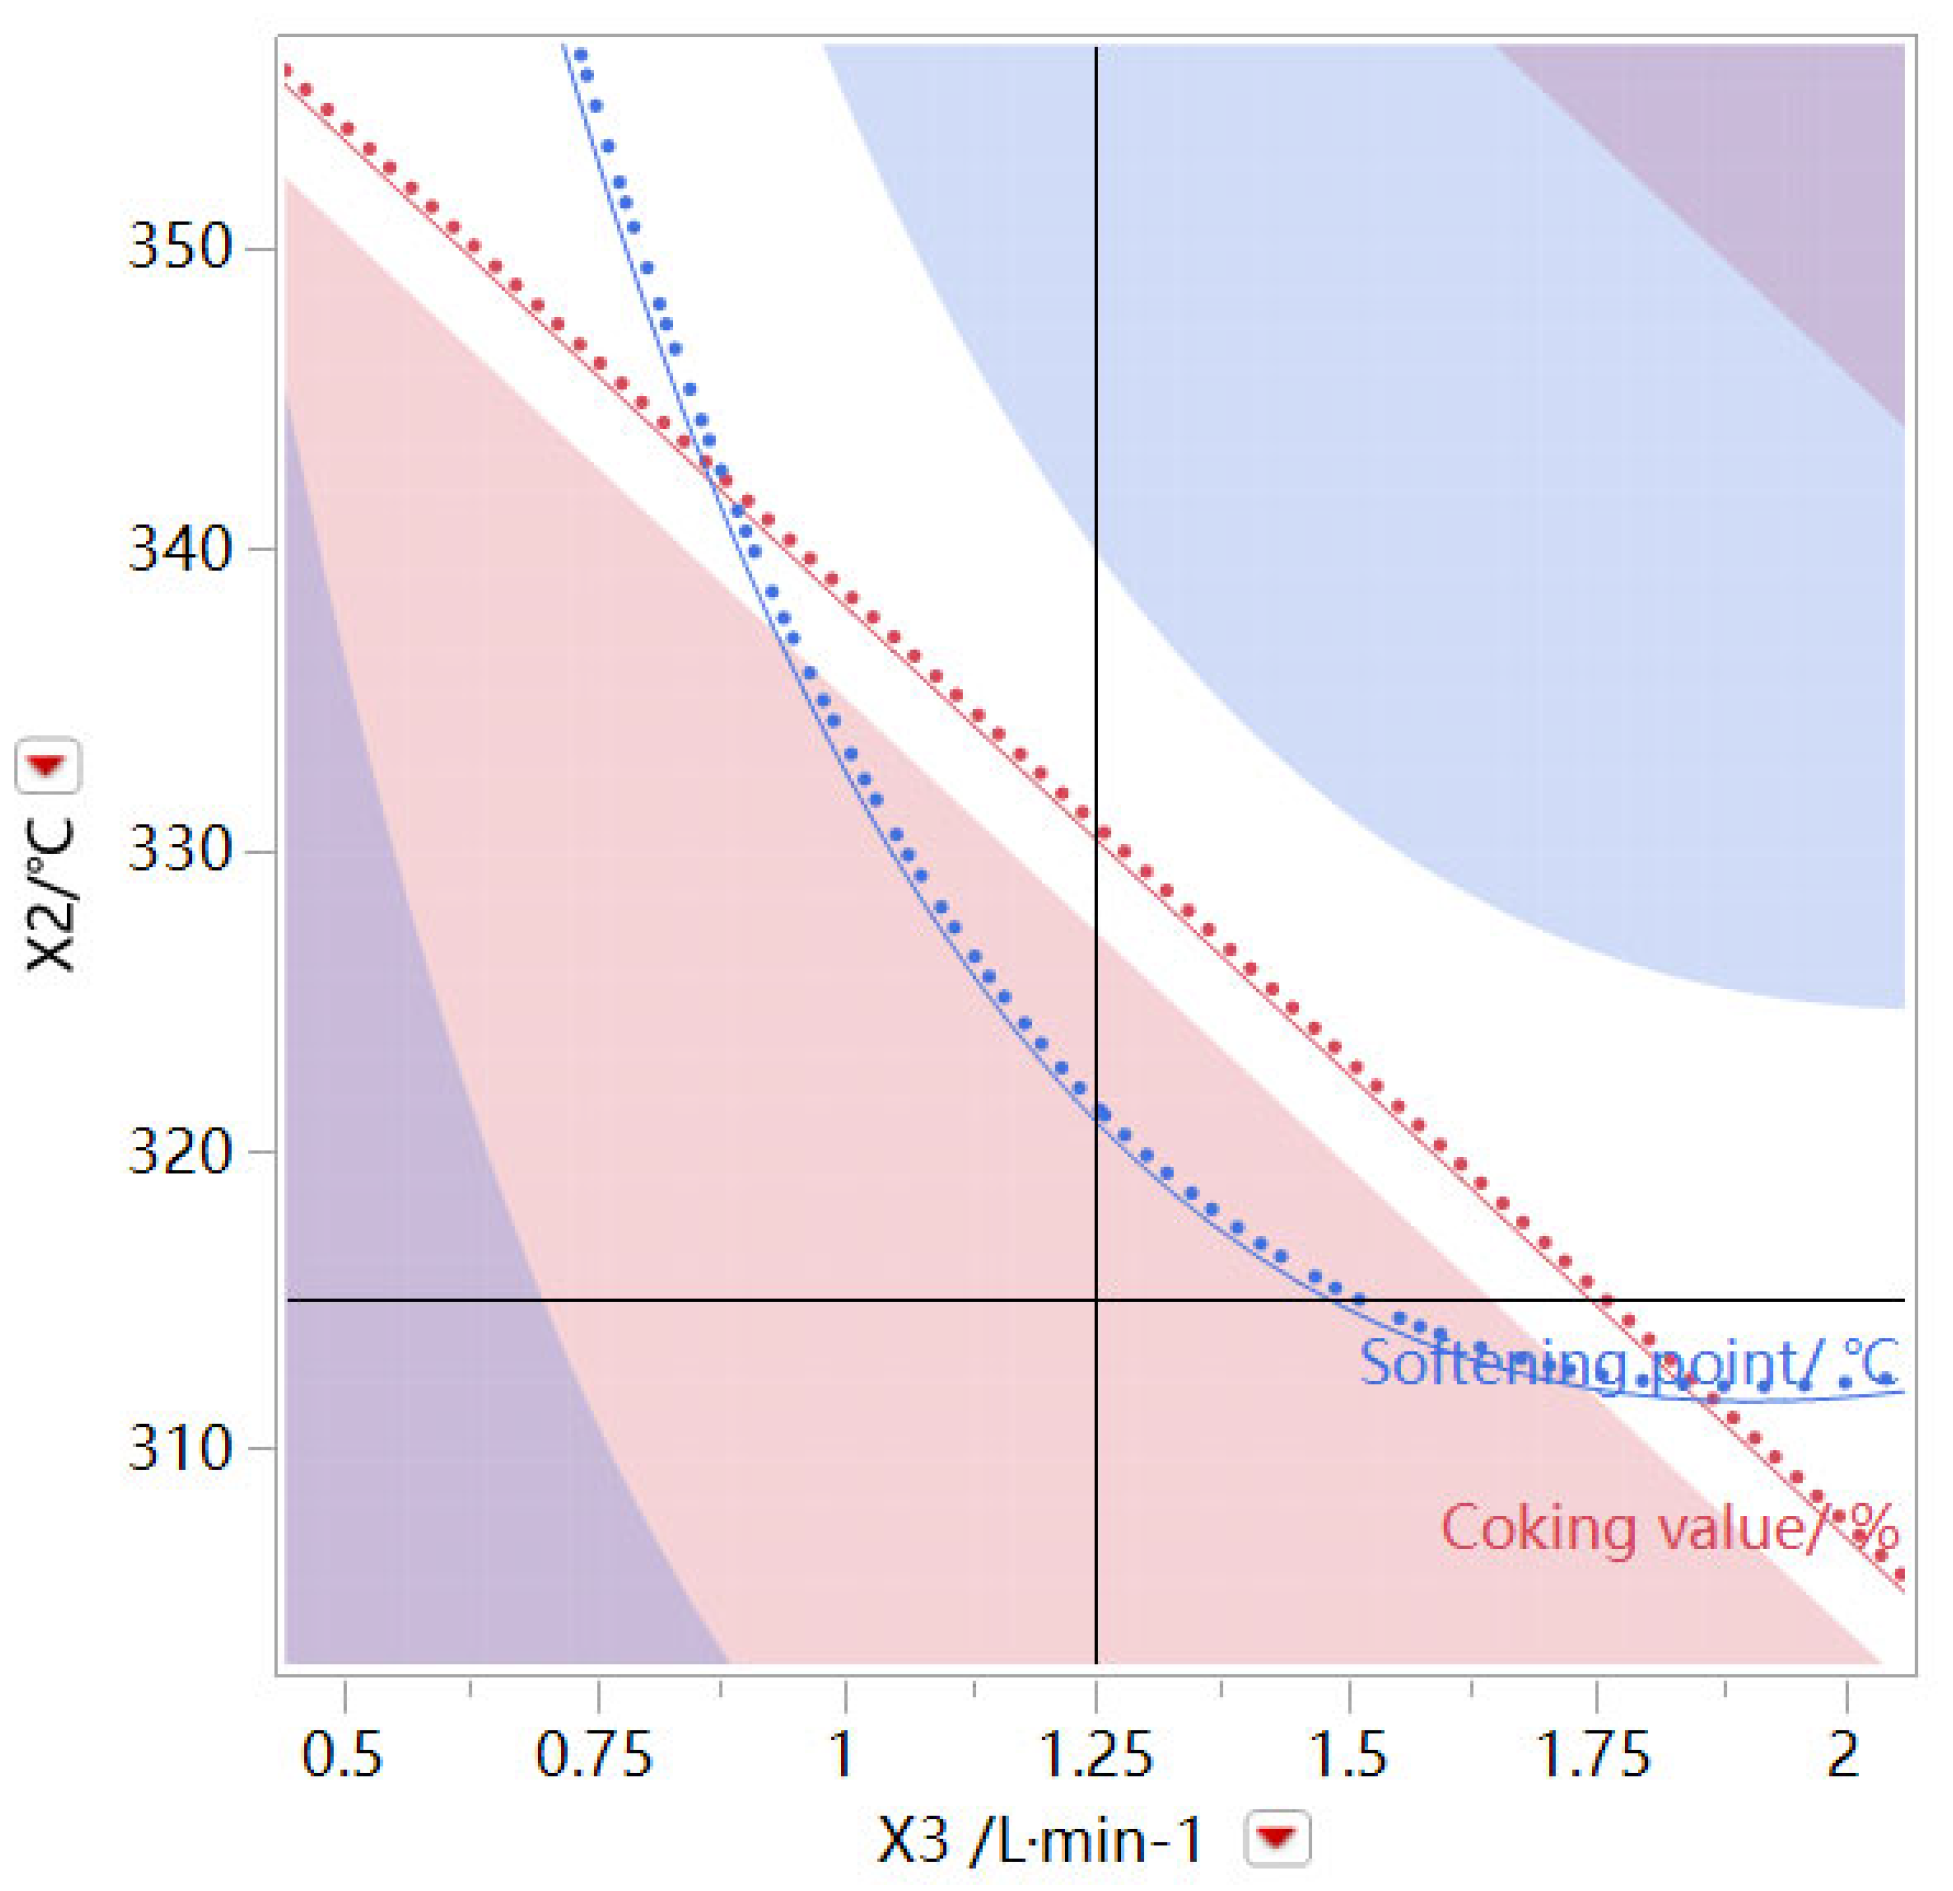
As shown in
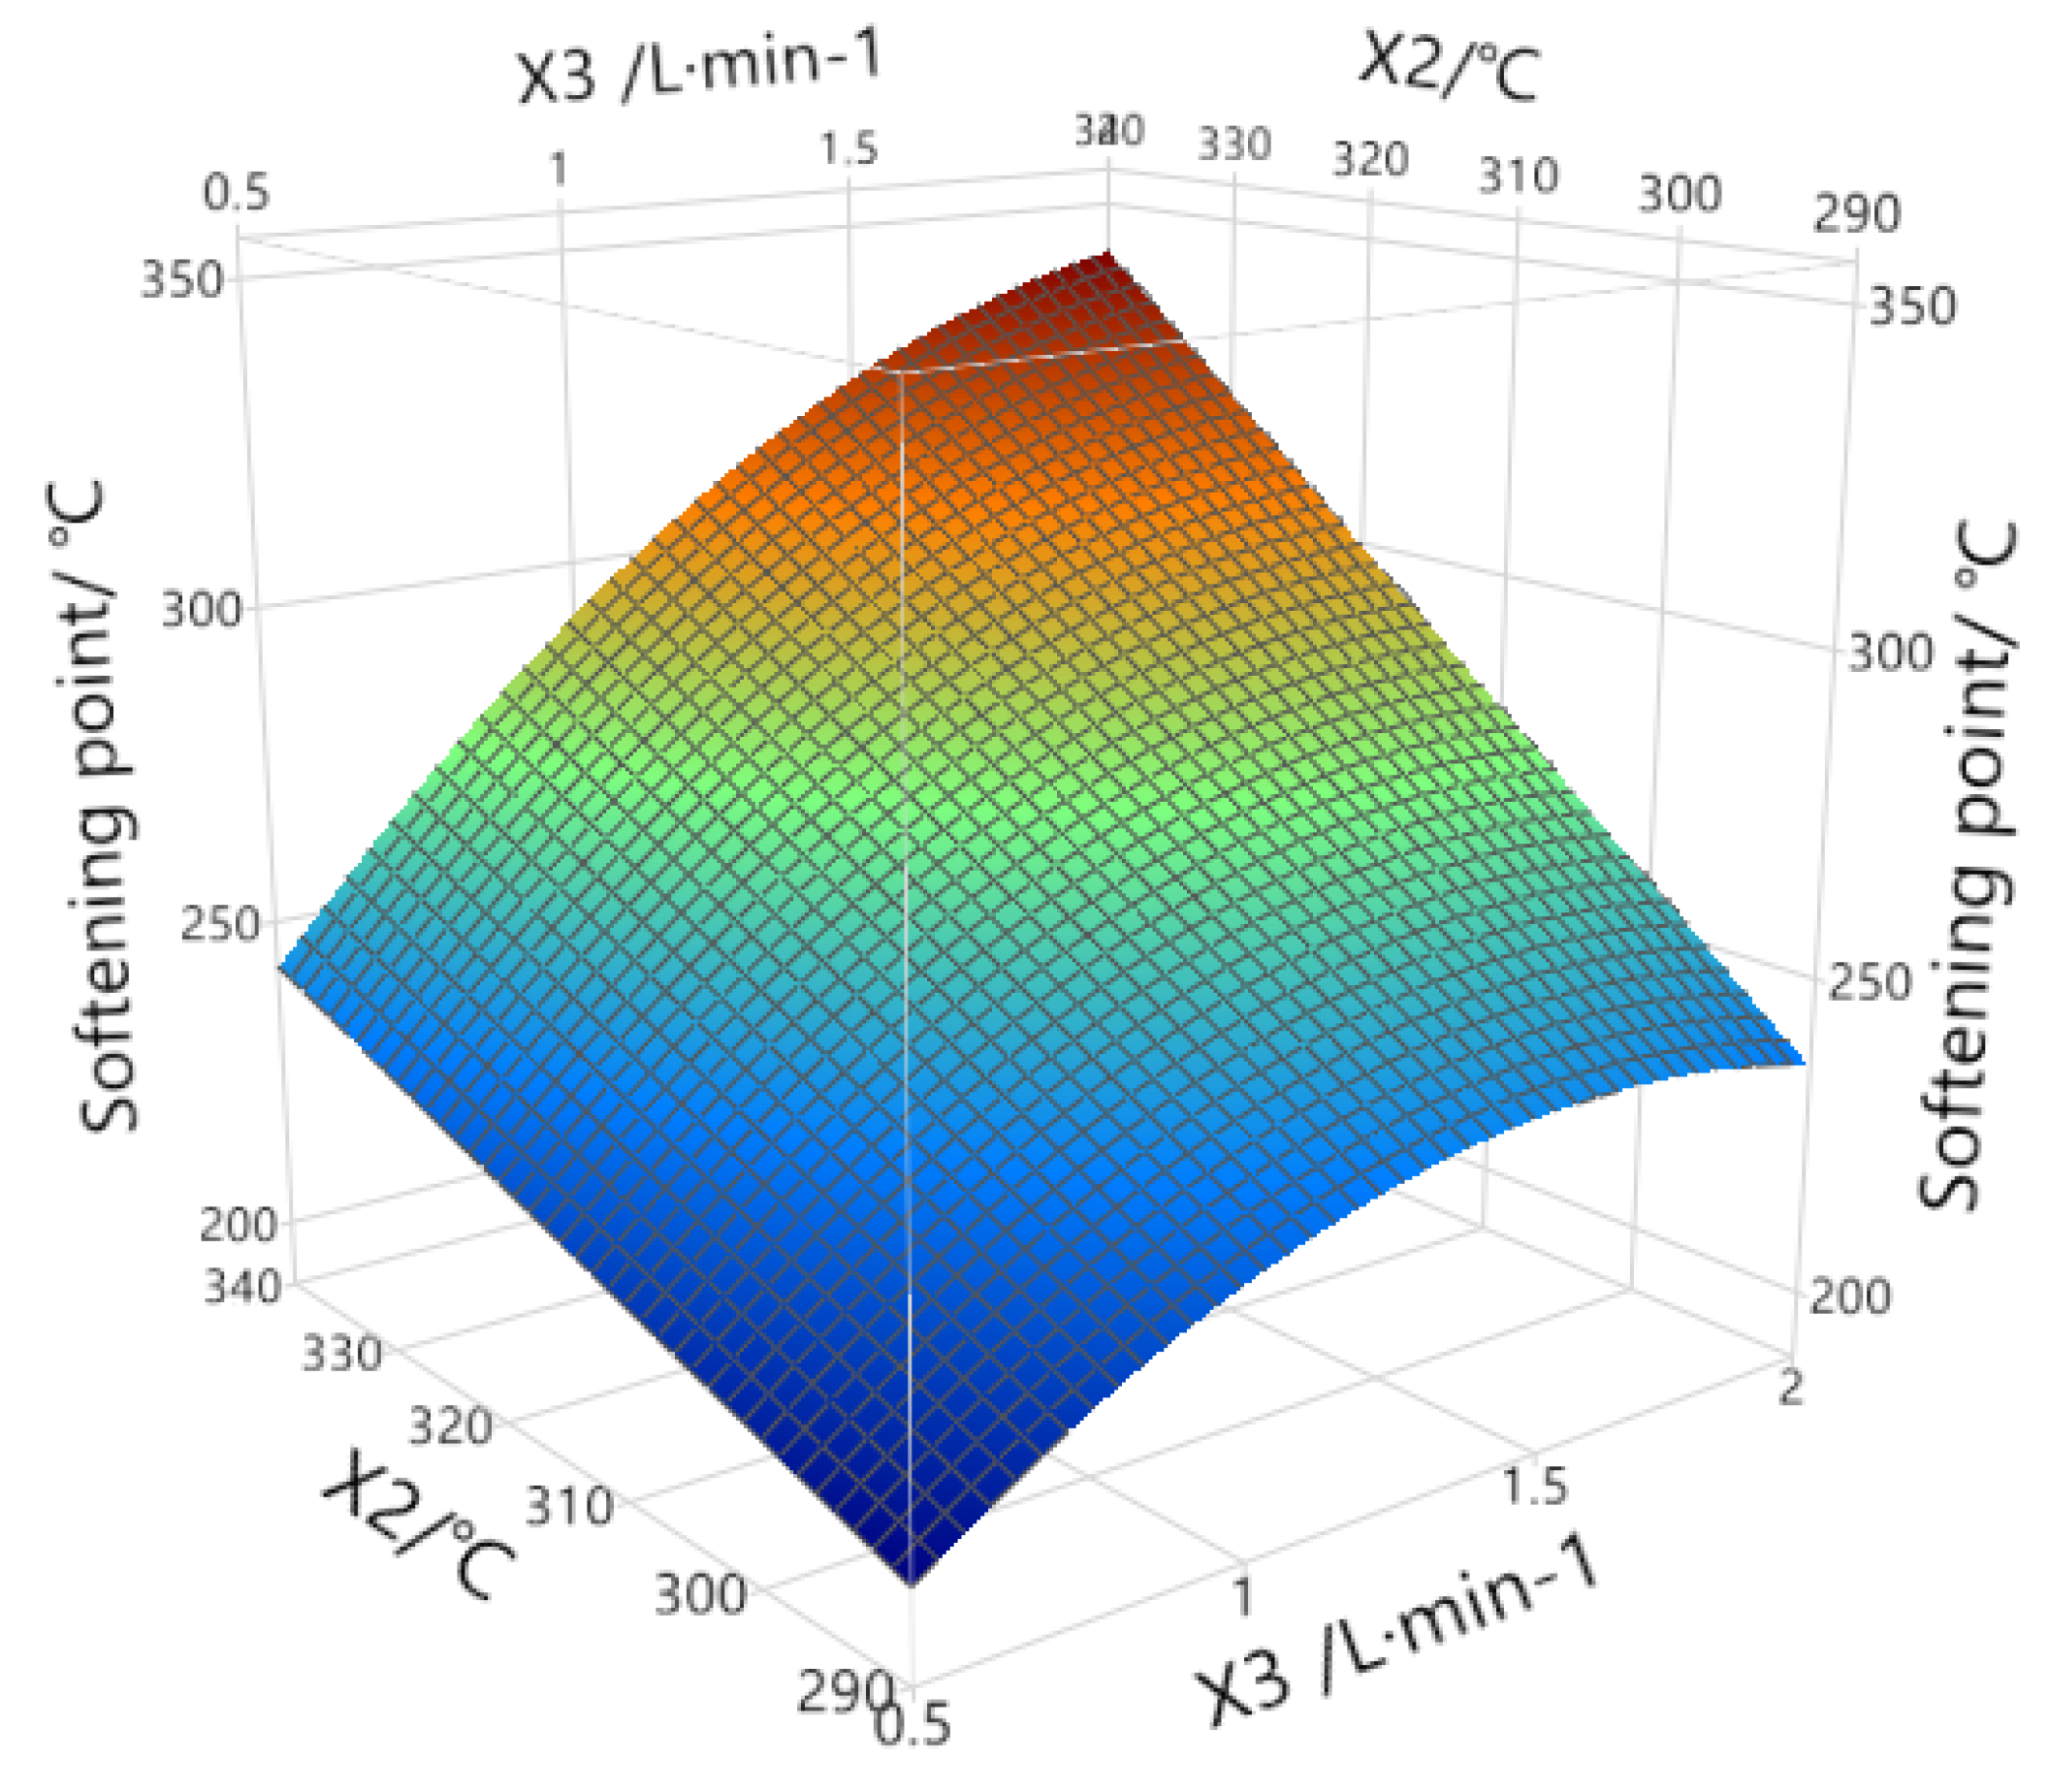
Figure 8, when the oxidation time is fixed at 2.5 h, the oxidation temperature and air flow are taken as operating variables, and the white area is the operational interval of oxidation temperature and air flow, which meets the coking value of the prepared modified asphalt product > 80% and the softening point > 240 °C. This means that high temperature combined with small air flow rate and low temperature combined with large air flow rate meet the requirements. However, it is recommended that the high temperature and low air flow rate be according to the actual experimental operating conditions, and the large air flow rate will reduce the yield of the product. It can be found that the three factors can be operated in a wide range and that the operation window is wide, under the premise of satisfying the product performance index.
Two groups of process parameters were selected within the operable interval to carry out verification experiments, and the results are shown in
Table 7. The coking value and softening point of prepared modified asphalt products were within the predicted interval, indicating that the fitting effect of
Ycoking value and
Ysoftening point models is good and reliable.
3.5. Characterization of Modified Asphalt Products
The asphalts with high softening point were characterized by Fourier infrared test, elemental analysis, C-NMR and MALDI-TOF. As shown in
Figure 9,
Figure 10,
Figure 11,
Figure 12,
Figure 13,
Figure 14,
Figure 15,
Figure 16,
Figure 17,
Figure 18,
Figure 19,
Figure 20,
Figure 21,
Figure 22,
Figure 23,
Figure 24 and
Figure 25, the element content, functional group composition, C/O/N/S binding state, aromatic structure and molecular weight of the product were analyzed, and the relationship between the coking value and softening point of the product and the product composition structure was analyzed, which is helpful to further reveal the mechanism of oxidation.
- (1)
Composition analysis of asphalt products
As shown in
Figure 9, the QI content of modified asphalt obtained after oxidative polymerization is 0.2–30%. When the coking value of the product is bigger than 80% and the softening point is bigger than 240 °C, the QI content is about 1.5%. However, the QI content is smaller than 1% when the coking value of the product is smaller than 78%. The QI content of the corresponding product increases obviously with the increase in the coking value of the product. When the coking value of the product reaches 87%, the QI content of the corresponding product can reach 30%. With the increase in the oxidation polymerization depth, more light components may escape, and oxygen crosslinked products of macromolecules are formed. As the reaction depth continues to increase, oxygen-containing bridging products may also deoxidize, forming more methylene bridging products, changing the polarity and fluidity of the reaction system making the QI content and softening point of the product significantly increase. On the whole, QI content of products showed an increasing trend with the increase in the coking value and softening point.
- (2)
Elemental analysis of asphalt products
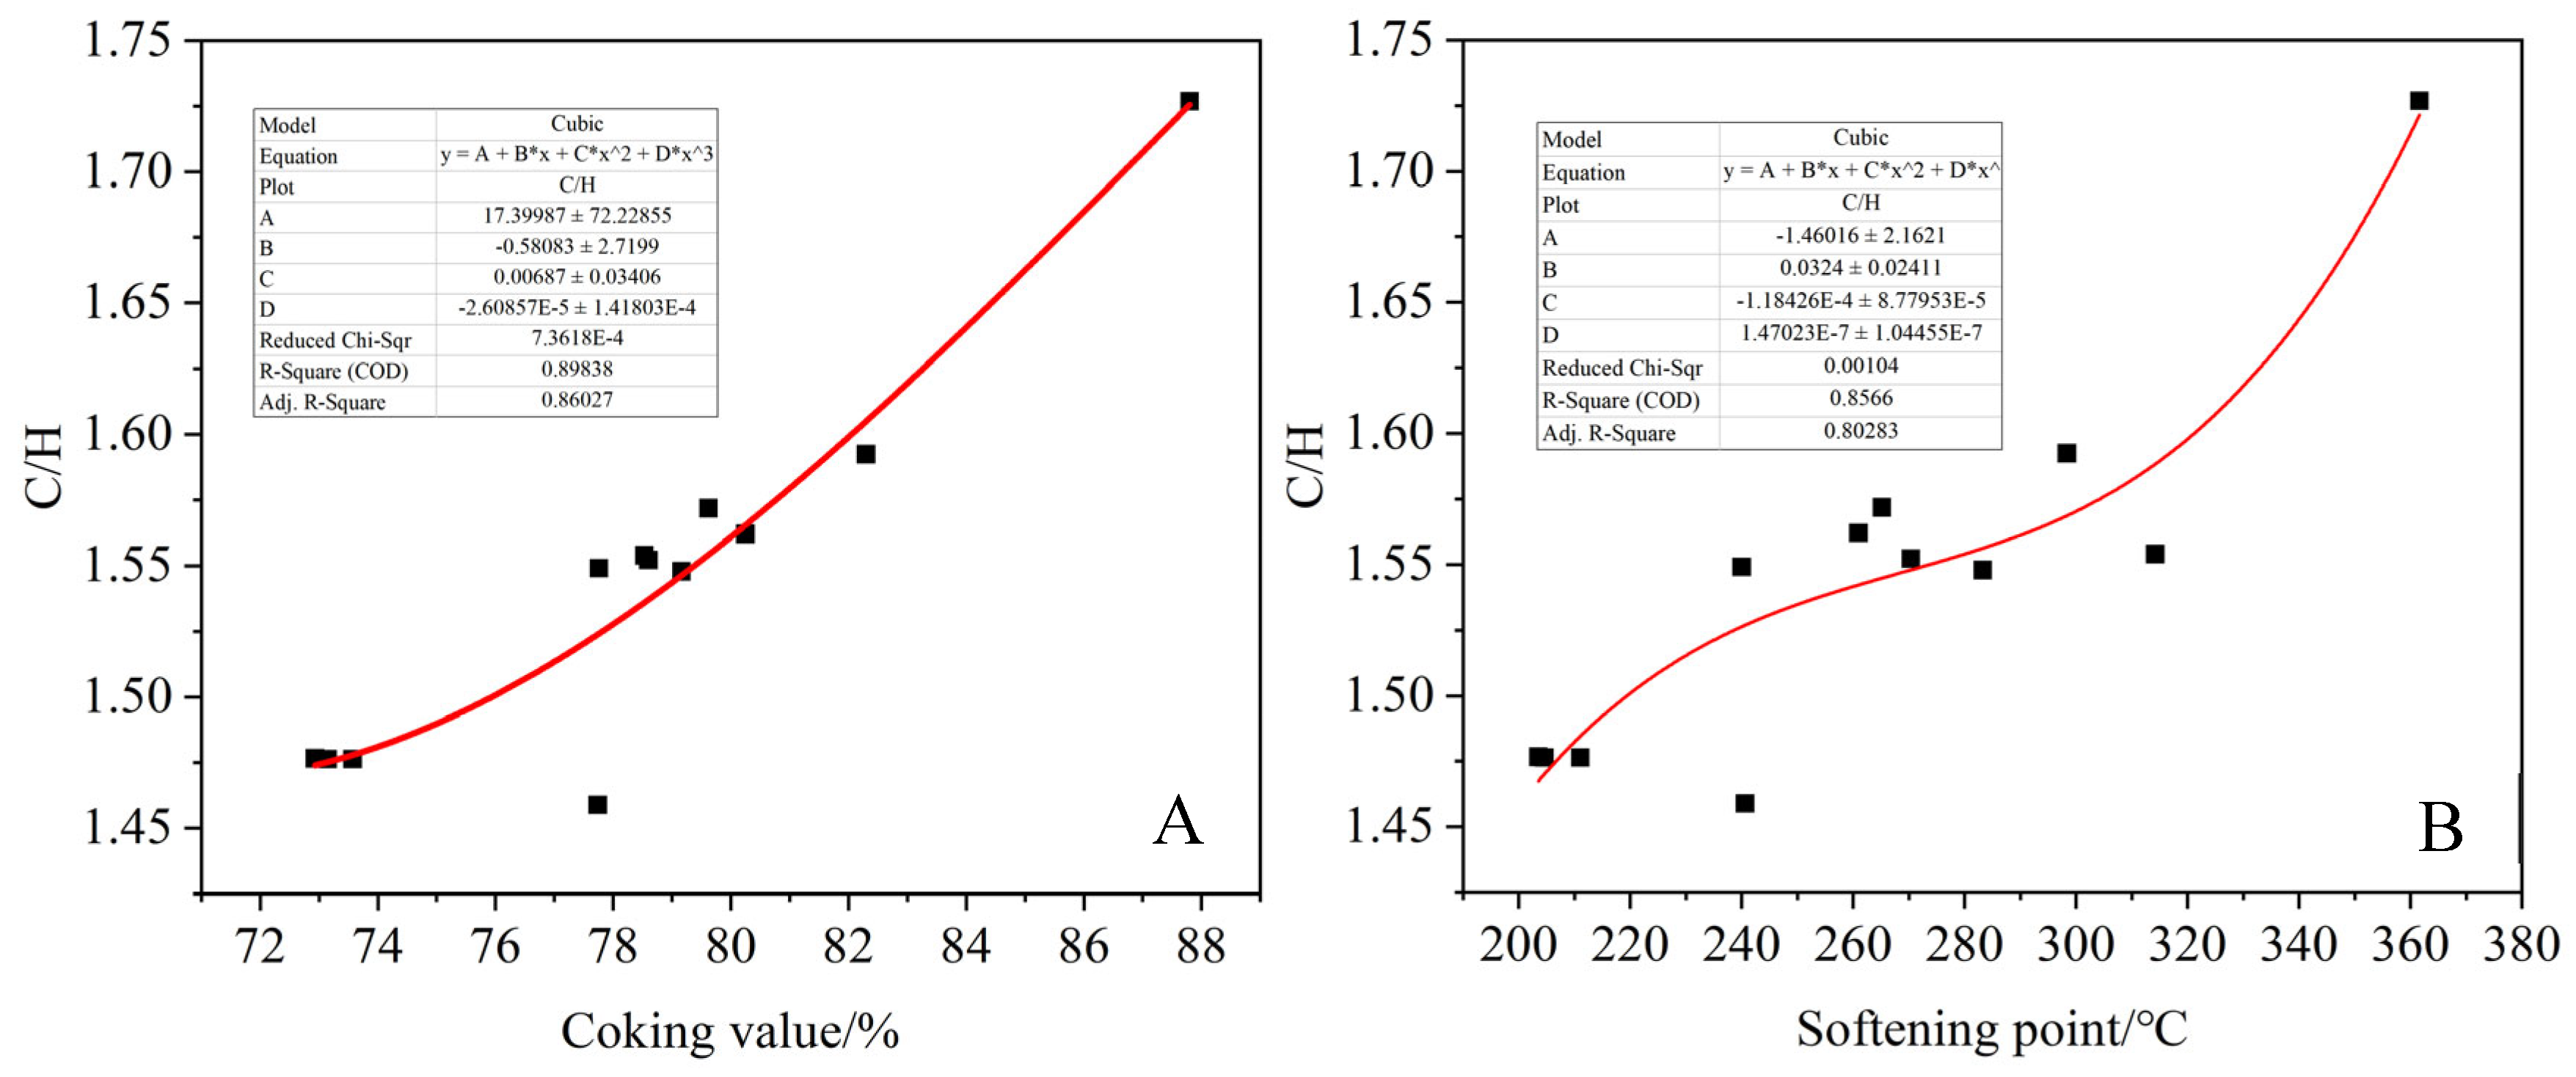
As shown in
Figure 10, the C/H ratio of asphalt products showed an increasing trend with the increase in the coking value and softening point. It can be concluded that the larger the softening point and coking value of the product, the more intense the polymerization reaction, resulting in the formation of more polycyclic aromatic macromolecules. The oxygen content of the product showed a multi-term relationship with the coking value and softening point, and the fitting effect was poor, showing a trend of first increasing and then decreasing, which was consistent with the results of solid C-NMR analysis. It can be indicated that oxidation crosslinking and dealkylation reactions were carried out simultaneously in the reaction process [
43]. As shown in
Figure 11, with the increase in polymerization reaction degree, the oxidation crosslinking reaction is intense, and the oxygen content in the product increases, resulting in the coking value and softening point of the product increasing. As the degree of reaction continues to increase, the generated oxygen bridging product cracks to produce CO or CO
2, and the oxygen content in the asphalt product decreases, resulting in the O/C ratio and the coking value and softening point of the product showing a trend of first increasing and then decreasing [
44].
- (3)
Infrared spectrum analysis of asphalt products
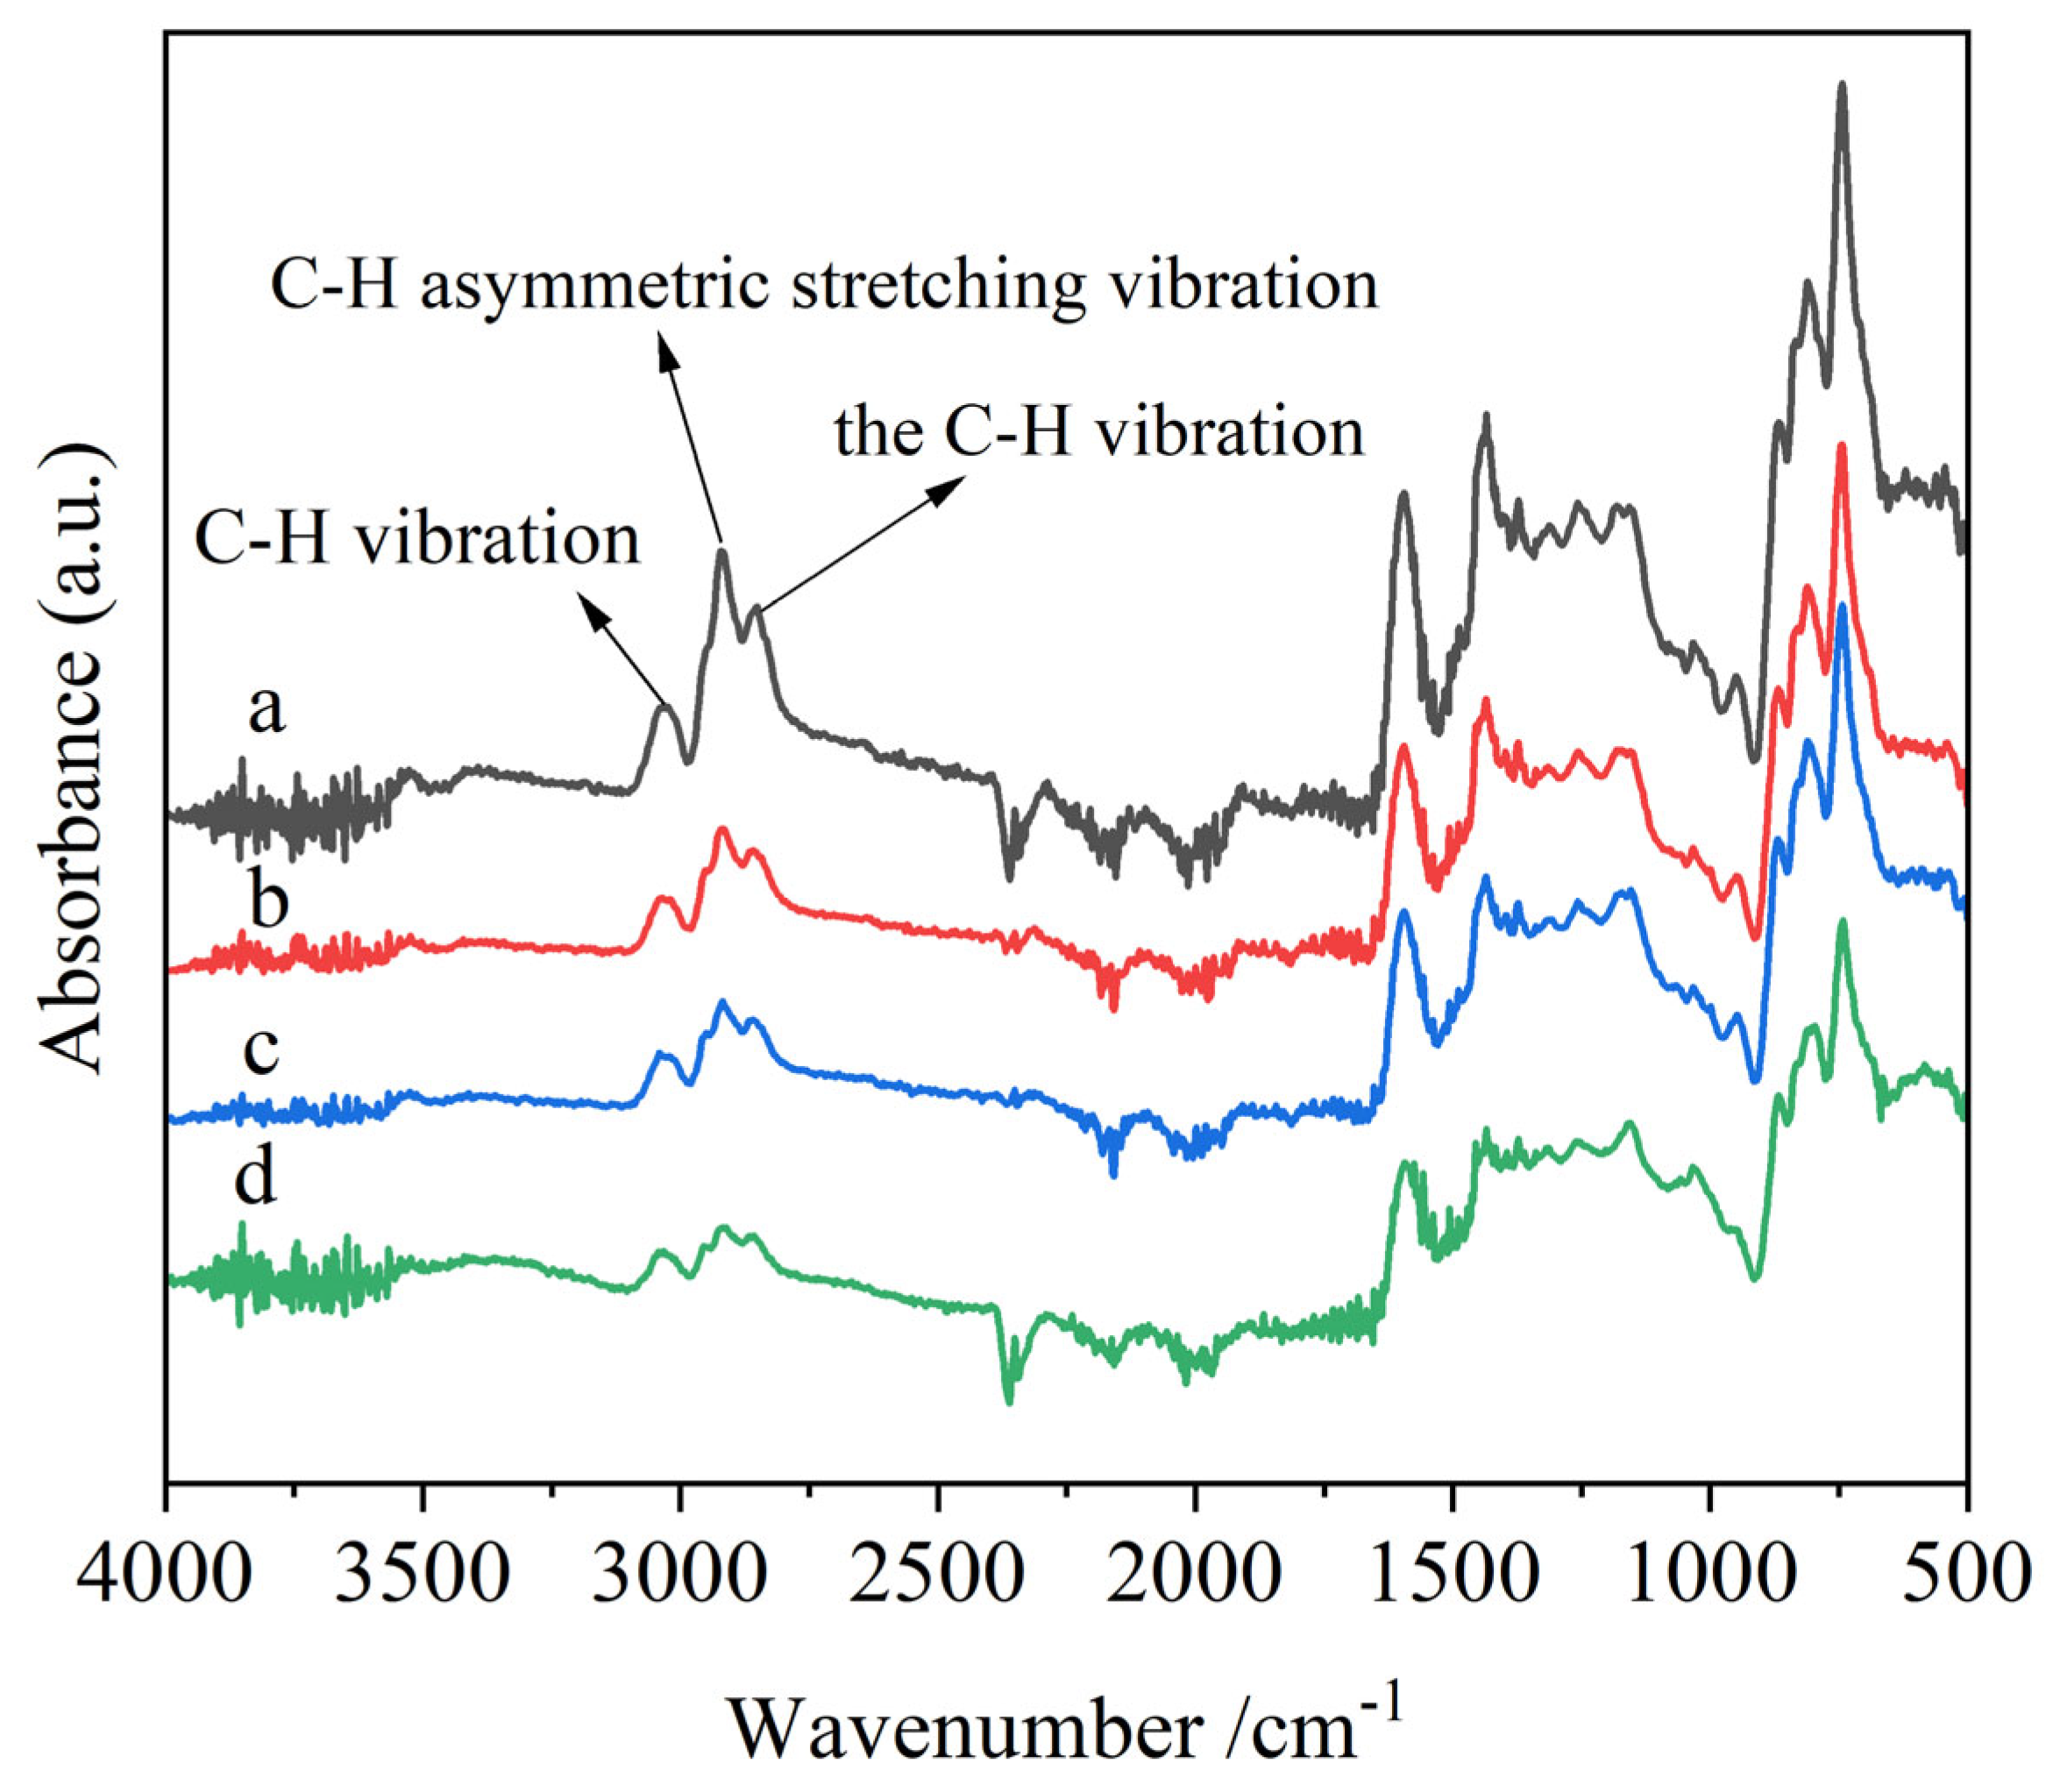
Figure 12 shows the FTIR spectra of liquefaction asphalt raw materials and corresponding asphalt products with a high softening point. The composition of functional groups in the samples is determined by analyzing the spectra. The C-H vibration peak at 3050 cm
−1 is the aromatic ring, the C-H vibration peak at 2920 cm
−1 is the saturated methylene and the C-H asymmetric stretching vibration peak at 2960 cm
−1 is the saturated methyl [
45,
46]. Both the asphalt raw materials and the modified asphalt products showed vibration absorption peaks of aromatic ring C=C in the range of 1500–1610 cm
−1 and 1437 cm
−1. The range of 1036–1377 cm
−1 belongs to the absorption peaks of alkyl side chains and oxygen-containing functional groups, which may be classified as methoxy groups, ether bridge bonds, etc. It can be found that all of these vibration absorption peaks for the asphalt product with a coking value of 87.8% are stronger than that of other products with a lower coking value and raw material, indicating the higher coking value of products with higher polymerization degree and aroma degree. As shown in
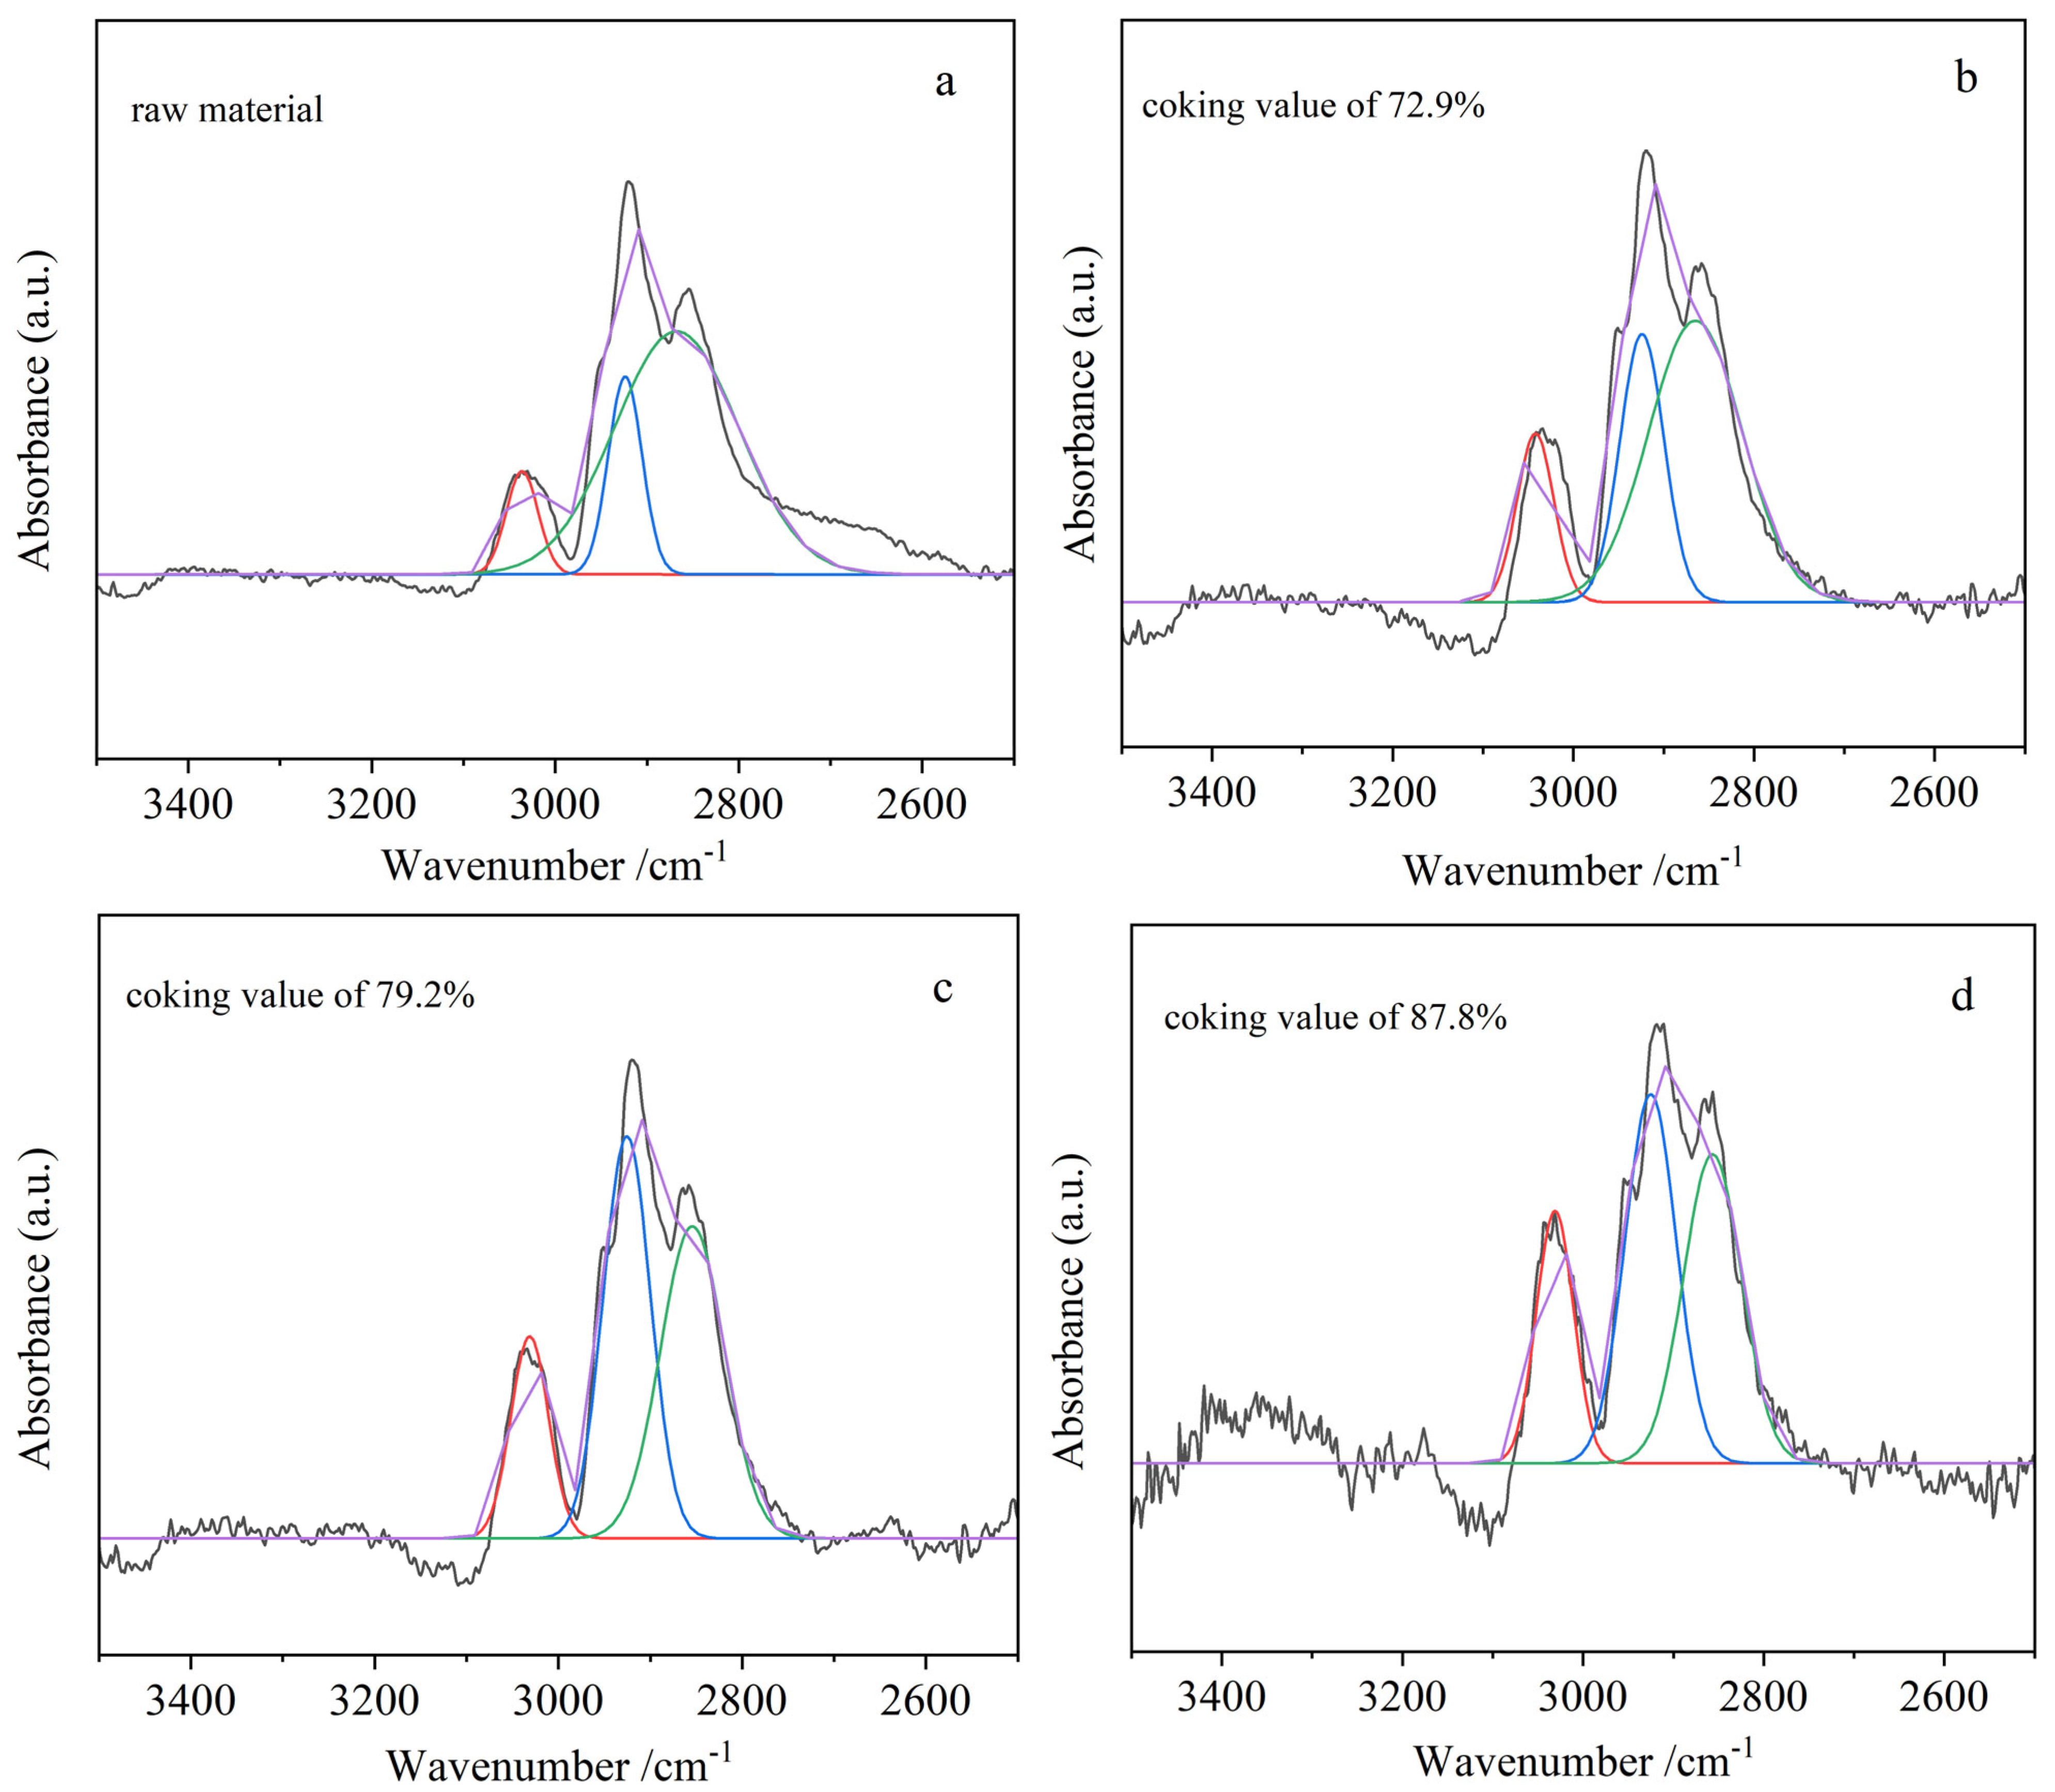
Figure 13 and
Table 8, the aromaticity index (Iar) and branched chain index of the product were determined by peak-splitting fitting of the infrared spectra and calculation of the corresponding peak area. It can be seen from
Table 8 that the aromaticity index Iar and branched chain index of the corresponding product increase with the increase in the coking value of the product. It can be inferred that with the increase in the degree of polymerization, the dealkylation reaction occurs strongly, more methylene disappears and a larger dense aromatic molecule is generated. Meanwhile, the product aromaticity increases, and the ratio of saturated methyl to methylene content increases [
47]. All of these results are consistent with the analysis of 13C-NMR and XRD.
- (4)
XPS analysis of asphalt products
Figure 14 shows the XPS spectrum of the prepared modified asphalt products, and
Table 9 reveals the results of peak fitting calculation based on XPS spectrum to analyze the binding state of C in the products. It can be seen from the XPS spectra of C1s of the prepared modified asphalt product that C=C content in the products increases with the increase in the coking value. The results showed that more aromatic compounds were formed with the increase in oxidation polymerization depth, consistent with the analysis of NMR and XRD. At the same time, the proportion of carbon and oxygen functional groups in the product increases first and then decreases with the increase in the coking value. Compared with the liquefaction asphalt raw material, when the coking value of the product is 72.9% and 79.2%, respectively, the content of carbon and oxygen functional groups in the product increases, indicating that an oxidation crosslinking reaction occurs. In addition, the content of carbon and oxygen functional groups in the product decreases with the coking value of the product increased to 87.8%, which should be due to the ether bond, anhydride bond and carbonyl bond compounds generated by oxidative crosslinking reaction undergoing cracking and decarboxylation reactions to produce CO and CO
2 and other substances.
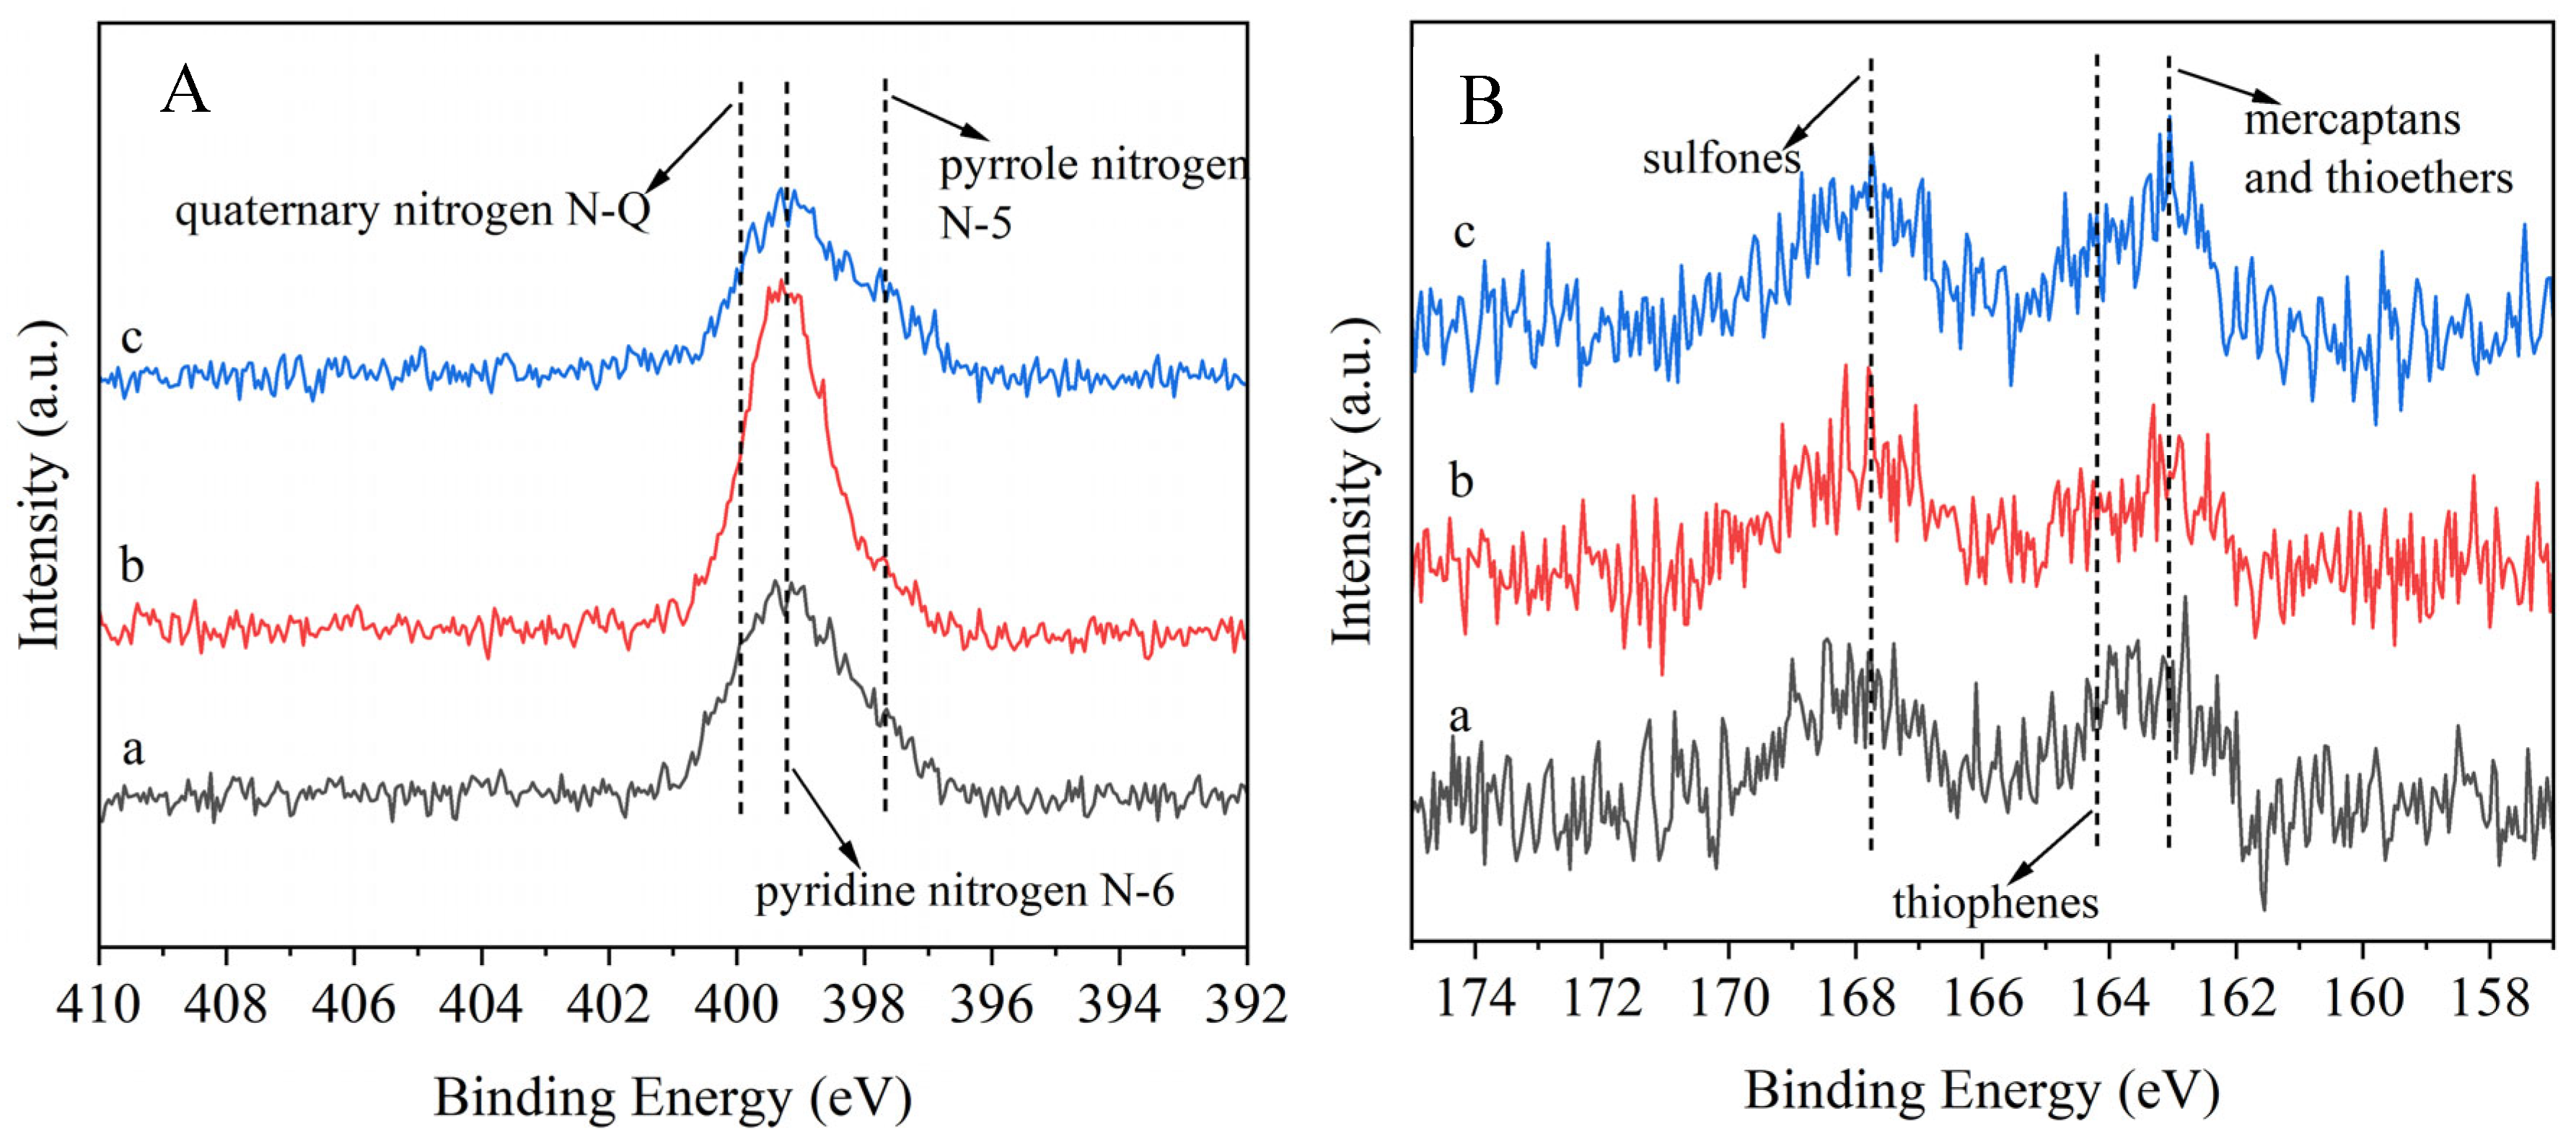
It can be seen from
Figure 15 that both raw material and modified asphalt products contain nitrogen and sulfur elements, and the analytical results are consistent with those of elemental analysis. Furthermore, the presence of sulfur and nitrogen can be determined by XPS spectrogram analysis of N1s and S2p. Combined with the XPS map of N1s, chemical state and location information of nitrogen in raw material and products is as follows: pyrrole nitrogen N-5 (399.0 ± 0.5 eV), pyridine nitrogen N-6 (398.0 ± 0.5 eV) and quaternary nitrogen N-Q (400.0 ± 0.5 eV), which mainly exists in the form of pyrrole nitrogen N-5 [
48,
49,
50]. Given that the coal liquefaction asphalt has the characteristics of low sulfur, it can be further certified by elemental analysis. According to the XPS of S2p, the chemical state and location information of sulfur in raw materials and products is as follows: mercaptans and thioethers (163.0 ± 0.5 eV), thiophenes (164.2 ± 0.5 eV) and sulfones (168.5 ± 0.5 eV), which mainly exist in the form of organic sulfur and sulfones [
51].
- (5)
XRD analysis of asphalt products
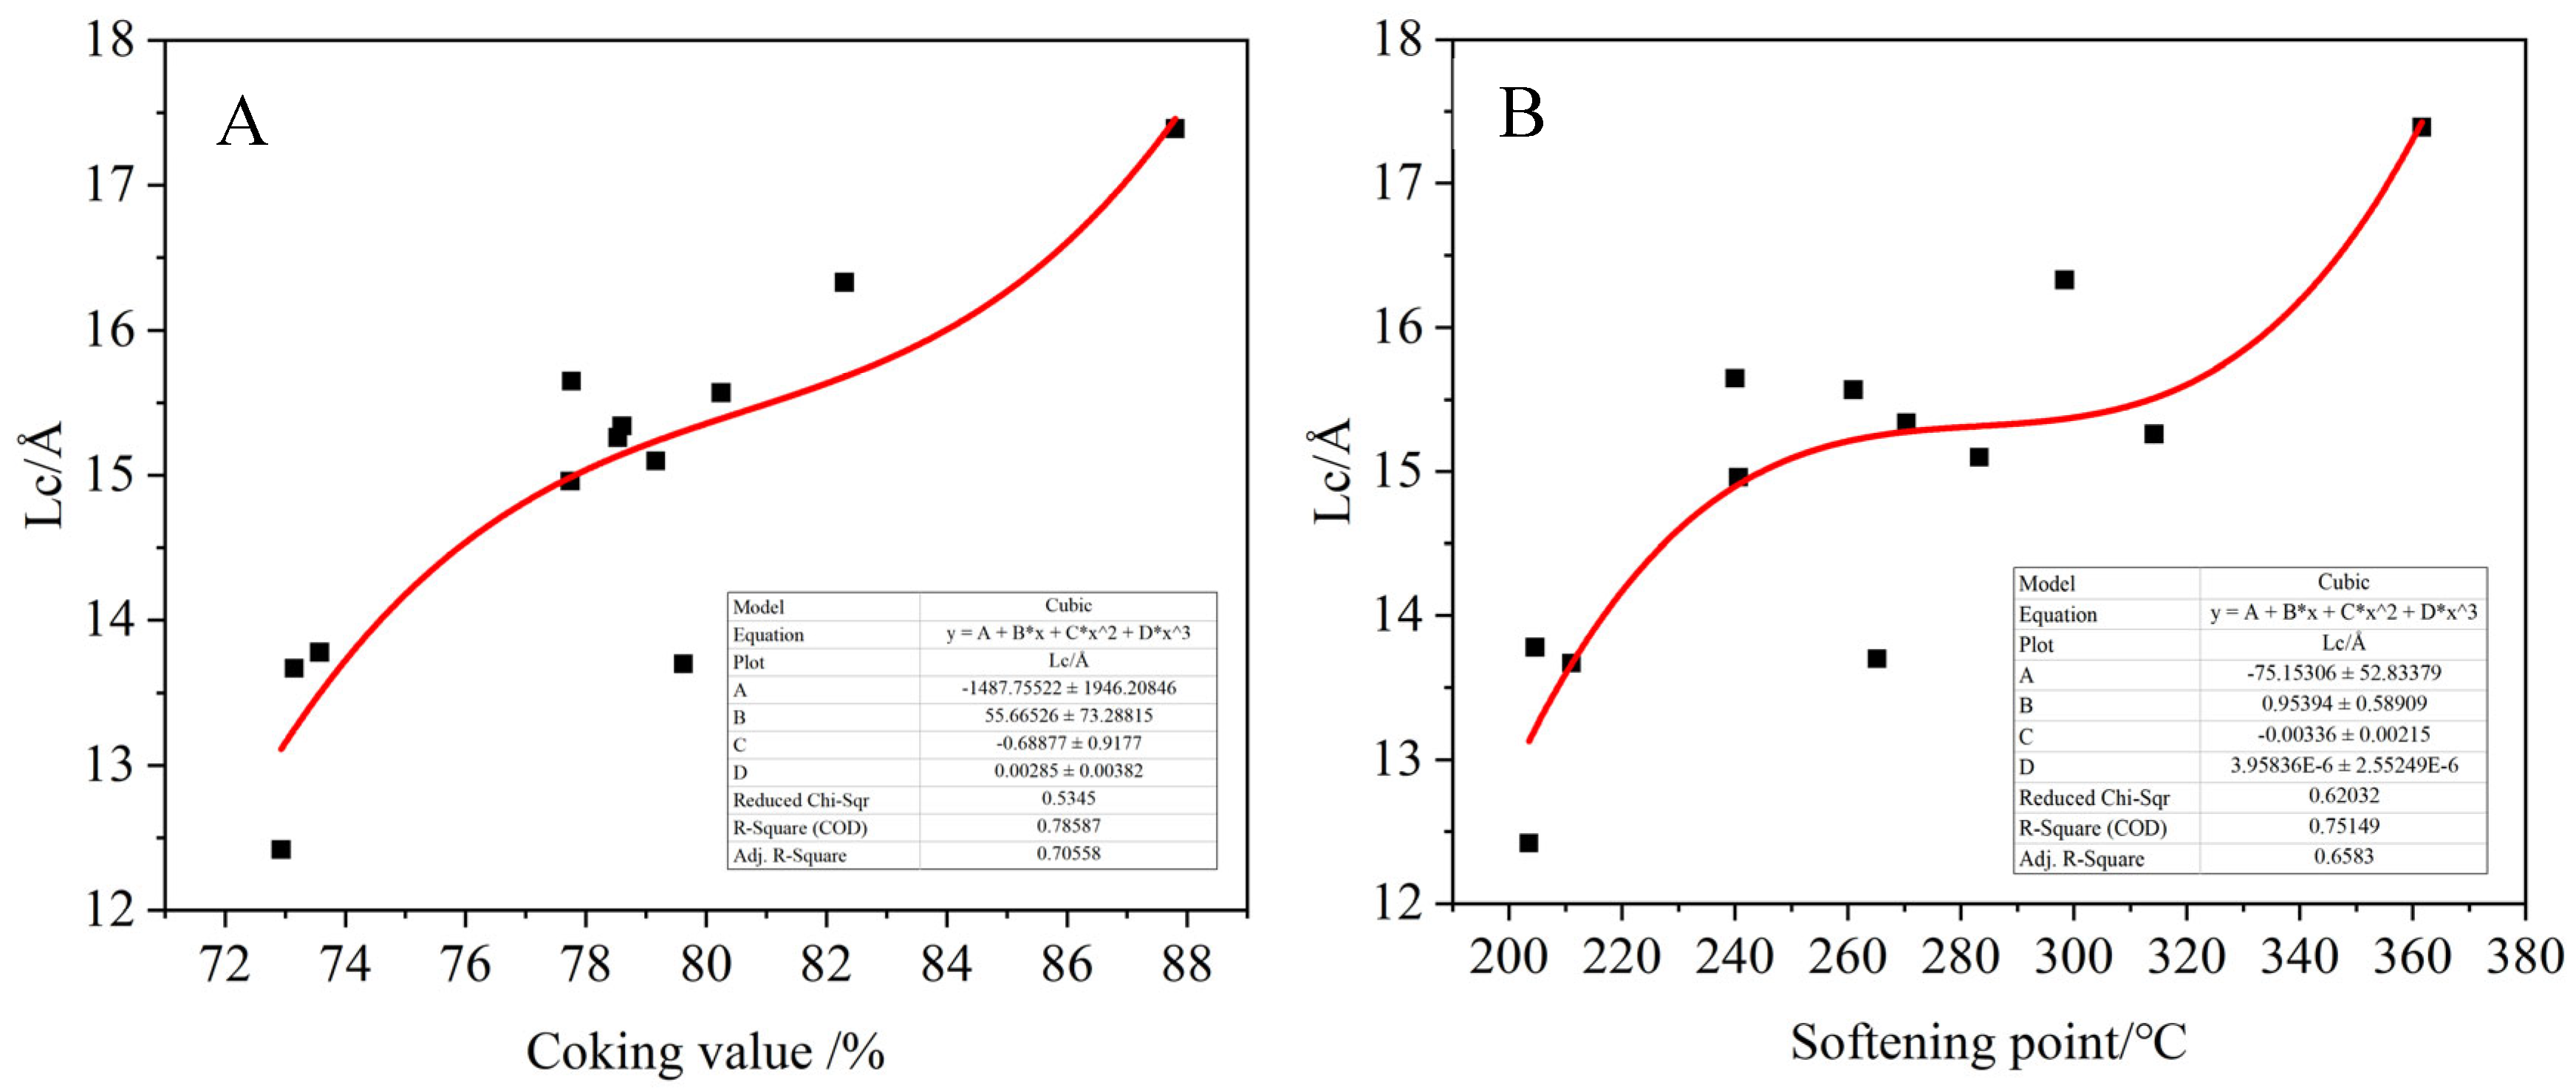
The crystal structure parameters, the grain size La and Lc and the carbon microcrystal content Ig were calculated by the XRD pattern of the modified asphalt products. The fitting relationship between the grain size and carbon microcrystal content of the products and the coking value and softening point of the products are shown in
Figure 16,
Figure 17 and
Figure 18. It can be found that the carbon microcrystal content of the products is positively correlated with the coking value of the product, and there is a polynomial relationship with the softening point, but the general trend is that the degree of graphitization of the product increases with the increase in the softening point. The grain size La and Lc are positively correlated with the softening point and coking value of the product, indicating that products with a higher coking value correspond to higher graphitization degree and larger grain size. Meanwhile, the analysis results are consistent with the results of FTIR and XPS analysis.
- (6)
NMR analysis of asphalt products
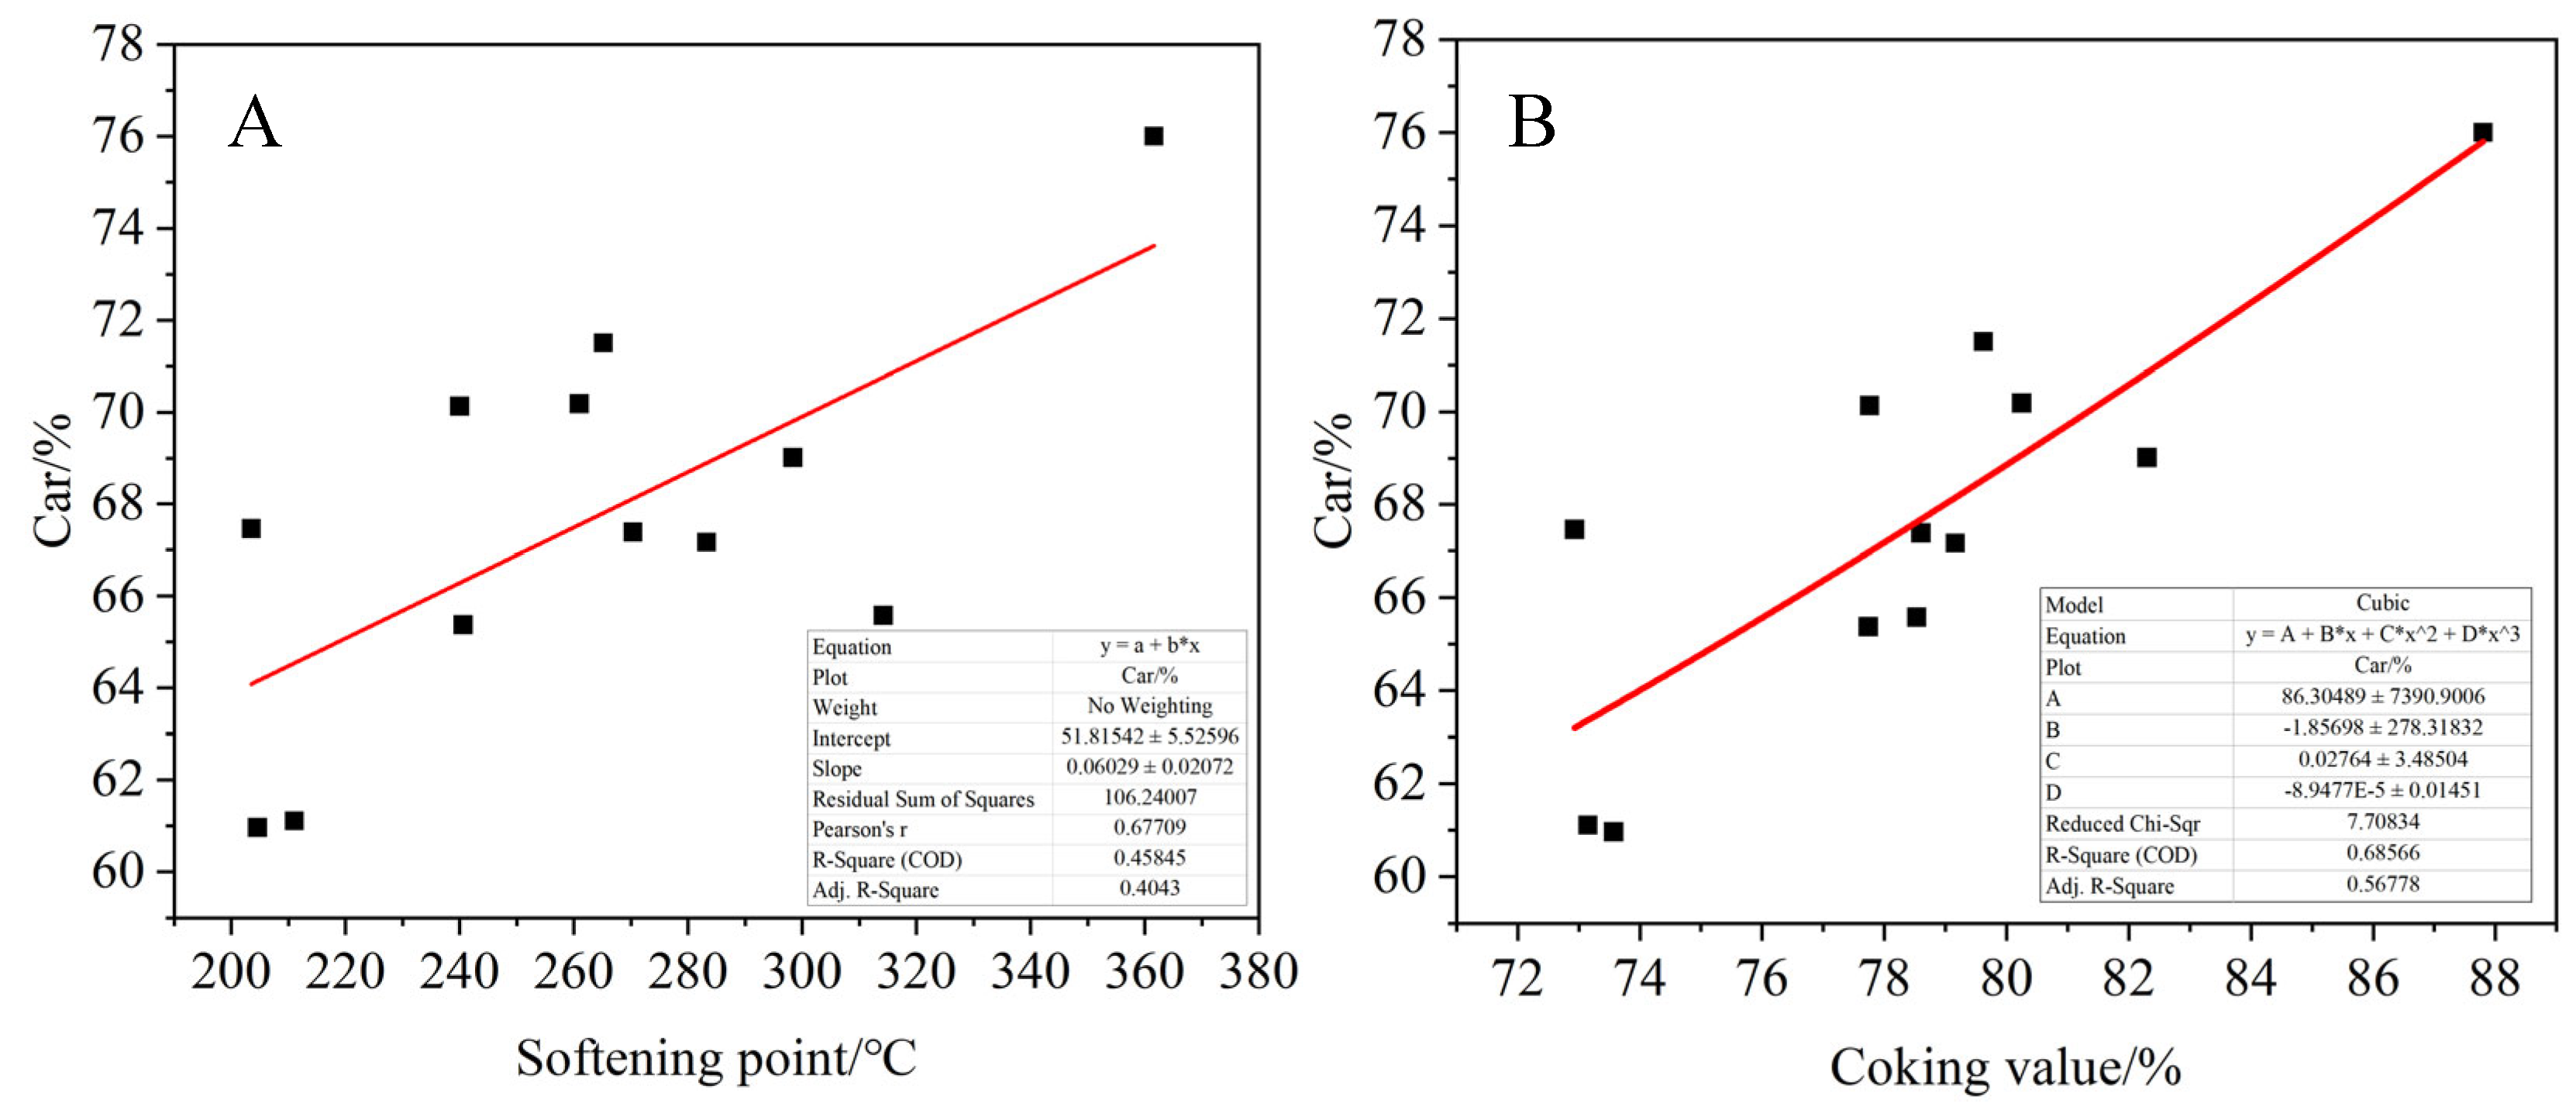
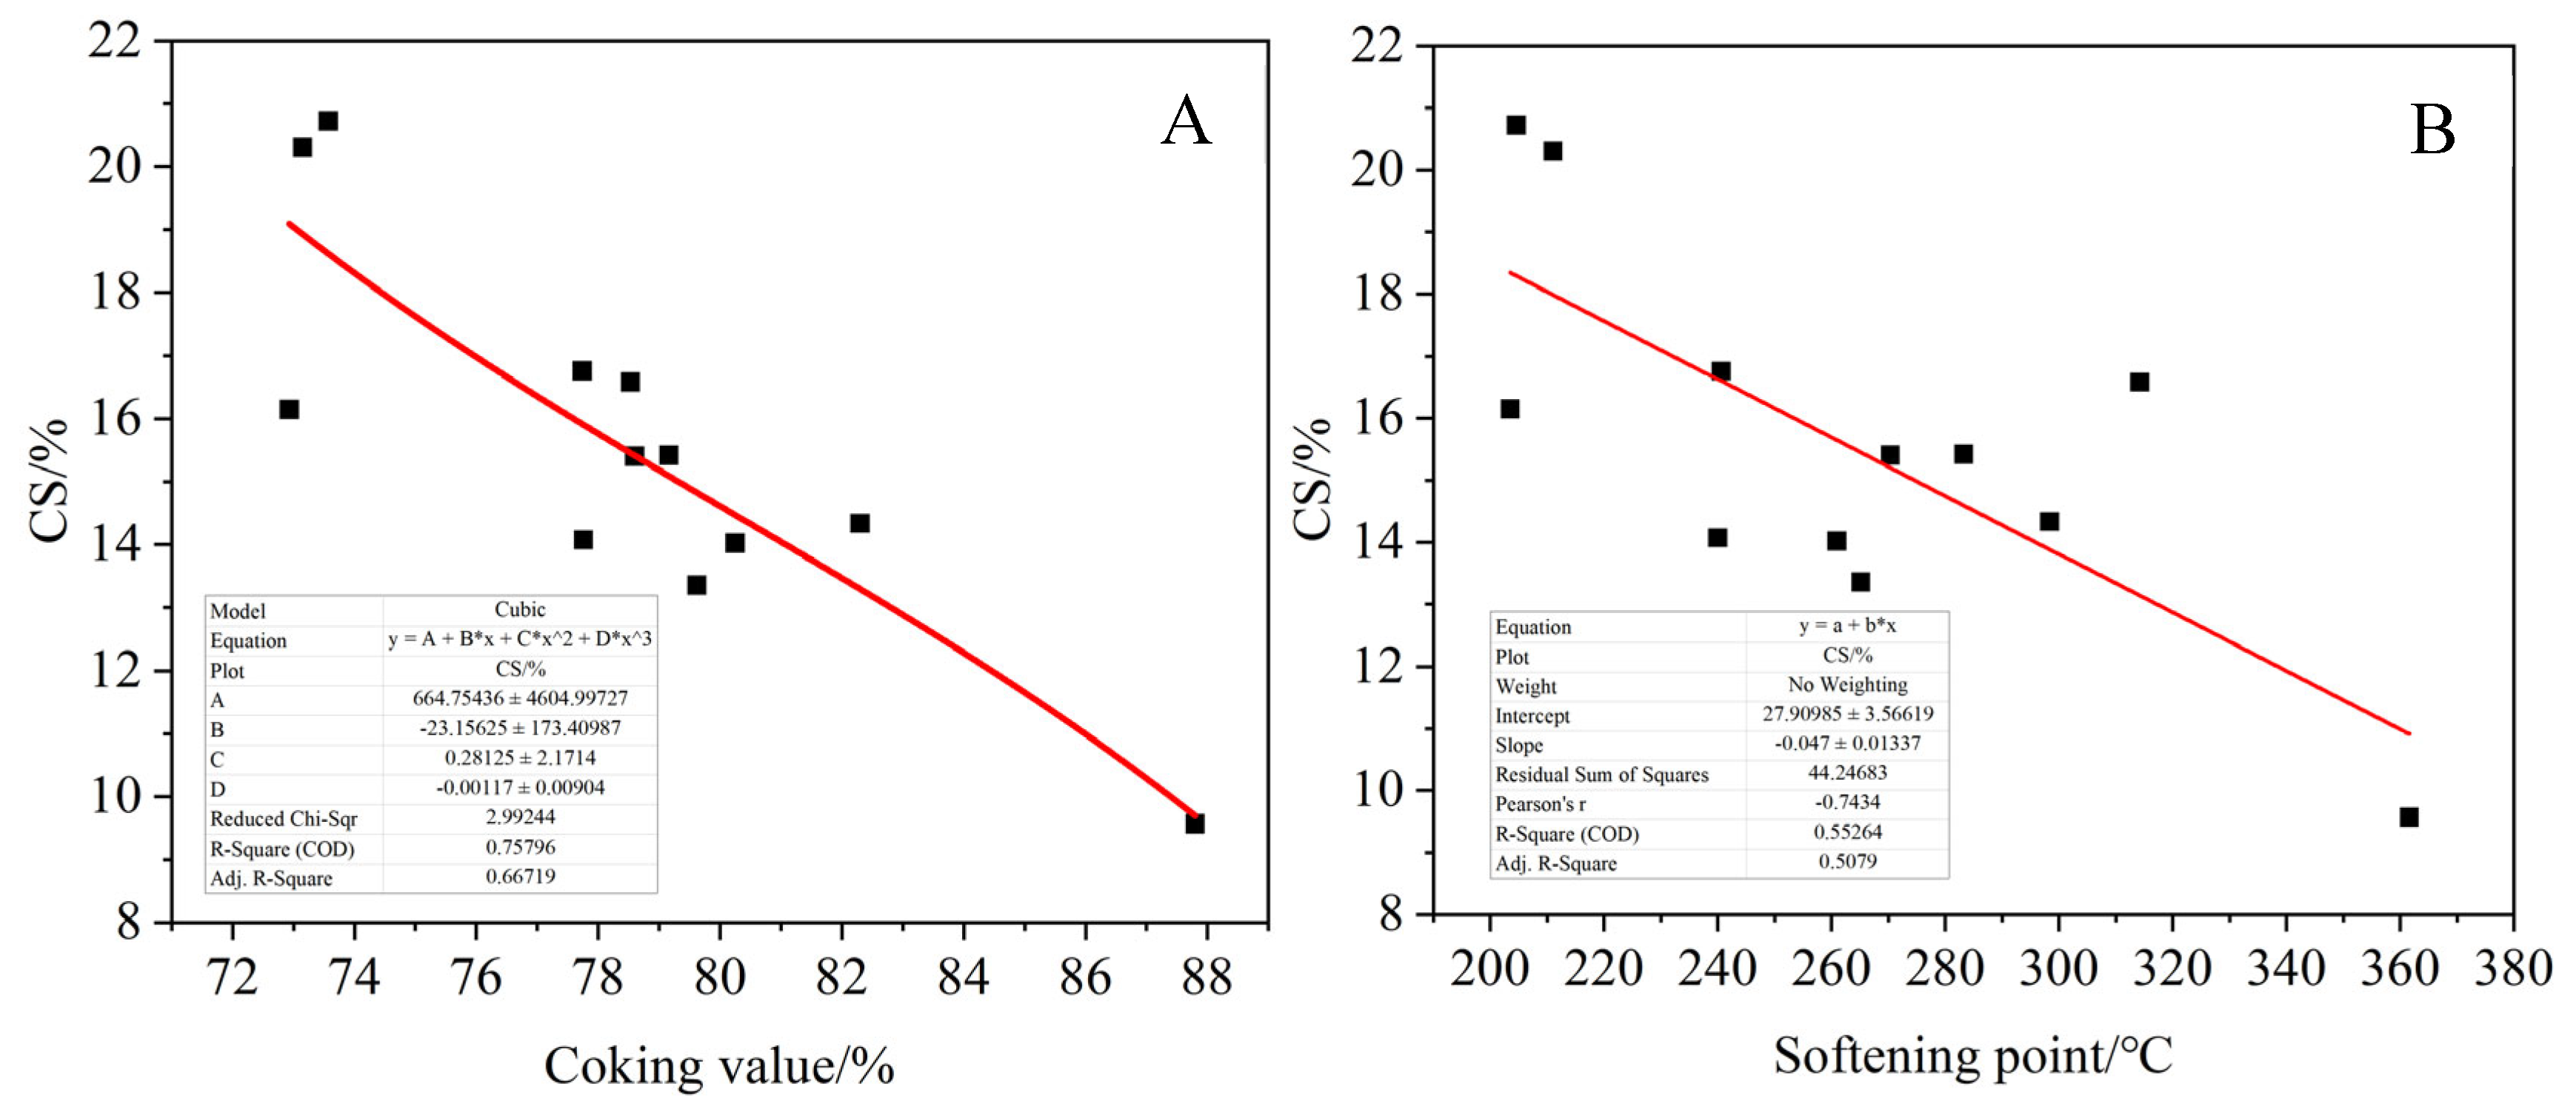
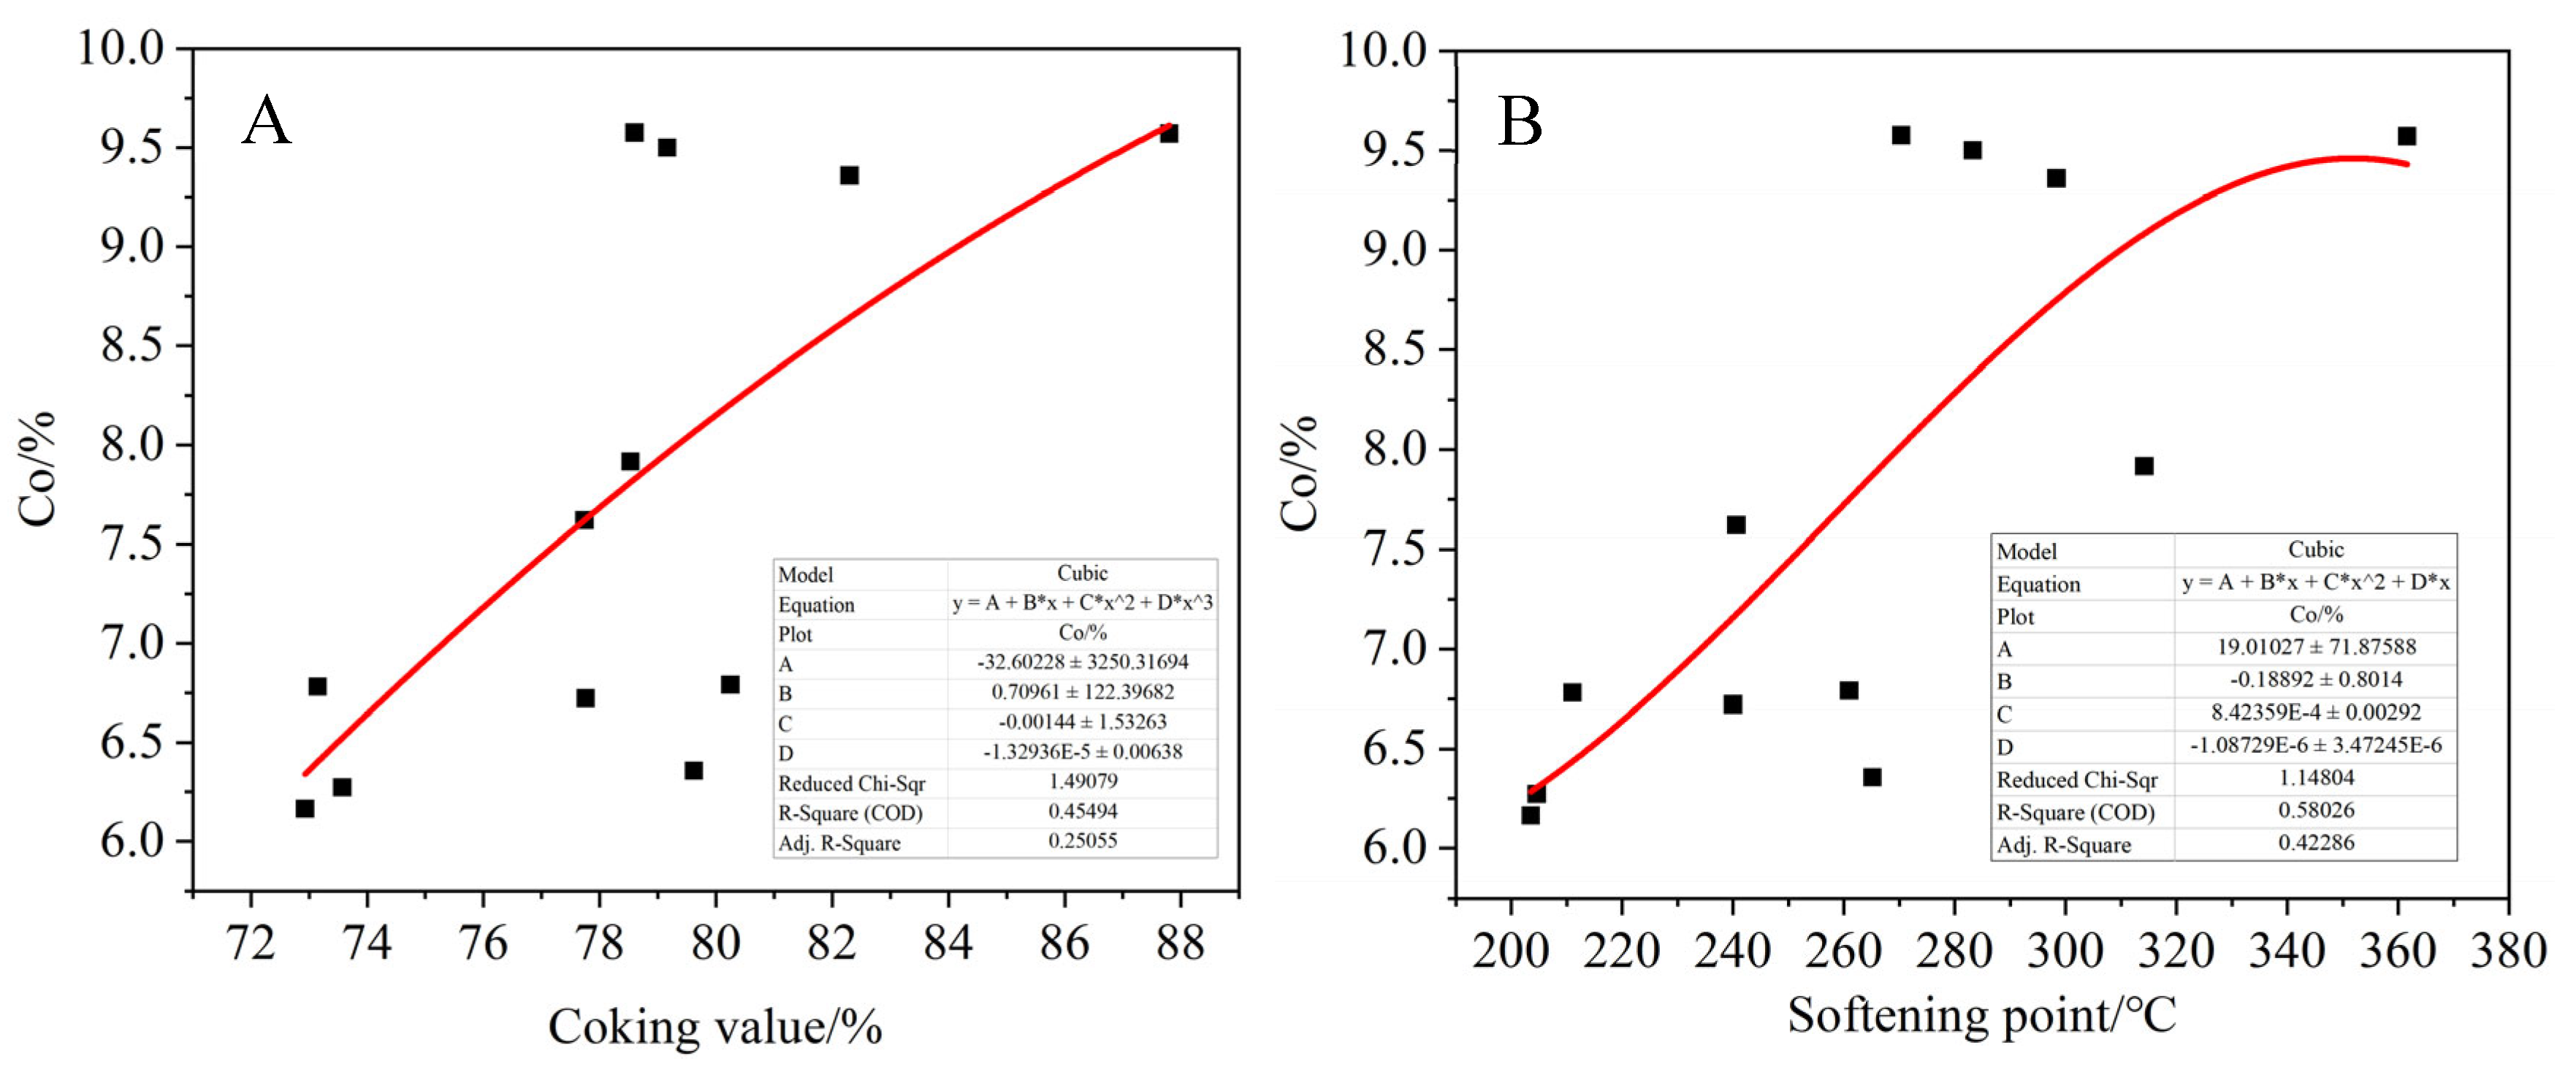
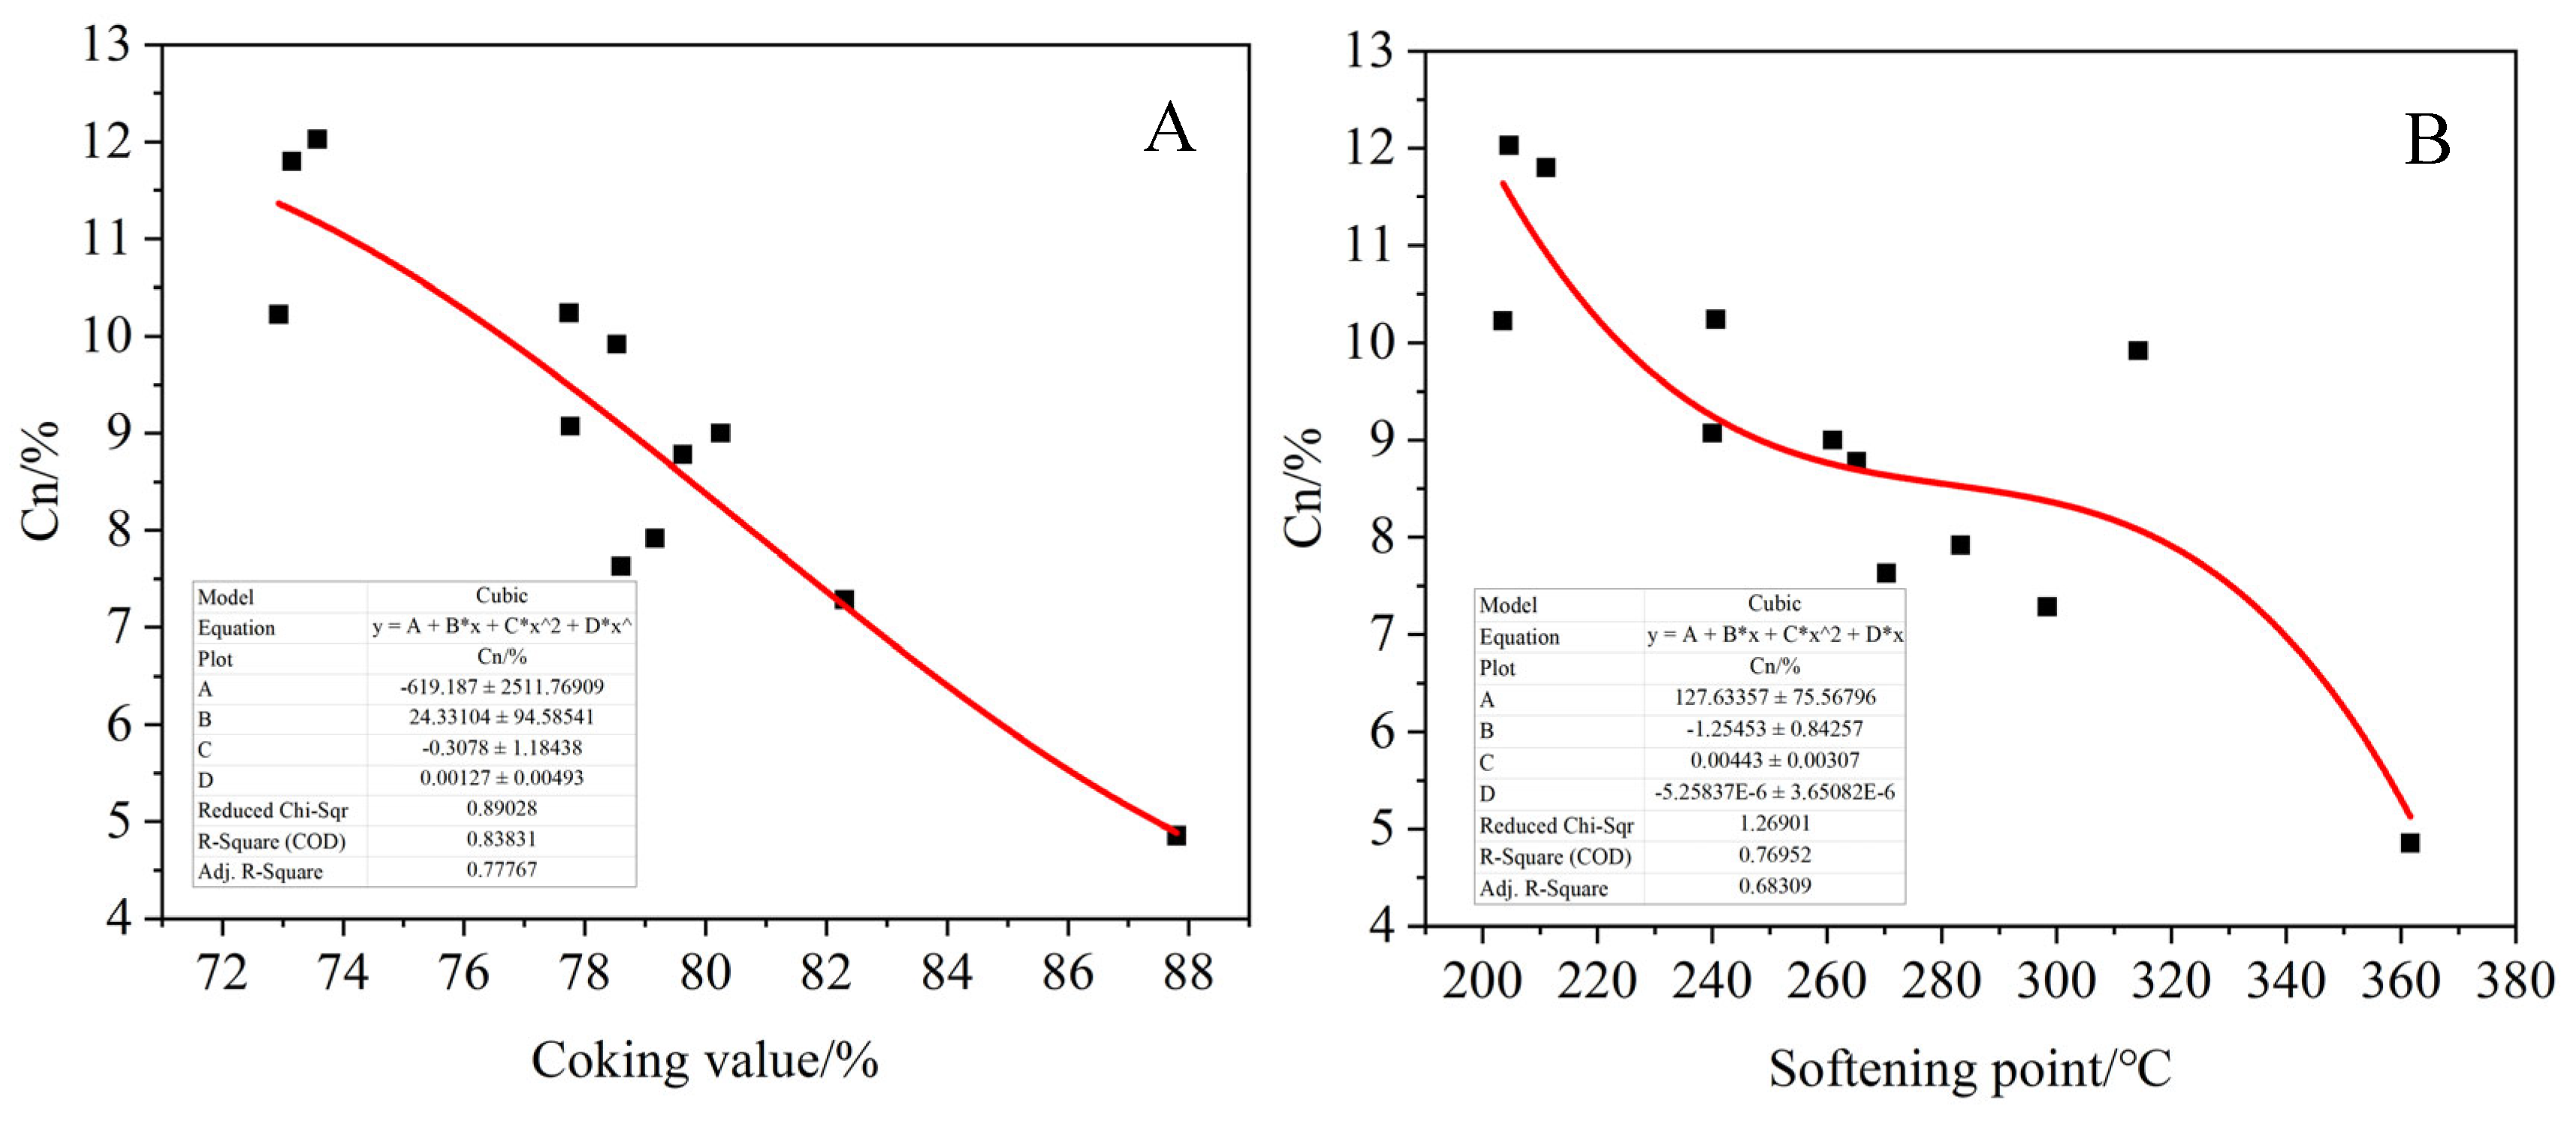
The proportion of saturated carbon, normal alkane carbon, aromatic carbon and carbon–oxygen functional groups in the product were calculated according to 13C-NMR spectra of the asphalt product. As shown in
Figure 19,
Figure 20,
Figure 21,
Figure 22 and
Figure 23, the relationships between the proportion of each functional group and the coking value and softening point of the product were fitted. Among them, 5–60 ppm represents saturated carbon CS, 25–50 ppm represents normal alkane carbon Cn, 110–160 ppm represents aromatic carbon Car and 188–230 ppm represents carbonyl carbon Co, which is associated with oxygen. It can be seen that the ratio of aromatic carbon Car of the product increases with the increase in the softening point and coking value of the product. On the contrary, the ratio of saturated carbon Cs to normal alkane carbon decreased, and the carbonyl carbon content of the product also showed an increasing trend with the increase in the softening point and coking value, but the fitting effect was poor. This indicates that the larger the product coking value, the more layered thick cyclic aromatic hydrocarbons are generated, resulting in the asphalt product having a higher aromatic degree. In addition, when more alkyl side chains are broken, the corresponding product has less saturated carbon and normal alkane carbon. At the same time, the oxidation crosslinking reaction is intensified in the transitional oxidation state, and more carbonyl compounds are generated.
- (7)
Molecular weight analysis of asphalt products
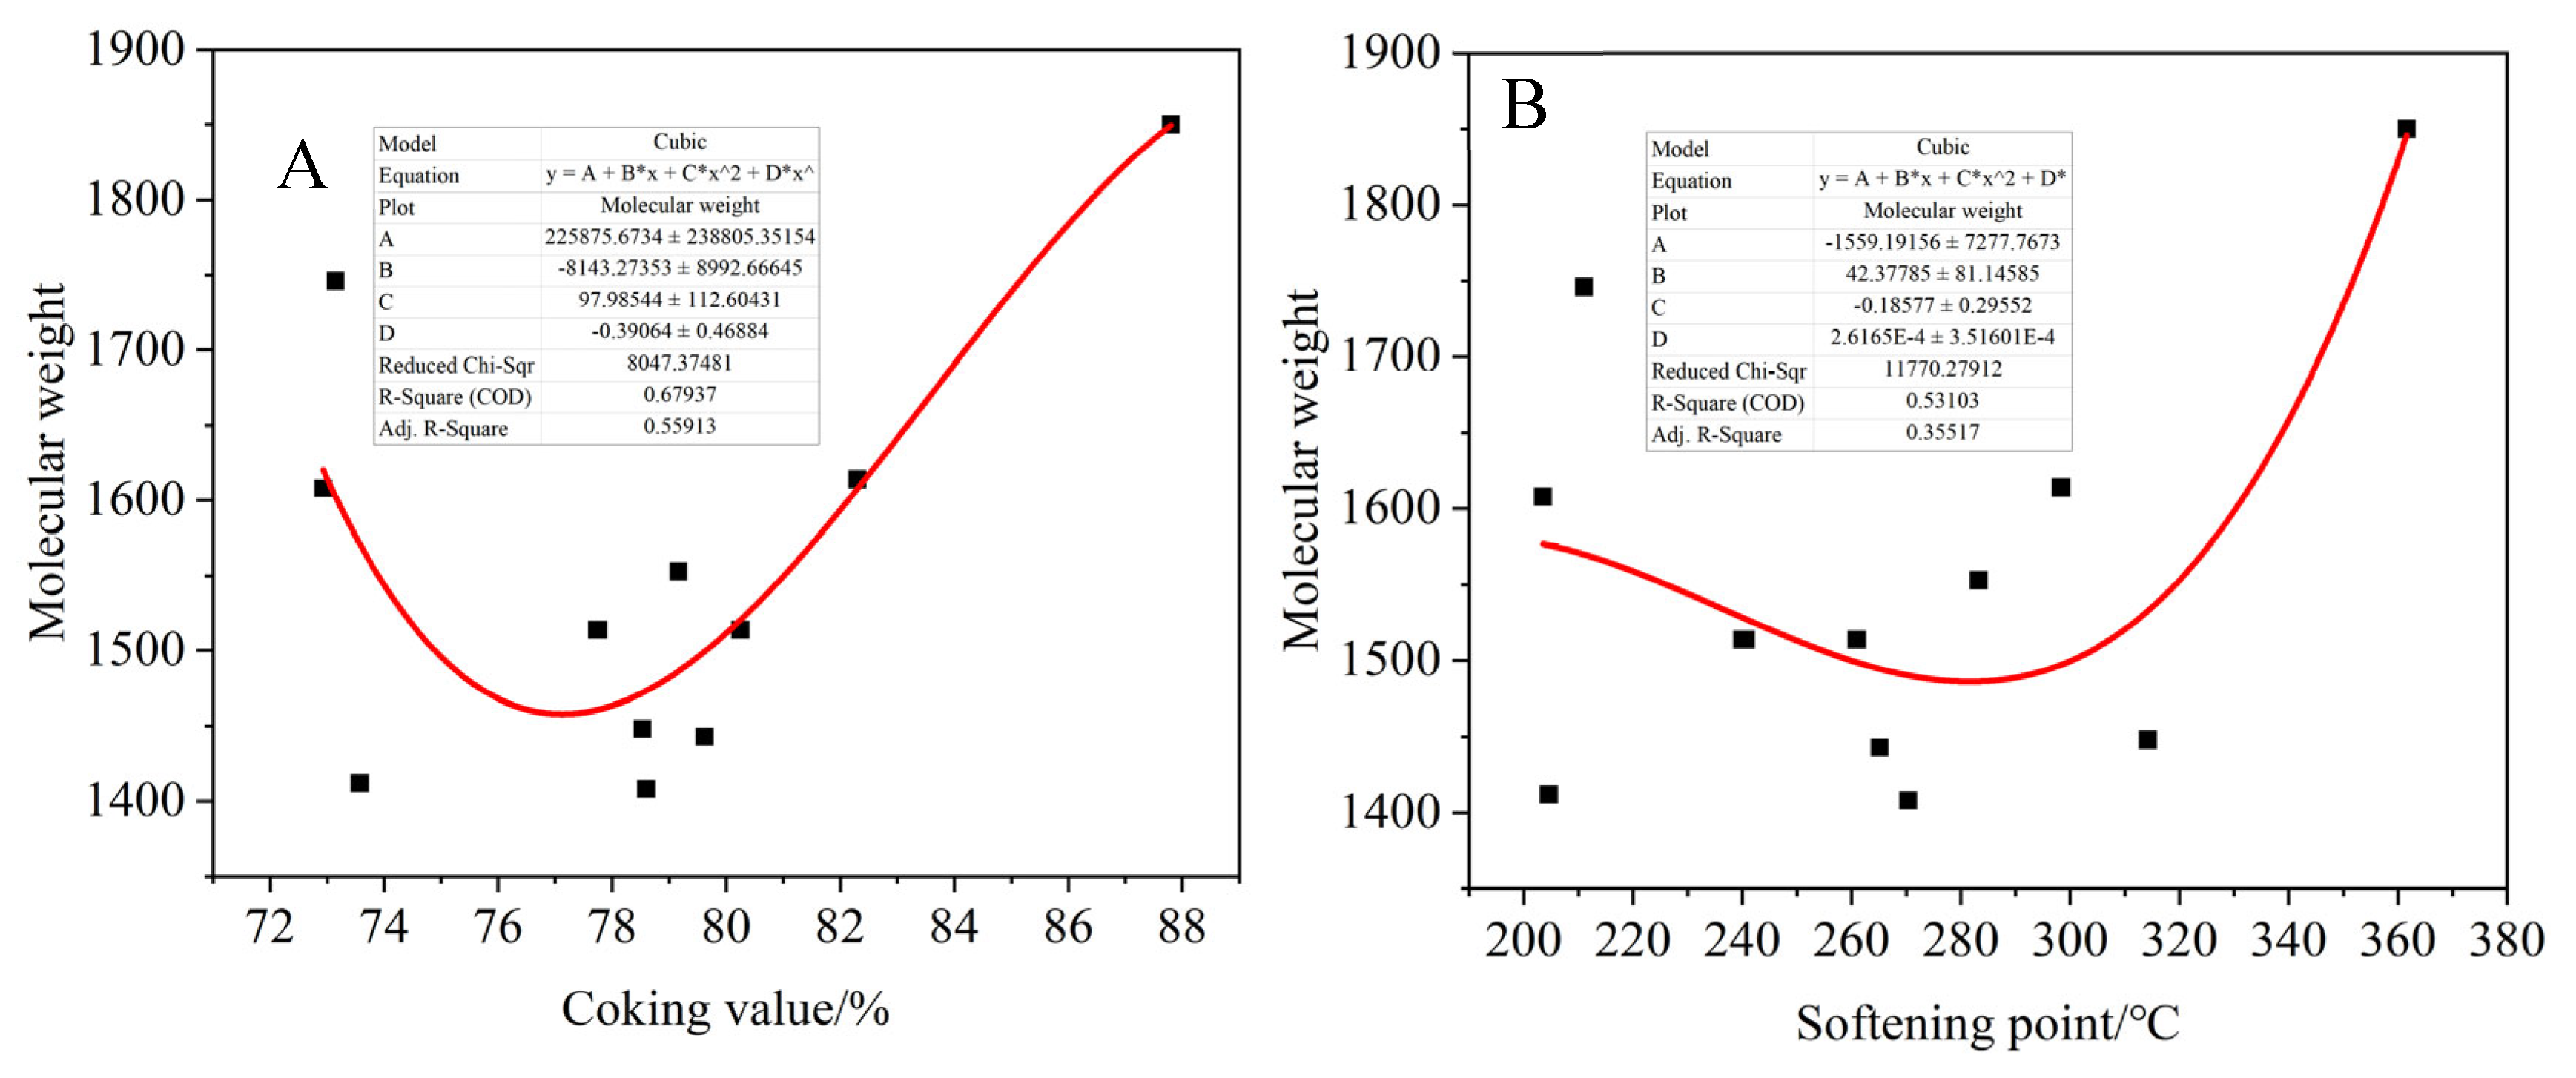
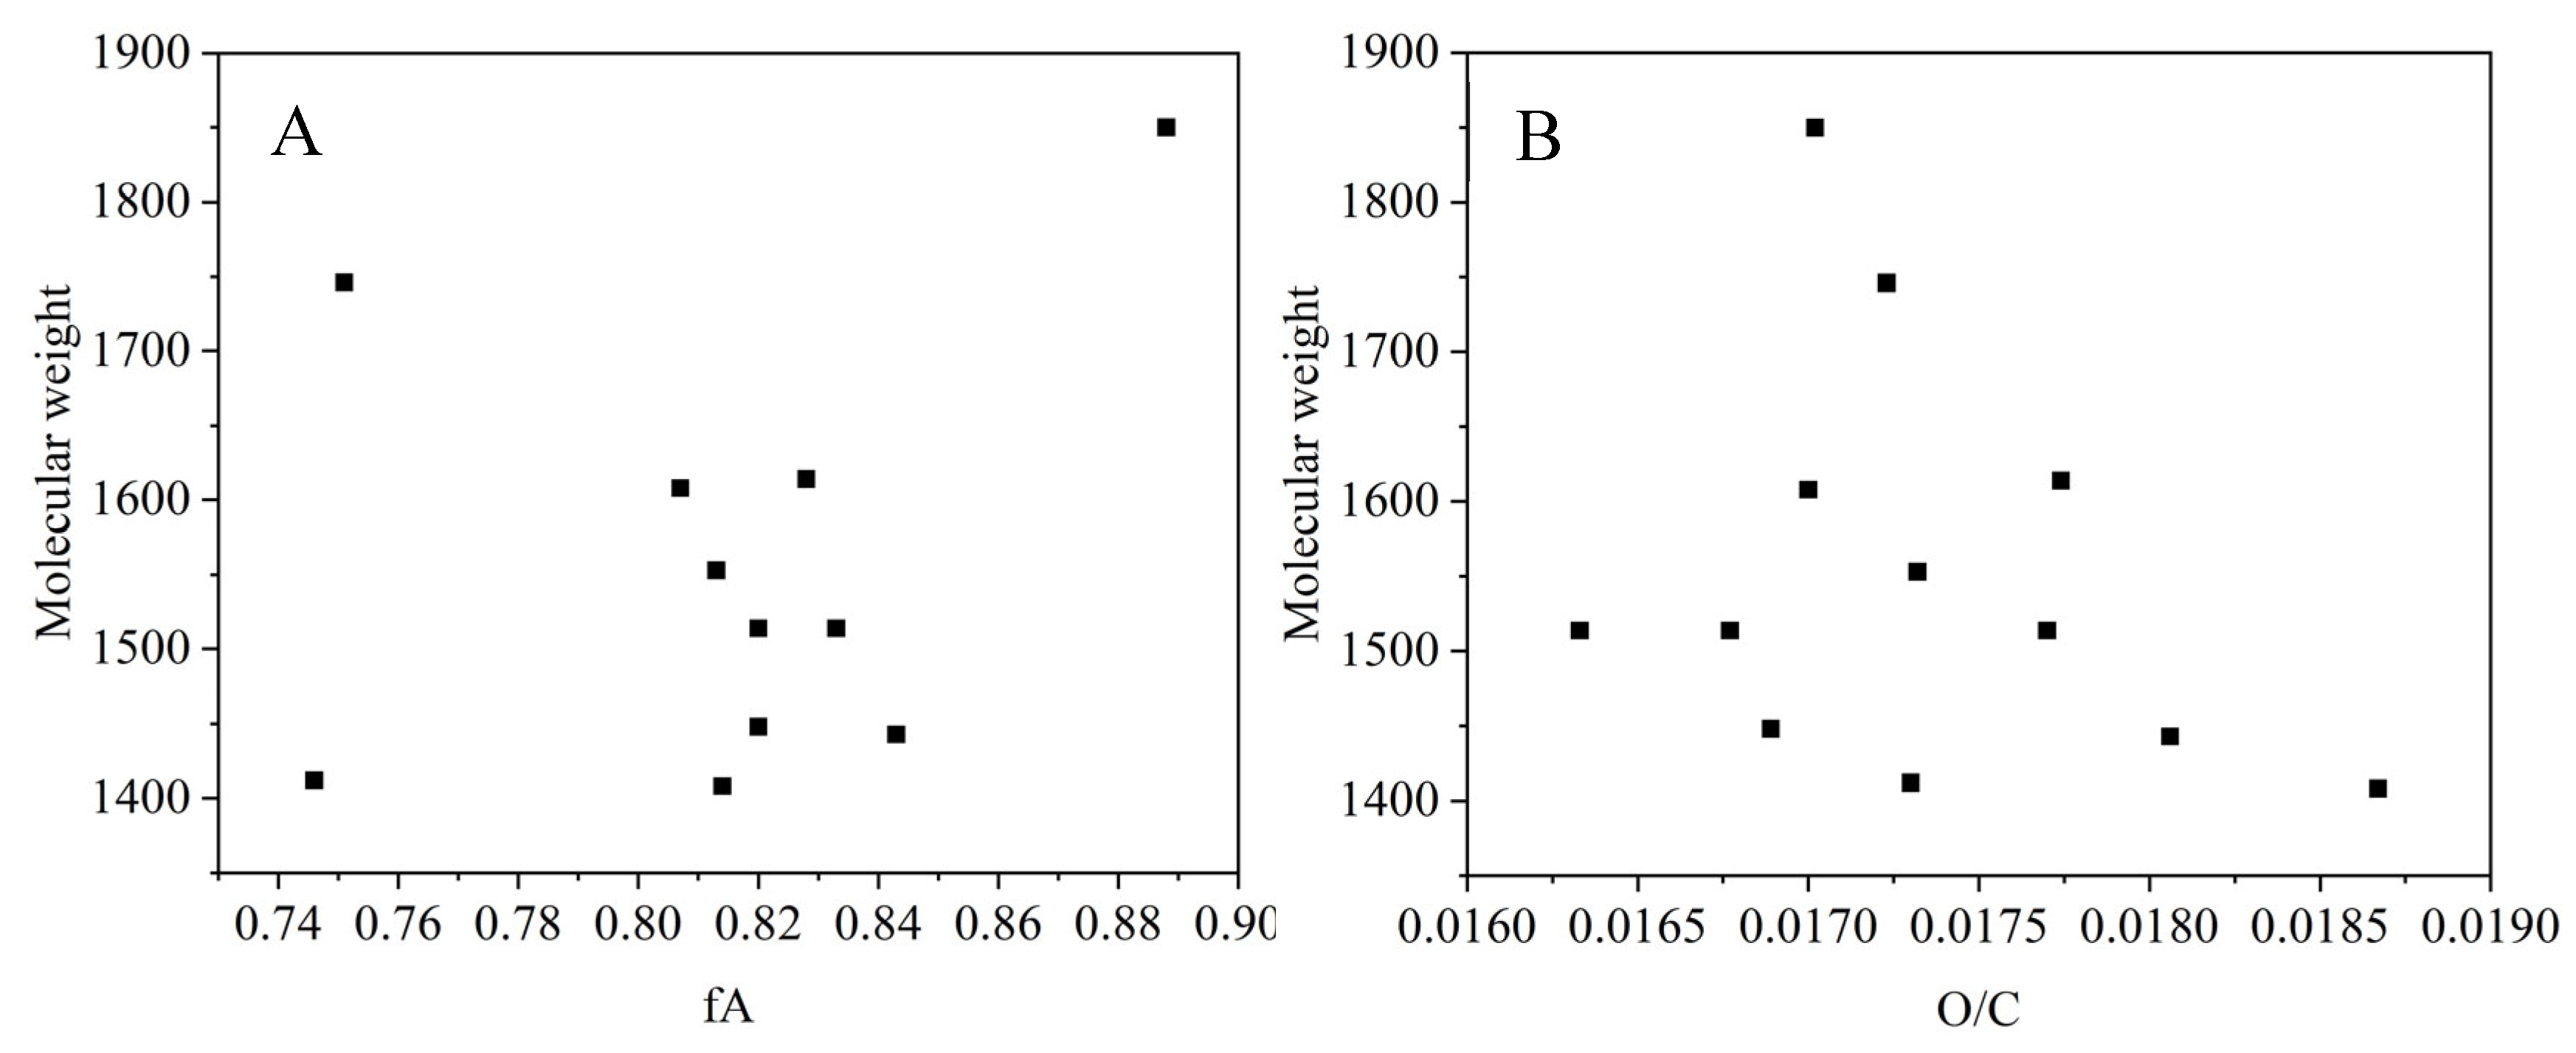
As shown in
Figure 24 and
Figure 25, the fitting relationship between the molecular weight and the coking value, softening point, aromaticity and O/C of the product were obtained. The molecular weight of the product decreases first and then increases with the increase in the coking value and softening point. The increase in the coking value means that the polymerization degree increases. At the beginning, the alkyl side chain breaks and some small molecules are purged out, resulting in a slight decrease in the molecular weight of the product. With the progress of oxidation polymerization, the condensation polymerization and crosslinking reaction are intensified, while more dense aromatic hydrocarbons are formed, and the molecular weight of the products in the reaction system increases. At the same time, the molecular weight of the asphalt products did not change significantly with the aromatic degree and O/C ratio.
3.6. Verification of Spinning Performance
Preliminary spinning verification of the target product (coking value of 80.25%) showed that continuous spinning could be carried out at a high spinning speed (600–800 r/min), indicating that the prepared modified asphalt with high softening point had good spinnability. Therefore, the liquefaction asphalt carbon fiber (LACF) was obtained by spinning, pre-oxidation and carbonization of the target product. Meanwhile, the commercially general grade asphalt carbon fiber (MCP) was purchased from a certain enterprise in Shandong, China, and was prepared by coal tar asphalt. The morphology and structure of the LACF and MCF were analyzed by SEM, and the diameter was calculated, as shown in
Figure 26.
As shown in
Figure 26a–c, there were no splitting or cavity defects inside the carbon fiber (LACF), the surface was relatively smooth and the diameter of the fiber was 8–10 μm. However, the fracture section of carbon fiber from market (MCF) has air holes, and the surface is uneven, as shown in
Figure 26d–f, which may be due to the composition distribution of spinnable asphalt being relatively wide. As shown in
Table 10, the mechanical properties of the carbon fibers were evaluated by fiber strength meter. For the LACF, the tensile strength, elastic modulus and elongation at break were 775 MPa, 68.6 GPa and 1.13%, respectively, which is better than the mechanical properties of MCF. This may be due to the fact that the liquefaction asphalt has a higher hydrogen content compared to coal tar asphalt, so the fluidity of the corresponding spinnable asphalt is better, which can be further proved by the diameter of the carbon fibers. Therefore, the liquefaction asphalt carbon fiber has value for further study.


