Abstract
Enzymatic hydrolysis of Atlantic salmon processing discards, including heads and frames, was carried out using Alcalase, Flavourzyme, and their combination. The degree of hydrolysis varied depending on the enzyme and substrate, ranging from approximately 5% to 15%. Alcalase was more effective than Flavourzyme for the hydrolysis of salmon frames and heads. The results also indicated that 1% enzyme concentrations had slightly higher mean DH than 2%. The bioactivity testing indicated that the head hydrolysates had superior DPPH scavenging activity, while frame hydrolysates demonstrated higher ABTS and hydroxyl radical scavenging activity. The correlation between DH and bioactivities indicated that the degree of hydrolysis did not have any significant effect on the DPPH and hydroxyl radical scavenging activities while demonstrating a significant positive correlation against ABTS scavenging activity.
1. Introduction
Protein hydrolysates derived from marine sources are of interest for their applications in food, feed, and nutraceutical industries. Marine protein hydrolysates contain essential amino acids and bioactive peptides, which have been studied and shown to provide various health benefits. These include antioxidant, anti-inflammatory, anticancer, antidiabetic, anti-allergenic, cryoprotectant, and antimicrobial properties, which are beneficial for human health [1,2]. Among marine sources, Atlantic salmon is a promising candidate, as it is a widely cultivated species, and its byproducts can be a valuable source of novel ingredients. Atlantic salmon is a rich source of protein (16–20%), which is mainly composed of glutamic acid, aspartic acid, lysine, leucine, and valine. Salmon protein hydrolysates also contain all nine essential amino acids, which indicate its potential to serve as a functional food ingredient [3]. Enzymatic hydrolysis has emerged as a preferred method for the recovery and valorization of these byproducts, as it allows for the preservation of the nutritional value and functional properties of the resulting protein hydrolysates [3,4]. The heads and frames contain abundant quantities of protein that could be utilized to produce protein hydrolysates and peptides. Generally, fish proteins, including those of Atlantic salmon, can be divided into three types: connective tissue (stroma) proteins (3%), sarcoplasmic proteins (20–30%), and myofibrillar proteins (70–80%) [5]. Stroma proteins primarily comprise extracellular matrix proteins like collagen. Sarcoplasmic proteins include glycolytic enzymes, creatine kinase, myoglobin, and parvalbumin. Myofibrillar proteins comprise myosin, actin, tropomyosin, troponin, and paramyosin (in many invertebrates) [6].
The types of protein present in heads and frames are varied; for example, heads of Atlantic salmon are richer in sarcoplasmic proteins, with lesser fractions of myofibrillar proteins found in muscle tissues and stroma proteins found in connective tissues. Since Atlantic salmon frames are near backbones and surrounded by muscle tissues, they are rich in myofibrillar proteins with a lesser proportion of sarcoplasmic and stroma proteins [7,8]. The types of proteins present in both heads and frames play a significant role in the degree of hydrolysis during the enzymatic hydrolysis process.
There are several studies reporting on various bioactive properties of Atlantic salmon hydrolysates and peptides produced via enzymatic hydrolysis using various enzymes, including Alcalase, Flavourzyme, Corolase 7089, Corolase PN-L, Protamex, Papain, Bromelain, Protex 6L, Seabzyme L200, Trypsin, Promod 671L, and Protex 7L [8,9,10,11,12,13,14,15,16,17]. However, the use of a combination of enzymes on Atlantic salmon, especially the effect of combining an endo-peptidase (Alcalase) and an endo- and exo-peptidase (Flavourzyme) is not well studied in the literature. Alcalase breaks peptide bonds in the C-terminal amino acids, and Flavourzyme favors the N-terminal peptide chain. Both these enzymes are expected to produce different types of protein hydrolysates with different functional properties, degrees of hydrolysis and peptides with varying bioactivities [18,19]. Additionally, this study is the first to report on the use of a wine filtration device for filtering salmon protein hydrolysates. Therefore, this study takes a novel approach to (a) compare the processing efficiencies of individual enzymes against the combination of enzymes, (b) investigate the effect of operational parameters on the bioactivities of salmon protein hydrolysate, and (c) compare the biochemical and amino acid composition of salmon protein hydrolysate with reported literature findings.
2. Materials and Methods
2.1. Materials
Atlantic salmon processing by-products, such as heads and frames, were collected in ice-filled Styrofoam boxes from a salmon processing plant in Atlantic Canada (Cook Aquaculture, Hermitage, NL, Canada). The by-products were promptly processed upon arrival at the Marine Bioprocessing Facility, Memorial University of Newfoundland, St. John’s, NL, Canada. Before processing, both salmon heads and frames were mixed with the antioxidant calculation (0.15% of the lipid content) based on the approximate results from our previous studies [20]. Salmon heads and frames were each minced twice utilizing a Hobart grinder (Model 4146, The Hobart MFG. Co., Ltd., Troy, OH, USA) fitted with distinct plate sizes of 17 mm and 15 mm, respectively. The raw materials were vacuum packed in plastic bags weighing approximately 500 g and stored at −28 °C until use.
Alcalase 2.4 L (2.4 U/g) and Flavourzyme 500 L (500 U/g) were purchased from Sigma-Aldrich (Toronto, ON, Canada). The antioxidant Dadex AR-HS, containing rosemary extract, ascorbic acid, and sunflower oil, was kindly provided by Caldic Canada Inc. (Mississauga, ON, Canada).
2.2. Proximate Analysis
The proximate composition was analyzed according to standard procedures outlined by the Association of Official Analytical Chemists [21]. Moisture and ash contents were determined using methods AOAC 930.15 and AOAC 938.08, respectively. Protein content was measured using the Kjeldahl method (AOAC 954.01), while total lipid content was assessed through Soxhlet extraction (AOAC 948.15).
2.3. Enzymatic Hydrolysis of Salmon Heads and Frames
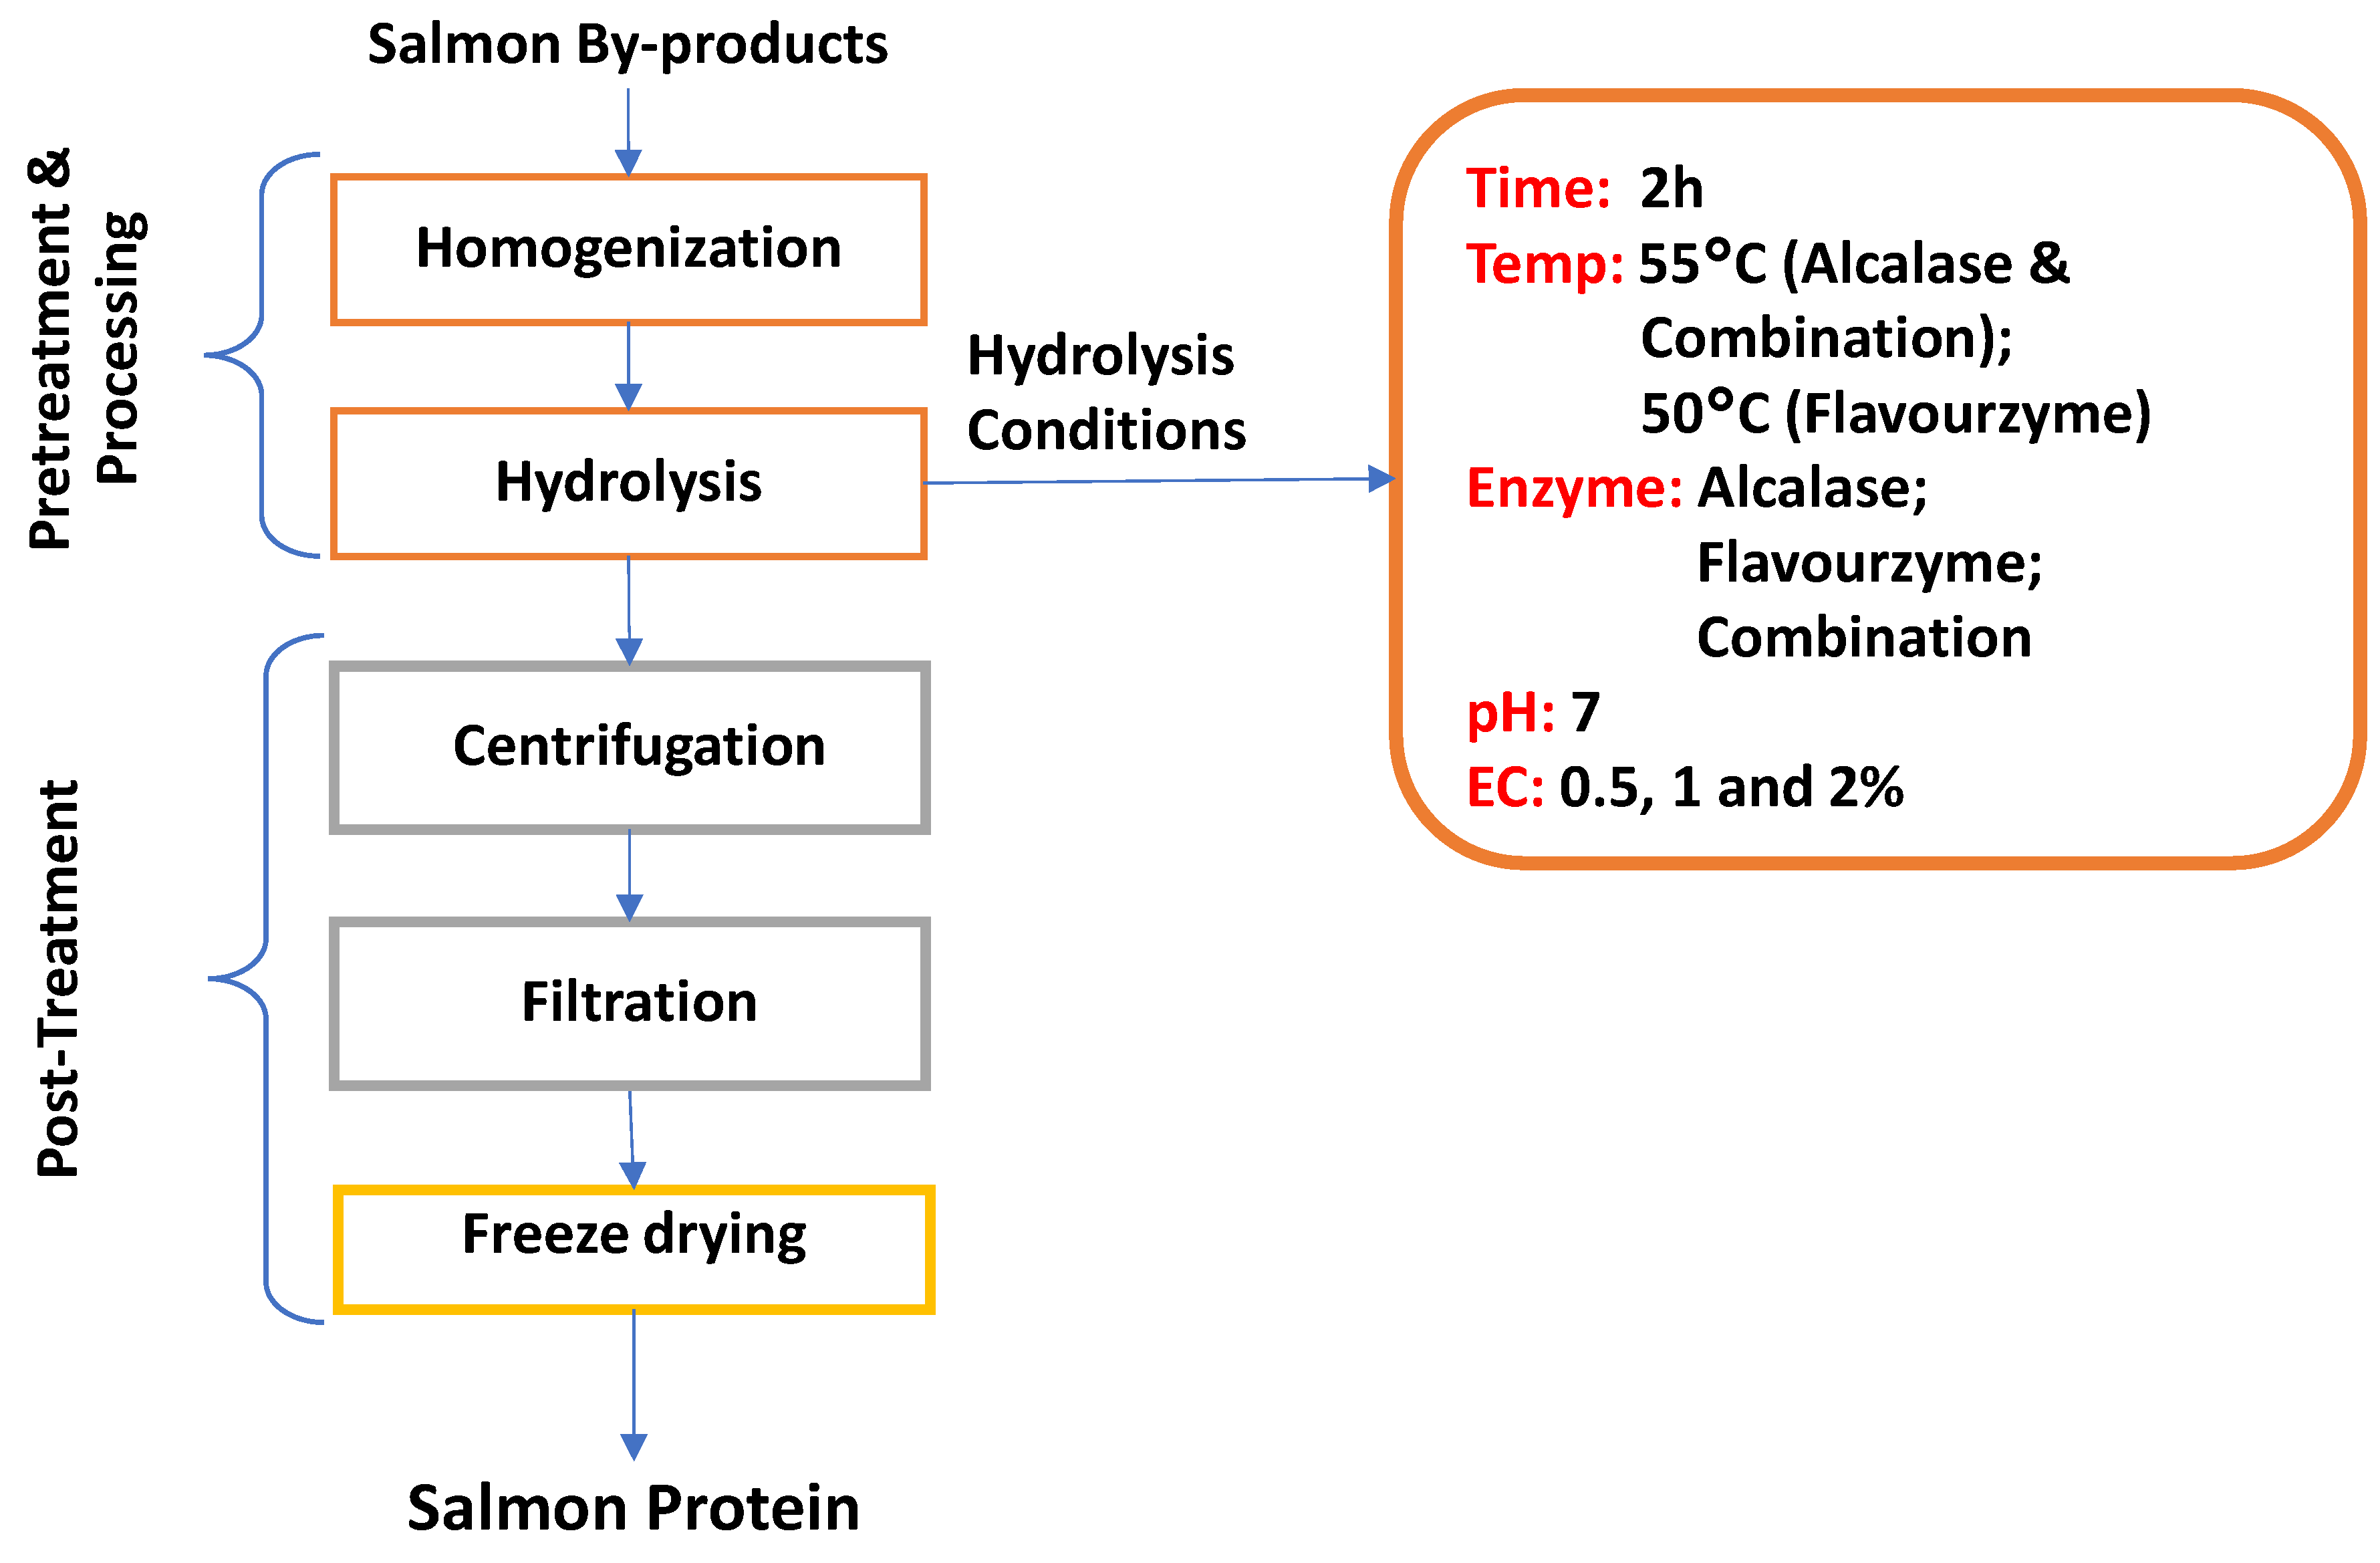
The enzymatic extraction of protein hydrolysates from Atlantic salmon by-products (head and frame) is shown in Figure 1. The frozen ground salmon by-products (head and frame) were thawed in cold running water. About 500 g of salmon by-products were weighed in a 2 L beaker and mixed with 500 mL of distilled water. The mixture was stirred at 600 rpm using an overhead stirrer, while the temperature was maintained at the enzyme-specific optimum using a temperature probe: 55 °C for Alcalase, and 50 °C for both Flavourzyme and the Alcalase + Flavourzyme combination. Once the reaction mixture reached the optimal temperature, the pH was adjusted to 7 using 5M sodium hydroxide solution. The enzymatic hydrolysis was initiated by adding enzymes at different concentrations (0.5, 1 or 2% w/v) for 2 h. The combination of enzymes were prepared in a 1:1 ratio, with Alcalase and Flavourzyme mixed in equal proportions. For example, a 2% (w/v) total enzyme concentration consisted of 1% (w/v) Alcalase and 1% (w/v) Flavourzyme. During the enzymatic hydrolysis process, the pH was continuously monitored and adjusted to 7 at 1, 15, 30, 45, 60, 90, and 120 min using 5 M sodium hydroxide. The volume of sodium hydroxide used to adjust the pH was noted and used to calculate the degree of hydrolysis of the reaction. After 2 h of hydrolysis, the mixture was cooled to room temperature and centrifuged at 10,000 rpm (17,000× g) for 20 min. Centrifugation resulted in the formation of four distinct layers: an upper oil layer, an emulsion layer, an aqueous layer containing protein hydrolysates, and a bottom sludge layer. The oil layer was carefully collected and stored at –80 °C for further analysis. The protein hydrolysates were filtered twice using a wine filtration device (Buon Vino Mini Jet, Cambridge, ON, Canada), first through a coarse (5–7 micron) filter and second through a polishing (1.5–2.5 micron) filter. The filtered protein hydrolysates were freeze-dried and stored at −80 °C for subsequent analyses.
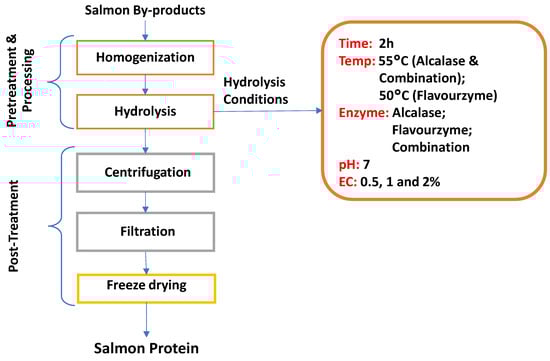
Figure 1.
Enzymatic Hydrolysis of Salmon Heads and Frames.
2.4. Degree of Hydrolysis (DH)
The degree of hydrolysis (DH) was determined using the method described by Adler-Nissen [22]. The DH represents the percentage of peptide bonds cleaved relative to the total number of peptide bonds present in the original substrate(htot). The degree of hydrolysis was calculated using the following Equation (1):
where B is the volume of base (mL) consumed to maintain the pH during hydrolysis, Nb is the normality of the base (5 N NaOH), α is the average degree of dissociation of α-amino groups during the reaction, MP is the mass of protein (N × 6.25) in g, and represents the total number of peptide bonds susceptible to enzymatic hydrolysis (9.3 meq/g of fish protein) [17]. The degree of dissociation (α) was determined by using Equation (2):
where pH refers to the value at which the enzyme hydrolysis was conducted. The pKa values were calculated according to Steinhardt and Beychok [23], (3):
where T is the hydrolysis temperature in Kelvin.
2.5. Amino Acid Analysis
The amino acid composition of the Atlantic salmon frame and head protein hydrolysates was carried out by SPARC Molecular Analysis, The Hospital for Sick Children, Toronto, ON. The amino acid composition of each protein sample excluding tryptophan, cysteine, and methionine, was analyzed using vapor-phase hydrolysis with 6 M HCl, 1% phenol at 110 °C for 24 h. All samples were added, with Norleucine (25 μM/mL) used as an internal standard for all samples. Following hydrolysis, samples were dried and resuspended in a redrying solution of methanol/water/triethylamine (2:2:1, v/v/v), then vacuum dried for 15 min. The dried samples were subjected to pre-column derivatization using a derivatizing solution made up of methanol/water/triethylamine/phenyl isothiocyanate (PITC) (7:1:1:1, v/v/v). The derivatized samples were vacuum-dried and reconstituted in sample diluent and then analyzed by a high-performance liquid chromatography system, Waters ACQUITY UPLC (Milford, MA, USA), equipped with a 10 cm C-18 column (0.21 × 10 cm) running on a modified PICO-TAG gradient at 48 °C. The amino acids were quantified based on the peaks monitored at 254 nm with a UV detector.
2.6. Bioactive Properties of Protein Hydrolysates
2.6.1. DPPH Radical Scavenging Activity
The DPPH (2,2-diphenyl-1,1-picrylhydrazyl) radical scavenging activity was measured according to methods described by Poongothai et al. [24] and Rumpf et al. [25] with some modifications. A solution of 0.1 mM DPPH in 95% ethanol (1 mL) was mixed with 0.25 mL of Trolox or sample solutions and incubated in the dark at room temperature for 30 min. The absorbance at 517 nm was observed using a spectrophotometer (Hach DR6000, London, ON, Canada). A calibration curve was built using Trolox in the 0–300 µM range.
The radical scavenging activity (RAS) was calculated using the following formula:
where ASample is the absorbance of the tested sample, and ABlank is the absorbance of the blank, in which a solvent mixture was used instead of the sample solution mixed with the DPPH solution. A Trolox calibration curve was used to calculate the concentration of Trolox equivalent (CTE) using the following formula (Step 1):
where bcal is the intercept, and mcal is the slope of the Trolox calibration curve.
In Step 2, the Trolox Equivalent Antioxidant Capacity (TEAC) value was determined with the molar mass of the Trolox (MTrolox) and the concentration of the protein hydrolysate sample solution (CProtein) using the following formula:
2.6.2. ABTS Radical Scavenging Activity
The ABTS (2,2′-azinobis (3-ethylbenzothiazoline-6-sulfonate)) radical scavenging activity was measured according to the method described by Rumpf et al. [25] and Hunsakul et al. [19] with some modifications. An ABTS solution was prepared by mixing 7 mM ABTS and 2.45 mM potassium persulfate in a ratio of 1:1 (v/v) ratio in water, followed by incubation in the dark at 25 °C overnight. The resulting solution was diluted in a 1:50 (v/v) ratio in water to achieve an absorbance value in the range of 0.5 and 0.7 ± 0.05 at 734 nm of between 0.5 and 0.7 ± 0.05 prior to testing. For the assay, 0.25 mL of diluted ABTS radical cation solution was mixed with a 0.25 mL sample or Trolox solution, and the absorbance was recorded at 734 nm using a spectrophotometer (Hach DR6000, London, ON, Canada). A calibration curve was built using Trolox with six standards in the 0–75 mg/L range. The RSA, CTE, and TEAC were calculated as described for the DPPH assay in Section 2.6.1.
2.6.3. Hydroxyl Radical Scavenging Activity
The hydroxyl radical scavenging activity was measured according to the method by Hayta et al. [26] and Li et al. [27]. A solution of 1 mL 0.75 mM 1,10-phenanthroline, 2 mL 10 mM phosphate buffer (pH 7.4) (Na2PO4), 1 mL 0.75 mM ferrous sulfate (FeSO4), 100 µL 0.1% hydrogen peroxide, and 1 mL sample were mixed in a test tube, respectively. The mixture was incubated at 37 °C for 30 min, and absorbance was read at 536 nm using a spectrophotometer (Hach DR6000, London, ON, Canada). The hydroxyl radical scavenging activity (HRSA) was measured using the following equation:
where As is the absorbance of the tested sample; A1 is the absorbance of the control solution and 1,10-phenanthroline, FeSO4, and H2O2; A0 is the absorbance of a blank solution containing 1,10-phenanthroline and FeSO4.
3. Results and Discussion
3.1. Proximate Composition of Atlantic Salmon Processing Discards
The proximate composition of salmon heads and frames is presented in Table 1. The results indicate that heads contained a higher lipid (22.24%) than frames (20.95%). However, frames contained a higher amount of protein (17.1%) than heads (15.8%). The proximate composition reported in this study is similar to values reported by various researchers [10,20,28,29,30,31].

Table 1.
Proximate composition of Atlantic Salmon Head and Frame (Wet Basis); values are expressed as mean ± SD.
3.2. Effect of Operational Parameters on Degree of Hydrolysis
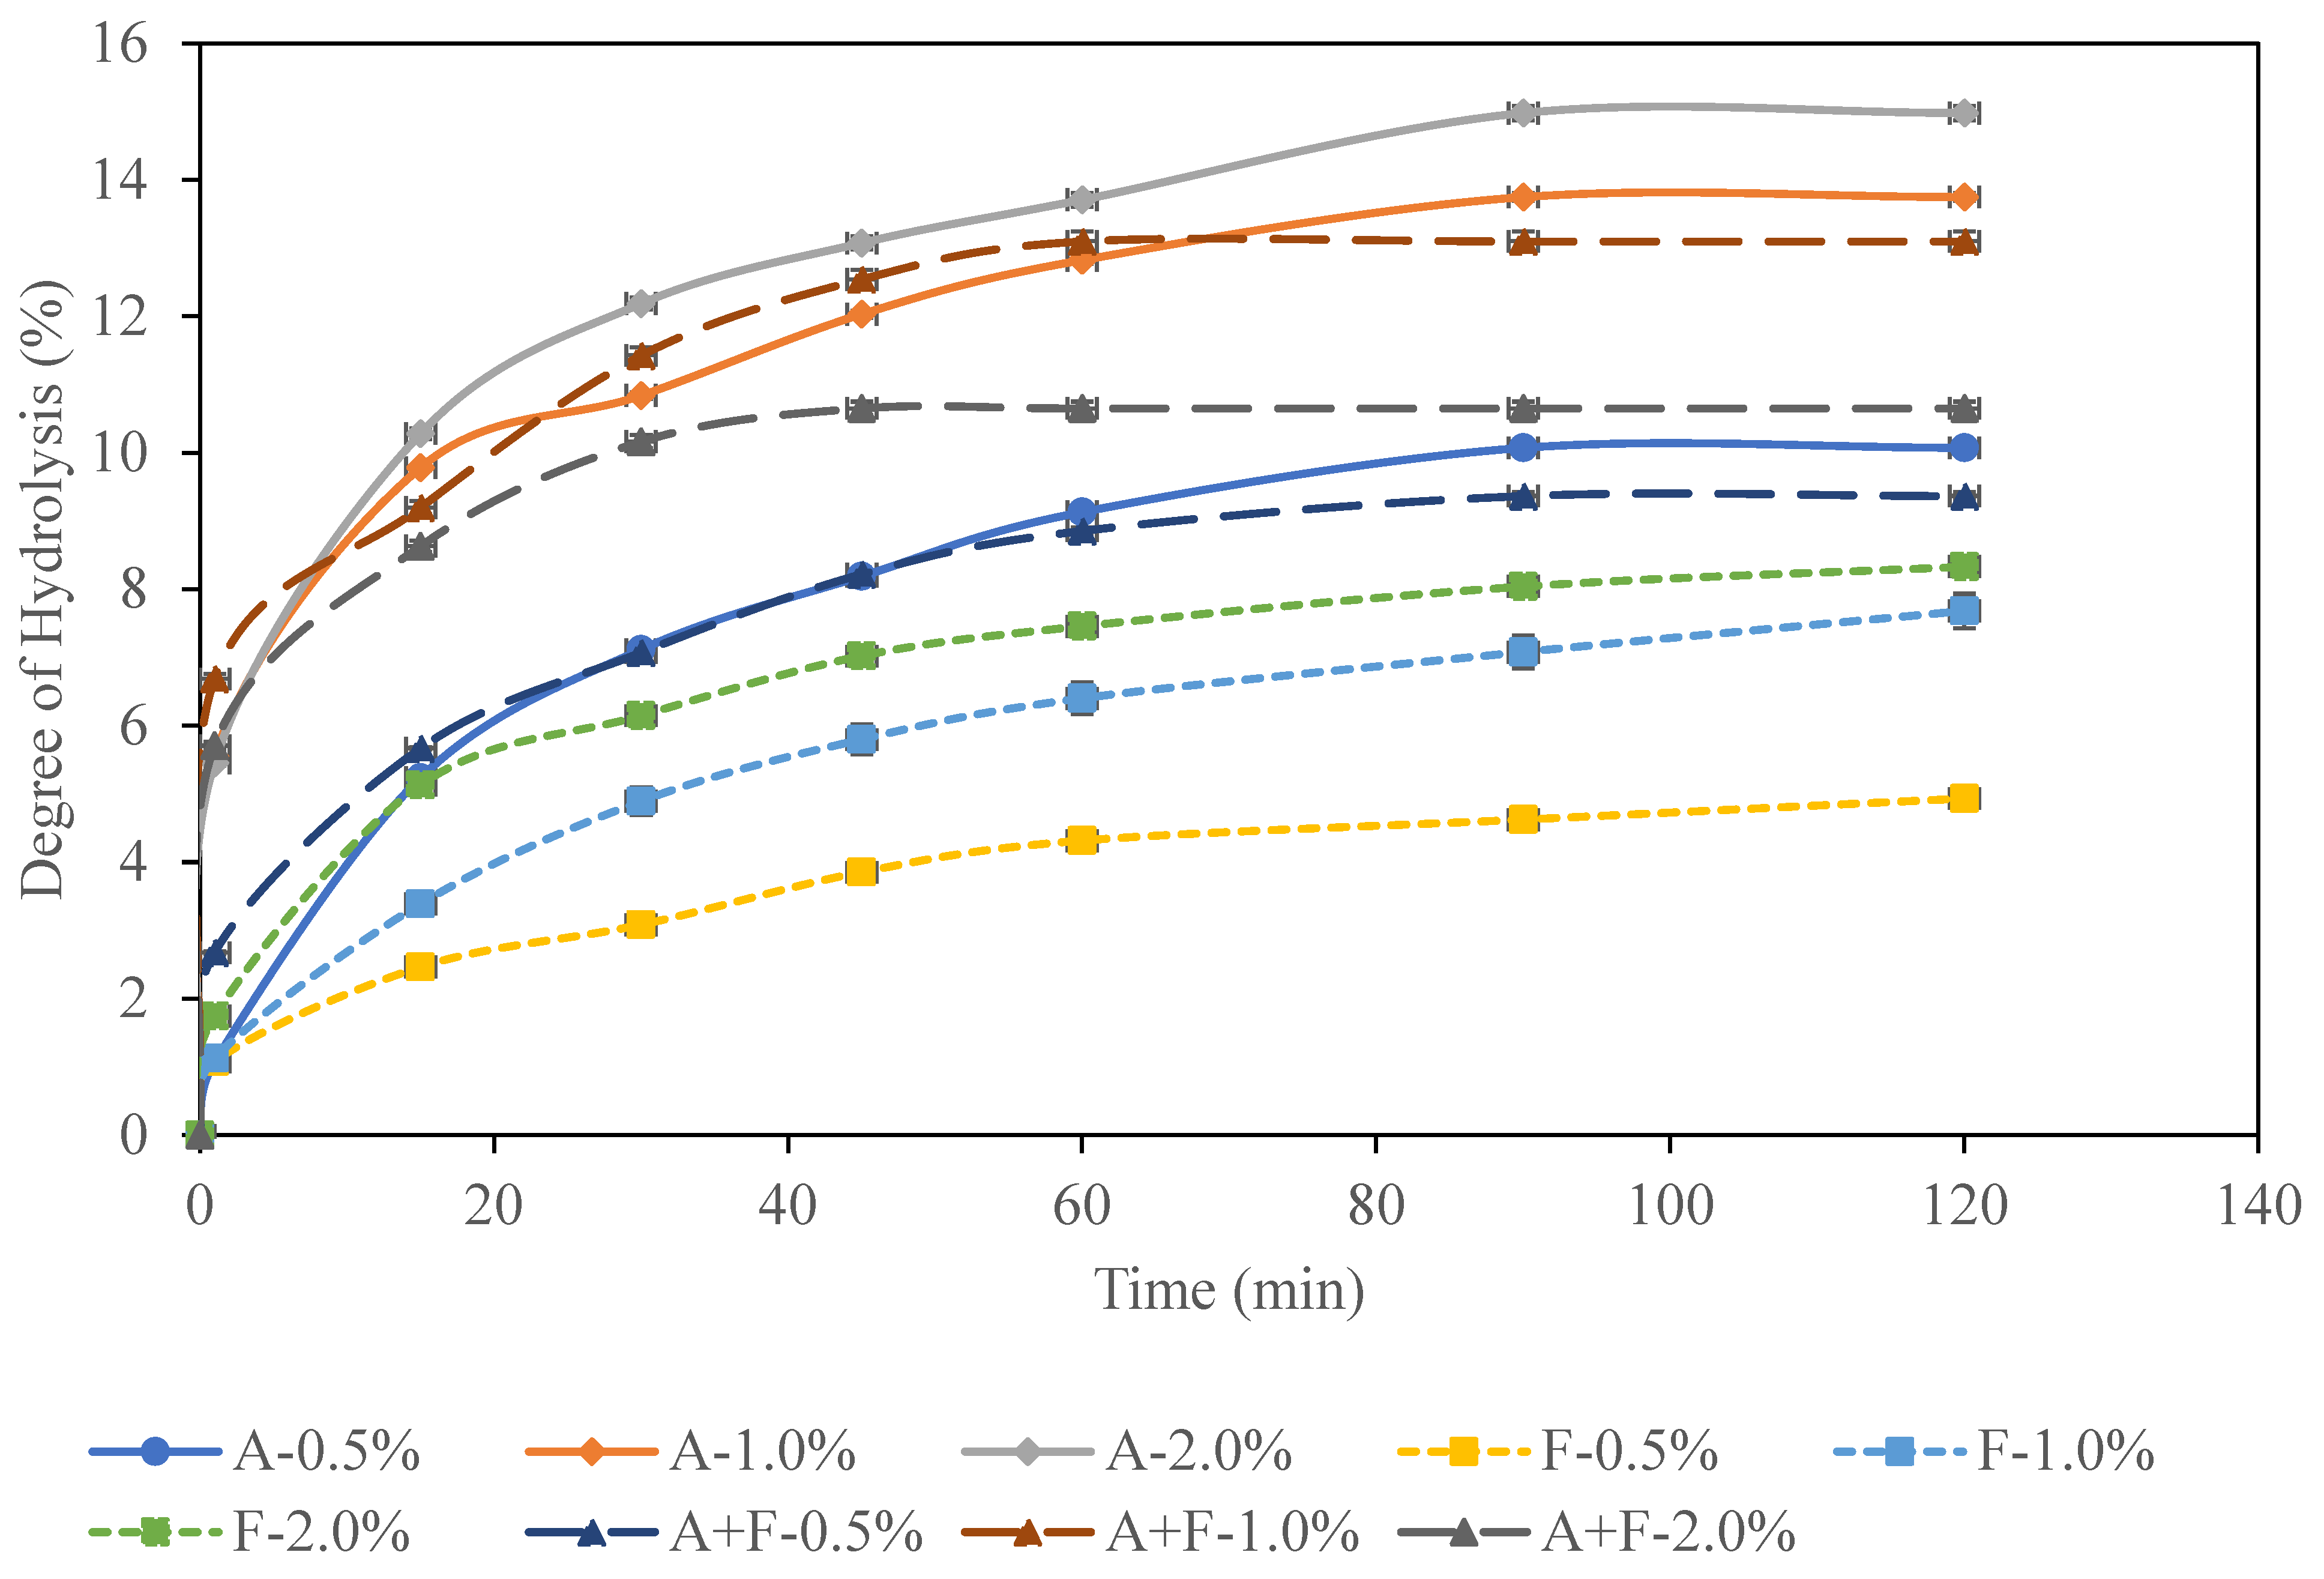
The effect of three operational parameters, including parts, enzyme concentrations, and enzyme type, on the degree of hydrolysis during the enzymatic hydrolysis of Atlantic salmon processing discards was studied. A full factorial design was employed with two levels for parts (Heads and Frames), three levels for enzymes (Alcalase, Flavourzyme, and Alcalase + Flavourzyme), and three levels for the enzyme concentrations (EC) (0.5, 1, and 2%). The degree of hydrolysis for Atlantic salmon frames and heads was in the range of 4.94–14.98% and 4.79–12.47%, respectively (Figure 2 and Figure 3). The highest degree of hydrolysis was achieved for salmon frames (14.98%) and heads (12.47%) hydrolyzed by Alcalase at 2.0% enzyme concentration for 2 h. In contrast, the lowest degree of hydrolysis was found in salmon frames (4.94%) and heads (4.79%) hydrolyzed by Flavourzyme at a 0.5% enzyme concentration for the same duration. The results also showed that the combination of Alcalase and Flavourzyme was significantly more effective than Flavourzyme alone but slightly less effective than Alcalase itself across all experiments.
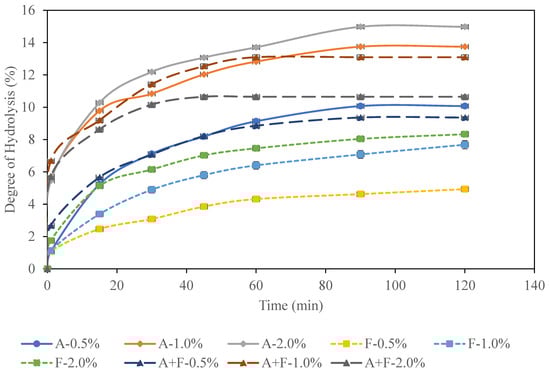
Figure 2.
Degree of hydrolysis (DH) of Atlantic salmon frames treated with different enzymes: A (Alcalase), F (Flavourzyme), and A + F (Alcalase + Flavourzyme).
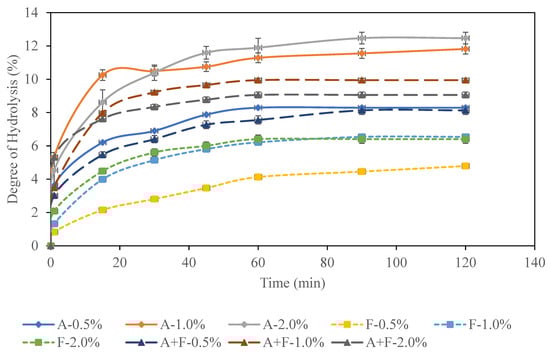
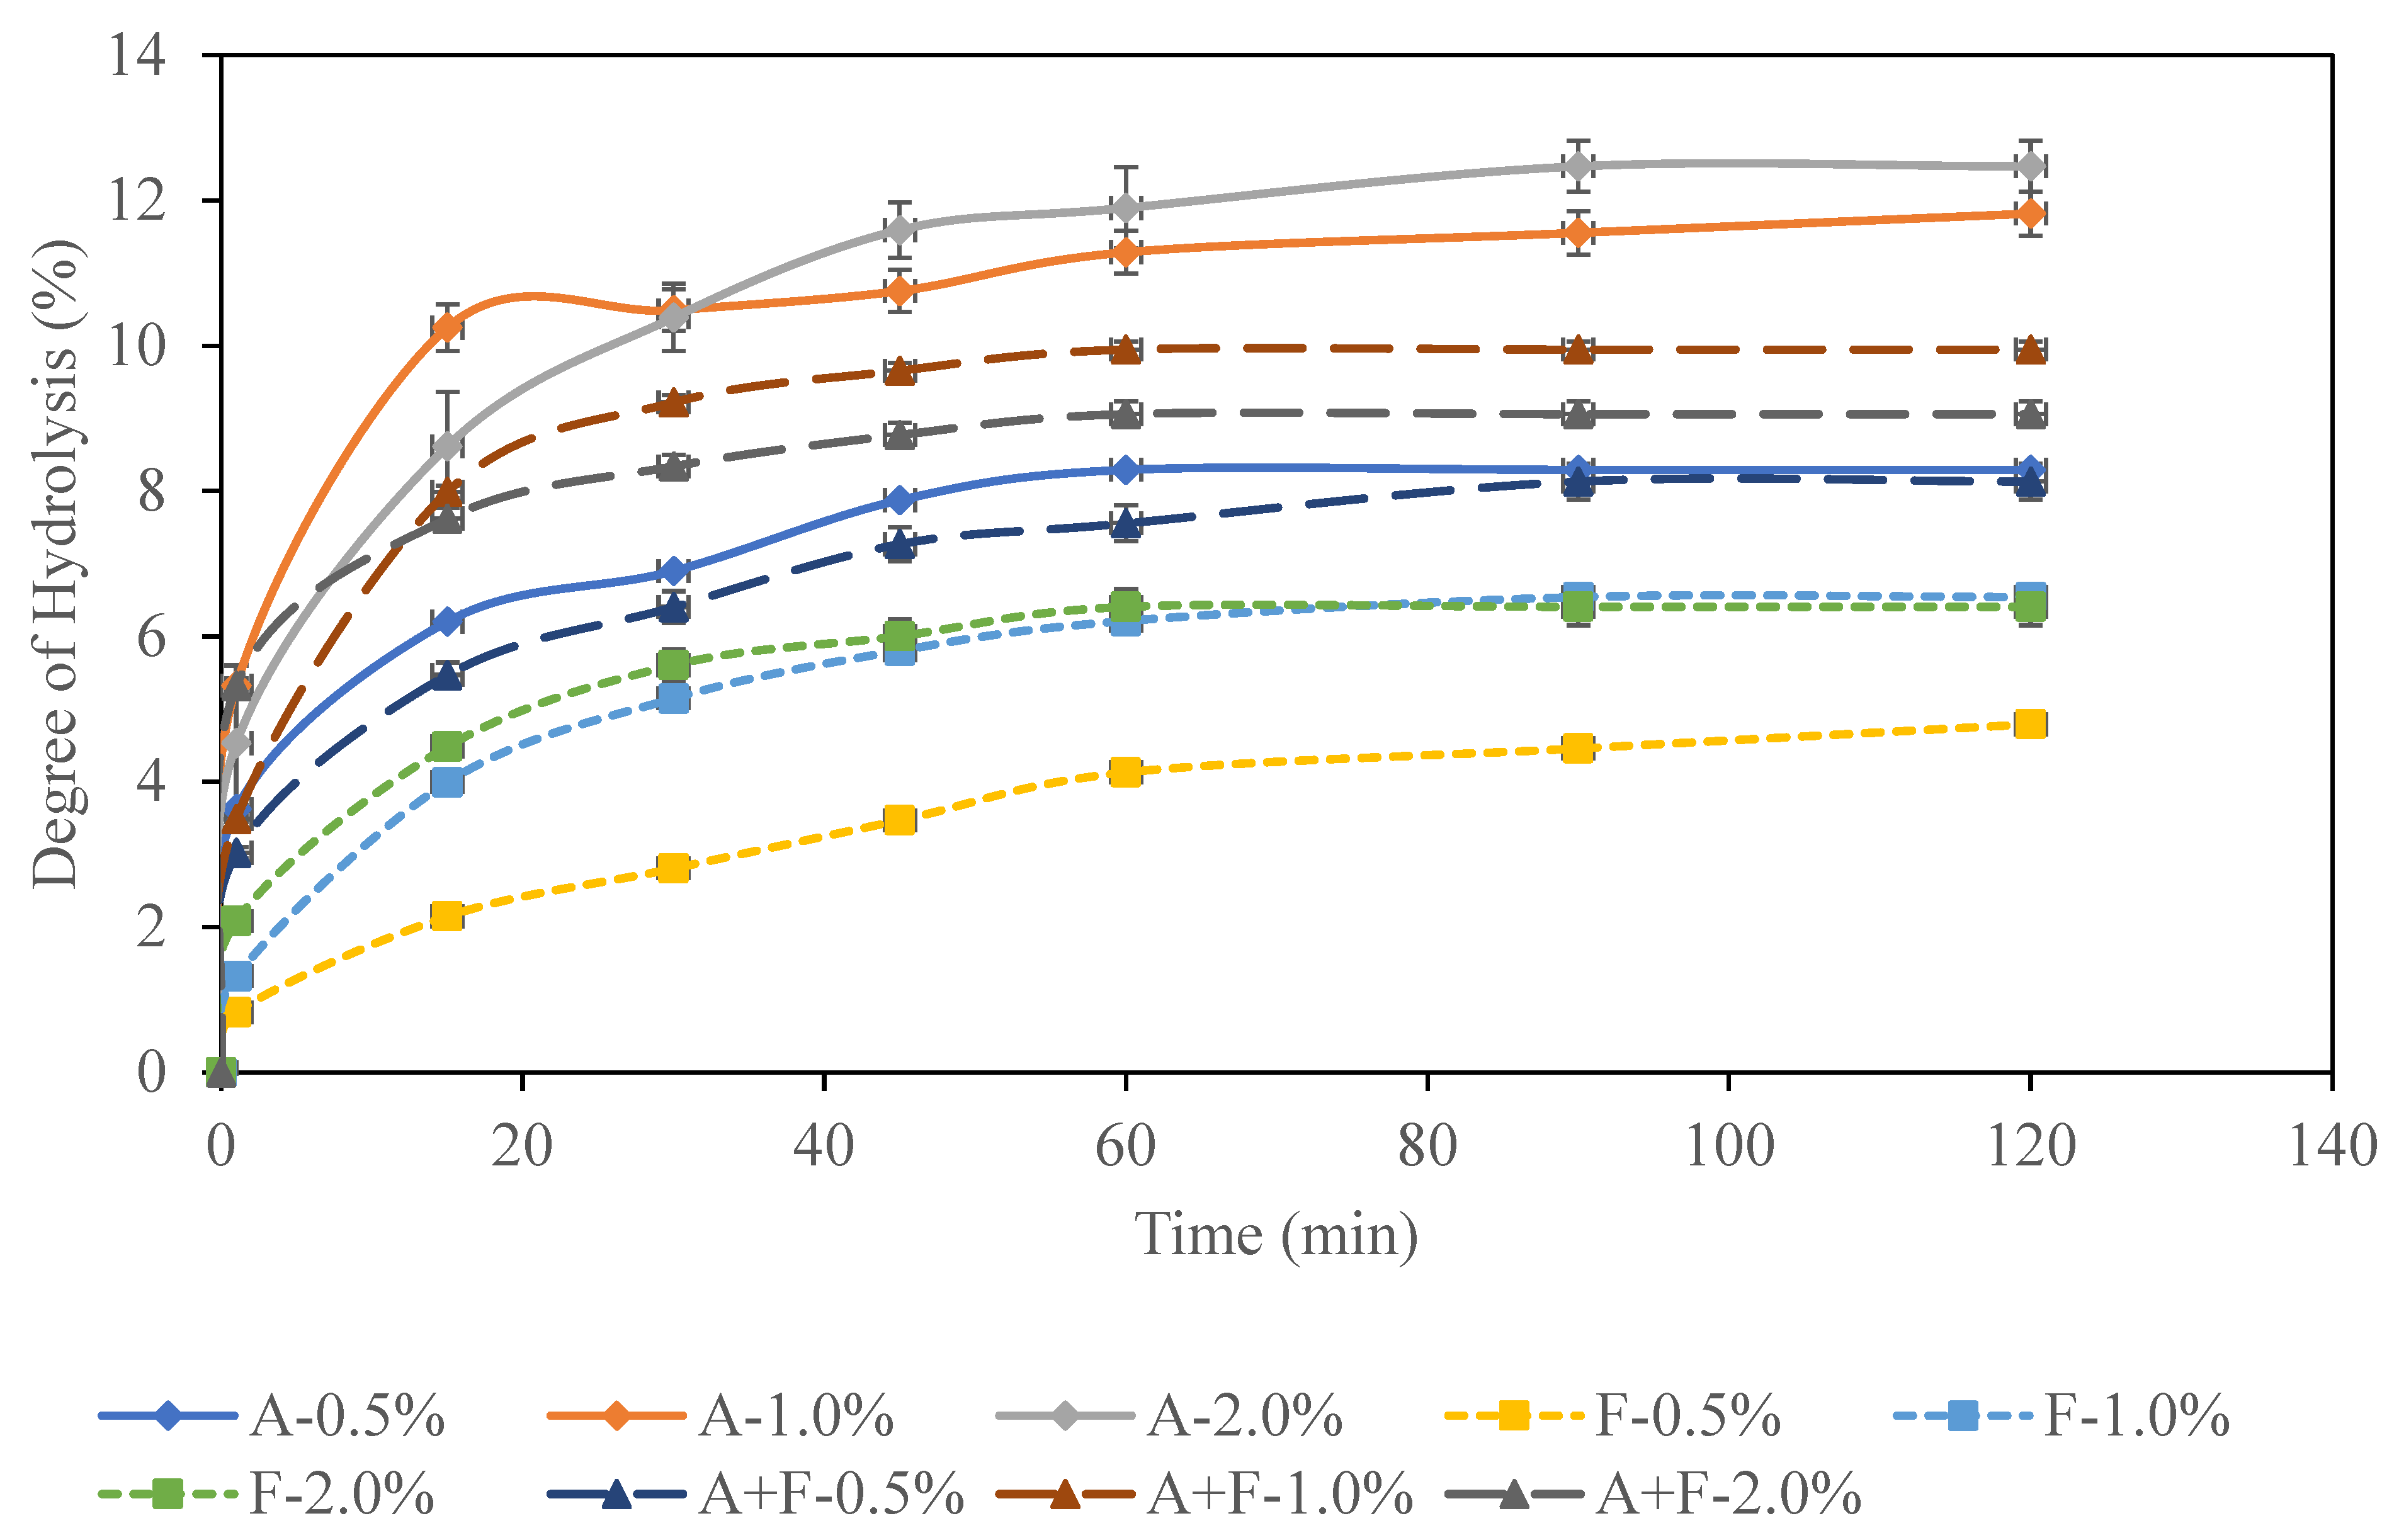
Figure 3.
Degree of hydrolysis (DH) of Atlantic salmon heads treated with different enzymes: A (Alcalase), F (Flavourzyme), and A + F (Alcalase + Flavourzyme).
The enzymatic hydrolysis of Atlantic salmon frames and heads and the degree of hydrolysis over time are shown in Figure 2 and Figure 3, which describe similar proteolysis patterns to those reported in various studies [32,33]. Enzymatic hydrolysis can occur through two primary mechanisms: the “zipper mechanism”, where intermediates are progressively hydrolyzed over time, or the “one-by-one mechanism”, which involves the sequential release of individual peptides. Upon the addition of an enzyme, the reaction typically begins with a rapid phase, during which multiple peptide bonds are cleaved per unit of time, resulting in the release of a significant amount of soluble material into the solution [34]. After this phase, a stationary period begins, during which the more compacted core proteins break down at a slower rate until no further products are detected. However, in most cases, protein hydrolysis proceeds through a combination of both mechanisms [35,36,37,38].
The Analysis of Variance of all the factors on the degree of hydrolysis is shown in Table 2. The ANOVA analysis indicates that all factors had a significant effect on the degree of hydrolysis, with a p-value of 0.000 in all interactions. The R2 value of 99.85% indicates that the model was able to fit the data adequately.
Table 2.
Analysis of Variance of Degree of Hydrolysis vs. Factors.
3.2.1. Effect of Parts on Degree of Hydrolysis
The effect of salmon head and frame on the degree of hydrolysis is shown in Figure 4a and Table 3. The results indicated that the higher mean degree of hydrolysis achieved from frames (10.31%) compared to heads (8.62%), and both were significantly different from each other, represented by different letters in Tukey grouping at a 95% confidence interval. The highest degree of hydrolysis after 2 h hydrolysis at pH 7 reported in this study from salmon heads and frames was 12.47 and 14.98%, respectively.
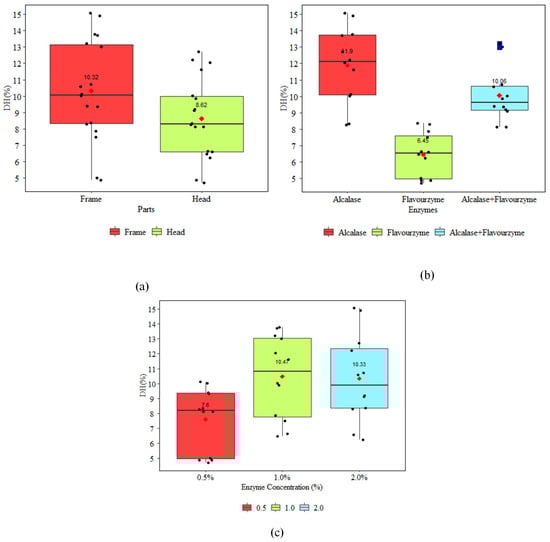
Figure 4.
Effect of Factors: (a) Parts; (b) Enzymes; (c) Enzyme Concentration on Degree of Hydrolysis.
Table 3.
Tukey Grouping of Factors on Degree of Hydrolysis at 95% Confidence Interval.
Gbogouri et al. investigated the effect of the degree of hydrolysis on the functional properties of salmon head protein hydrolysates Alcalase and reported DH ranging from 11.5 and 17.3% [10]. The results from their study were slightly higher than those reported in the present research work. Liaset et al. studied the enzymatic hydrolysis of frames from Atlantic salmon and Atlantic cod for 2 h, and they reported a degree of hydrolysis range between 14.5 and 23.1% for Atlantic salmon and between 15.6 and 23.3% for Atlantic cod [39]. Opheim et al. [13] studied the enzymatic hydrolysis of Atlantic salmon discards (mixture of heads, frames and viscera). The results from the study reported a degree of hydrolysis range between 27 and 50%. Pires et al. studied the enzymatic protein hydrolysis from Atlantic salmon and reported a degree of hydrolysis of 26.2%. These results were higher than reported in the current research work [40]. Aspevik et al. studied the hydrolysis of Atlantic salmon by-products. This study indicated that a degree of hydrolysis range of 11.7–14.6% was achieved using various endopeptidases [17]. The results from their study were similar to the degree of hydrolysis achieved in this research work.
3.2.2. Effect of Enzymes on Degree of Hydrolysis
The enzymes and their specificity have a significant impact on the hydrolysis process and outcome. Each enzyme, at the optimum temperature and pH, cleaves peptide bonds, resulting in a digestion consisting of varying amino acids and peptides [41]. The research work was carried out using three types of enzymes, including Alcalase, Flavourzyme, and Alcalase + Flavourzyme. Alcalase is a broad-spectrum serine endopeptidase that hydrolyzes internal peptide bonds within protein chains into smaller peptides and amino acids. It acts predominantly on the nonterminal amino acid residues, particularly at the C-terminal side of peptide bonds. Alcalase demonstrates high specificity towards peptide bonds adjacent to aromatic (Phe, Trp, and Tyr), acidic (Glu), sulfur-containing (Met), aliphatic (Leu and Ala), hydroxyl (Ser), and basic (Lys) residues, which preferentially hydrolyses peptide bonds containing aromatic amino acid residues [19,42]. Flavourzyme is a mixture of peptidase, endopeptidase, and exopeptidase, which cleaves the peptide bonds within and at the ends of protein molecules with a specific focus on N-terminal amino acids [43,44].
The effect of enzymes on the degree of hydrolysis is shown in Figure 4b and Table 3. The results indicate that the mean degree of hydrolysis achieved from Alcalase, Alcalase + Flavourzyme and Flavourzyme was 11.89, 10.05, and 6.44%, respectively, and these were significantly different from each other, represented by different letters in Tukey grouping at a 95% confidence interval. The results indicate that Alcalase yielded a higher degree of hydrolysis than Flavourzyme and Alcalase + Flavourzyme.
Aspevik et al. compared the cost efficiency of different endopeptidases (Alcalase 2.4L, Corolase 7089, Neutrase 0.8L, Promod 671L and Protex 7L) for the hydrolysis of Atlantic salmon by-products. The hydrolysis was conducted at a fixed temperature, pH, and time of 50 °C, 6.5, and 120 min, respectively, and they reported a degree of hydrolysis of 14.2–14.6% using Protex 7L, Alcalase 2.4L, and Promod 671L. In addition, enzymes Neutrase 0.8L and Corolase 7089 produced a degree of hydrolysis of 11.7 and 13.6%, respectively [17]. The results from their study were similar to the degree of hydrolysis achieved in this work.
Slizyte et al. studied the enzymatic hydrolysis of defatted salmon backbones using Corolase PP, Corolase 7089, Protamex, Papain, Bromelain, Protex 6L, Seabzyme L200, and Trypsin. The hydrolysis was carried out at a fixed temperature and time of 50 °C and 120 min, respectively, and they reported a degree of hydrolysis in the range of 16.8–22.1% [14]. Liaset et al. also reported a similar DH range (20–21%) for salmon frames hydrolyzed by Alcalase enzyme [39]. The results from their study were higher than the degree of hydrolysis achieved in the present research work.
3.2.3. Effect of Enzyme Concentration (EC) on the Degree of Hydrolysis
The research work was carried out at three different enzyme concentrations (EC) of 0.5, 1.0, and 2.0%, and effect on the degree of hydrolysis on enzymatic hydrolysis of Atlantic salmon heads and frames is shown in Figure 4c and Table 3. The results indicated that the highest mean degree of hydrolysis of 10.47% was achieved using 1% enzyme concentration. However, it was not significantly different from the mean hydrolysis degree of 10.33% achieved using 2% enzyme concentration. The minimum degree of hydrolysis was recorded at a 0.5% enzyme concentration. The findings suggest diminishing returns upon augmenting the enzyme concentration from 1.0 to 2.0%. Pires et al. showed a higher degree of hydrolysis (26.2%) during the hydrolysis of salmon heads using 1% Alcalase at pH 8.5 for 3 h with a sample-to-water ratio of 1:2 (w/v) [40]. While the enzyme concentration in their study was similar to the current research, they used a higher pH, longer reaction time, and a larger sample-to-water ratio compared to the conditions of pH 7, 2 h, and a 1:1 (mL/g) ratio in the present study. Aspevik et al. studied the enzymatic hydrolysis of Atlantic salmon using the Alcalase at various concentrations (5.5, 11, 22, 44, and 88 U per g of protein) and reported a degree of hydrolysis of 14.2–14.6% at 88 U/g [17]. While the enzyme concentration in their study was mentioned in different units, the degree of hydrolysis results was similar to the current research.
3.2.4. Summary of DH vs. Enzyme vs. Enzyme Concentration vs. Parts
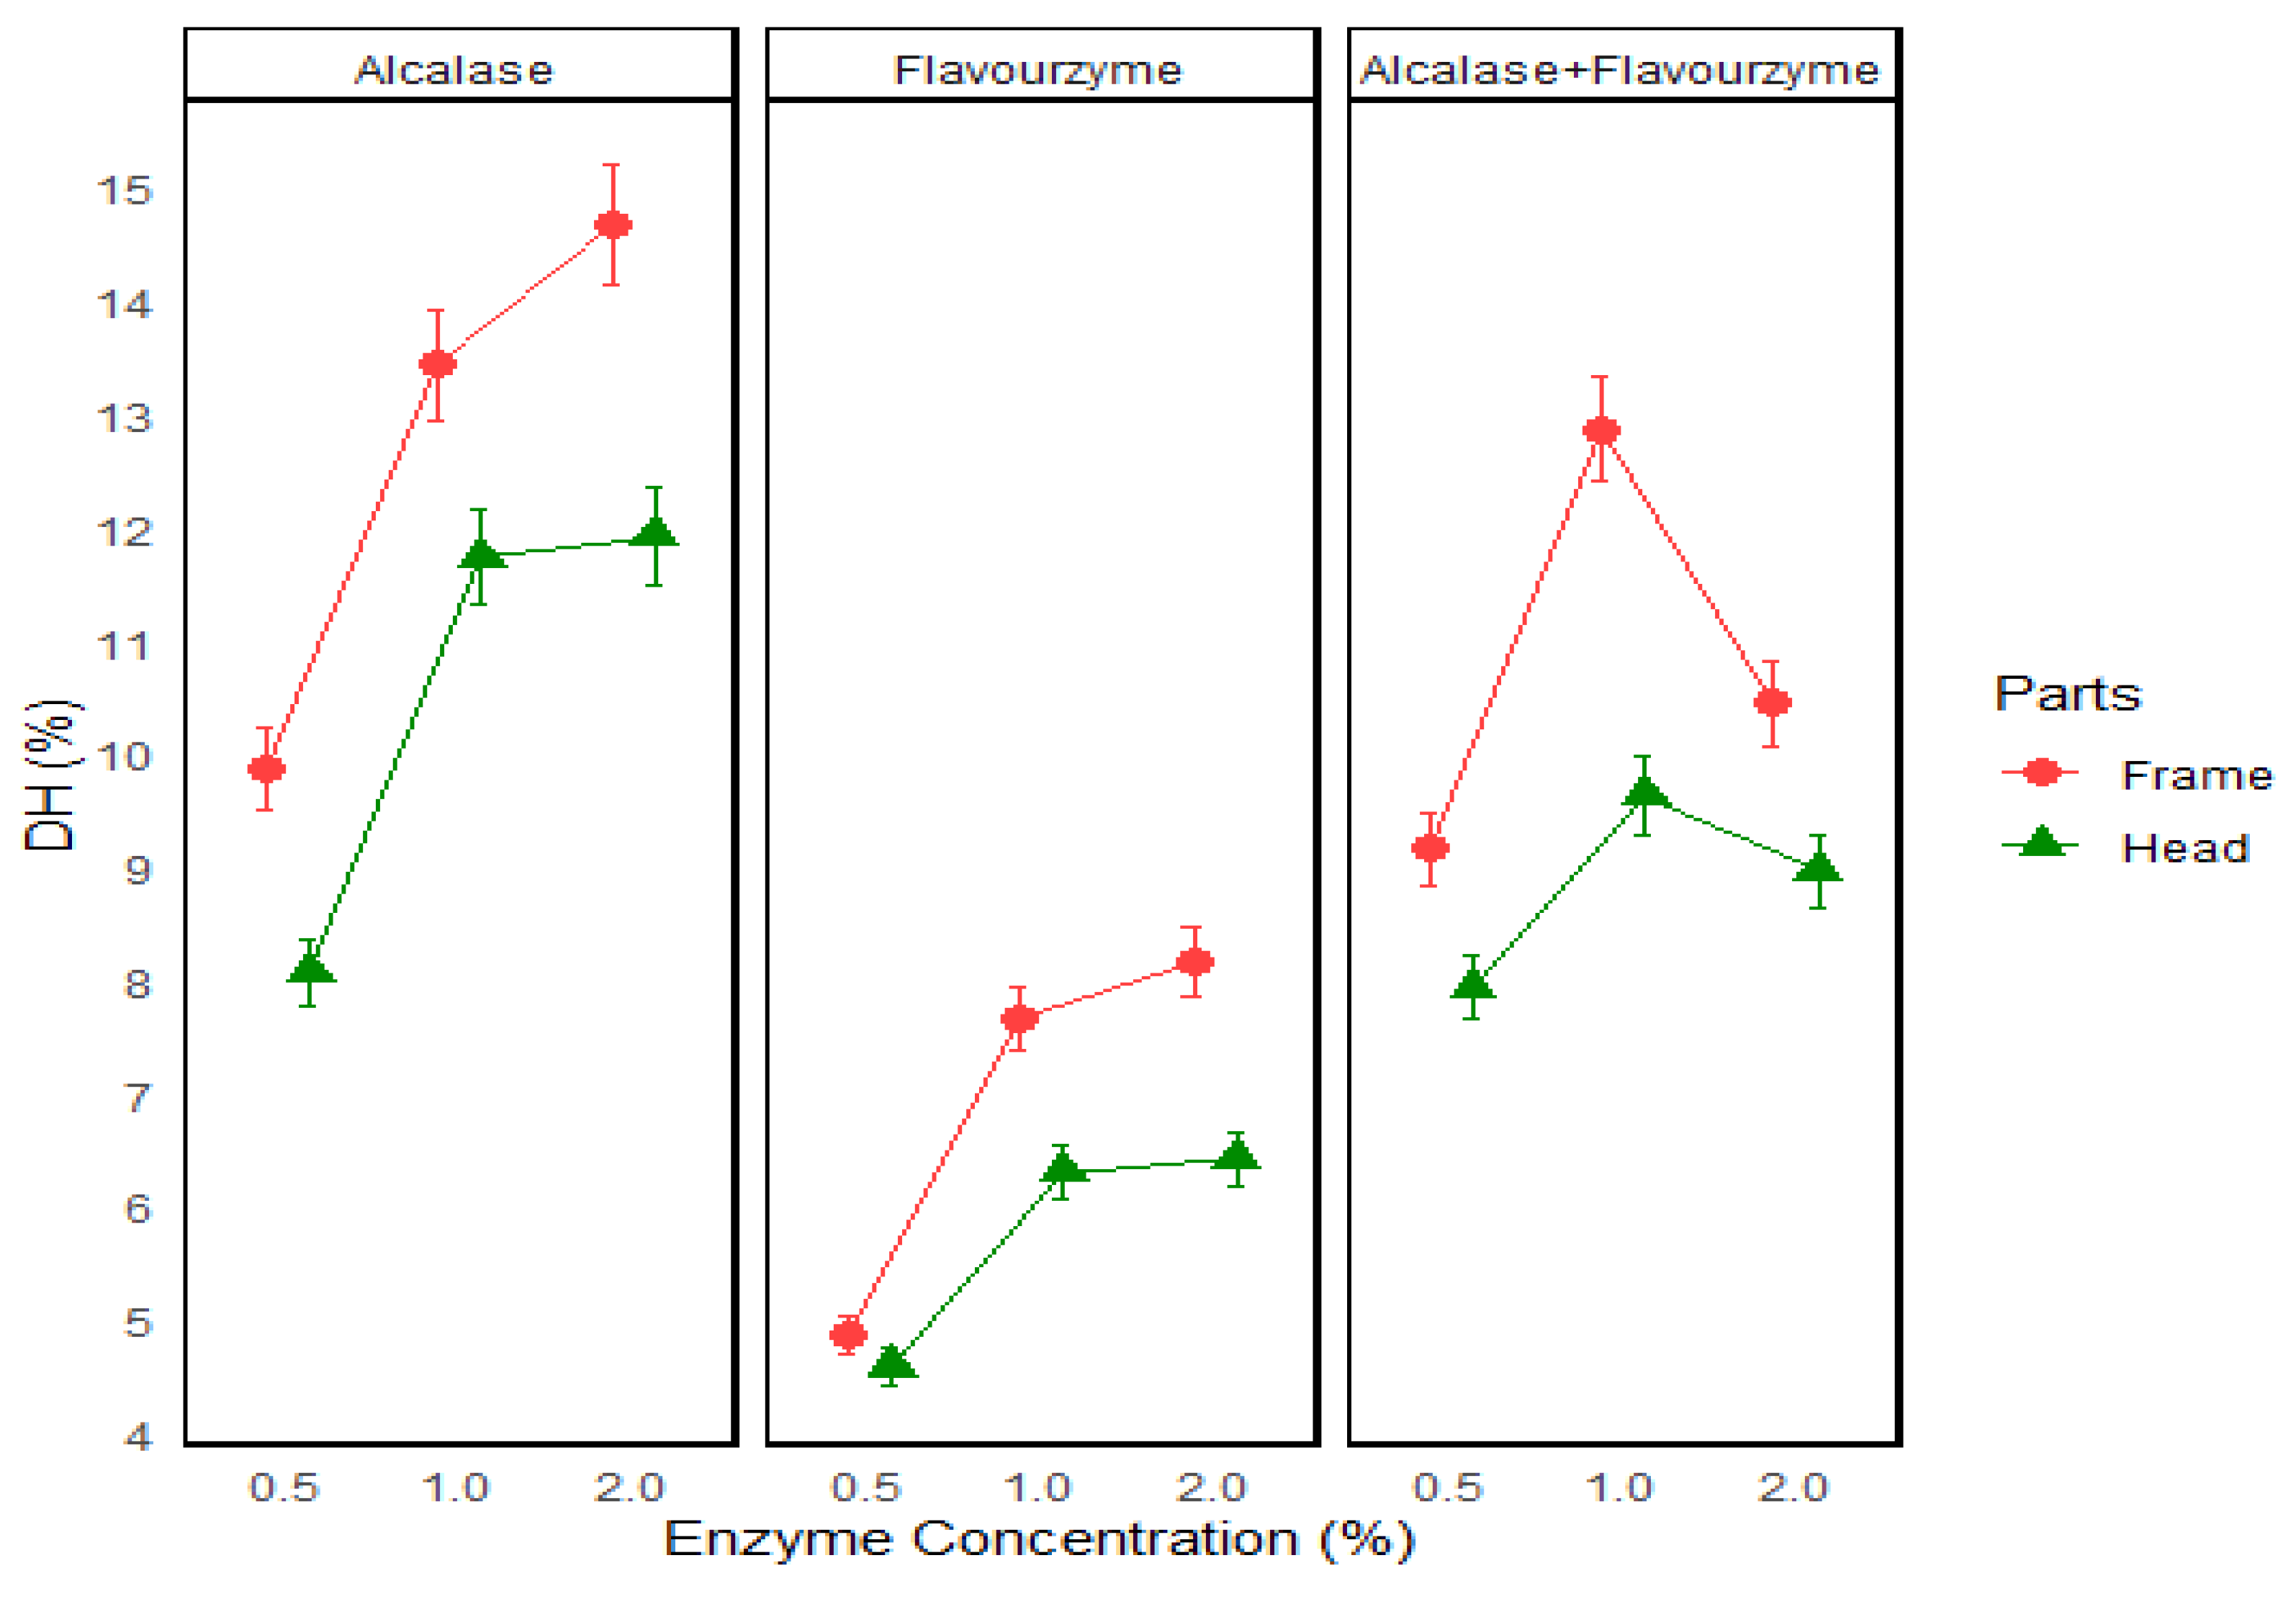
The effect of all factors on the degree of hydrolysis is shown in Figure 5. The results indicated that salmon frames yielded the highest degree of hydrolysis than heads using all three enzyme types and at all enzyme concentrations (EC). The results also indicated that while using Alcalase, the mean degree of hydrolysis increased with increasing enzyme concentration from 0.5 to 2% for both frames and heads. However, when Flavourzyme and Alcalase + Flavourzyme enzymes were used for hydrolysis, the mean degree of hydrolysis increased with increasing enzyme concentrations from 0.5 to 1% and saturated or decreased with increasing enzyme concentrations from 1 to 2% for both frames and heads. These results were similar to those reported by Noman et al. where they found that increasing the papain concentration from 3 to 3.5% led to a decrease in the degree of hydrolysis. A decrease in the DH could be related to an increase in amino acids and smaller peptides that were released during the hydrolysis [45]. Islam et al. reported a decrease in DH during hydrolysis of grass turtle muscle using papain when the enzyme concentration was increased from 5 to 6%. This reduction in DH was attributed to the enzymatic steric effect that reduces access for the protein substrates to bind with the catalytic sites of the enzyme. In addition, the reduction in substrate diffusion and saturation reaction rate may negatively contribute to the decline in the enzymatic efficiency [46]. Islam et al. reported a reduction in DH while the enzyme concentration was increased by 2.5 to 3.5% for Alcalase and 3 to 3.5% for Protamex during soybean hydrolysis. Overall, the degree of hydrolysis could be affected by various factors, including pH, temperature, water-to-substrate ratio, time, and particle size [47].
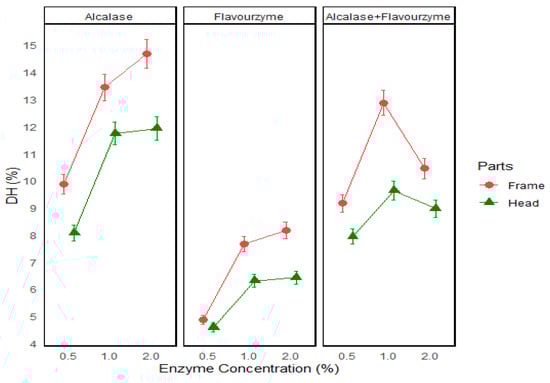
Figure 5.
Summary—DH vs. Enzymes vs. Enzyme Concentration vs. Parts (Hydrolysis Time: 2 h).
The current research work produced a lesser degree of hydrolysis during enzymatic hydrolysis of salmon processing discards compared to various literature studies [13,14,31,39,40]. The lower degree and significant drop of hydrolysis could be due to larger particle size after mincing, as the samples in this study were only minced twice through 17 and 15 mm reducer plates in the mincer also noticed a significant drop in the degree of hydrolysis when they compared the enzymatic hydrolysis of Atlantic salmon frames cut into smaller chunks and minced samples (blended for 5 min in a blender). The results in their study indicated a degree of hydrolysis in the range of 21–22% for the chunk salmon frames treated with Alcalase at 1–2% enzyme concentration for 3 h. In comparison, the minced salmon frames reported 25–27% degree of hydrolysis at the same operational parameters. The study also concluded that minced samples had a larger surface area and provided more accessibility to enzymes during hydrolysis compared to chunk samples. The results from the present study were similar to those reported by Aspevik et al., as they also used coarsely cut samples for their enzymatic hydrolysis [17].
The working pH and temperature range for Alcalase and Flavourzyme is 6.5–10 and 60–75 °C and 4–8 and 30–65 °C, respectively. The optimum parameters reported for Alcalase and Flavourzyme are around 55 °C and pH of 8 [11] and 50 °C and a pH of 6.5 [48], respectively. In the present study, a reaction temperature of 55 °C was selected for Alcalase and Alcalase + Flavourzyme hydrolysis, while 50 °C was chosen for Flavourzyme hydrolysis. A pH of 7 was selected for the experiments. While the chosen temperatures (55 °C and 50 °C) align with the optimal conditions for both enzymes, the pH of 7 is slightly lower than the values reported in previous studies [10,11,13,49]. The pH was selected to ensure optimal performance of both Alcalase and Flavourzyme. Increasing the pH to 8 to meet Alcalase’s optimal conditions could lead to a significant reduction in Flavourzyme activity.
3.3. Proximate and Amino Acid Composition of Salmon Protein Hydrolysate
The proximate and amino acid composition of salmon head and frame protein hydrolysate powder are shown in Table 4 and Table 5. The results indicate that these salmon head (76.7%) and frame (72.1%) hydrolysates are rich in protein with salt contents of 4.53% and 5.50%, respectively, following two filtration steps using a coarse and polishing wine filter. These findings align with those reported by Steinsholm et al. [50] and Beaulieu et al. [51]. Steinsholm et al. reported an average protein content of 78 g/100 g and salt content of 1.9% for Atlantic salmon backbone and head protein hydrolysates filtered through membrane filtration. Further filtration using nanofiltration and diafiltration increased the protein content to 87 g/100 g while reducing the salt content to 0.4% due to the removal of non-protein dry matter. Additionally, the study highlighted significant protein losses at various processing and filtration stages, underscoring the need for process optimization [50].
Table 4.
Proximate Composition of Atlantic Salmon Head and Frame Protein Hydrolysates (Wet Basis).
Table 5.
Amino Acid Composition of Atlantic Salmon Head and Frames Protein Hydrolysates.
Beaulieu et al. reported a protein content of 49 g/100 g for Atlantic mackerel protein hydrolysate after centrifugation, which decreased to 34 g/100 g following microfiltration. However, protein content increased to 47, 88, 84, 89, and 63.84 g/100 g after 50 kDa, 10 kDa, and 1 kDa ultrafiltrations, nanofiltration, and reverse osmosis. The study also found that mineral content rose from 3.15% after ultrafiltration to 33.33% after reverse osmosis. The total amino acid composition (TAA) varied depending on the filtration membrane, measuring 55.21, 60.09, 60.13, 65.10, 65.52, and 26.72 g/100 g for microfiltration, ultrafiltration, nanofiltration, and reverse osmosis, respectively. The study concluded that free amino acids and non-protein nitrogen compounds, such as trimethylamine oxide and urea, contribute to the overestimation of crude protein content [51].
The samples of protein hydrolysate for amino acid analysis were selected based on the processing parameters that yielded the highest degree of hydrolysis. The results indicated that the average total amino acid composition (TAA) of Atlantic salmon head and frame was 54.813 and 58.060 g/100 g, respectively. These values are lower than those reported for salmon trimmings (75 g/100 g; Whatman Grade 1 filter paper) [52], viscera + heads + frames (76–86 g/100 g; no filtration, frozen tubes were cut to extract FPH) [13], salmon heads (64 g/100 g; coarsely filtered) [10], salmon frames (76 g/100 g; ultrafiltration 100 kDa) [15] and salmon backbone and head (80–83 g/100 g; cross-flow ultrafiltration 100 kDa) [53]. There were significant differences in amino acid composition observed among protein hydrolysates from the same species processed using different filtration techniques. The choice of raw material plays a crucial role in determining the amino acid composition of protein hydrolysates. Additionally, factors such as enzyme type and hydrolysis conditions also influence the final amino acid profile [3].
The results from this study also indicated that salmon head protein hydrolysates contain higher concentrations of serine (8.58%), glycine (26.60%), arginine (8.05%), and proline (18.78%) compared to frame protein hydrolysates. However, salmon frame protein hydrolysates contain between 8 and 26% higher concentrations of the remaining 13 amino acids, especially the essential amino acids, than salmon head hydrolysate. These results clearly indicated a superior amino acid profile for salmon frame protein hydrolysates. Glutamine/glutamic acid (Glx), glycine (Gly) and asparagine/aspartic acid (Asx) were the top three abundant non-essential amino acids present in all the protein hydrolysates. The highest content of essential amino acids present in both protein hydrolysates was leucine (Leu), followed by valine (Val) isoleucine (Ile). However, most of the salmon protein produced in this research work contain all essential and non-essential amino acids, making them potential sources of functional food ingredients. On average, a 70 kg adult requires about 6 g of essential amino acids per day, and all salmon protein hydrolysates contain more than 17 g/100 g of essential amino acids indicating their nutritional adequacy for meeting daily amino acid requirements [3,12,53,54].
3.4. Effect of Operational Parameters on the Bioactive Properties
The effect of three operational parameters, including parts, enzyme concentrations, and enzyme types, on the DPPH, ABTS and hydroxyl radical scavenging activities of protein hydrolysates obtained from enzymatic hydrolysis of Atlantic salmon processing discards were studied. A full factorial design was employed with two levels for parts (Heads and Frames), three levels for enzymes (Alcalase, Flavourzyme, and Alcalase + Flavourzyme), and three levels for the enzyme concentrations (0.5, 1, and 2%).
3.4.1. DPPH Radical Scavenging Activity
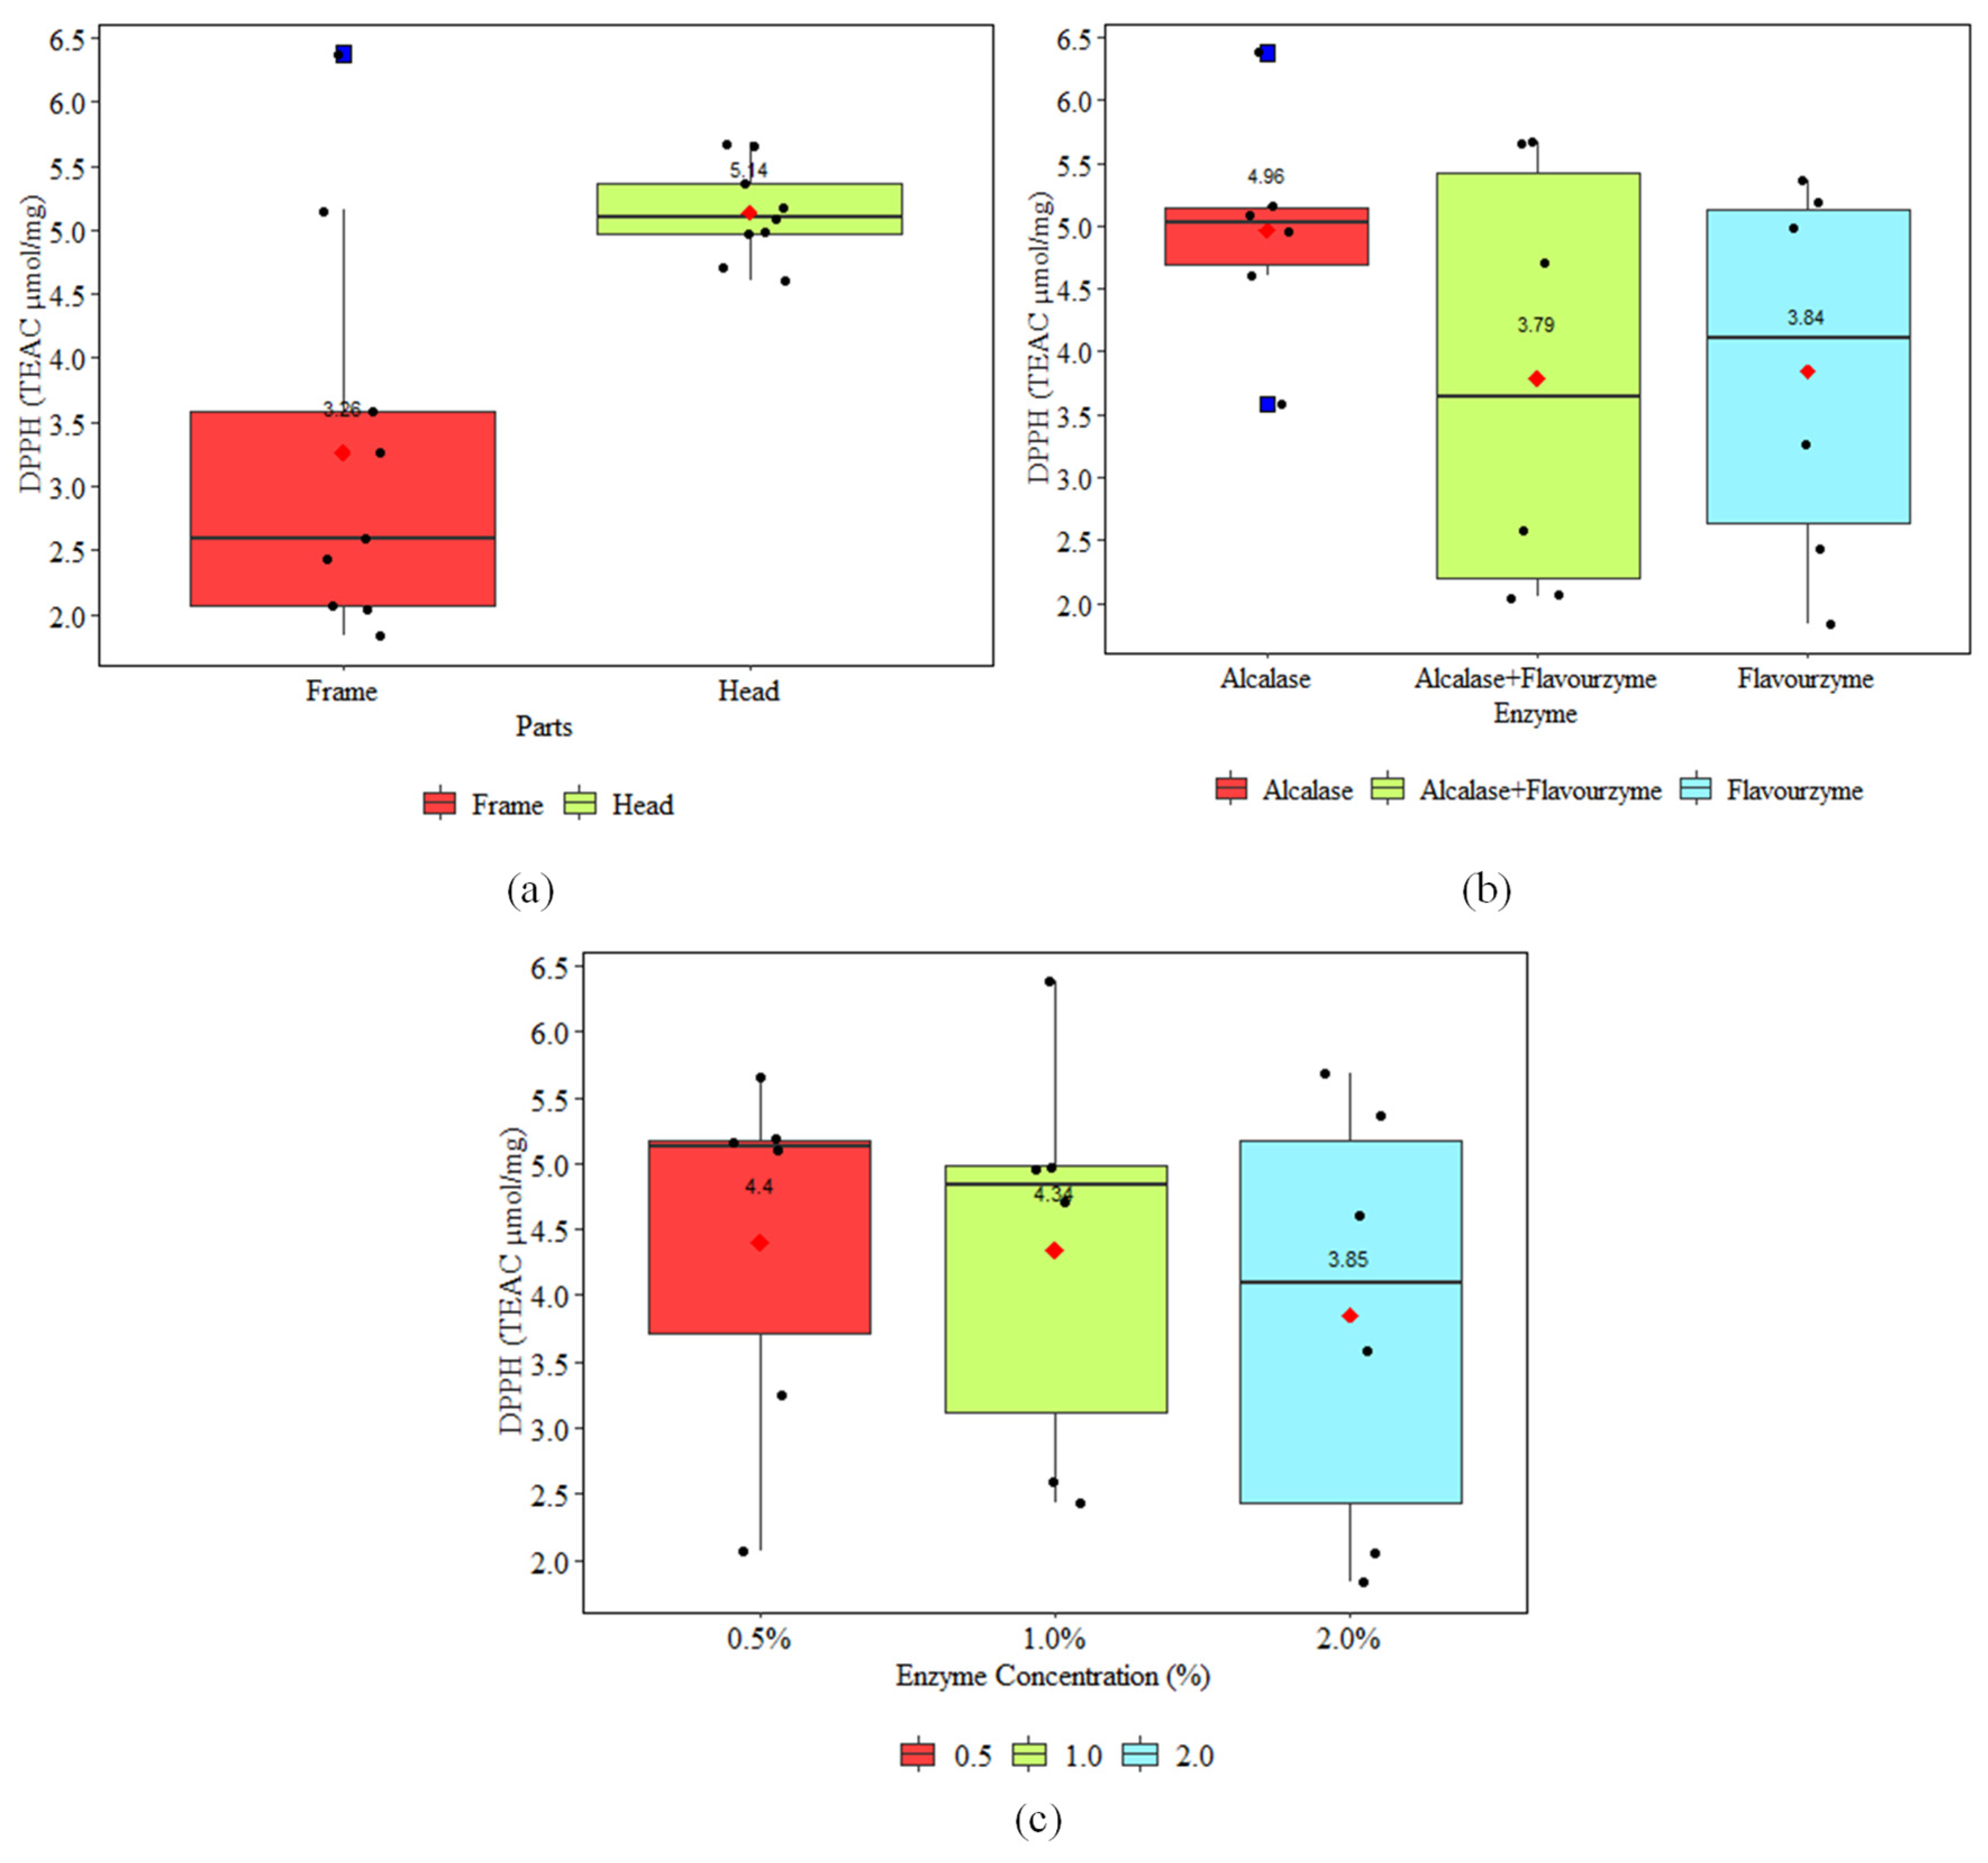
The 2,2-diphenyl-1-picrylhydrazyl (DPPH) radical scavenging assay is one of the most commonly employed methods for the preliminary assessment of antioxidant activity. This assay primarily follows an electron transfer (ET) mechanism, with hydrogen atom transfer (HAT) playing a minimal role. DPPH is a stable chromogenic radical characterized by its deep purple color. The assay operates on the principle of electron donation by antioxidants, leading to the neutralization of the DPPH radical [55,56,57,58]. The effect of parts (salmon heads and frames), enzymes (Alcalase, Flavourzyme and Alcalase + Flavourzyme), and enzyme concentrations (0.5, 1 and 2%) on the DPPH radical scavenging activity is shown in Figure 6 and Table 6. The DPPH radical scavenging activity in this study ranged between 1.83 and 6.38 µmol/mg (15.87–55.24%). The results indicated that the mean DPPH scavenging activity achieved for protein hydrolysates from heads (5.14 µmol/mg) was higher and significantly different (95% confidence interval) than that from frames (3.26 µmol/mg). Of the three enzymes tested, Alcalase produced the highest mean DPPH scavenging activity (4.96 µmol/mg), followed by Flavourzyme (3.84 µmol/mg) and Alcalase + Flavourzyme (3.79 µmol/mg). All three enzymes produced DPPH scavenging activities that were significantly different (95% confidence interval) from each other, as shown in Table 6. The enzyme concentrations also significantly affected the DPPH scavenging activity (95% confidence interval), with 0.5% generating the highest mean DPPH scavenging activity (4.4 µmol/mg).
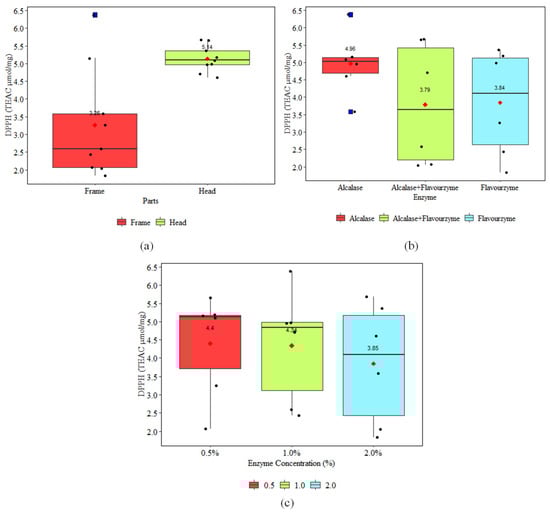
Figure 6.
Effect of (a) Parts, (b) Enzyme and (c) Enzyme Concentration on DPPH Radical Scavenging Activity.
Table 6.
Tukey Grouping of Parts, Enzyme and Enzyme Concentration on DPPH Radical Scavenging Activity (µmol/mg) at 95% Confidence Interval.
Wang et al. studied the enzymatic hydrolysis of protamine from salmon milt, which was carried out using porcine pancreas at pH 8.5, 50 °C for 5 h. The milt hydrolysates reduced the DPPH radical scavenging activity by 66.61% at 5 mg/mL. The present research was also carried out using a 5 mg/mL protein hydrolysate for antioxidant studies, and the results were in the lower range between 15 and 55% DPPH scavenging activity (1.83–6.38 µmol/mg). The lower DPPH activity could be attributed to the operational parameters such as lower pH and hydrolysis time at 7 and 2 h, respectively, and the raw material used in the present study was salmon heads and frames compared to their work using salmon milt [59].
The DPPH scavenging activities in the present work on salmon heads and frames were significantly higher than those reported by Girgih et al. [60] and Hanachi et al. [61]. Girgih et al. hydrolyzed salmon frames by Pepsin at 37 °C overnight, followed by Trypsin + Chymotrypsin at 37 °C for 4 h and freeze-dried the resultant hydrolysates, which were then fractionated into four fractions (SF1-SF4). The study reported a DPPH radical scavenging activity of 33%, which is lower than the value reported in the present study [60]. Hanachi et al. reported a DPPH scavenging activity in the range of 2.55–2.81 µmol/mg for various protein fractions extracted from Atlantic salmon heads using Alcalase hydrolysis at pH 8 and 5% enzyme concentration for 2 h [61]. Their result is significantly lower than the 5.14 µmol/mg obtained in the current study from the salmon head hydrolysates. These results demonstrate the impact of processing parameters such as enzyme type, concentration, and hydrolysis time, which play a crucial role in determining the antioxidant capacities of the resulting protein hydrolysates.
Yang et al. reported a 50% reduction in the DPPH radical scavenging activity using 0.36 mg/mL for a purified blood cockle protein hydrolysate fraction, which is significantly higher than the 5 mg/mL used in the present study to obtain a 55% reduction in the DPPH scavenging activity [62]. Wu et al. investigated the antioxidant properties of low-molecular-weight fractions derived from salmon skin collagen hydrolyzed with a Vibrio species protease. They reported a maximum DPPH scavenging activity of 73%, which exceeds the 55% observed in the present study. These observations may be attributed to the use of crude protein hydrolysate for antioxidant testing in the current study, compared to the purified fractions with lower molecular weights used by other researchers [63]. These results demonstrate that the lower molecular size of peptides plays a key role in their antioxidant capacities.
3.4.2. ABTS Radical Scavenging Activity
The ABTS (2,2′-azinobis(3-ethylbenzothiazoline-6-sulphonic acid)) assay evaluates the antioxidant capacity of compounds by measuring their ability to scavenge the stable ABTS•+ radical cation. Antioxidants neutralize ABTS•+ through two primary mechanisms: direct reduction via electron donation or radical quenching via hydrogen atom transfer. The relative contribution of these mechanisms is influenced by the antioxidant’s molecular structure, reaction time sample concentration and the pH of the reaction medium. While the ABTS assay is predominantly classified as an electron transfer (ET)-based method, hydrogen atom transfer (HAT) also plays a role [55,56,57,58,64,65].
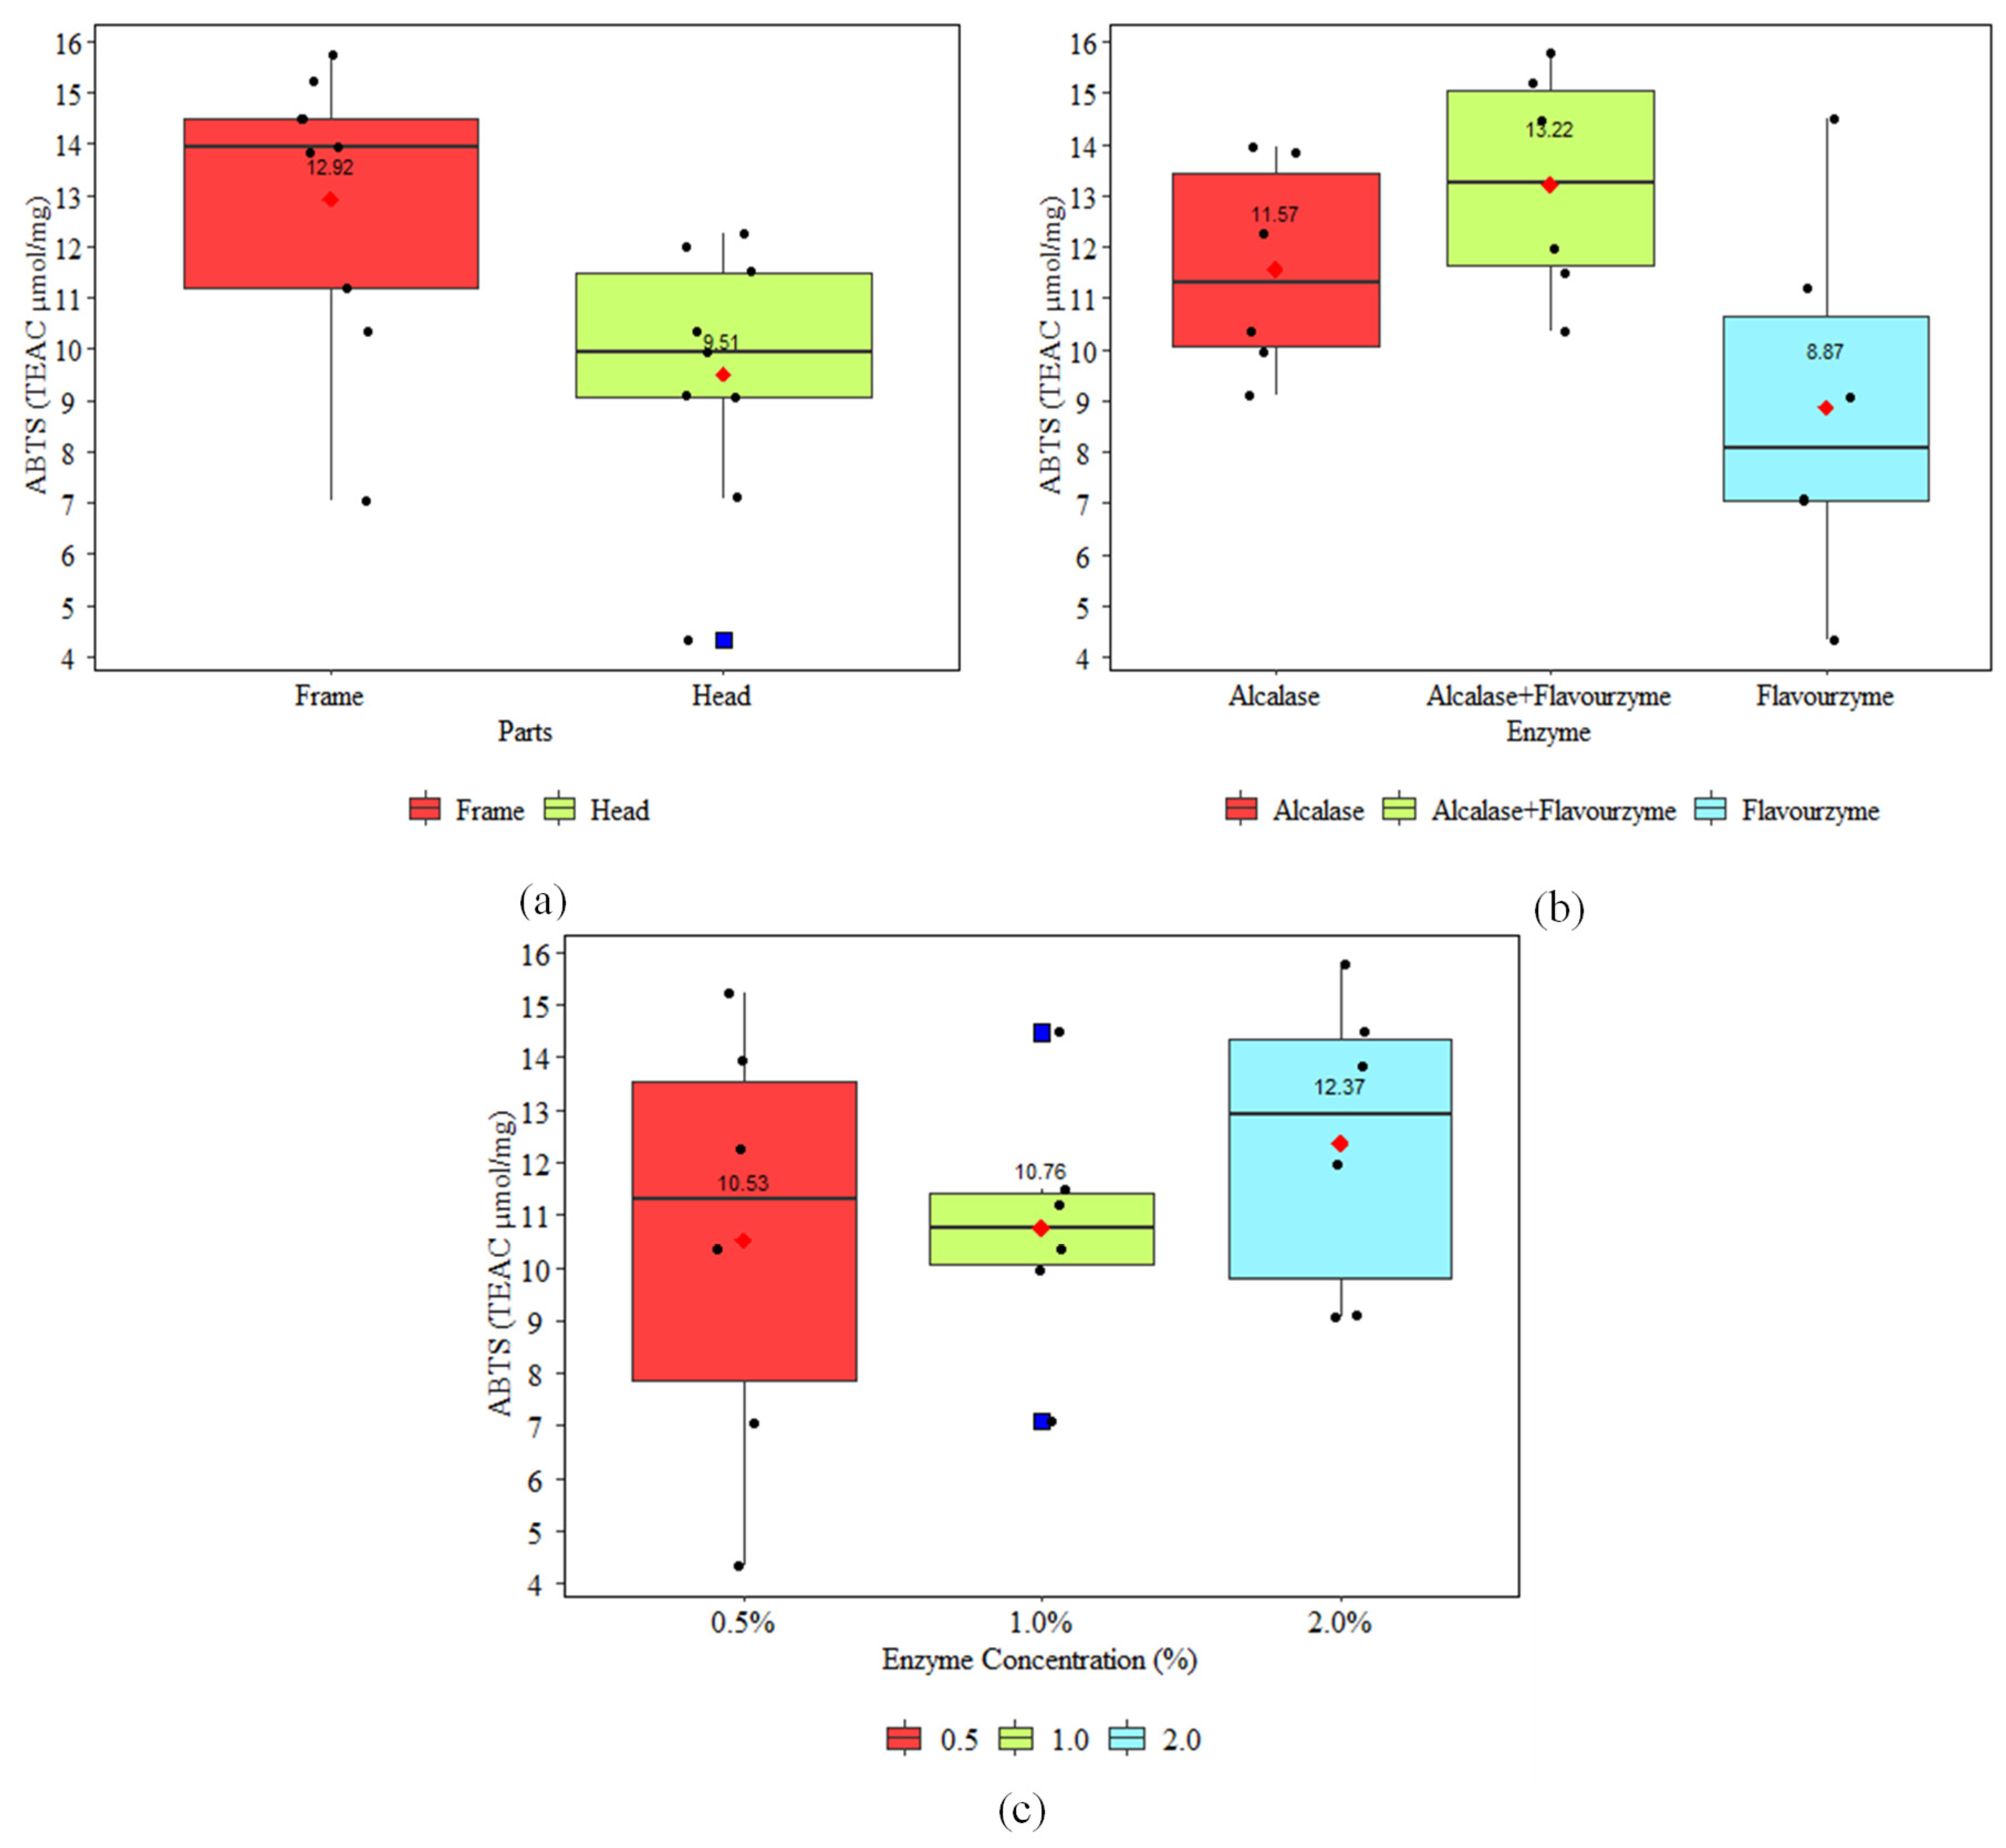
The effect of parts (salmon heads and frames), enzymes (Alcalase, Flavourzyme and Alcalase + Flavourzyme), and enzyme concentrations (0.5, 1 and 2%) on ABTS radical scavenging activity is shown in Figure 7. The ABTS radical scavenging activity in this study ranged between 4.33 and 15.76 µmol/mg (22.77–82.84%). The results indicated that Atlantic salmon frame protein hydrolysates (12.92 µmol/mg) produced the highest mean ABTS scavenging activity compared to head hydrolysates (9.51 µmol/mg). The discards of Atlantic salmon treated with a combination of Alcalase and Flavourzymes produced higher mean ABTS (13.22 µmol/mg) activity, followed by Alcalase (11.56 µmol/mg) and Flavourzyme (8.86 µmol/mg). In terms of enzyme concentration, salmon heads and frames treated with 2% produced 15.06 and 17.58% higher mean ABTS scavenging activity (12.37 µmol/mg) than salmon heads and frames treated with 1% (10.75 µmol/mg) and 0.5% (10.52 µmol/mg) enzyme concentrations, respectively. The Tukey grouping of salmon parts, enzymes, and enzyme concentration has demonstrated that all factors generated ABTS scavenging activities that are significantly different from each other at a 95% confidence level, as shown in Table 7.
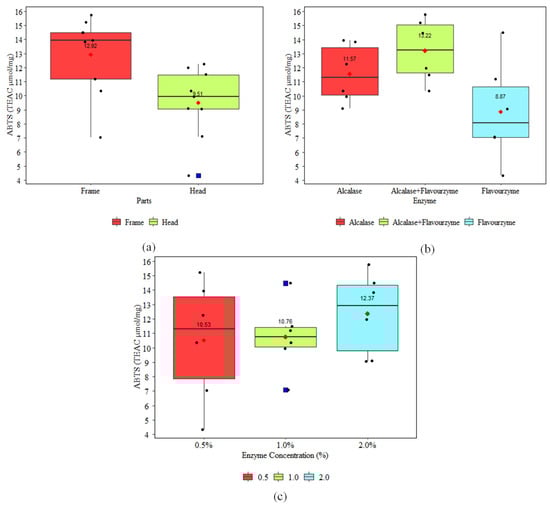
Figure 7.
Effect of (a) Parts, (b) Enzyme and (c) Enzyme Concentration on ABTS Radical Scavenging Activities.
Table 7.
Tukey Grouping of Parts, Enzyme, and Enzyme Concentration on ABTS Radical Scavenging Activity (µmol/mg) at 95% Confidence Interval.
de la Fuente et al. reported 734 and 472 µM Trolox equivalents (Eq) for salmon muscle and heads protein extracts of ABTS radical scavenging activity extracted using pressurized liquid extraction (PLE) and suggested that hydrophobic amino acids such as alanine, proline, leucine, and valine contributing to the total antioxidant activity of protein fragments [66]. Hanachi et al. reported ABTS radical scavenging activity of purified salmon head hydrolysate in the range of 160–186 µM TE/mg, which is significantly higher than the 15.7 µmol/mg from frame hydrolysates observed in the present study. They used pH 8 and 5% Alcalase, which could be the main differentiating factor between the two studies [61]. Pires et al. extracted protein hydrolysates from Atlantic salmon heads using Alcalase (pH: 8, EC: 1%, time: 3h and water ratio: 1:2) demonstrated 50% ABTS cation quenching activity at 2.4 mg/mL, which is more effective than the 5 mg/mL concentration used in the present study to achieve more than 50% ABTS cation quenching activity in some cases [40]. Pires et al. prepared protein hydrolysates from hake by-products using Alcalase at pH 8 and 1% enzyme concentration demonstrated a 99% reduction in ABTS scavenging activity at 15 mg/mL. The study also suggested that the ABTS reduction activity increased with increasing protein hydrolysate concentration from 1 to 15 mg/mL [67]. The ABTS assay showed higher activity than the DPPH assay, similar to the results in the present research.
3.4.3. Hydroxyl Radical Scavenging Activity
The hydroxyl radical scavenging assay using phenanthroline measures antioxidants’ ability to neutralize hydroxyl radicals (•OH). In this test, ferrous ions (Fe2+) react with hydrogen peroxide (H2O2) through the Fenton reaction to produce hydroxyl radicals (•OH). In the absence of antioxidants, hydroxyl radicals react with 1,10-phenanthroline, forming a red-colored Fe(III)-phenanthroline complex [55,68,69,70]. Peptides with antioxidant ability can neutralize hydroxyl radicals via the hydrogen atom transfer (HAT) mechanism, where specific amino acids like tyrosine, tryptophan, and cysteine donate a hydrogen atom to the radicals. Additionally, peptides containing histidine, glutamic acid, or aspartic acid can chelate Fe2+ ions, inhibiting the Fenton reaction and reducing hydroxyl radicals’ formation. This dual function boosts peptides’ antioxidant potential in biological systems [71].
The effect of parts (salmon heads and frames), enzymes (Alcalase, Flavourzyme and Alcalase + Flavourzyme), and enzyme concentrations (0.5, 1 and 2%) on hydroxyl radical scavenging activities is shown in Figure 8. The results show that Atlantic salmon frame protein hydrolysates exhibited the highest mean hydroxyl radical scavenging activity (111.18%), significantly higher than those from the head (61.0%). Alcalase treatment produced the highest hydroxyl radical scavenging activity (103.14%), followed by Flavourzyme and Alcalase + Flavourzyme. Atlantic salmon discards treated with 1.0% enzyme concentrations produced the highest mean hydroxyl radical activities (100.22%). All three factors generated hydroxyl radical scavenging activities that were significantly different from each other at a 95% confidence interval, as shown in Table 8.
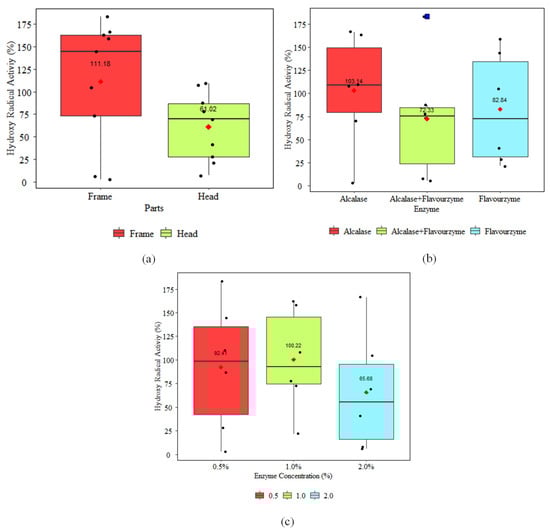
Figure 8.
Effect of (a) Parts, (b) Enzyme, and (c) Enzyme Concentration on Hydroxyl Radical Scavenging Activities.
Table 8.
Tukey Grouping of Parts, Enzyme and Enzyme Concentration on Hydroxyl Radical Activity (%) at 95% Confidence Interval.
The hydroxyl radical scavenging activities obtained in the present research from salmon heads and frames were significantly higher than those reported by Girgih et al. [60]. The researchers reported for salmon frames protein hydrolysate fractions (SF1-SF4) in the range of 5–28%. The study also revealed that unfractionated salmon protein hydrolysate exhibited similar activity to the highest SF4 fraction. Their finding suggests that a potential synergistic effect within the salmon protein hydrolysate may be disrupted when peptides are fractionated using RP-HPLC. Wang et al. reported lower hydroxyl radical scavenging activity of 53.95 and 31.45% for the G3 fraction and salmon milt (protamine) protein hydrolysate, respectively, those are lower than those reported in the present research [59]. Zhang et al. investigated the antioxidant activities of salmon skin protein hydrolysates and reported that Alcalase hydrolysate exhibited the strongest hydroxyl radical scavenging activity, while Flavourzyme hydrolysate demonstrated the weakest. The current research also observed similar results with the highest hydroxyl radical scavenging activity for Alcalase and the lowest for Alcalase + Flavourzyme [12]. Wu et al. studied the antioxidant properties of salmon skin collagen hydrolyzed using a protease from Vibrio species at an enzyme-to-substrate ratio of 1:10 for 2.5 h. In their study, only two purified fractions out of seven could effectively convert the hydroxy radicals into stable products and terminate the radical reaction. The study reported the highest hydroxyl radical scavenging activity of 72%, which is significantly lower compared to the present study [63].
3.5. Correlation of Degree of Hydrolysis on Bioactivities
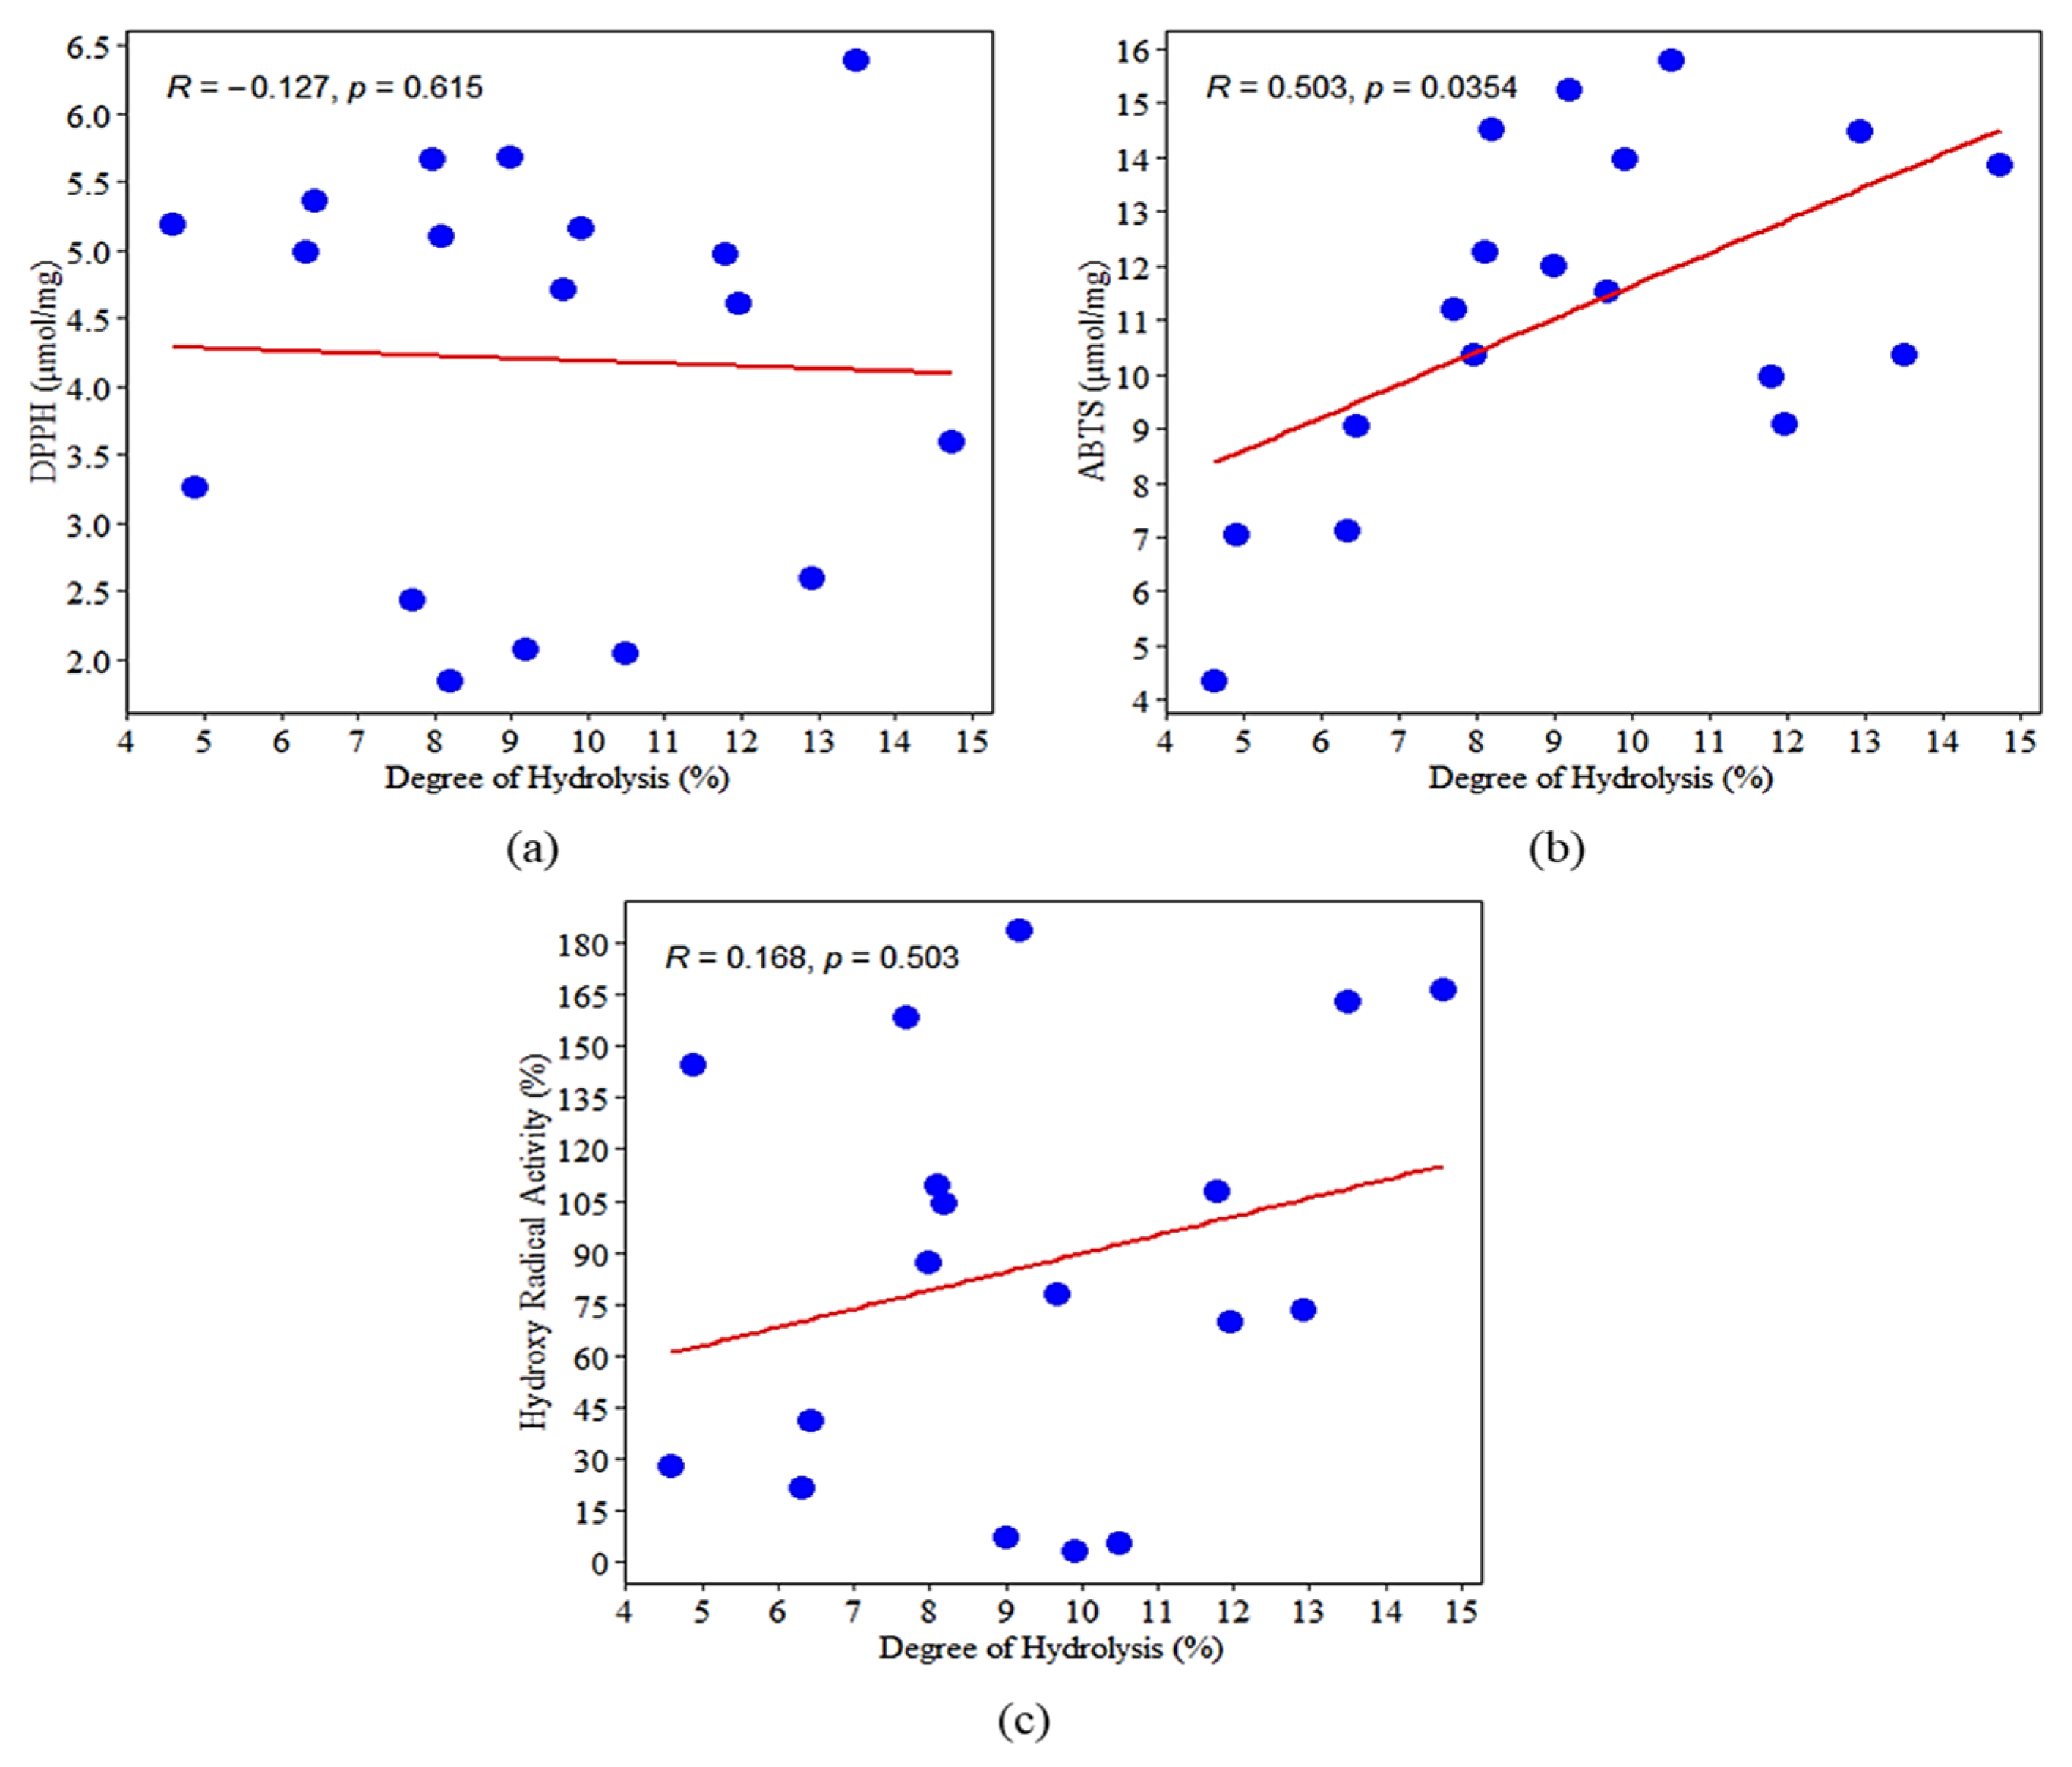
The correlation between the degree of hydrolysis on various bioactivities was studied, and the results are shown in Figure 9. The correlation was conducted using the Spearman method, and the results revealed no significant effect of the degree of hydrolysis on DPPH and hydroxyl radical activities with R-values of −0.127 and 0.168 and p-values of 0.615 and 0.503, respectively. The degree of hydrolysis had a significant positive correlation with the ABTS activity, with R-values of 0.503 and a p-value of 0.0354. This correlation suggests that the DPPH and hydroxyl radical scavenging activities were independent of the degree of hydrolysis, whereas ABTS activity showed a dependency on it. Previous studies have linked a higher degree of hydrolysis to the presence of low molecular weight peptides, which are associated with increased DPPH activity [40,72]. Klompong et al. studied the effect of the degree of hydrolysis on DPPH scavenging activity and reported higher DPPH scavenging at 5% DH, and when the DH increased from 5 to 25%, the DPPH scavenging activity reduced for Alcalase hydrolyzed yellow stripe. In addition, no differences in DPPH scavenging activities between 5 and 25% DH were reported for Flavourzyme hydrolyzed yellow stripe [73]. Hamzeh et al. reported varying DPPH scavenging activities for Alcalase hydrolyzed cuttlefish protein hydrolysates. This study reported the highest DPPH scavenging activity at 25% DH and the lowest DPPH activity at 40% DH. The study also found higher DPPH activity for 30% DH hydrolysates than the hydrolysates produced at 25 and 35% DH [74].
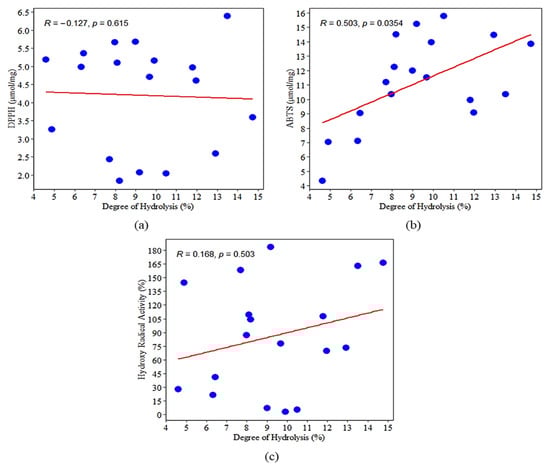
Figure 9.
Correlation of degree of hydrolysis on (a) DPPH, (b) ABTS, and (c) Hydroxyl Radical Activity.
Intarasirisawat et al. reported a dose-dependent increase in the DPPH activities from 5 to 20 mg/mL. However, at all concentrations, the Alcalase-hydrolyzed skipjack hydrolysates produced at a 5% degree of hydrolysis exhibited higher DPPH scavenging activities, which decreased as the DH increased from 5 to 50% [75]. You et al. reported that DPPH, ABTS, and hydroxyl radical scavenging activities increased with the degree of hydrolysis from 18 to 23% but decreased when the degree of hydrolysis was further increased to 28 and 33% [76].
4. Conclusions
Protein hydrolysates were obtained from Atlantic salmon head and frame through conventional enzymatic hydrolysis using Alcalase, Flavourzyme, and a combination of both enzymes. The findings demonstrate that Alcalase was the most efficient enzyme for hydrolyzing salmon heads and frames, producing hydrolysates with a superior degree of hydrolysis. The protein hydrolysates produced in this research demonstrated the ability to effectively scavenge DPPH, ABTS, and hydroxyl radicals, showcasing the presence of peptides with significant antioxidant activities.
Furthermore, the study highlighted that the degree of hydrolysis had a varying impact on the antioxidant activities. Higher DH generally resulted in increased antioxidant activities; however, an optimal DH range existed beyond which the activities either plateaued or decreased. This finding aligns with previous research, indicating that excessively high hydrolysis may break peptides into too small fragments, reducing their effectiveness.
The study compared the wine filtration device used in this research with other filtration methods employed in previous studies, highlighting their effects on the protein content and amino acid composition of protein hydrolysates derived from Atlantic salmon by-products. The findings indicated that filtration methods significantly influence both protein concentration and amino acid profiles. Notably, substantial differences were observed in the amino acid composition of the protein hydrolysates obtained from the same species using various filtration techniques. Additionally, the choice of raw material plays a crucial role in determining the amino acid composition. Other influential factors include the type of enzyme used and the hydrolysis conditions applied during the production process.
However, while the in vitro antioxidant activities of these hydrolysates are promising, further research is needed to evaluate their efficacy in vivo. This would involve studying their absorption, metabolism, and bioavailability in the human body. Additionally, isolating and identifying the specific peptides responsible for these activities could lead to the development of targeted functional food ingredients or nutraceuticals.
In summary, the enzymatic hydrolysis of Atlantic salmon by-products using Alcalase and Flavourzyme offers a sustainable way to produce protein hydrolysates with potent antioxidant properties. These findings underscore the potential of utilizing Atlantic salmon processing discards as a sustainable source of bioactive peptides, warranting further investigation into their specific peptide sequences and in vivo efficacy.
Author Contributions
Investigation, J.G.; Resources, J.G.; Writing—original draft, V.V.R.; Conceptualization, V.V.R.; Methodology, V.V.R.; Supervision, D.D. and F.S. All authors have read and agreed to the published version of the manuscript.
Funding
This research was funded by the Ocean Frontier Institute (OFI) through an award to Dave from the Canada First Research Excellence Fund.
Data Availability Statement
The original contributions presented in this study are included in the article. Further inquiries can be directed to the corresponding author(s).
Conflicts of Interest
The authors declare no conflict of interest.
References
- Vijaykrishnaraj, M.; Prabhasankar, P. Marine Protein Hydrolysates: Their Present and Future Perspectives in Food Chemistry—A Review. RSC Adv. 2015, 5, 34864–34877. [Google Scholar] [CrossRef]
- Shahidi, F.; Varatharajan, V.; Peng, H.; Senadheera, R. Utilization of Marine By-Products for the Recovery of Value-Added Products. J. Food Bioact. 2019, 6, 10–61. [Google Scholar] [CrossRef]
- Ramakrishnan, V.V.; Hossain, A.; Dave, D.; Shahidi, F. Salmon Processing Discards: A Potential Source of Bioactive Peptides—A Review. Food Prod. Process. Nutr. 2024, 6, 22. [Google Scholar] [CrossRef]
- Ghaly, A.E.; Ramakrishnan, V.V.; Brooks, M.S.; Budge, S.M.; Dave, D. Fish Processing Wastes as a Potential Source of Proteins, Amino Acids and Oils: A Critical Review. J. Microb. Biochem. Technol. 2013, 5, 107–129. [Google Scholar] [CrossRef]
- Vieira, S.; Franco, A.R.; Fernandes, E.M.; Amorim, S.; Ferreira, H.; Pires, R.A.; Reis, R.L.; Martins, A.; Neves, N.M. Fish Sarcoplasmic Proteins as a High Value Marine Material for Wound Dressing Applications. Colloids Surf. B Biointerfaces 2018, 167, 310–317. [Google Scholar] [CrossRef]
- Ochiai, Y.; Ozawa, H. Biochemical and Physicochemical Characteristics of the Major Muscle Proteins from Fish and Shellfish. Fish. Sci. 2020, 86, 729–740. [Google Scholar] [CrossRef]
- Lefevre, F.; Fauconneau, B.; Thompson, J.W.; Gill, T.A. Thermal Denaturation and Aggregation Properties of Atlantic Salmon Myofibrils and Myosin from White and Red Muscles. J. Agric. Food Chem. 2007, 55, 4761–4770. [Google Scholar] [CrossRef]
- Idowu, A.T.; Benjakul, S.; Sinthusamran, S.; Sookchoo, P.; Kishimura, H. Protein Hydrolysate from Salmon Frames: Production, Characteristics and Antioxidative Activity. J. Food Biochem. 2019, 43, e12734. [Google Scholar] [CrossRef]
- Kristinsson, H.G.; Rasco, B.A. Biochemical and Functional Properties of Atlantic Salmon (Salmo Salar) Muscle Proteins Hydrolyzed with Various Alkaline Proteases. J. Agric. Food Chem. 2000, 48, 657–666. [Google Scholar] [CrossRef]
- Gbogouri, G.A.; Linder, M.; Fanni, J.; Parmentier, M. Influence of Hydrolysis Degree on the Functional Properties of Salmon Byproducts Hydrolysates. J. Food Sci. 2004, 69, C615–C622. [Google Scholar] [CrossRef]
- See, S.F.; Hoo, L.L.; Babji, A.S. Optimization of Enzymatic Hydrolysis of Salmon (Salmo Salar) Skin by Alcalase. Int. Food Res. J. 2011, 18, 1359–1365. [Google Scholar]
- Zhang, X.; Dai, Z.; Zhang, Y.; Dong, Y.; Hu, X. Structural Characteristics and Stability of Salmon Skin Protein Hydrolysates Obtained with Different Proteases. LWT-Food Sci. Technol. 2022, 153, 112460. [Google Scholar] [CrossRef]
- Opheim, M.; Šližyte, R.; Sterten, H.; Provan, F.; Larssen, E.; Kjos, N.P. Hydrolysis of Atlantic Salmon (Salmo Salar) Rest Raw Materials-Effect of Raw Material and Processing on Composition, Nutritional Value, and Potential Bioactive Peptides in the Hydrolysates. Process Biochem. 2015, 50, 1247–1257. [Google Scholar] [CrossRef]
- Slizyte, R.; Rommi, K.; Mozuraityte, R.; Eck, P.; Five, K.; Rustad, T. Bioactivities of Fish Protein Hydrolysates from Defatted Salmon Backbones. Biotechnol. Rep. 2016, 11, 99–109. [Google Scholar] [CrossRef]
- Liaset, B.; Julshamn, K.; Espe, M. Chemical Composition and Theoretical Nutritional Evaluation of the Produced Fractions from Enzymic Hydrolysis of Salmon Frames with ProtamexTM. Process Biochem. 2003, 38, 1747–1759. [Google Scholar] [CrossRef]
- Vázquez, J.A.; Sotelo, C.G.; Sanz, N.; Pérez-Martín, R.I.; Rodríguez-Amado, I.; Valcarcel, J. Valorization of Aquaculture By-Products of Salmonids to Produce Enzymatic Hydrolysates: Process Optimization, Chemical Characterization and Evaluation of Bioactives. Mar. Drugs 2019, 17, 676. [Google Scholar] [CrossRef]
- Aspevik, T.; Egede-Nissen, H.; Oterhals, Å. A Systematic Approach to the Comparison of Cost Efficiency of Endopeptidases for the Hydrolysis of Atlantic Salmon (Salmo Salar) by-Products. Food Technol. Biotechnol. 2016, 54, 421–431. [Google Scholar] [CrossRef]
- Ambigaipalan, P.; Al-Khalifa, A.S.; Shahidi, F. Antioxidant and Angiotensin I Converting Enzyme (ACE) Inhibitory Activities of Date Seed Protein Hydrolysates Prepared Using Alcalase, Flavourzyme and Thermolysin. J. Funct. Foods 2015, 18, 1125–1137. [Google Scholar] [CrossRef]
- Hunsakul, K.; Laokuldilok, T.; Sakdatorn, V.; Klangpetch, W.; Brennan, C.S.; Utama-ang, N. Optimization of Enzymatic Hydrolysis by Alcalase and Flavourzyme to Enhance the Antioxidant Properties of Jasmine Rice Bran Protein Hydrolysate. Sci. Rep. 2022, 12, 12582. [Google Scholar] [CrossRef]
- Liu, Y.; Ramakrishnan, V.V.; Dave, D. Enzymatic Hydrolysis of Farmed Atlantic Salmon By-Products: Investigation of Operational Parameters on Extracted Oil Yield and Quality. Process Biochem. 2021, 100, 10–19. [Google Scholar] [CrossRef]
- Association of Official Analytical Chemists. Official Methods of Analysis of AOAC INTERNATIONAL, 17th ed.; Association of Official Analytical Chemists: Gaithersburg, MD, USA, 2023. [Google Scholar]
- Adler-Nissen, J. Methods in Food Protein Hydrolysis. In Enzymic Hydrolysis of Food Protein; Elsevier Applied Science Publishers: Barking, UK, 1986; pp. 110–130. [Google Scholar]
- Steinhardt, J.; Beychok, S. Interaction of Proteins with Hydrogen Ions and Other Small Ions and Molecules. In The Proteins Composition, Structure, and Function; Academic Press: Cambridge, MA, USA, 1964; pp. 139–304. [Google Scholar]
- Poongothai, S.; Ilavarasan, R.; Karrunakaran, C.M. Simultaneous and Accurate Determination of Vitamins B1, B6, B12 and Alpha-Lipoic Acid in Multivitamin Capsule by Reverse-Phase High Performance Liquid Chromatographic Method. Int. J. Pharm. Pharm. Sci. 2010, 2, 133–139. [Google Scholar]
- Rumpf, J.; Burger, R.; Schulze, M. Statistical Evaluation of DPPH, ABTS, FRAP, and Folin-Ciocalteu Assays to Assess the Antioxidant Capacity of Lignins. Int. J. Biol. Macromol. 2023, 233, 123470. [Google Scholar] [CrossRef] [PubMed]
- Hayta, M.; Benli, B.; İşçimen, E.M.; Kaya, A. Optimization of Antihypertensive and Antioxidant Hydrolysate Extraction from Rice Bran Proteins Using Ultrasound Assisted Enzymatic Hydrolysis. J. Food Meas. Charact. 2020, 14, 2578–2589. [Google Scholar] [CrossRef]
- Li, Y.; Jiang, B.; Zhang, T.; Mu, W.; Liu, J. Antioxidant and Free Radical-Scavenging Activities of Chickpea Protein Hydrolysate (CPH). Food Chem. 2008, 106, 444–450. [Google Scholar] [CrossRef]
- Dave, D.; Ramakrishnan, V.V.; Trenholm, S.; Manuel, H.; Pohling, J.; Murphy, W. Marine Oils as Potential Feedstock for Biodiesel Production: Physicochemical Characterization. J. Bioprocess. Biotech. 2014, 4, 10001678. [Google Scholar] [CrossRef]
- Głowacz-Różyńska, A.; Tynek, M.; Malinowska-Pańczyk, E.; Martysiak-Żurowska, D.; Pawłowicz, R.; Kołodziejska, I. Comparison of Oil Yield and Quality Obtained by Different Extraction Procedures from Salmon (Salmo Salar) Processing Byproducts. Eur. J. Lipid Sci. Technol. 2016, 118, 1759–1767. [Google Scholar] [CrossRef]
- Šližyte, R.; Daukšas, E.; Falch, E.; Storrø, I.; Rustad, T. Characteristics of Protein Fractions Generated from Hydrolysed Cod (Gadus Morhua) by-Products. Process Biochem. 2005, 40, 2021–2033. [Google Scholar] [CrossRef]
- Gbogouri, G.A.; Linder, M.; Fanni, J.; Parmentier, M. Analysis of Lipids Extracted from Salmon (Salmo Salar) Heads by Commercial Proteolytic Enzymes. Eur. J. Lipid Sci. Technol. 2006, 108, 766–775. [Google Scholar] [CrossRef]
- Guerard, F.; Guimas, L.; Binet, A. Production of Tuna Waste Hydrolysates by a Commercial Neutral Protease Preparation. J. Mol. Catal. B Enzym. 2002, 19, 489–498. [Google Scholar] [CrossRef]
- Shahidi, F.; Han, X.Q.; Synowiecki, J. Production and Characteristics of Protein Hydrolysates from Capelin (Mallotus Villosus). Food Chem. 1995, 53, 285–293. [Google Scholar] [CrossRef]
- Guérard, F.; Dufossé, L.; De La Broise, D.; Binet, A. Enzymatic Hydrolysis of Proteins from Yellowfin Tuna (Thunnus Albacares) Wastes Using Alcalase. J. Mol. Catal.-B Enzym. 2001, 11, 1051–1059. [Google Scholar] [CrossRef]
- Balti, R.; Bougatef, A.; Ali, N.E.H.; Zekri, D.; Barkia, A.; Nasri, M. Influence of Degree of Hydrolysis on Functional Properties and Angiotensin I-Converting Enzyme-Inhibitory Activity of Protein Hydrolysates from Cuttlefish (Sepia Officinalis) by-Products. J. Sci. Food Agric. 2010, 90, 2006–2014. [Google Scholar] [CrossRef] [PubMed]
- Binsi, P.K.; Viji, P.; Panda, S.K.; Mathew, S.; Zynudheen, A.A.; Ravishankar, C.N. Characterisation of Hydrolysates Prepared from Engraved Catfish (Nemapteryx Caelata) Roe by Serial Hydrolysis. J. Food Sci. Technol. 2016, 53, 158–170. [Google Scholar] [CrossRef]
- Idowu, A.T.; Benjakul, S. Bitterness of Fish Protein Hydrolysate and Its Debittering Prospects. J. Food Biochem. 2019, 43, e12978. [Google Scholar] [CrossRef]
- Rios-Morales, S.N.; Brito-De La Fuente, E.; Torrestiana-Sánchez, B. Kinetics of Egg-Yolk Protein Hydrolysis and Properties of Hydrolysates. ACS Omega 2023, 8, 17758–17767. [Google Scholar] [CrossRef]
- Liaset, B.; Lied, E.; Espe, M. Enzymatic Hydrolysis of By-Products from the Fish-Filleting Industry; Chemical Characterisation and Nutritional Evaluation. J. Sci. Food Agric. 2000, 80, 581–589. [Google Scholar] [CrossRef]
- Pires, C.; Leitão, M.; Sapatinha, M.; Gonçalves, A.; Oliveira, H.; Nunes, M.L.; Teixeira, B.; Mendes, R.; Camacho, C.; Machado, M.; et al. Protein Hydrolysates from Salmon Heads and Cape Hake By-Products: Comparing Enzymatic Method with Subcritical Water Extraction on Bioactivity Properties. Foods 2024, 13, 2418. [Google Scholar] [CrossRef]
- Akimova, D.; Kakimov, A.; Suychinov, A.; Urazbayev, Z.; Zharykbasov, Y.; Ibragimo, N.; Bauyrzhanova, A.; Utegenova, A. Enzymatic Hydrolysis in Food Processing: Biotechnological Advancements, Applications, and Future Perspectives. Potravin. Slovak J. Food Sci. 2024, 18, 347–365. [Google Scholar] [CrossRef]
- Cui, Q.; Sun, Y.; Zhou, Z.; Cheng, J.; Guo, M. Effects of Enzymatic Hydrolysis on Physicochemical Properties and Solubility and Bitterness of Milk Protein Hydrolysates. Foods 2021, 10, 2462. [Google Scholar] [CrossRef]
- Xu, Y.; Galanopoulos, M.; Sismour, E.; Ren, S.; Mersha, Z.; Lynch, P.; Almutaimi, A. Effect of Enzymatic Hydrolysis Using Endo- and Exo-Proteases on Secondary Structure, Functional, and Antioxidant Properties of Chickpea Protein Hydrolysates. J. Food Meas. Charact. 2020, 14, 343–352. [Google Scholar] [CrossRef]
- Alahmad, K.; Noman, A.; Xia, W.; Jiang, Q.; Xu, Y. Influence of the Enzymatic Hydrolysis Using Flavourzyme Enzyme on Functional, Secondary Structure, and Antioxidant Characteristics of Protein Hydrolysates Produced from Bighead Carp (Hypophthalmichthys Nobilis). Molecules 2023, 28, 519. [Google Scholar] [CrossRef] [PubMed]
- Noman, A.; Xu, Y.; AL-Bukhaiti, W.Q.; Abed, S.M.; Ali, A.H.; Ramadhan, A.H.; Xia, W. Influence of Enzymatic Hydrolysis Conditions on the Degree of Hydrolysis and Functional Properties of Protein Hydrolysate Obtained from Chinese Sturgeon (Acipenser Sinensis) by Using Papain Enzyme. Process Biochem. 2018, 67, 19–28. [Google Scholar] [CrossRef]
- Islam, M.S.; Hongxin, W.; Admassu, H.; Noman, A.; Ma, C.; An Wei, F. Degree of Hydrolysis, Functional and Antioxidant Properties of Protein Hydrolysates from Grass Turtle (Chinemys Reevesii) as Influenced by Enzymatic Hydrolysis Conditions. Food Sci. Nutr. 2021, 9, 4031–4047. [Google Scholar] [CrossRef] [PubMed]
- Islam, M.; Huang, Y.; Islam, S.; Fan, B.; Tong, L.; Wang, F. Influence of the Degree of Hydrolysis on Functional Properties and Antioxidant Activity of Enzymatic Soybean Protein Hydrolysates. Molecules 2022, 27, 6110. [Google Scholar] [CrossRef]
- Nilsang, S.; Lertsiri, S.; Suphantharika, M.; Assavanig, A. Optimization of Enzymatic Hydrolysis of Fish Soluble Concentrate by Commercial Proteases. J. Food Eng. 2005, 70, 571–578. [Google Scholar] [CrossRef]
- Kristinsson, H.G.; Rasco, B.A. Hydrolysis of Salmon Muscle Proteins by an Enzyme Mixture Extracted from Atlantic Salmon (Salmo Salar) Pyloric Caeca. J. Food Biochem. 2000, 24, 177–187. [Google Scholar] [CrossRef]
- Steinsholm, S.; Oterhals, Å.; Thoresen, L.; Underhaug, J.; Kousoulaki, K.; Aspevik, T. Reduction in Flavor-Intense Components in Fish Protein Hydrolysates by Membrane Filtration. J. Food Sci. 2021, 86, 3855–3867. [Google Scholar] [CrossRef]
- Beaulieu, L.; Thibodeau, J.; Bryl, P.; Carbonneau, M.É. Proteolytic Processing of Atlantic Mackerel (Scomber Scombrus) and Biochemical Characterisation of Hydrolysates. Int. J. Food Sci. Technol. 2009, 44, 1609–1618. [Google Scholar] [CrossRef]
- Harnedy, P.A.; Parthsarathy, V.; McLaughlin, C.M.; O’Keeffe, M.B.; Allsopp, P.J.; McSorley, E.M.; O’Harte, F.P.M.; FitzGerald, R.J. Atlantic Salmon (Salmo Salar) Co-Product-Derived Protein Hydrolysates: A Source of Antidiabetic Peptides. Food Res. Int. 2018, 106, 598–606. [Google Scholar] [CrossRef]
- Aspevik, T.; Steinsholm, S.; Vang, B.; Carlehög, M.; Arnesen, J.A.; Kousoulaki, K. Nutritional and Sensory Properties of Protein Hydrolysates Based on Salmon (Salmo Salar), Mackerel (Scomber Scombrus), and Herring (Clupea Harengus) Heads and Backbones. Front. Nutr. 2021, 8, 695151. [Google Scholar] [CrossRef]
- Chalamaiah, M.; Dinesh Kumar, B.; Hemalatha, R.; Jyothirmayi, T. Fish Protein Hydrolysates: Proximate Composition, Amino Acid Composition, Antioxidant Activities and Applications: A Review. Food Chem. 2012, 135, 3020–3038. [Google Scholar] [CrossRef] [PubMed]
- Shahidi, F.; Zhong, Y. Measurement of Antioxidant Activity. J. Funct. Foods 2015, 18, 757–781. [Google Scholar] [CrossRef]
- Xu, B.; Dong, Q.; Yu, C.; Chen, H.; Zhao, Y.; Zhang, B.; Yu, P.; Chen, M. Advances in Research on the Activity Evaluation, Mechanism and Structure-Activity Relationships of Natural Antioxidant Peptides. Antioxidants 2024, 13, 479. [Google Scholar] [CrossRef]
- Esfandi, R.; Walters, M.E.; Tsopmo, A. Antioxidant Properties and Potential Mechanisms of Hydrolyzed Proteins and Peptides from Cereals. Heliyon 2019, 5, e01538. [Google Scholar] [CrossRef]
- Ijarotimi, O.S.; Malomo, S.A.; Alashi, A.M.; Nwachukwu, I.D.; Fagbemi, T.N.; Osundahunsi, O.F.; Aluko, R.E. Antioxidant and Antihypertensive Activities of Wonderful Cola (Buchholzia Coriacea) Seed Protein and Enzymatic Protein Hydrolysates. J. Food Bioact. 2018, 3, 133–143. [Google Scholar] [CrossRef]
- Wang, Y.; Zhu, F.; Han, F.; Wang, H. Purification and Characterization of Antioxidative Peptides from Salmon Protamine Hydrolysate. J. Food Biochem. 2008, 32, 654–671. [Google Scholar] [CrossRef]
- Girgih, A.T.; Udenigwe, C.C.; Hasan, F.M.; Gill, T.A.; Aluko, R.E. Antioxidant Properties of Salmon (Salmo Salar) Protein Hydrolysate and Peptide Fractions Isolated by Reverse-Phase HPLC. Food Res. Int. 2013, 52, 315–322. [Google Scholar] [CrossRef]
- Hanachi, A.; Bianchi, A.; Kahn, C.J.F.; Velot, E.; Arab-Tehrany, E.; Cakir-Kiefer, C.; Linder, M. Encapsulation of Salmon Peptides in Marine Liposomes: Physico-Chemical Properties, Antiradical Activities and Biocompatibility Assays. Mar. Drugs 2022, 20, 249. [Google Scholar] [CrossRef]
- Yang, X.R.; Qiu, Y.T.; Zhao, Y.Q.; Chi, C.F.; Wang, B. Purification and Characterization of Antioxidant Peptides Derived from Protein Hydrolysate of the Marine Bivalve Mollusk Tergillarca Granosa. Mar. Drugs 2019, 17, 251. [Google Scholar] [CrossRef]
- Wu, R.B.; Wu, C.L.; Liu, D.; Yang, X.H.; Huang, J.F.; Zhang, J.; Liao, B.; He, H.L. Antioxidant and Anti-Freezing Peptides from Salmon Collagen Hydrolysate Prepared by Bacterial Extracellular Protease. Food Chem. 2018, 248, 346–352. [Google Scholar] [CrossRef]
- Siddeeg, A.; AlKehayez, N.M.; Abu-Hiamed, H.A.; Al-Sanea, E.A.; AL-Farga, A.M. Mode of Action and Determination of Antioxidant Activity in the Dietary Sources: An Overview. Saudi J. Biol. Sci. 2021, 28, 1633–1644. [Google Scholar] [CrossRef] [PubMed]
- Prior, R.L.; Schaich, K. Standardized Methods for the Determination of Antioxidant Capacity and Phenolics in Foods and Dietary Supplements. J. Agric. Food Chem. 2005, 53, 4290–4302. [Google Scholar] [CrossRef] [PubMed]
- de la Fuente, B.; Pallarés, N.; Berrada, H.; Barba, F.J. Salmon (Salmo Salar) Side Streams as a Bioresource to Obtain Potential Antioxidant Peptides after Applying Pressurized Liquid Extraction (Ple). Mar. Drugs 2021, 19, 323. [Google Scholar] [CrossRef] [PubMed]
- Pires, C.; Clemente, T.; Batista, I. Functional and Antioxidative Properties of Protein Hydrolysates from Cape Hake By-Products Prepared by Three Different Methodologies. J. Sci. Food Agric. 2013, 93, 771–780. [Google Scholar] [CrossRef]
- Walger, E.; Marlin, N.; Mortha, G.; Molton, F.; Duboc, C. Hydroxyl Radical Generation by the H2O2/CuII/Phenanthroline System under Both Neutral and Alkaline Conditions: An EPR/Spin-Trapping Investigation. Appl. Sci. 2021, 11, 687. [Google Scholar] [CrossRef]
- Zou, T.-B.; He, T.-P.; Li, H.-B.; Tang, H.-W.; Xia, E.-Q. The Structure-Activity Relationship of the Antioxidant Peptides from Natural Proteins. Molecules 2016, 21, 72. [Google Scholar] [CrossRef]
- Munteanu, I.G.; Apetrei, C. Analytical Methods Used in Determining Antioxidant Activity: A Review. Int. J. Mol. Sci. 2021, 22, 3380. [Google Scholar] [CrossRef]
- Sarmadi, B.H.; Ismail, A. Antioxidative Peptides from Food Proteins: A Review. Peptides 2010, 31, 1949–1956. [Google Scholar] [CrossRef]
- Phadke, G.G.; Rathod, N.B.; Ozogul, F.; Elavarasan, K.; Karthikeyan, M.; Shin, K.H.; Kim, S.K. Exploiting of Secondary Raw Materials from Fish Processing Industry as a Source of Bioactive Peptide-Rich Protein Hydrolysates. Mar. Drugs 2021, 19, 480. [Google Scholar] [CrossRef]
- Klompong, V.; Benjakul, S.; Kantachote, D.; Shahidi, F. Antioxidative Activity and Functional Properties of Protein Hydrolysate of Yellow Stripe Trevally (Selaroides Leptolepis) as Influenced by the Degree of Hydrolysis and Enzyme Type. Food Chem. 2007, 102, 1317–1327. [Google Scholar] [CrossRef]
- Hamzeh, A.; Rezaei, M.; Khodabandeh, S.; Motamedzadegan, A.; Noruzinia, M. Antiproliferative and Antioxidative Activities of Cuttlefish (Sepia Pharaonis) Protein Hydrolysates as Affected by Degree of Hydrolysis. J. Food Meas. Charact. 2018, 12, 721–727. [Google Scholar] [CrossRef]
- Intarasirisawat, R.; Benjakul, S.; Visessanguan, W.; Wu, J. Antioxidative and Functional Properties of Protein Hydrolysate from Defatted Skipjack (Katsuwonous Pelamis) Roe. Food Chem. 2012, 135, 3039–3048. [Google Scholar] [CrossRef] [PubMed]
- You, L.; Zhao, M.; Cui, C.; Zhao, H.; Yang, B. Effect of Degree of Hydrolysis on the Antioxidant Activity of Loach (Misgurnus Anguillicaudatus) Protein Hydrolysates. Innov. Food Sci. Emerg. Technol. 2009, 10, 235–240. [Google Scholar] [CrossRef]


Disclaimer/Publisher’s Note: The statements, opinions and data contained in all publications are solely those of the individual author(s) and contributor(s) and not of MDPI and/or the editor(s). MDPI and/or the editor(s) disclaim responsibility for any injury to people or property resulting from any ideas, methods, instructions or products referred to in the content. |
© 2025 by the authors. Licensee MDPI, Basel, Switzerland. This article is an open access article distributed under the terms and conditions of the Creative Commons Attribution (CC BY) license (https://creativecommons.org/licenses/by/4.0/).