Abstract
Traditional designs often ignore the effect of catalyst particle shape, which suffers from capturing detailed local flow hydrodynamics, mass transport and reaction behaviors, and further significantly affects reactor phenomena. This study aims to perform particle-resolved computational fluid dynamics (CFD) simulations to investigate the influence of operating conditions and various catalyst particle shapes on fixed-bed reactor performance. Three important industrial reaction systems, including methanol to dimethyl ether, CO2 hydrogenation to methanol, and levulinic acid esterification, are discussed in fixed-bed reactors. The numerical results demonstrate that reactor performance varies from the important interactive contributions of hydrodynamics characteristics and reaction behaviors. Specifically, exothermic reactions such as methanol to dimethyl ether and CO2 hydrogenation to methanol are characterized by a gradual increase in temperature along the reactor height, while endothermic reactions such as valeric acid esterification exhibit a gradual decrease in temperature along the reactor height. For the methanol to dimethyl ether system, the increase in operating temperature leads to a decrease in axial methanol concentration, as well as an improvement in axial dimethyl ether concentration. However, the change in methanol molar concentration has little influence on its conversion. Furthermore, reactor phenomena strongly vary from the different catalyst shapes. The numerical results demonstrate that the fixed bed with hollow cylinders facilitates a more uniform flow distribution, whereas the fixed bed with solid cylinders achieves higher conversion rates within a specific temperature range (483.15 K to 523.15 K). This research provides valuable insights for fixed-bed reactor optimized design, emphasizing the need for precise control over temperature, feed rate, and catalyst configuration to improve reactant conversion in industrial applications.
1. Introduction
Fixed-bed reactors play a crucial role in industrial production and are widely utilized in the petrochemical, environmental protection, and energy sectors [1,2]. Their advantages, including low back mixing and minimal mechanical wear of catalysts, render them highly favored for these applications. However, with the growing demands of industrial production, exploring the design of fixed-bed reactors to enhance reaction efficiency and product selectivity has become a key research area [3,4]. The research and exploration of fixed-bed reactors involve not only the structural configuration of the reactor but also the mass and heat transfer processes within the fluid. These factors, when considered, significantly influence the overall reaction performance and outcomes [5]. Consequently, a thorough understanding of the influence of heterogeneously structured catalysts on the configuration of fixed-bed reactors, as well as their effects on the heat and mass transfer processes within the internal fluid flow, is crucial for enhancing reaction selectivity and product conservation in fixed-bed reactors.
The increasing development of numerical methods provides more efficient solutions to investigate the influence of various reacting conditions on reactor phenomena compared with experimental research [6,7,8,9,10,11]. In two-dimensional (2D) CFD simulations, porous media models are commonly used to study transport processes and chemical reactions within various fixed-bed systems. Eduard Khramchenkov et al. [12] developed a mathematical model of coupled dissolution and two-phase flow in porous media. This model can be used to simulate chemical and hydrogeomechanical processes that are difficult to validate experimentally. It demonstrated good agreement between field data and simulation results and was further applied to simulate the acidification process in various heterogeneous layer configurations. Yan et al. [13] proposed a new 2D hybrid fracture porosity seepage model based on the finite discrete element method (FDEM), which combines the pore seepage model and the fracture seepage model to solve the fluid flow problem in fractured porous media more effectively. The advantage of the porous media model is its lower computational intensity, making it suitable for effective predictions of industrial-scale reactors [14,15]. Marcato et al. [16] proposed an open source workflow that combines CFD with deep learning to build data-driven models, breaking through traditional physics model-based simulation methods and utilizing deep learning algorithms to quickly predict fluid dynamics parameters in porous media. This modeling approach simplifies the geometry of the catalyst particles, thus improving computational efficiency and feasibility. However, its limitation is that it cannot accurately characterize the complex velocity, concentration, and temperature distributions around the particles in a fixed-bed reactor. This approach fails to take into account factors such as the specific stacking arrangement of the catalyst particles, the particle size distribution, and the complex flow paths within the bed, resulting in an incomplete or potentially impractical representation of the detailed flow behavior and mass transfer characteristics.
As a result, an increasing amount of research has focused on the impact of catalyst shapes on the reactor performance [17,18,19,20]. Wehinger et al. [21] explored the effect of particle shape on dry methane-reforming reactions. Karthik et al. [22] conducted particle-resolved CFD simulations of a multilayer-filled bed for a methane steam-reforming reaction, analyzing in detail the effects of different boundary conditions and particle modeling methods. Chen Yang et al. [23] investigated the mass transfer characteristics of fluids in structured porous media with porous particles at discontinuous interfacial concentrations based on volume-averaged theory. Additionally, Dixon et al. [7] conducted a study on the tube diameter ratio and found that the bed structure distribution varies greatly when the tube diameter-to-particle size ratio is different; the larger the tube-to-particle diameter ratio, the more its characteristics approach those of a porous medium. Conversely, a smaller ratio leads to more significant radial flow of the fluid around the particles, which increases non-uniformity and causes the results to deviate from the porous medium model.
Existing studies have shown that optimizing particle shape can markedly refine reactor efficiency and catalyst reaction outcome [24,25,26,27]. Most current research focuses on the problem of fluid flow with different catalyst shapes, and these studies typically do not consider chemical reactions. Conversely, studies that do incorporate reactions predominantly address only a single catalyst shape. Consequently, few studies simultaneously investigate diverse reaction conditions and various catalyst types. In practical applications, the performance of the catalyst is critical, as the shape and size distribution of particles significantly influence flow resistance and reaction rates [28,29,30,31,32,33,34]. Irregularly shaped particles and uneven packing can lead to non-uniform velocity distributions, thereby reducing the uniformity of the reaction and diminishing catalyst utilization efficiency. Therefore, incorporating the detailed structure of catalyst particles is essential for accurately analyzing flow field distribution and reactor performance under various operating conditions.
The aim of this study is to overcome the challenges and limitations inherent in modeling porous media by performing size-resolved CFD simulations of catalyst particles in a fixed-bed reactor in order to provide design and guidance for industrial applications of fixed-bed reactors. First, the hydrodynamics flow characteristics for the above three systems over a hollow cylindrical catalyst structure were discussed. Subsequently, the impact of varying operational conditions on the axial mass fraction distribution and methanol conversion for the methanol-to-DME system are further investigated. Finally, we have systematically investigated the effects of three different catalyst shapes on the velocity distribution, temperature distribution, and methanol conversion for the DME system. The results show that the inhomogeneous flow pattern of the fluid flow directly affected the velocity distribution and hence had a significant impact on the mass fraction distribution and conversion. On the other hand, the temperature distribution is closely related to the exothermic or endothermic nature of the reaction, which in turn affects the consumption of reactants and the formation of products. Comparative studies of three different catalysts have shown that the larger the voids within the catalyst particles, the more uniform and stable the fluid flow is and the less heat is released. The conversion of solid cylindrical catalysts was superior to that of hollow cylindrical catalysts in a specific temperature range. The simulation results provide valuable insights into the heat transfer, mass transfer, and flow field dynamics within three-dimensional catalyst structures and emphasize the advantages of heterogeneous catalyst structures for the study of particle-scale phenomena, which is beneficial to a robust theoretical framework for reactor performance analysis and design. The highlights of this study are as follows:
- Performing extensive particle-resolved CFD simulations of fluid-phase fixed-bed reactors;
- Comparative evaluation and analysis of three industrially important reaction systems, namely methanol to dimethyl ether, CO2 hydrogenation to methanol, and levulinic acid esterification;
- Studying reactor performance by investigating the effect of operating conditions and catalyst particle shapes.
2. Model Description
The model established in this study is mainly based on the following assumptions: the model established in this paper assumes uniform distributions of fluid velocity, temperature, and molar fractions of all components at the inlet. Within the model, the porous medium catalyst is assumed to be isotropic, with uniform pore size, shape, and distribution, as well as constant porosity. Furthermore, the influence of narrow channels on fluid flow is neglected.
2.1. Model Equations
2.1.1. Fluid Domain
The fluid flow within a porous medium can be effectively described using the continuity equation and the momentum equation, which together characterize the behavior of fluids as they move through porous structures. This principle is mathematically represented by the continuity equation [24]:
The momentum equation for the fluid phase is
The scalar transport equations for species mass fractions within the fluid domain, excluding any additional mass source terms, are expressed as follows:
where is the diffusion coefficient of component i. The stress tensor includes the viscous stress tensor and the turbulent stress tensor, often referred to as Reynolds stress. The stress tensor comprises the viscous stress tensor and the turbulent stress tensor , commonly referred to as Reynolds stress. These components are described by the following equations:
represents the turbulent viscosity and is estimated using the two-equation shear stress transport (SST) k-ω turbulence model:
In the fluid domain, energy conservation for convection and conduction is governed by the convection diffusion equation, which is solved without the inclusion of additional source terms. This equation is given by
represents the turbulent diffusion coefficient.
2.1.2. Solid Domain (Porous Domain)
Within the particle domain, energy conservation is addressed solely through diffusion equations, as convection is absent in this region:
The solid density is denoted as ρs. The effective thermal conductivity of the solid phase, λs,eff, is defined by λs,eff = λs(1 − εs) + λεs, where λs represents the thermal conductivity of the solid phase and εs stands for the solid porosity (assigned as 0.457 in this study). Ts is the particle temperature and Sh denotes the heat source resulting from chemical reactions in the solid phase. The calculation of Sh in Equation (10) is carried out using the following method:
The coupling of heat fluxes in both domains occurred through the enforcement of the flux continuity boundary conditions (where Jheat,fluid = Jheat,solid, with Jheat representing the heat flux) at the interface between the fluid and solid particles. The species fluxes in both the domains were coupled by imposing the flux continuity boundary conditions (where Ji,fluid = Ji,solid, with Ji is the species flux) at the fluid–particle interface. The method has been extensively discussed and validated under steam-reforming conditions and different flow regimes [10,22,24,34,35].
In addition, we solved the scalar transport equations for the mass fractions of species within the solid domain as follows:
The effective diffusivity of the ith species in the solid phase is represented by Ds,eff,i. There are various methods for its calculation, such as the Maxwell–Stefan model [29] and the Dusty Gas Model [24]. In this paper, the Dusty Gas Model is used to calculate this effective diffusion coefficient:
where is the binary diffusion coefficient of component i in the gas, ε is the porosity, and n is an index related to the structure of the porous medium.
Si denotes the rate of species production or consumption through chemical reactions for species i inside the catalyst particle phase, calculated by
The chemical reaction term describes the rate at which component i is generated or consumed due to a chemical reaction.
2.2. Kinetic Equations
This study considers three distinct reaction systems, namely methanol to dimethyl ether (DME), CO2 hydrogenation to methanol, and acetol esterification. The chemical reactions involved in these systems are as follows:
Methanol to dimethyl ether (the kinetic equation is based on the Modified Klusáček and Schneider model) [36]:
CO2 hydrogenation to methanol (the kinetic equations are based on the single-site model) [37]:
Levulinic acid esterification reaction (the kinetic equations are based on a self-catalyzed and heterogeneous model) [38]:
2.3. Simulation Conditions and Numerical Methodology
In this study, the simulation conditions of the methanol-to-DME system were consistent with the experiments, and the reaction conditions were as follows: the feed rate was 1.5277 × 10⁻⁵ kg/s; the reactor temperatures were 190 °C, 177 °C, 165 °C, 152 °C, and 140 °C; and the partial pressures of feed methanol at different temperatures were 1, 0.67, and 0.33, respectively. The specific data were compared with those in Table 1 and the maximum margin of inaccuracy was 4.76%, indicating the validity and accuracy of the simulation results. The kinetic validation sections for the two systems (methanol synthesis and levulinic acid esterification) are detailed in Tables S1 and S2 in the SI.

Table 1.
Methanol to DME.
A rigid body dynamics model was used to generate the accumulation of catalyst particles, and the model parameters were continuously adjusted and optimized in Blender. Then, grid information was generated, and the grid parameters were continuously adjusted in the software based on actual parameters. Finally, the model was imported into CFD software (Fluent 2020 R2) for subsequent calculations. To address structural issues during mesh generation, bridging methods [39] and global shrinking techniques are commonly used. This study employed the global shrinking technique to reduce particle volume by 1% without impacting flow distribution in those regions. Existing research has shown that the effect of shrinkage on flow is negligible for volume changes within 5% [22,24]. The calculated voidage we obtained is in agreement with the experimentally determined values. Existing analysis shows that a grid size between D/20 and D/15 (corresponding to a grid number between 7.4 million and 24.5 million) can achieve sufficient accuracy, which is consistent with the sizes typically used in the literature [7,10].
Three different catalyst shapes are shown in Figure 1: ‘solid cylinder’, ‘hollow cylinder a’, and ‘hollow cylinder b.’ The simulations were conducted using Fluent software, with the chemical reaction kinetics implemented through user-defined functions (UDFs). The model was divided into two distinct regions, namely the fluid domain and the solid catalyst region. The source terms were incorporated into the solid catalyst region, which was modeled as a porous medium, and only internal diffusion was considered in the catalyst region. Catalyst stacking height, fluid mixture modeling parameters, and other relevant modeling parameters are listed in Table 2. The viscosity, thermal conductivity, molar specific heat capacity versus temperature, and heat of reaction of the components used in the simulations were obtained from physical property databases, related manuals, and the literature [40]. The operating parameters for the three systems are listed in Table 3. The boundary conditions adopted nonslip wall boundary conditions, and the wall was set as adiabatic.
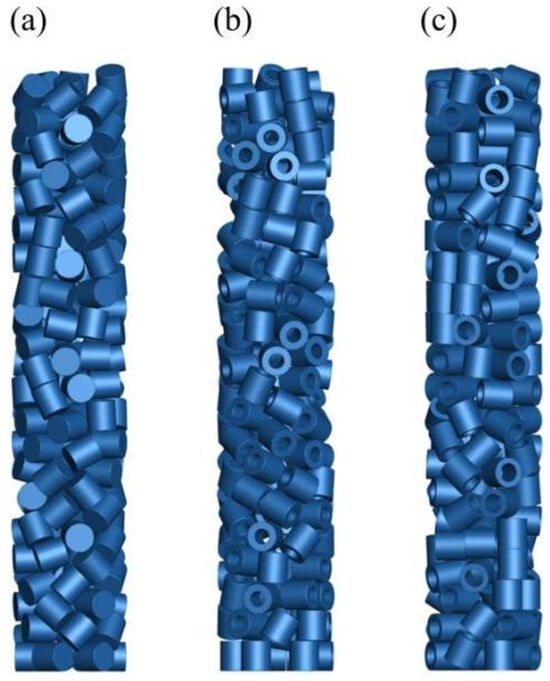
Figure 1.
Diagrams of three different catalyst structures. ((a) Solid cylinder; (b) hollow cylinder a; (c) hollow cylinder b).

Table 2.
Numerical parameters.

Table 3.
Operating conditions of the three systems.
3. Results and Discussion
The calculation timestep used for calculations is 0.005 s. For the methanol to dimethyl ether system, it reaches a stable state with oscillations around 12,000 s; the data used for analysis in this study were time-averaged over the period from 12,000 s to 13,000 s. Similarly, the methanol synthesis system stabilizes and begins to oscillate at approximately 6000 s, with the analyzed results being time-averaged from 6000 s to 7000 s. Finally, the levulinic acid esterification reaction system stabilizes and starts oscillating around 400 s, and the study’s findings are based on time-averaged data from 400 s to 500 s.
3.1. Flow Hydrodynamics Characteristic for Different Reaction Systems
The three systems used in this study have been thoroughly validated, confirming the accuracy and reliability of the kinetics described (this study has performed mesh independence validation), as shown in Tables S3–S5 in the Supporting Information. Specifically, the validation process involved comparing the conversion rates predicted by the simulations with those obtained from experimental data, which showed good agreement.
Figure 2 shows the radial velocity distributions at three different locations, including where the fluid first contacts the catalyst (z = 0.15 m), the midpoint of the catalyst (z = 0.35 m), and near the end of the catalyst (z = 0.55 m). It is evident that the flow rate decreases significantly as the fluid passes over the catalyst. The fluid flow rate over the catalyst surface is lower than that in the void region, which can be attributed to the fluid being impeded by clogging, accumulation, and interaction with the catalyst particles. Additionally, the flow rate near the reactor wall is lower than that in the center void area, which is due to the viscosity of the fluid, resulting in a slower flow rate near the wall. Meanwhile, the average velocities in the plane of three reactor heights, Z = 0.15, Z = 0.35, and Z = 0.55, were also simulated.
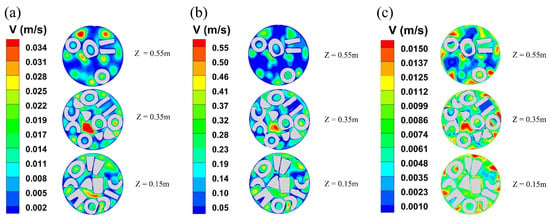
Figure 2.
The contour plots of radial velocity distributions at different axial positions in different systems: (a) methanol to dimethyl ether system; (b) synthetic methanol system; (c) levulinic acid esterification reaction system.
Figure 3 shows the contour plots of axial temperature for the three systems in fixed-bed reactors. Due to the exothermic characteristics for the methanol-to-DME and methanol synthesis systems, the axial temperature increases gradually due to heat accumulation along the reactor’s axial direction. In contrast, the endothermic reaction for the levulinic acid esterification system leads to a gradual decrease in temperature along the reactor height. The radial temperature profiles at different locations within the reactor reveal significant temperature variations between the different reaction systems. Moreover, the radial temperature profiles at different heights of the reactor are shown in Figure 4. Obviously, the temperature increases for the exothermic reaction systems, while that of the endothermic reaction system decreases with the improvement in reactor heights, which can also be observed in Figure 3. Additionally, the radial temperature distribution in the reactor is inhomogeneous, primarily due to the uneven distribution of the heterogeneous catalyst structure. Since the flow velocity within the catalyst approaches zero, heat transfer outwards from the catalyst primarily relies on heat conduction. Therefore, the temperature within the catalyst will be higher than in the interstitial regions between catalysts. Convective heat transfer occurring only at the fluid–solid interface does not dominate the thermal changes within the solid domain. The concentration of reactants and products are shown in Figure 5. Obviously, the mass fraction of reactants increases along the axial height of the reactor, with a corresponding decrease in the mass fraction of reactants for the three reaction systems.
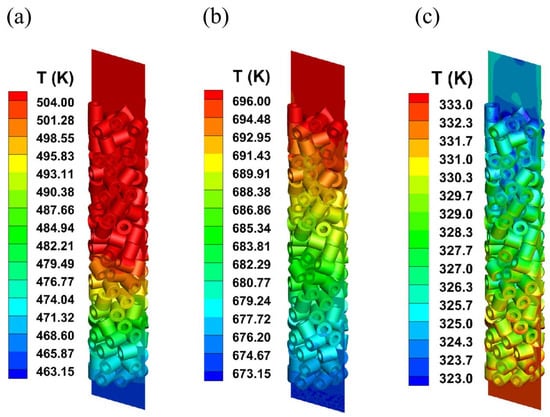
Figure 3.
The contours of axial temperature distribution in different systems: (a) methanol to dimethyl ether system; (b) synthetic methanol system; (c) levulinic acid esterification reaction system.

Figure 4.
Radial temperature profiles of methanol to dimethyl ether system at different locations in the reactor: (a) methanol to dimethyl ether system; (b) synthetic methanol system; (c) levulinic acid esterification reaction system.
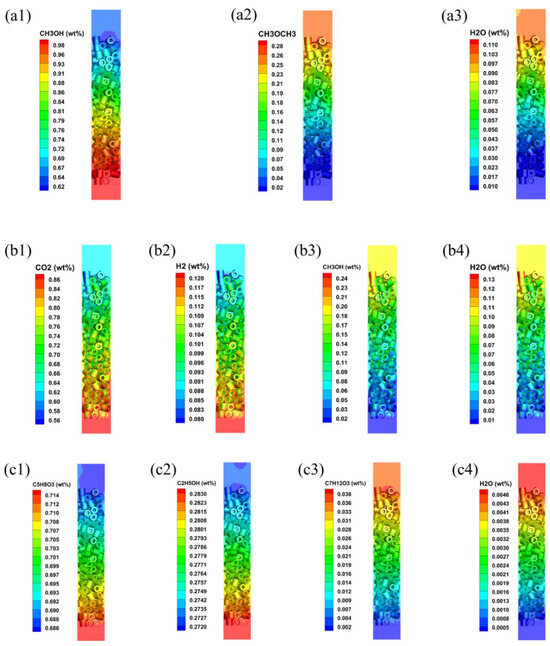
Figure 5.
Mass fraction distributions of reactants and products in different systems: (a) methanol to dimethyl ether system; (b) synthetic methanol system; (c) levulinic acid esterification reaction system. ((a1–a3): mass fraction of CH3OH, CH3OCH3 and H2O; (b1–b4): mass fraction of CO2, H2, CH3OH and H2O; (c1–c4): mass fraction of C5H8O3, C2H5OH, C7H12O3 and H2O).
3.2. Effects of Different Operating Conditions on Methanol to Dimethyl Ether System
In this study, the behavior of a methanol to dimethyl ether system was investigated under our different feed rates (0.005 m/s, 0.01 m/s, 0.015 m/s, and 0.02 m/s), various operating temperatures (463.15 K, 483.15 K, 503.15 K, 523.15 K, and 543.15 K), and three different methanol molar concentrations (1, 0.9, and 0.8). The effect of these different conditions on the methanol conversion and the axial mass fraction distribution of methanol and DME, as well as methanol conversion, is discussed.
Figure 6 illustrates the effect of the feed rate on the axial mass distribution of methanol and dimethyl ether (DME). As the feed rate increases, the axial mass fraction of methanol shows a clear upward trend, while the mass fraction of DME gradually decreases. This behavior suggests that higher feed rates result in an incomplete conversion of methanol within the reactor, leading to a decrease in overall methanol conversion. A possible explanation for this phenomenon is that at higher feed rates, the residence time of the reactants is reduced, limiting the interaction time between methanol and the catalyst, thereby inhibiting the formation of DME. In contrast, at lower feed rates, the residence time is extended, allowing for a more complete conversion of methanol, which in turn leads to higher DME yields. This finding highlights the critical role of residence time in optimizing the methanol-to-DME conversion process, with lower feed rates facilitating more efficient utilization of the catalyst and improving product formation.
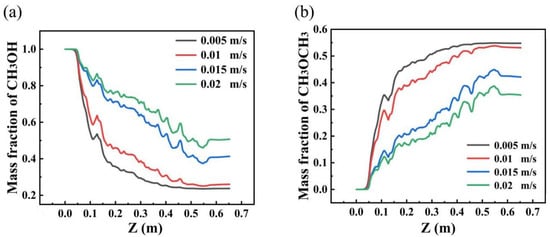
Figure 6.
Axial mass fraction distribution of methanol and dimethyl ether at different feed velocities. ((a) mass fraction of CH3OH; (b) mass fraction of CH3OCH3).
Figure 7 illustrates that the mass fraction of methanol reactants decreases significantly with increasing operating temperature. This behavior suggests that at the reactor inlet, the reaction rate is relatively higher, resulting in accelerated methanol consumption. As the reactants move toward the reactor outlet, the concentration of methanol decreases further. Similarly, the mass fraction of DME stabilizes near the reactor outlet, reflecting the attainment of a steady state in product formation. Further analysis indicates that at elevated temperatures, the mass fraction of methanol near the reactor outlet is notably lower, which is indicative of an increased conversion of methanol within the reactor. This phenomenon implies that higher temperatures assist in overcoming the activation energy barrier, enabling a greater number of methanol molecules to participate in the reaction. As a result, the reaction rate increases, leading to a higher conversion efficiency. These findings highlight the critical role of temperature in enhancing methanol conversion, as it not only accelerates the reaction rate but also facilitates a more efficient utilization of the reactant molecules, thereby improving the overall reactor performance.
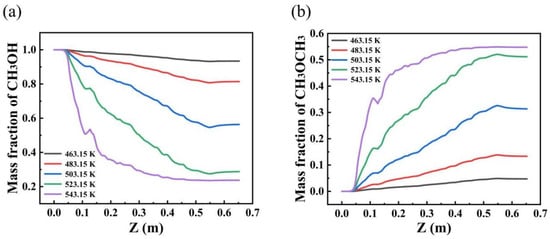
Figure 7.
Axial mass fraction distribution of methanol and dimethyl ether at different feed temperatures. ((a) mass fraction of CH3OH; (b) mass fraction of CH3OCH3).
The simulation results in Figure 8 show that the molar concentration of the feed methanol has almost no effect on the system’s conversion, while temperature has a more significant impact. Specifically, the methanol conversion changes very little whether the molar concentration of methanol is 0.8, 0.9, or 1. This suggests that within a certain range, the molar concentration has a minor effect on the methanol conversion. However, temperature has a significant impact on methanol conversion.
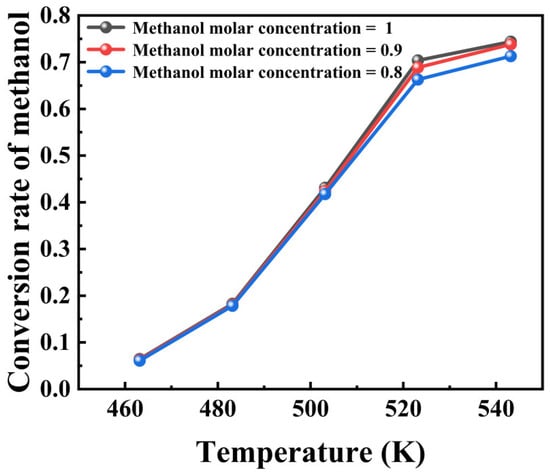
Figure 8.
Effect of temperature and methanol partial pressure on conversion rate.
A noticeable increase in methanol conversion can be found as temperature rises under all three methanol molar concentration conditions. This can be attributed to the accelerating effect of temperature on the reaction rate. Apparently, an increase in temperature usually results in a significant increase in the reaction rate constant, thereby increasing methanol conversion.
3.3. Effect of Catalysis on Reactor Performance
The main focus of this study is to compare the effects of three differently shaped catalysts on the reactor, including their velocity and temperature distributions. Although the average bed porosity of the three shaped catalysts differed significantly, resulting in a non-consistent volume-to-mass ratio, the comparison method based on equal bed heights is more valuable for engineering practice in view of the gravity-filling method commonly adopted for catalyst loading in industrial fixed-bed reactors. This strategy not only realistically simulates the loading conditions in actual production but also ensures the comparability of different catalyst systems under the same hydrodynamic conditions, thus providing a realistic and guiding evaluation benchmark for the optimization of industrial catalyst selection.
In this study, the velocity distributions of three different catalyst shapes were analyzed, as shown in Figure 9. The plane in which the bottom of the reactor (inlet) is located is defined as the reference plane, where the central axis is defined as the z-axis. The axial direction of the reactor from the bottom to the top is defined as the y-axis direction, and the axial profile taken is the cross-section in the y-z plane. The operating conditions of this section are a feed speed of 0.005 m/s and a feed temperature of 463.15 K. The boundary conditions adopt nonslip wall boundary conditions, and the wall is set as adiabatic. The results highlight significant differences in both the magnitude and pattern of velocity fluctuations, which are closely related to the structural features of the catalyst shapes. Specifically, Figure 9a (solid cylindrical catalyst) and Figure 9b (hollow cylinder a) exhibit a wider range of velocity variations and more pronounced localized velocity fluctuations. This suggests greater variability in the fluid flow on their surfaces, likely due to the limited flow channels, which cause fluctuations in fluid movement in specific regions. Figure 9c (hollow cylinder b), on the other hand, shows the lowest magnitude of velocity fluctuations and lower velocity values compared to both hollow cylinder a and the solid cylindrical catalyst. This can be attributed to the larger hollow portion in hollow cylinder b, which results in more space being occupied by the fluid within the catalyst region. As a result, the volume of the heterogeneously structured catalyst in the reactor is reduced, increasing the cross-sectional area available to the fluid at a constant feed volume flow rate. Consequently, this leads to a reduction in the flow velocity in this region. As a result, the velocities at different locations in Figure 9c are generally lower than those in Figure 9a,b.
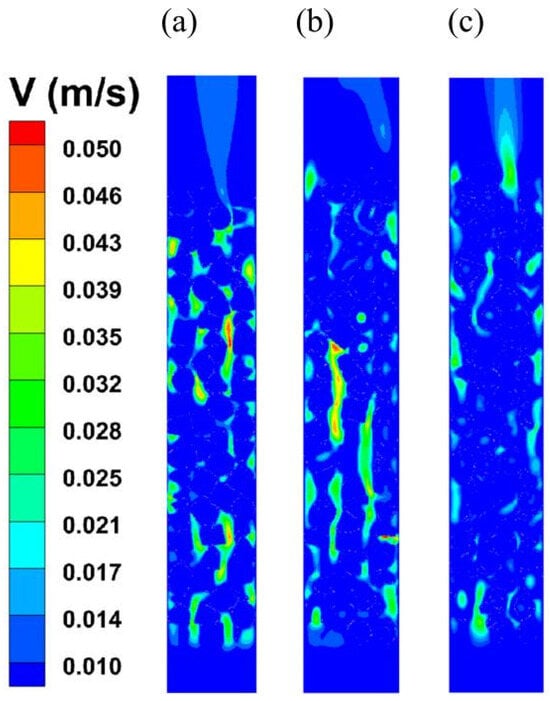
Figure 9.
Velocity distribution under different catalyst shapes. ((a) Solid cylinder; (b) hollow cylinder with hollow 12.98 mm; (c) hollow cylinder with hollow 15.80 mm).
It was also observed that the velocity peaks for all three catalyst shapes were mainly concentrated in the void region between neighboring catalysts, which means that fluids converge in this region as they pass through the flow channel. In contrast, the flow velocity at the catalyst surface is usually lower than that of the fluid phase, which creates a velocity gradient as the fluid flows over the catalyst surface due to the hindering effect of the catalyst on the fluid. The differences in velocity distributions for different shapes of catalysts suggest that the design of catalyst particle structures has a significant effect on fluid flow behavior. These findings provide valuable insights to guide catalyst design, achieve desired flow characteristics, and improve catalytic efficiency.
Figure 10 shows the temperature distribution on the surface and inside the three particle shapes. The gas feed enters from the bottom of the reactor, and since the system is exothermic with adiabatic walls, the temperature distribution of all particle shapes increases gradually from the reactor inlet to the outlet. At the same time, the internal temperature of the pellets varies depending on their shape. The lower heat release of hollow cylindrical particles with internal voids, compared to solid cylinder particles, is due to the smaller amount of catalyst involved in the reaction. Furthermore, the larger the void volume of the hollow particles, the less heat is released in the system.
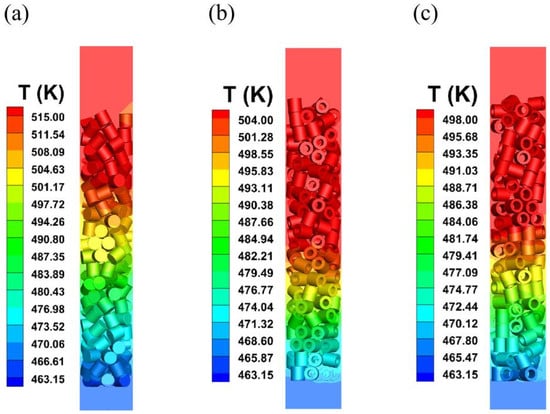
Figure 10.
Temperature distribution under different catalyst shapes. ((a) Solid cylinder; (b) hollow cylinder with hollow 12.98 mm; (c) hollow cylinder with hollow 15.80 mm).
The effect of these catalyst shapes on the reaction performance of the methanol-to-DME system was further evaluated and analyzed at five different temperatures, as previously described. At the lower temperature of 463.15 K, the conversions for the three catalyst shapes were 7.50% for the solid cylindrical structure, 6.46% for hollow cylinder a, and 5.69% for hollow cylinder b. This indicates that the volume of the hollow core in the catalyst particles has a minimal effect on the conversion at this temperature. However, at intermediate temperatures (483.15 K, 503.15 K, and 523.15 K), Figure 11 and Table 4 shows that the effect of catalyst shape on the conversion becomes more significant. At these temperatures, the highest conversion was achieved with the solid cylindrical catalyst. By 543.15 K, the conversion was nearly the same for all three catalyst shapes. Thus, the solid cylinder particles provided the highest conversion in the temperature range from 483.15 K to 523.15 K, while at other temperatures, the catalyst shape had less impact on the conversion. After the conversion rate reaches 75%, the conversion does not increase beyond 0.75 even if the temperature is further increased. This is because as the temperature increases, the equilibrium conversion rate further decreases because the equilibrium constant decreases with increasing temperature. Due to the characteristics of exothermic reactions, this expected behavior occurs. Meanwhile, an increase in water content in the feed will reduce the achievable methanol equilibrium conversion rate, as it favors reversible reactions (DME+H2O → 2MeOH). That is to say, temperature and water content have a significant impact on the equilibrium conversion rate of methanol dehydration reactions, especially under high-temperature and high-water content conditions, in which the equilibrium conversion rate will significantly decrease [36].
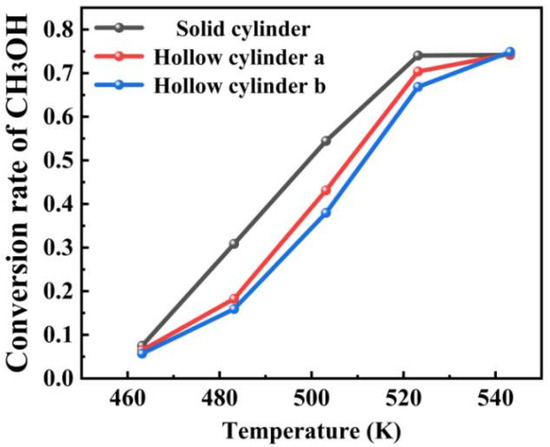
Figure 11.
Effect of different catalyst shapes on methanol conversion rate at various temperatures.

Table 4.
Comparison of methanol conversion data with different catalyst shapes.
4. Conclusions
In this contribution, the reactor performance, as well as the flow hydrodynamic characteristics of three industrially important reactor systems, including methanol to dimethyl ether, methanol synthesis, and acetyl propionic acid esterification, were comprehensively analyzed in fixed-reactor beds. The methanol-to-DME system was further investigated to assess the effects of operating conditions and catalyst particle shapes. The numerical results showed the complexity flow hydrodynamics and reaction behaviors for the three systems in fixed-bed reactors. Specifically, exothermic reactions such as methanol to dimethyl ether and CO2 hydrogenation to methanol are characterized by a gradual increase in temperature along the reactor height, while endothermic reactions such as valeric acid esterification exhibit a gradual decrease in temperature along the reactor height. For the methanol-to-dimethyl ether system, the increase in operating temperature leads to the decrease in axial methanol concentration, as well as an improvement in axial dimethyl ether concentration. However, the change in methanol molar concentration has little influence on its conversion. Moreover, the impact of three catalyst shapes demonstrated that the hollow cylindrical catalyst exhibited the least velocity variation, which represents a more uniform fluid flow around the catalyst structure. However, voids within the catalyst particles led to fluid deceleration and reduced heat release due to the lower effective catalytic volume. Solid cylindrical catalysts achieved higher conversion rates within the temperature range of 483.15 K to 523.15 K, attributed to their larger reactive volume. Apparently, reactor performance varies from the important interactive contributions of hydrodynamics characteristics and reaction behaviors. The results provide valuable insights into the mechanisms of heat and mass transfer, as well as the flow field dynamics within the three-dimensional catalyst structure.
The model adopted in this study performed well in the three systems investigated. However, when the feed mixing is poor, its accuracy is limited and it is not suitable for catalyst scale research. In addition, the performance of the model will also be greatly affected when using certain catalysts with anisotropy that cannot be ignored. Our simulation research of future chemical engineering reactors will consider more complex situations and focus on the distribution of fluid residence time and study its impact on fluid flow and chemical reaction processes.
Supplementary Materials
The following supporting information can be downloaded at: https://www.mdpi.com/article/10.3390/pr13061820/s1, Table S1: CO2 Hydrogenation to Methanol; Table S2: Acetol Esterification; Table S3: Kinetic parameters based on the modified Klusáček & Schneider model; Table S4: Kinetic parameters based on the unit point model; Table S5: Kinetic parameters based on auto-catalytic and multi-phase models.
Author Contributions
Conceptualization, H.P., Y.L. (Yongshuai Li), G.L., X.Z., F.J. and L.Z.; methodology, F.J., X.Z., G.L., Y.L. (Yongshuai Li), L.Z., L.Y. and H.P.; software, C.X.; validation, C.X.; formal analysis, C.X., Y.L. (Yujia Liu), J.H., G.L. and Y.L. (Yongshuai Li); investigation, F.J., X.Z., Y.L. (Yujia Liu), J.H. and L.Y.; resources, C.X., L.Z. and H.P.; data curation, C.X. and H.P.; writing—original draft preparation, C.X. and H.P.; writing—review and editing, L.Z. and H.P.; visualization, C.X., H.P., Y.L. (Yujia Liu), G.L., X.Z., F.J., L.Y. and L.Z.; supervision, L.Y. and H.P.; project administration, F.J., H.P., L.Y. and L.Z.; funding acquisition, L.Z. and H.P. All authors have read and agreed to the published version of the manuscript.
Funding
This study was funded by National Natural Science Foundation of China (No. 22478239), Science and Technology Commission of Shanghai Municipality (No. 19DZ2271100), the National Natural Science Foundation of China (No. 22208208) and the Shanghai Sailing Program of China (No. 23YF1409200).
Data Availability Statement
The raw data supporting the conclusions of this article will be made available by the authors on request.
Acknowledgments
This authors thank the College of Smart Energy of Shanghai Jiao Tong University and School of Chemical Engineering of East China University of Science and Technology for their support and technical assistance during this project.
Conflicts of Interest
The authors declare no conflict of interest.
Notation
| Ethyl levulinate concentration | |
| Ethanol concentration | |
| Levulinic acid concentration | |
| Water concentration | |
| ) | |
| ) | |
| ) | |
| k | Kinetic factor (mol·kgcat−1·s−1) |
| Gas phase heat transfer coefficient | |
| ) | |
| K | Equilibrium constant (–) |
| Adsorption constant of MeOH (bar−1) | |
| Adsorption constant of CO2 (bar−1) | |
| Adsorption constant of H2 (bar−1) | |
| Equilibrium constant of the reaction (dimensionless) | |
| Pi | Partial pressure of species i in the reaction mixture (bar) |
| R | Ideal gas constant (8.314 J·mol−1·K−1) |
| i | Reaction rate (mol/m3/s) and (mol/kg/s) |
| ) | |
| ) | |
| Gas phase viscosity (Pa·s) | |
| V | Volumetric flow rate (m3/s) |
| Porosity | |
| Permeability (m2) |
References
- Boccardo, G.; Augier, F.; Haroun, Y.; Ferré, D.; Marchisio, D.L. Validation of a novel open-source work-flow for the simulation of packed-bed reactors. Chem. Eng. J. 2015, 279, 809–820. [Google Scholar] [CrossRef]
- Soleymani, A.R.; Chahardoli, R.; Kaykhaii, M. Development of UV/H2O2/TiO2-LECA hybrid process based on operating cost: Application of an effective fixed bed photo-catalytic recycled reactor. J. Ind. Eng. Chem. 2016, 44, 90–98. [Google Scholar] [CrossRef]
- Weng, J.; Zhang, Q.; Yu, J.; Yu, Q.; Ye, G.; Zhou, X. Radially layered configuration for improved performance of packed bed reactors. Chem. Eng. Sci. 2022, 260, 115234. [Google Scholar] [CrossRef]
- Kim, J.; Yu, J.; Lee, S.; Tahmasebi, A.; Jeon, C.-H.; Lucas, J. Advances in catalytic hydrogen combustion research: Catalysts, mechanism, kinetics, and reactor designs. Int. J. Hydrogen Energy 2021, 46, 40073–40104. [Google Scholar] [CrossRef]
- Shahi, P.B.; Manandhar, S.; Angove, M.J.; Paudel, S.R. Performance evaluation of species varied fixed bed biofilm reactor for wastewater treatment of Dhobi Khola outfall, Setopul, Kathmandu, Nepal. Sci. Total. Environ. 2024, 942, 173752. [Google Scholar] [CrossRef] [PubMed]
- Benhalilou, M.R.; Ouerhani, M.; Largeau, J.-F.; Tazerout, M. Experimental and CFD investigation of thermo-catalytic conversion of toluene as tar model in a fixed bed of date stone and spent coffee ground chars. Biomass Convers. Biorefinery 2024, 14, 27767–27786. [Google Scholar] [CrossRef]
- Behnam, M.; Dixon, A.G.; Nijemeisland, M.; Stitt, E.H. A new approach to fixed bed radial heat transfer modeling using velocity fields from computational fluid dynamics simulations. Ind. Eng. Chem. Res. 2013, 52, 15244–15261. [Google Scholar] [CrossRef]
- Dung, P.D.; Babick, F.; Nguyen Minh, T.; Wessely, B.; Stintz, M. Modelling the influence of mass transfer on fixed-bed photocatalytic membrane reactors. Chem. Eng. Sci. 2017, 173, 242–252. [Google Scholar]
- Partopour, B.; Dixon, A.G. 110th Anniversary: Commentary: CFD as a Modeling Tool for Fixed Bed Reactors. Ind. Eng. Chem. Res. 2019, 58, 5733–5736. [Google Scholar] [CrossRef]
- Partopour, B.; Dixon, A.G. Effect of particle shape on methanol partial oxidation in a fixed bed using CFD reactor modeling. AIChE J. 2020, 66, e16904. [Google Scholar] [CrossRef]
- Oliveira, W.D.; Pires, M.S.G.; Canno, L.M.; Ribeiro, L.C.L.J. Flow study in channel with the use computational fluid dynamics (CFD). J. Phys. Conf. Ser. 2016, 738, 012084. [Google Scholar] [CrossRef]
- Khramchenkov, E.; Khramchenkov, M. Numerical model of two-phase flow in dissolvable porous media and simulation of reservoir acidizing. Nat. Resour. Res. 2018, 27, 531–537. [Google Scholar] [CrossRef]
- Yan, C.; Fan, H.; Huang, D.; Wang, G. A 2D mixed fracture–pore seepage model and hydromechanical coupling for fractured porous media. Acta Geotech. 2021, 16, 3061–3086. [Google Scholar] [CrossRef]
- Nemoda, S.; Mladenovic, M.; Belosevic, S.; Mladenovic, R.; Dakic, D. Numerical model of gaseous fuel jet injection into a fluidized furnace. Int. J. Heat Mass Transf. 2009, 52, 3427–3438. [Google Scholar] [CrossRef]
- Chen, X.; Dai, J.; Luo, Z. CFD modeling using heterogeneous reaction kinetics for catalytic dehydrogenation syngas reactions in a fixed-bed reactor. Particuology 2013, 11, 703–714. [Google Scholar] [CrossRef]
- Marcato, A.; Boccardo, G.; Marchisio, D. A computational workflow to study particle transport and filtration in porous media: Coupling CFD and deep learning. Chem. Eng. J. 2021, 417, 128936. [Google Scholar] [CrossRef]
- Moghaddam, E.M.; Foumeny, E.A.; Stankiewicz, A.I.; Padding, J.T. Heat transfer from wall to dense packing structures of spheres, cylinders and Raschig rings. Chem. Eng. J. 2021, 407, 127994. [Google Scholar] [CrossRef]
- Soltanali, S.; Halladj, R.; Rashidi, A.; Hajjar, Z. The effect of HZSM-5 catalyst particle size on gasoline selectivity in methanol to gasoline conversion process. Powder Technol. 2017, 320, 696–702. [Google Scholar] [CrossRef]
- Ulitin, N.V.; Tereshchenko, K.A.; Rodionov, I.S.; Alekseev, K.A.; Shiyan, D.A.; Kharlampidi, K.E.; Mezhuev, Y.O. Numerical Simulation of Hydrodynamics and Heat Transfer in a Reactor with a Fluidized Bed of Catalyst Particles in a Three-Dimensional Formulation. Appl. Sci. 2024, 14, 5009. [Google Scholar] [CrossRef]
- Wang, Z.; Kang, C.; Hao, J.; Ren, J.; Cui, Z.; Bao, D.; Feng, P.; Xin, F. Simulating Gas-Solid Phase Isomerization of C8 Aromatics Affected by Catalyst Shapes in Fixed Bed Reactors with Particle-Resolved CFD Approach. Chem. Eng. Sci. 2024, 295, 120181. [Google Scholar] [CrossRef]
- Wehinger, G.D.; Kolaczkowski, S.T.; Schmalhorst, L.; Beton, D.; Torkuhl, L. Modeling fixed-bed reactors from metal-foam pellets with detailed CFD. Chem. Eng. J. 2019, 373, 709–719. [Google Scholar] [CrossRef]
- Karthik, G.M.; Buwa, V.V. Particle-Resolved Simulations of Methane Steam Reforming in Multilayered Packed Beds. AIChE J. 2018, 64, 4162–4176. [Google Scholar]
- Yang, C.; Huang, R.; Lin, Y.; Qiu, T. Volume averaging theory (VAT) based modeling for longitudinal mass dispersion in structured porous medium with porous particles. Chem. Eng. Res. Des. 2020, 153, 582–591. [Google Scholar] [CrossRef]
- Zhu, L.T.; Kenig, E.Y. A study of methanol-to-olefins packed bed reactor performance using particle-resolved CFD and machine learning. AICHE J. 2024, 70, e18520. [Google Scholar] [CrossRef]
- Bouras, H.; Haroun, Y.; Bodziony, F.F.; Philippe, R.; Fongarland, P.; Augier, F. Use of CFD for pressure drop, liquid saturation and wetting predictions in trickle bed reactors for different catalyst particle shapes. Chem. Eng. Sci. 2022, 249, 117315. [Google Scholar] [CrossRef]
- Weng, J.; Akbar, A.; Deng, Q.; Ye, G.; Zhou, X.; Yuan, W. Enhanced performance of packed bed methane dry reformers using metal foam catalyst pellets: A particle resolved CFD study. Chem. Eng. Sci. 2024, 290, 119897. [Google Scholar] [CrossRef]
- Karthik, G.M.; Buwa, V.V. A computational approach for the selection of optimal catalyst shape for solid-catalysed gas-phase reactions. React. Chem. Eng. 2020, 5, 163–182. [Google Scholar]
- Chu, M.; Xin, F.; Zhang, S.; Xu, Y.; Zhu, Z. Particle-Resolved CFD Simulations of Isobutane and 2-Butene Alkylation over Complex-Shaped Zeolite Catalysts in Fixed Bed Reactors. Ind. Eng. Chem. Res. 2022, 61, 3278–3291. [Google Scholar] [CrossRef]
- Donaubauer, P.J.; Hinrichsen, O. Evaluation of Effectiveness Factors for Multicomponent Diffusion Models Inside 3D Catalyst Shapes. Ind. Eng. Chem. Res. 2018, 58, 110–119. [Google Scholar] [CrossRef]
- Karthik, G.M.; Buwa, V.V. Effect of particle shape on fluid flow and heat transfer for methane steam reforming reactions in a packed bed. AIChE J. 2017, 63, 366–377. [Google Scholar] [CrossRef]
- Wolke, S.I.; Buffon, R. Química organometálica de superfície aplicada à preparação de catalisadores heterogêneos bem definidos. Quimica Nova 2002, 25, 985–994. [Google Scholar] [CrossRef]
- Partopour, B.; Dixon, A.G. Integrated multiscale modeling of fixed bed reactors: Studying the reactor under dynamic reaction conditions. Chem. Eng. J. 2019, 377, 119738. [Google Scholar] [CrossRef]
- Spatenka, S.; Matzopoulos, M.; Urban, Z.; Cano, A. From Laboratory to Industrial Operation: Model-Based Digital Design and Optimization of Fixed-Bed Catalytic Reactors. Ind. Eng. Chem. Res. 2019, 58, 12571–12585. [Google Scholar] [CrossRef]
- Dixon, A.G.; Taskin, M.E.; Nijemeisland, M.; Stitt, E.H. CFD method to couple three-dimensional transport and reaction inside catalyst particles to the fixed bed flow field. Ind. Eng. Chem. Res. 2010, 49, 9012–9025. [Google Scholar] [CrossRef]
- Behnam, M.; Dixon, A.G.; Wright, P.M.; Nijemeisland, M.; Stitt, E.H. Comparison of CFD simulations to experiment under methane steam reforming reacting conditions. Chem. Eng. J. 2012, 207, 690–700. [Google Scholar] [CrossRef]
- Ortega, C.; Rezaei, M.; Hessel, V.; Kolb, G. Methanol to dimethyl ether conversion over a ZSM-5 catalyst: Intrinsic kinetic study on an external recycle reactor. Chem. Eng. J. 2018, 347, 741–753. [Google Scholar] [CrossRef]
- Ghosh, S.; Sebastian, J.; Olsson, L.; Creaser, D. Experimental and kinetic modeling studies of methanol synthesis from CO2 hydrogenation using In2O3 catalyst. Chem. Eng. J. 2021, 416, 129120. [Google Scholar] [CrossRef]
- Russo, V.; Hrobar, V.; Mäki-Arvela, P.; Eränen, K.; Sandelin, F.; Di Serio, M.; Salmi, T. Kinetics and Modelling of Levulinic Acid Esterification in Batch and Continuous Reactors. Top. Catal. 2018, 61, 1856–1865. [Google Scholar] [CrossRef]
- Dixon, A.G.; Nijemeisland, M.; Stitt, E.H. Systematic mesh development for 3D CFD simulation of fixed beds: Contact points study. Comput. Chem. Eng. 2013, 48, 135–153. [Google Scholar] [CrossRef]
- Nijemeisland, M.; Dixon, A.G. Comparison of CFD simulations to experiment for convective heat transfer in a gas–solid fixed bed. Chem. Eng. J. 2001, 82, 231–246. [Google Scholar] [CrossRef]
Disclaimer/Publisher’s Note: The statements, opinions and data contained in all publications are solely those of the individual author(s) and contributor(s) and not of MDPI and/or the editor(s). MDPI and/or the editor(s) disclaim responsibility for any injury to people or property resulting from any ideas, methods, instructions or products referred to in the content. |
© 2025 by the authors. Licensee MDPI, Basel, Switzerland. This article is an open access article distributed under the terms and conditions of the Creative Commons Attribution (CC BY) license (https://creativecommons.org/licenses/by/4.0/).