Abstract
This study investigates the annual carbon emission disparities between privately-owned electric vehicles (EVs) and internal combustion engine vehicles (ICEVs) by developing a usage-phase life cycle assessment (LCA) model, with a focus on the synergistic impacts of grid carbon intensity, driving intensity (e.g., annual mileage), and vehicle energy efficiency. Through scenario analyses and empirical case studies in four Chinese megacities, three key findings are obtained: (1) Grid carbon intensity is the primary factor affecting the emission advantages of EVs. EVs demonstrate significant carbon reduction benefits in regions with low-carbon power grids, even when the annual mileage is doubled. However, in coal-dependent grids under intensive usage scenarios, high-energy-consuming EVs may experience emission reversals, where their emissions exceed those of ICEVs. (2) Higher annual mileage among EV owners (1.5–2 times that of ICEV owners) accelerates carbon accumulation, particularly diminishing per-kilometer emission advantages in regions where electricity grids are heavily reliant on fossil fuels. (3) Vehicle energy efficiency heterogeneity plays a critical role: compact, low-energy EVs (e.g., A0-class sedans/SUVs) maintain emission advantages across all scenarios, while high-energy models (e.g., C-class sedans/SUVs) may exceed ICEV emissions even in regions with low-carbon power grids under specific conditions. The study proposes a differentiated policy framework that emphasizes the synergistic optimization of grid decarbonization, vehicle-class-specific management, and user behavior guidance to maximize the carbon reduction potential of EVs. These insights provide a scientific foundation for refining EV adoption strategies and achieving sustainable transportation transitions.
1. Introduction
Transportation significantly contributes to global carbon emissions, with private vehicles, especially internal combustion engine vehicles (ICEVs), accounting for a large proportion of sectoral emissions. As vehicular decarbonization becomes a crucial strategy for mitigating climate change [1,2], electric vehicles (EVs) have gained worldwide attention in the past two decades due to their potential to reduce operational emissions [3,4]. However, although EVs produce no direct tailpipe emissions, their environmental benefits depend on the carbon intensity of electricity generation. In regions where fossil fuel-based thermal power plants dominate the energy mix, EVs merely transfer emissions from the vehicle operation phase to the energy production stage [5], triggering ongoing debates about their net carbon mitigation potential [6,7].
Generally, vehicle life cycle emissions cover production, usage, maintenance, and end-of-life phases, with the usage stage contributing 62–70% of total emissions [8]. As a result, comparative analyses of the carbon footprints of EVs and ICEVs have mainly focused on the operational phases [9,10,11]. Nevertheless, these studies often assume uniform travel patterns and equal annual mileage for EV and ICEV users, an assumption challenged by recent empirical findings. For example, Liu and Xu [12] revealed that EV owners in China have an annual mileage 1.5 times higher than that of ICEV owners. This disparity raises a critical question: Under comparable vehicle lifespans (e.g., 100,000 km or 150,000 km), could the higher annual mileage of EV owners nullify their carbon advantage, especially in regions relying on fossil fuel-based electricity?
To fill research gap, this study conducts a detailed comparative analysis of annual carbon emissions of EV and ICEV owners, incorporating two new dimensions: (1) Differential usage behaviors—systematically integrating mileage differences and travel mode preferences (e.g., the tendency of EV owners to rely on private vehicle); (2) Multi-faceted emission determinants—regional power grid carbon intensity, charging infrastructure efficiency, vehicle-specific energy consumption metrics (kWh/100 km for EVs; L/100 km for ICEVs), temperature effects, and vehicle classification. By considering these often-overlooked factors, this paper provides policymakers with practical insights to optimize EV adoption strategies and maximize environmental benefits.
2. Literature Review
The conceptual foundation of life cycle assessment (LCA) can be traced back to the late 1960s when the Midwest Research Institute (MRI) conducted a pioneering energy analysis for The Coca-Cola Company. This analysis systematically evaluated beverage containers from raw material extraction to end-of-life disposal [13]. This seminal work laid the groundwork for modern LCA methodologies. In the 1990s, with the establishment of ISO 14040 standards that formalized LCA frameworks, these methodologies gained prominence in environmental management [14]. As a comprehensive analytical tool, LCA quantifies environmental impacts across a product’s entire life cycle, covering raw material acquisition, manufacturing, transportation, operational use, and ultimate disposal or recycling [15]. Its ability to provide quantifiable environmental metrics has made LCA an indispensable methodology for comparative environmental impact studies.
In automotive emissions research, LCA applications have evolved to address both direct exhaust emissions during vehicle operation and cumulative impacts across full life cycles [6,10,11,16]. Recent comparative studies using LCA frameworks have reached divergent conclusions regarding the carbon efficiency of EVs versus ICEVs. A significant body of research highlights the environmental advantages of EVs. For example, Qiao et al. [17] reported that in 2015, EVs had 18% lower life cycle greenhouse gas (GHG) emissions compared to ICEVs in 2015, and projected further reductions to 34.1 t CO2eq by 2020 through grid decarbonization. Similarly, Wu et al. [8] identified a 13.4% potential reduction in GHG emissions for Chinese EVs by 2020 through electricity mix optimization. Zhang et al. [18] concluded that most EVs exhibit emission reduction effects relative to ICEVs, estimating that in China, EVs achieved emission reductions of 6.56–44.4% in 2020; 13.97–53.39% in 2025; and 19.65–57.49% in 2030. These findings align with global observations that EV emissions are strongly correlated with cleanliness of the regional grid [19,20,21,22].
However, contrasting evidence suggests that the superiority of EVs has contextual limitations. Hawkins et al. [23], Petrauskienė et al. [24], and Nuez et al. [25] cautioned that energy systems dependent on fossil fuels could nullify the benefits of EV. Li et al. [26] exemplified this by finding that under 2018 grid conditions in China, EVs had 24–31% higher emissions. Kurien and Srivastava [5] found that fossil fuels account for 81.7% of India’s power generation energy mix; in this scenario, except for two-wheel EVs, the indirect carbon emissions of most EVs exceeded those of ICEVs. Regional case studies further illustrate this paradox: in Poland’s coal-intensive grid, daily EV operation (26 km) generates 2.49–3.28 kgCO2/day, similar to ICEV emissions [27]. Additionally, Zhang et al. [18] found that the carbon emission reduction rate of EVs varies significantly depending on driving mileage and vehicle type. In 2020, EVs with a driving mileage exceeding 700 km showed minimal to no emission reduction benefits, and in some cases, even negative effects. Analyses of the production phase also indicate that due to battery manufacturing, EVs have higher GHG emissions [28,29,30,31].
While existing research has extensively explored technical parameters (e.g., powertrain efficiency, grid emission factors) and vehicle characteristics (e.g., range, weight), critical behavioral dimensions remain understudied. Researchers generally assume that EVs and ICEVs have comparable service lifespans, typically estimated at around 10 years or 150,000 km [19,32,33,34]. This implies that EV owners have similar daily vehicle usage patterns to ICEV owners. However, emerging evidence shows significant differences in usage patterns between EV and ICEV owners [12,35,36]. The lower operational cost of EVs [37], their environmental friendliness [4], and policy support [38,39] may encourage higher utilization intensity. For example, Chinese EV owners drive 50% more kilometers annually than owners of ICEVs [12]. This behavioral difference leads to temporal compression of emissions in the life cycles of EVs, as intensive usage patterns concentrate total emissions into a shorter operational period. This phenomenon is often overlooked in conventional LCA models, which typically assume uniform usage patterns.
This oversight has significant methodological implications. Given comparable vehicle lifespans (e.g., 150,000 km), more intensive use of EVs accelerates emission accumulation during the operational phase. For instance, if an EV reaches its 150,000 km lifespan in 10 years while an ICEV takes 15 years to cover the same distance, their annual emission profiles will differ, even if EVs have per-kilometer emission advantages. Such temporal dynamics challenge conventional annual emission comparisons and necessitate user-centric analytical frameworks. Therefore, this study fills this critical gap by developing a usage-phase LCA model that explicitly incorporates the behavioral differences between EV and ICEV owners. Building on established parameters such as grid carbon intensity, charging efficiency, energy consumption rates, and thermal effects, this study proposes a novel comparative framework from the perspective of private vehicle owners. This approach enables more detailed assessments of real-world emission trade-offs between emerging and conventional vehicle technologies.
3. Methodology for Annual Carbon Emission Assessment
To enhance the transparency of our analytical framework, Figure 1 presents a methodology flowchart that succinctly summarizes the key steps and variable interactions in the annual carbon emission assessment. This visual schematic illustrates the lifecycle stages of EVs and ICEVs, parameterization of energy efficiency and grid carbon intensity, scenario design, and the implementation of an empirical case study.
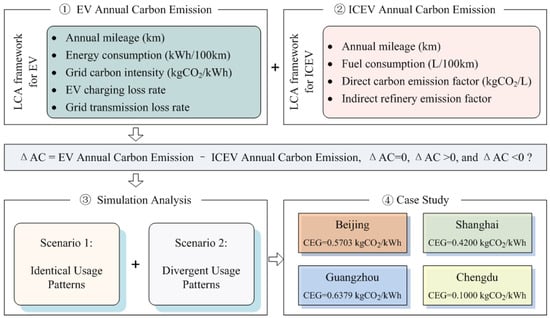
Figure 1.
Flowchart of the methodology for assessing annual carbon emissions of EVs and ICEVs.
3.1. EV Annual Carbon Emission Model
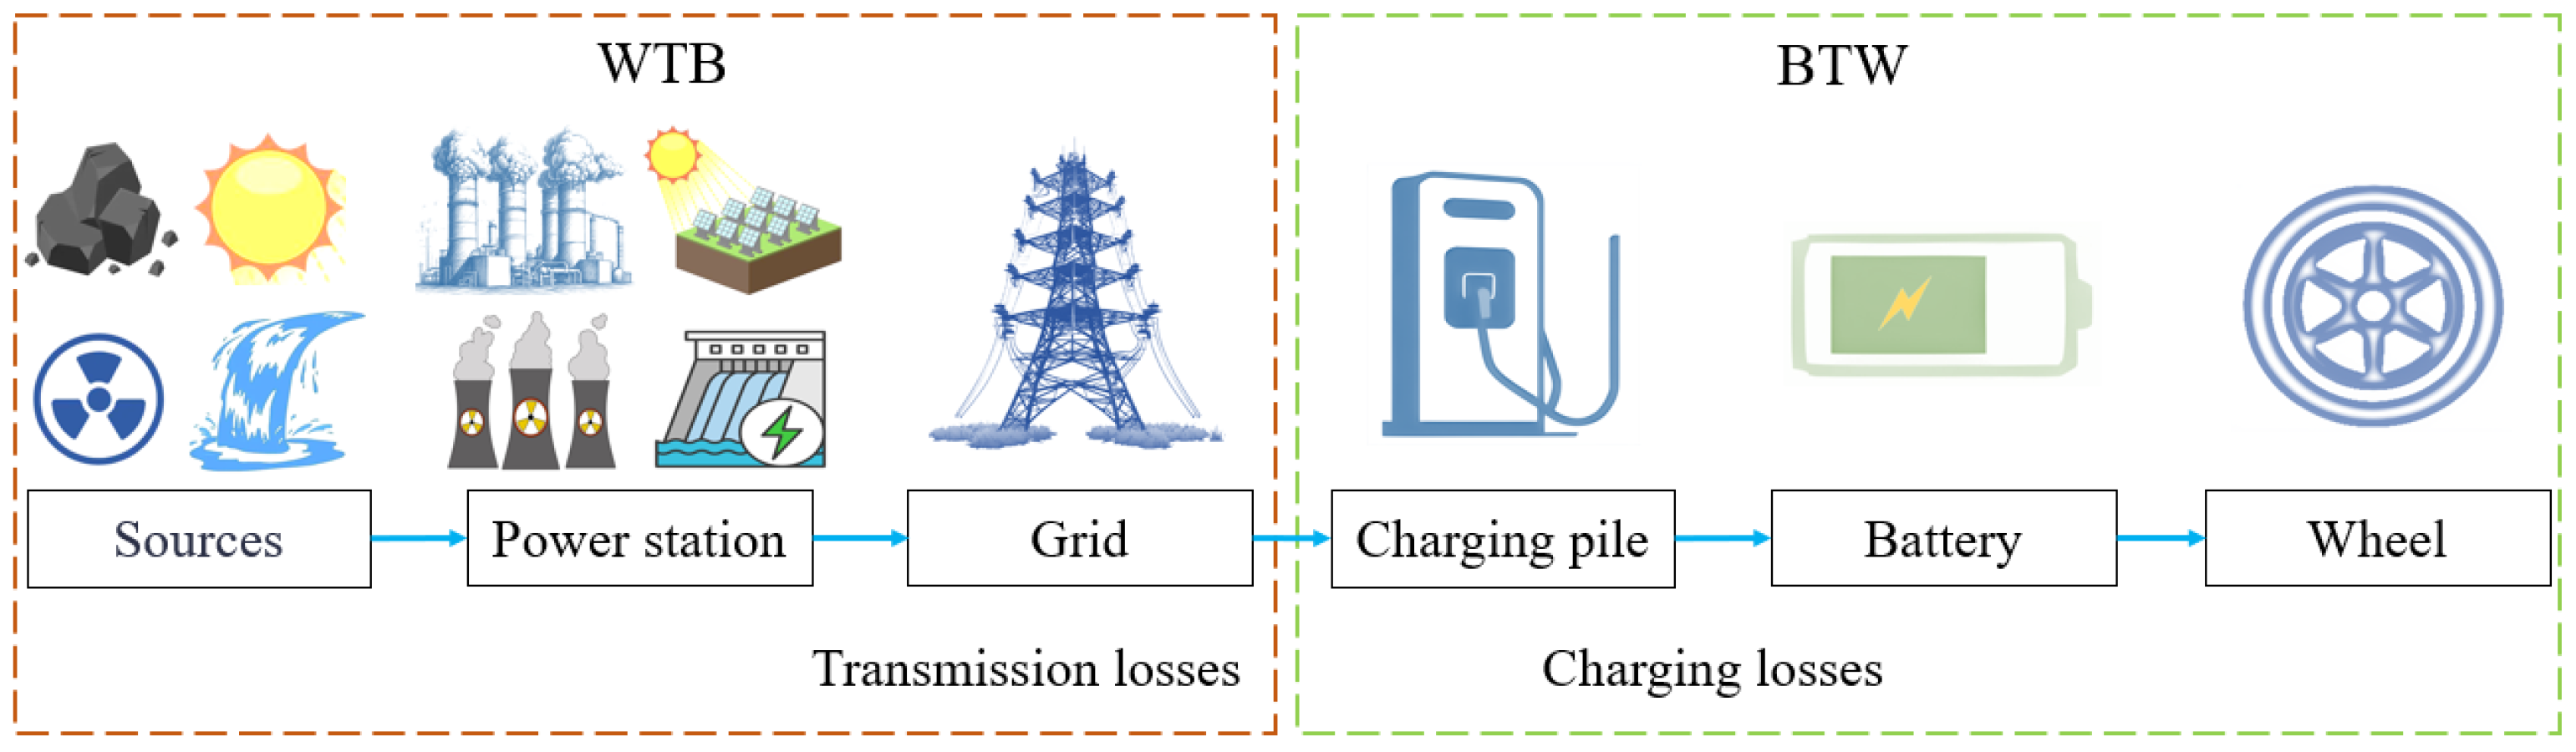
Based on the life cycle assessment (LCA) framework, this study focuses on the operational phase of vehicles and develops a model to quantify the annual carbon emissions of privately owned EVs. As illustrated in Figure 2, the EV emission lifecycle comprises two phases: Well-to-Battery (WTB) and Battery-to-Wheels (BTW). Since the adoption of EVs shifts operational-phase emissions to the electricity generation stage, the carbon footprint of EVs is inherently linked to the grid’s carbon intensity. Importantly, grid carbon intensity encompasses total greenhouse gas emissions from power generation to end-user delivery, including inherent energy losses during transmission and distribution. For example, if an EV consumes 1 kWh of electricity, the actual amount generated at power plants is higher due to efficiency losses in the system. It should be noted that this model excludes upstream emissions from raw material extraction due to data and methodological limitations.
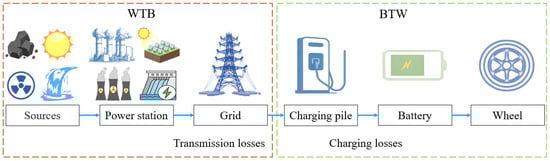
Figure 2.
LCA framework for EVs in the operational phase.
Then, based on the above LCA framework, the annual carbon emissions for EVs (ACEV, kgCO2/year) are calculated as
where AMEV is annual mileage (km), ECEV is the energy consumption metric for EVs (kWh/100 km). CEG represents the power grid’s carbon intensity (kgCO2/kWh). ηcharge denotes the EV charging loss rate. A divergence typically exists between the electrical energy supplied by the power grid and the actual energy input into EV batteries [40,41], which can be attributed to multiple factors, such as power conversion losses, line resistance losses, and battery inefficiencies. Notably, in this study, ηcharge is a comprehensive metric encapsulating efficiency loss related to power conversion, line resistance, and battery charging/discharging processes. In addition, ηtrans represents the grid transmission loss rate, which lacks a fixed value and varies with factors such as voltage levels and transmission line characteristics [42,43].
3.2. ICEV Annual Carbon Emission Model
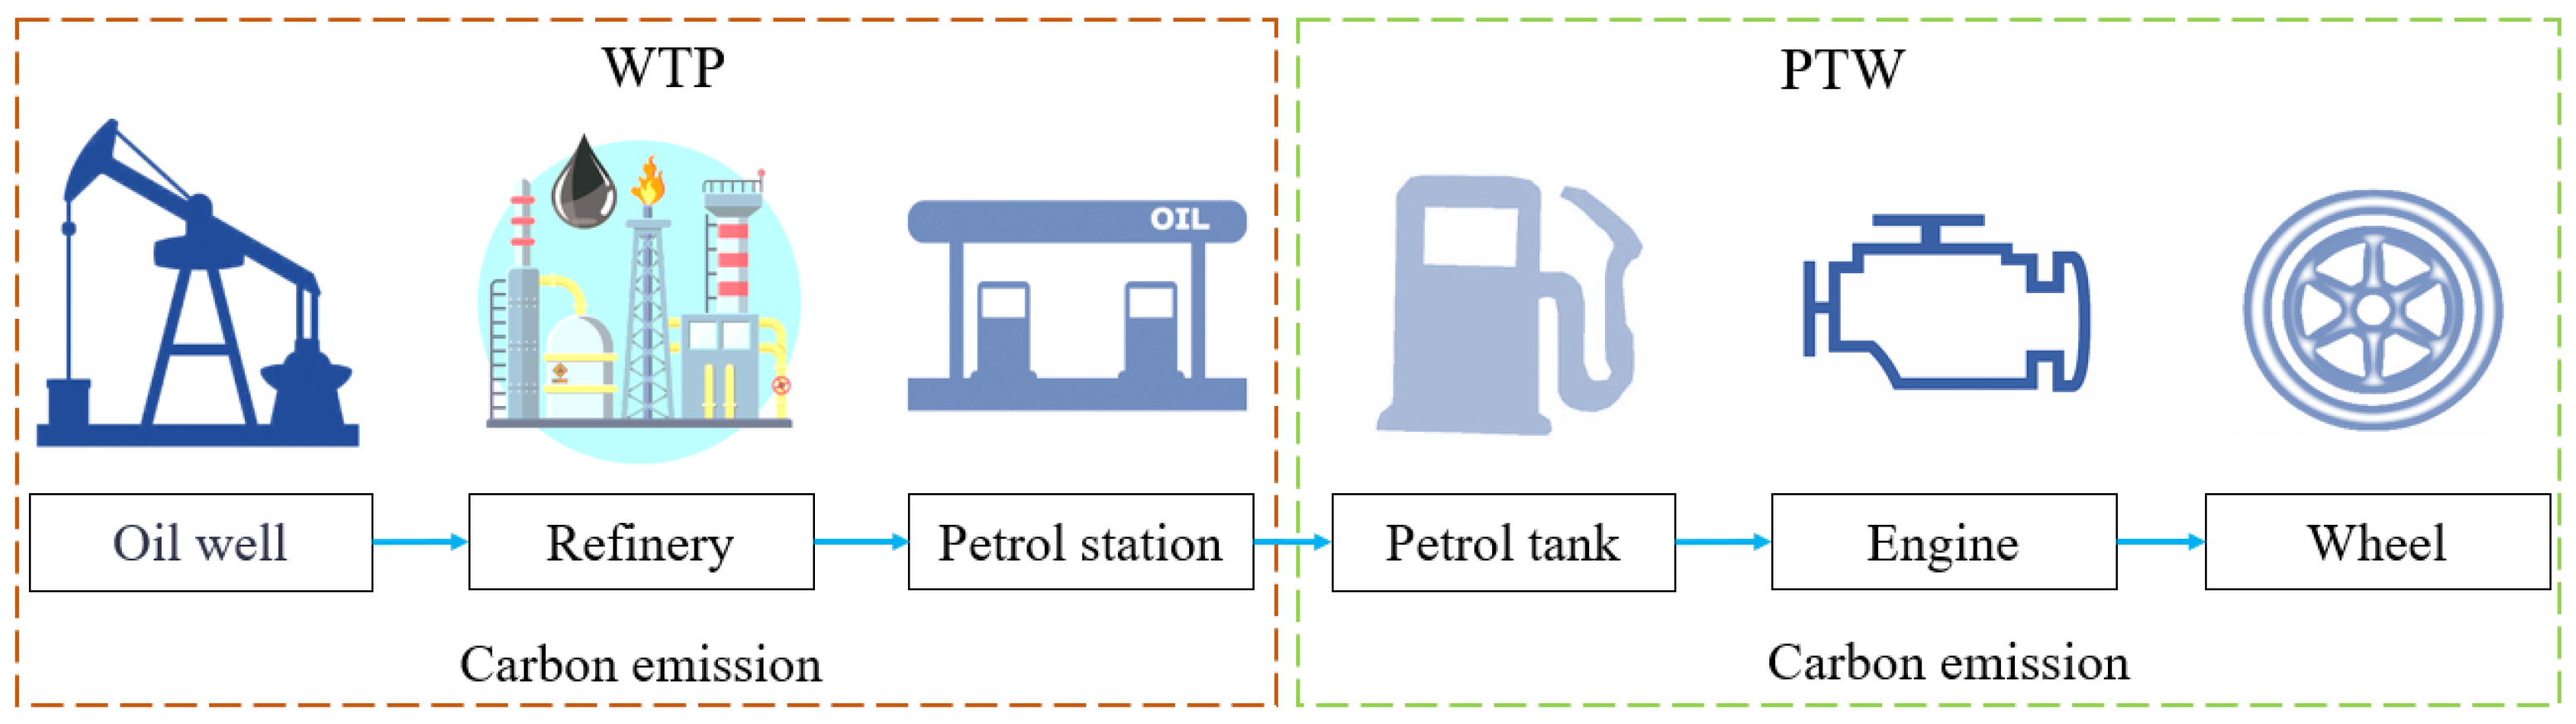
For ICEVs, carbon emissions during the operational phase are evaluated using the following LCA framework (Figure 3), which encompasses the Well-to-Pump (WTP) and Pump-to-Wheels (PTW) phases. ICEV carbon emissions arise from direct tailpipe emissions and indirect refinery processes. Analogously, upstream emissions (e.g., crude oil extraction) are excluded due to data limitations.
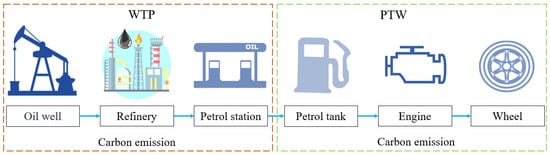
Figure 3.
LCA framework for ICEVs in the operational phase.
Then, based on the above LCA framework, the annual carbon emissions for ICEVs (ACICEV, kgCO2/year) are expressed as
where AMICEV is annual mileage (km), FCICEV is the fuel consumption metric for ICEVs (L/100 km). DCE denotes direct carbon emission factor (2.225 kgCO2/L, derived from IPCC (2006) guidelines [44]). ICE represents the indirect refinery emission factor. As specified in the IPCC (2006) guidelines, ICE includes emissions from crude oil transportation, various refining processes (e.g., distillation, catalytic cracking, hydrotreating) [44], and energy consumption (e.g., electricity, steam). For refineries, the indirect emissions per liter of gasoline produced typically range from 0.3 to 0.6 kgCO2/L, depending on refining process efficiency and energy mix composition. For analytical consistency, this study uses a midpoint value of 0.45 kgCO2/L as the basis for subsequent calculations.
3.3. Comparative Analysis of Annual Emissions
The disparity in annual carbon emissions (ΔAC) between EVs and ICEVs is defined as
In this equation, a positive ΔAC indicates higher annual carbon emissions for EVs, while a negative value signifies lower emissions for EVs. The outcome hinges on variables including the following: (1) usage patterns (AMEV and AMICEV); (2) energy consumption metrics (ECEV and FCICEV); (3) grid carbon intensity (CEG); and (4) efficiency factors (ηcharge and ηtrans).
Notably, energy consumption metrics ECEV and FCICEV are influenced by driving habits, road conditions, vehicle speed, ambient temperature, and vehicle type [45,46,47,48]. To reflect real-world variability, we assume the following: (1) ECEV ranges from 10–30 kWh/100 km (encompassing A0-class sedans to C-class SUVs), and (2) FCICEV ranges from 5–20 L/100 km (corresponding to compact cars to large SUVs). This range aligns with empirical data from [19,49,50].
Additionally, grid carbon intensity (CEG) depends on energy mix and power generation technology [22,26,28]. Specifically, fossil-fuel grids have CEG ≈ 1 kgCO2/kWh [51,52], while clean-energy grids approach CEG ≈ 0 kgCO2/kWh. For comparative analysis, we use a CEG range of 0–1 kgCO2/kWh (in 0.1 kgCO2/kWh increments).
Finally, efficiency factors include ηcharge (charging losses, 5–15% [41,53]), and ηtrans (transmission losses, 5–8% [52]). These ranges reflect real-world efficiency variations in charging infrastructure and power grids.
3.3.1. Scenario 1: Identical Usage Patterns Between EV and ICEV Owners
In this scenario, it is assumed that EV owners and ICEV owners have identical annual mileages (i.e., AMEV = AMICEV = AM), meaning the daily vehicle usage patterns of EV owners are consistent with those of ICEV owners. Under these conditions, the annual carbon emission disparity (ΔAC) between EVs and ICEVs can be expressed as
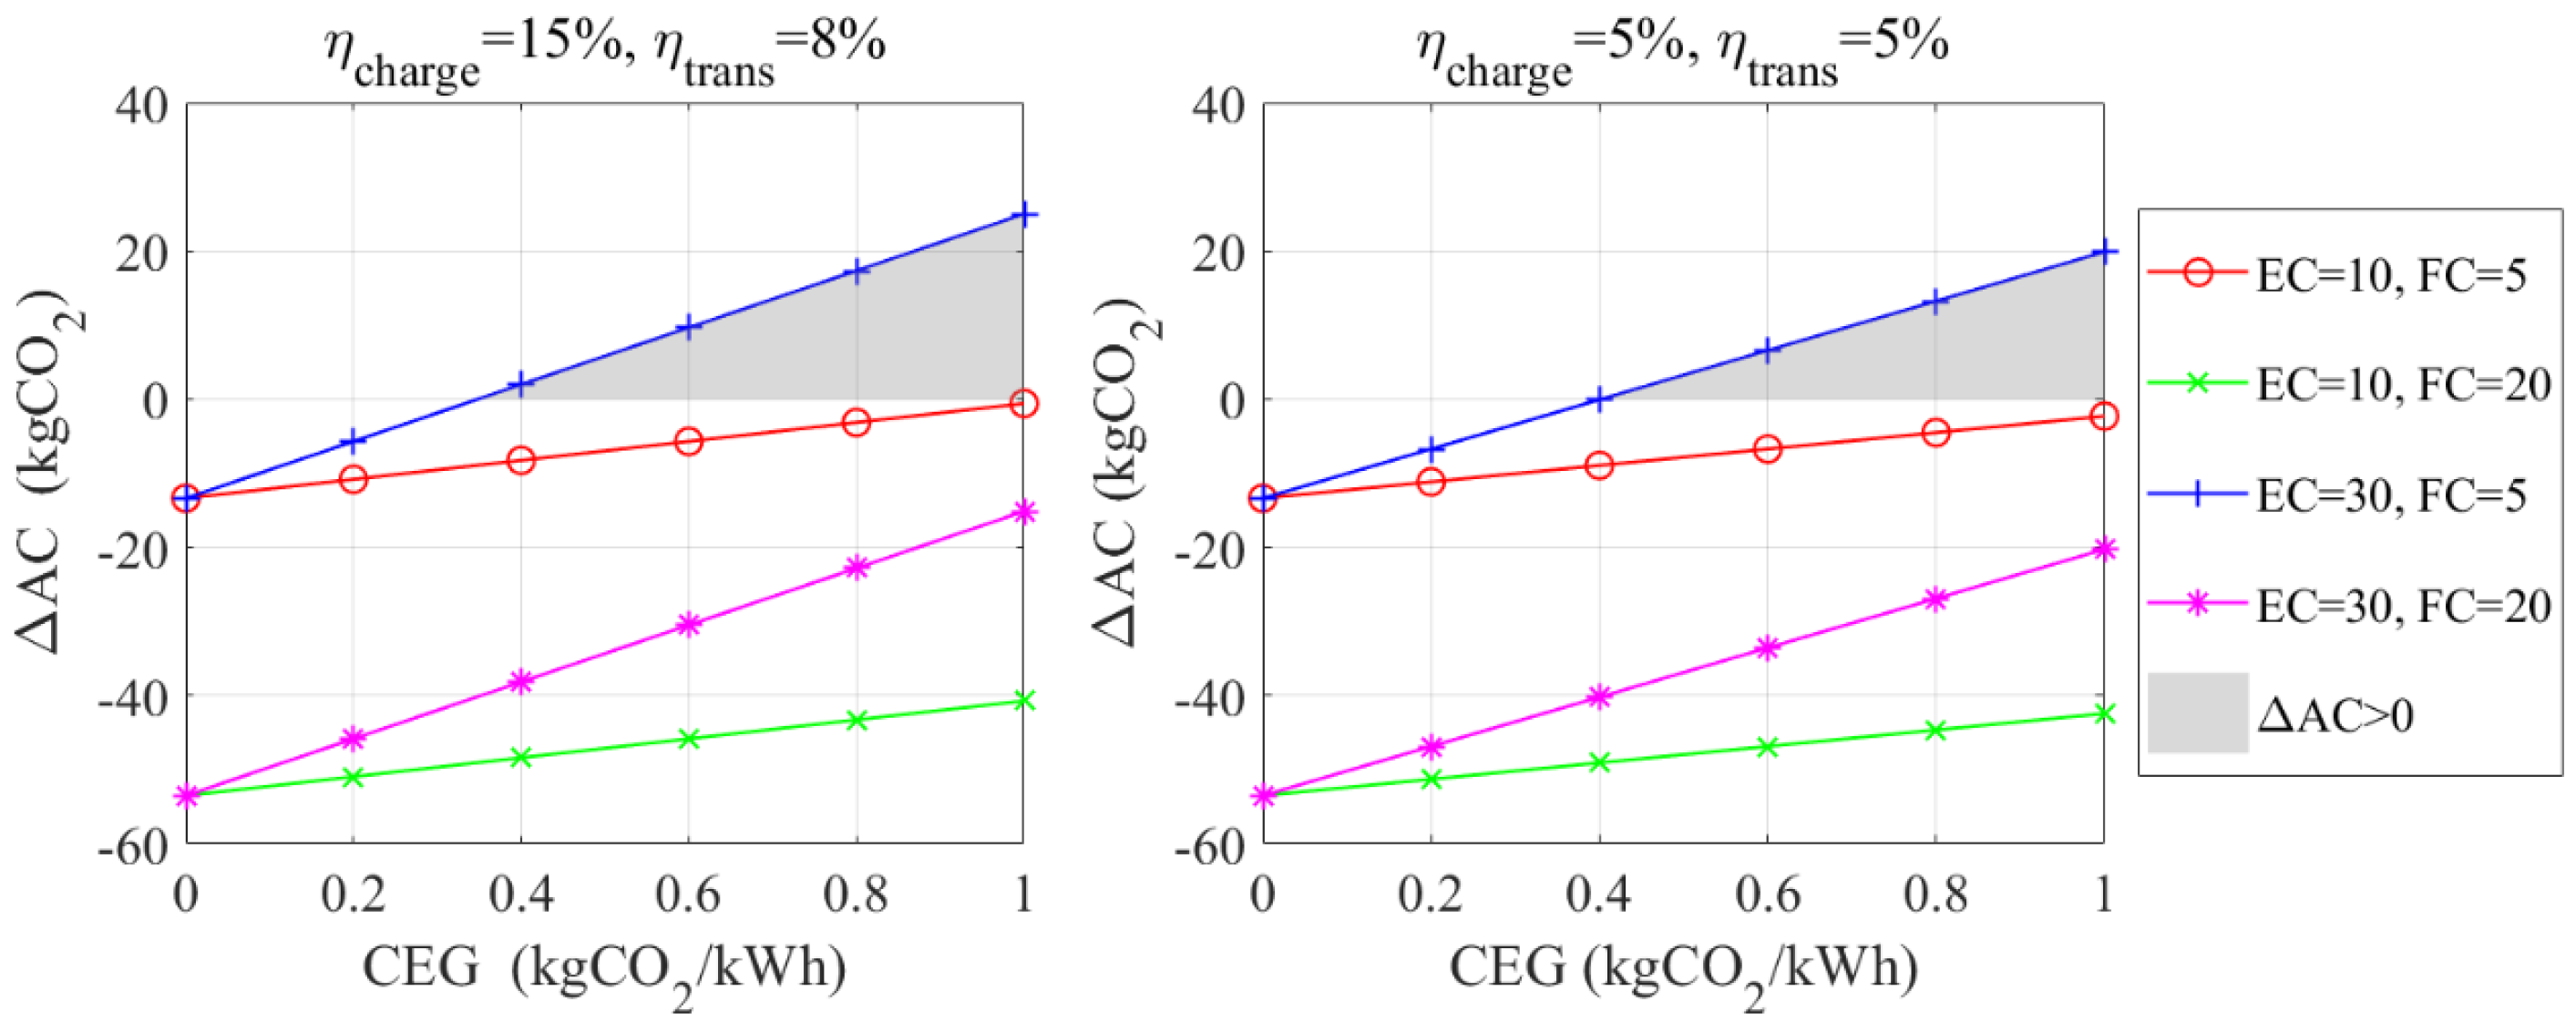
Here, regarding charging losses (ηcharge) and transmission losses (ηtrans), two extreme scenarios are analyzed: maximum losses (ηcharge = 15%, ηtrans = 8%) and minimum losses (ηcharge = 5%, ηtrans = 5%). It can be seen, when AMEV equals AMICEV, that the sign of ΔAC is determined by the specific values of ECEV, FCICEV, and CEG. To investigate how these parameters influence ΔAC, a simulation analysis was conducted, with results presented in Figure 4.
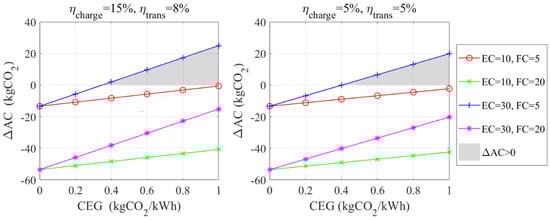
Figure 4.
Comparative carbon emissions per 100 km between EVs and ICEVs under identical annual mileage: sensitivity analysis of energy consumption and grid carbon intensity.
Figure 4 shows that EVs’ 100-km emissions are lower than those of ICEVs under most conditions, even at high grid carbon intensity (CEG). For example, at CEG = 0.8 kgCO2/kWh—with EV energy consumption (ECEV) = 16.0 kWh/100 km and ICEV fuel consumption (FCICEV) = 7.5 L/100 km [50]—EVs emit 16.37 kgCO2/100 km versus 20.06 kgCO2/100 km for ICEVs, even under maximum loss conditions (ηcharge = 15%, ηtrans = 8%). This demonstrates the substantial emission reduction potential of EVs and supports their widespread adoption. However, emission reversals occur under extreme scenarios: high-energy-consuming EVs may emit more than low-fuel-consuming ICEVs at high CEG (shaded area in Figure 4). For instance, at CEG = 0.8 kgCO2/kWh, ECEV = 20.0 kWh/100 km, and FCICEV = 6.5 L/100 km, EVs emit 17.73 kgCO2/100 km versus 17.39 kgCO2/100 km for ICEVs—even under minimum loss conditions (ηcharge = 5%, ηtrans = 5%). While such cases are rare in practice, they highlight that EV advantages may diminish under specific conditions.
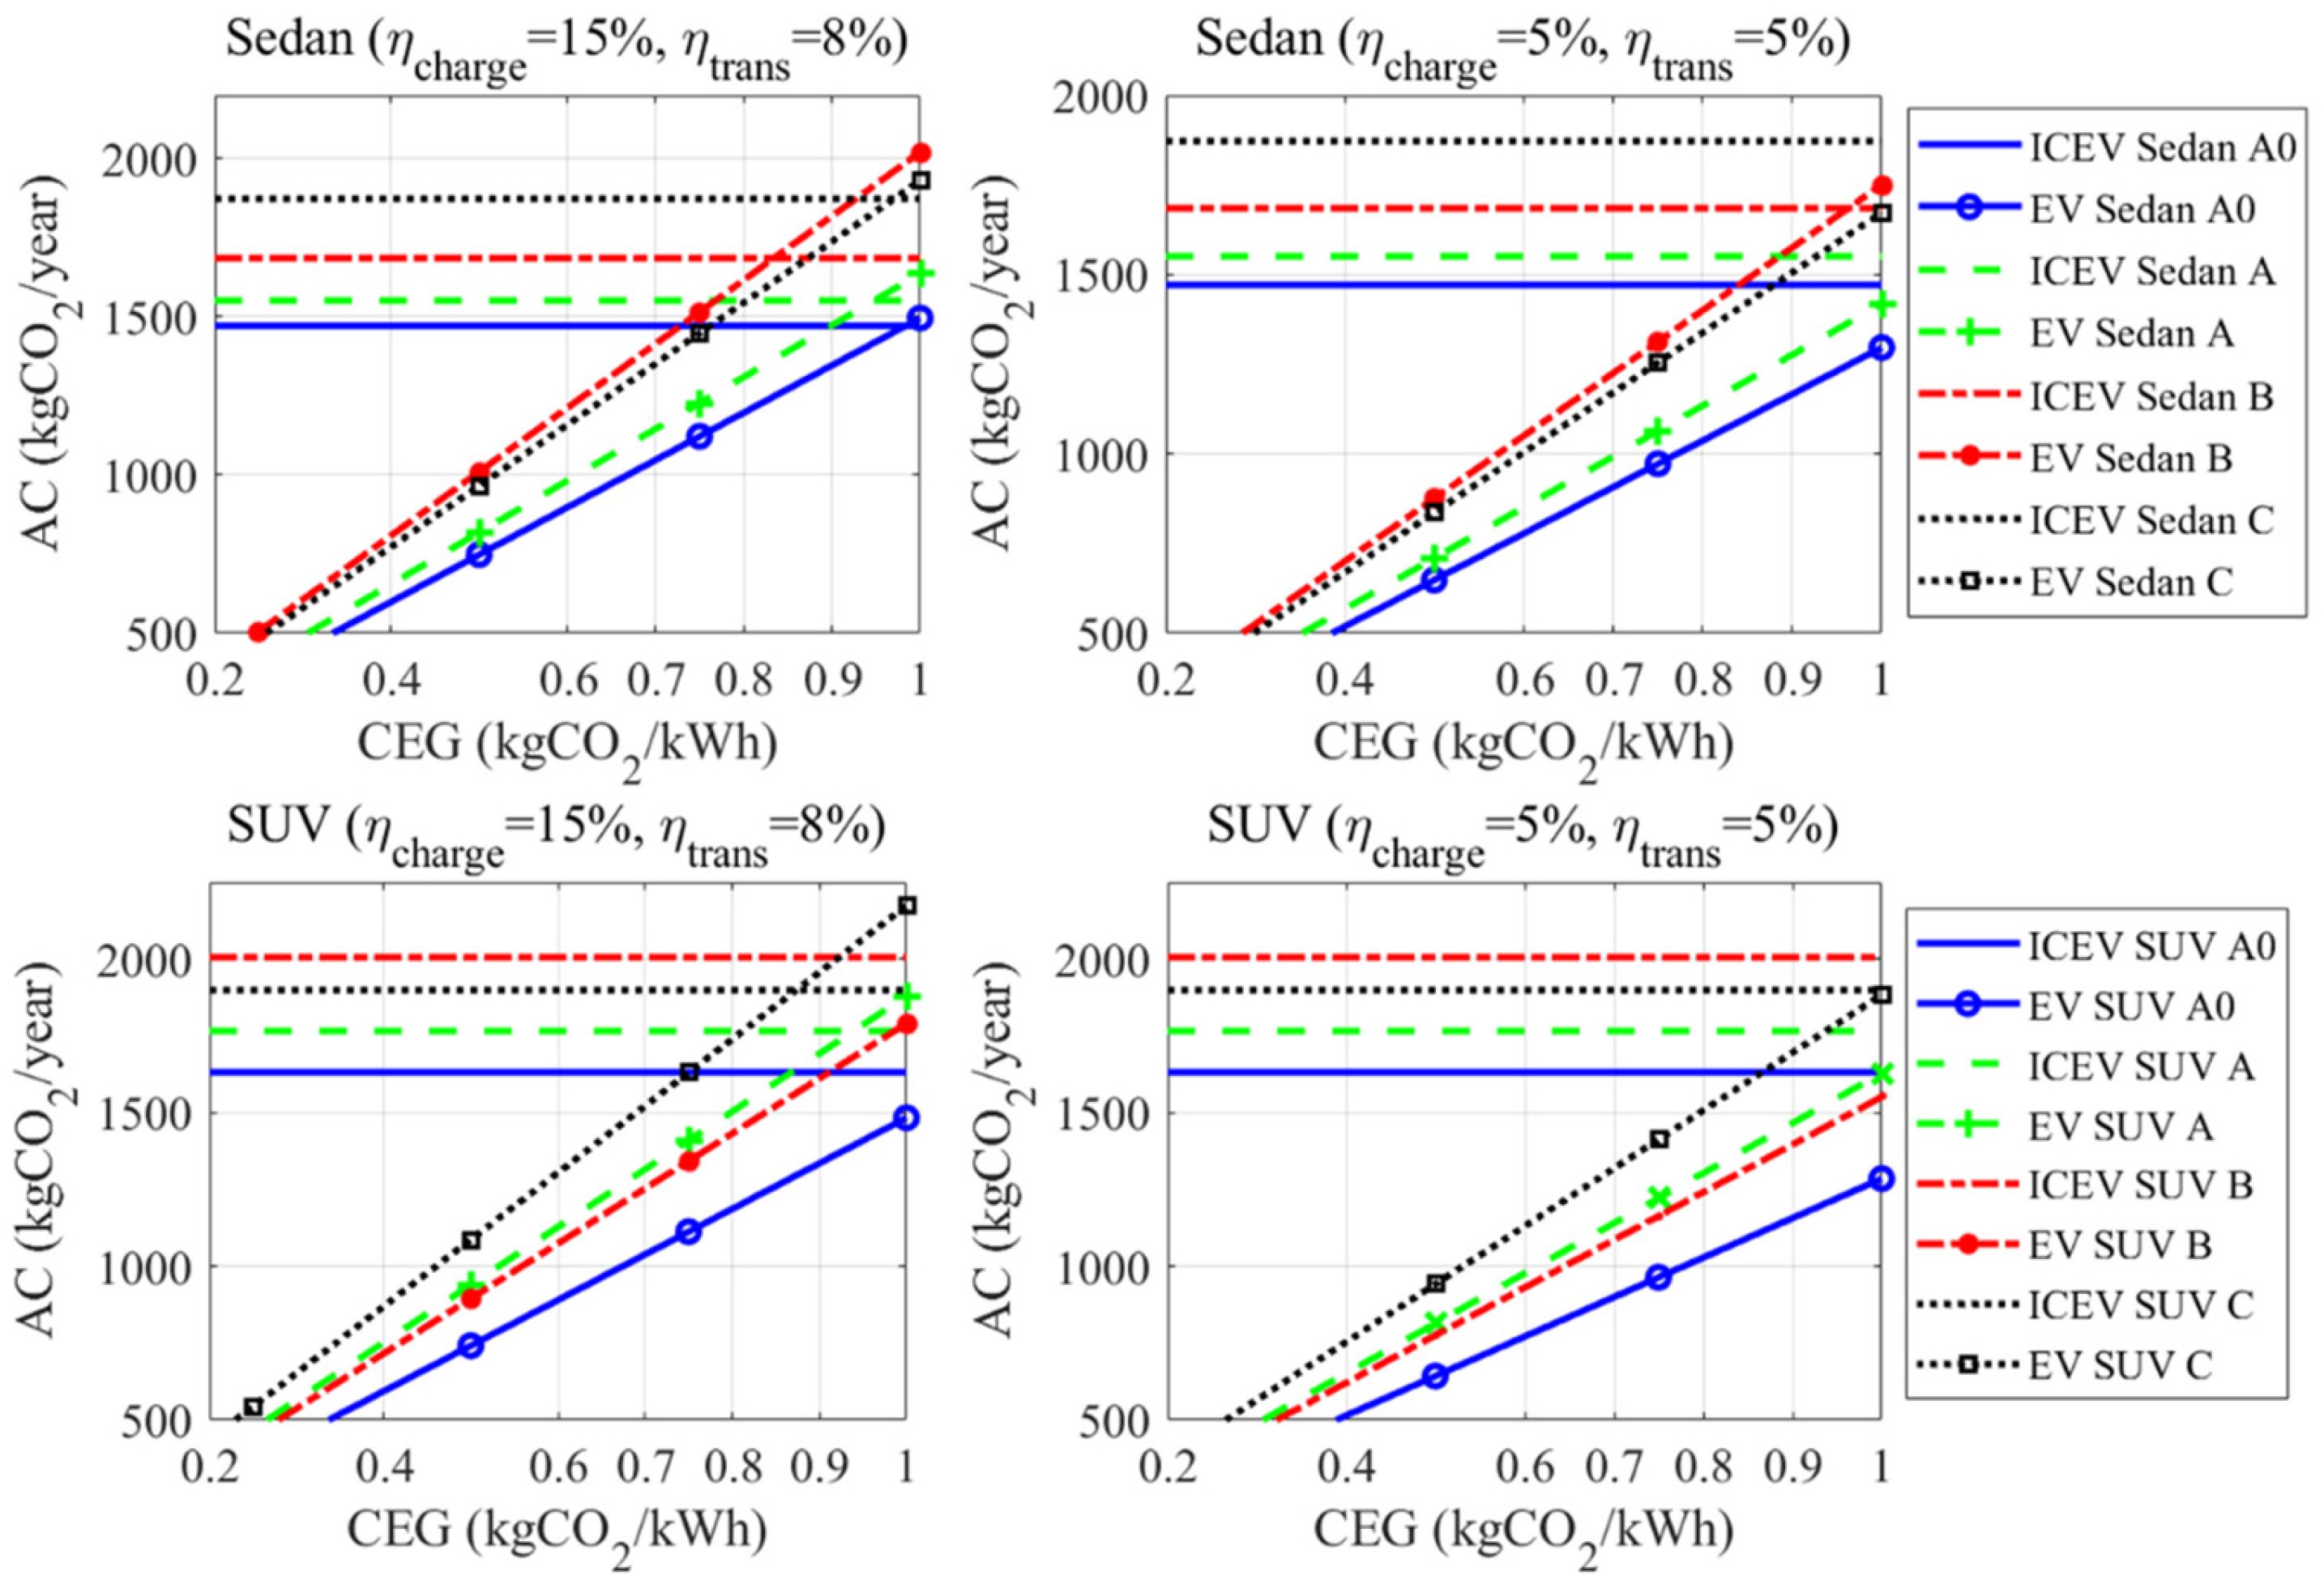
Energy consumption metrics (ECEV, FCICEV) significantly influence the EV-ICEV emission gap. For example, increasing ECEV from 10 to 30 kWh/100 km and FCICEV from 5 to 20 L/100 km widens the gap across all CEG levels. To quantify the combined effects of ECEV, FCICEV, and CEG on ΔAC and assess vehicle class impacts, we analyzed data from Zhang et al. [18] (Table 1), assuming an annual mileage of 10,000 km for both vehicle types. Results in Figure 5 show that under maximum loss conditions (ηcharge = 15%, ηcharge = 8%), EVs outperform ICEVs across all classes (Sedan/SUV) when CEG < 0.7 kgCO2/kWh. Under minimum loss conditions (ηcharge = 5%, ηtrans = 5%), EVs remain cleaner for all classes at CEG < 0.8 kgCO2/kWh, confirming their emission advantages in low-carbon grids. However, higher CEG triggers emission reversals in specific models: (1) B-class EV sedans exceed ICEVs at CEG = 0.9 kgCO2/kWh, and (2) C-class EVs (sedans/SUVs) exceed ICEVs at CEG = 1.0 kgCO2/kWh. Notably, A0-class EV SUVs retain advantages at high CEG, likely due to low ECEV and CEG insensitivity.

Table 1.
The energy consumption metrics of EVs and ICEVs, as reported in Zhang et al. [18].
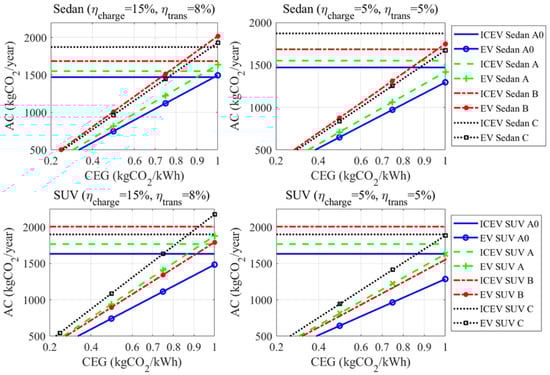
Figure 5.
Case study of carbon emissions per 100 km across vehicle classes under identical usage patterns: impact of grid carbon intensity and charging efficiency.
Thus, EV promotion strategies should be tailored to vehicle characteristics and regional grid carbon intensity. Small, low-energy-consuming EVs may offer greater value in high-carbon grid areas. Policymakers should consider grid carbon intensity and vehicle model differences when formulating EV policies, vigorously promoting diverse EV types in low CEG areas, prioritizing small efficient EVs in high CEG areas, and increasing investments in grid decarbonization to enhance EV emission benefits. For consumers in high CEG areas, choosing low-energy-consuming EV models is recommended to minimize personal travel-related carbon emissions.
3.3.2. Scenario 2: Divergent Usage Patterns Among EV and ICEV Owners
The preceding analysis assumes identical vehicle usage patterns for EV and ICEV owners. However, as discussed in Section 2, EVs’ operational cost advantages may lead to higher utilization rates [12,37]. Therefore, this scenario considers divergent annual mileage, where EV owners’ annual mileage is x times that of ICEV owners (i.e., AMEV = x·AMICEV, x ≥ 1). Consequently, the annual carbon emission difference (ΔAC) between EVs and ICEVs is formulated as
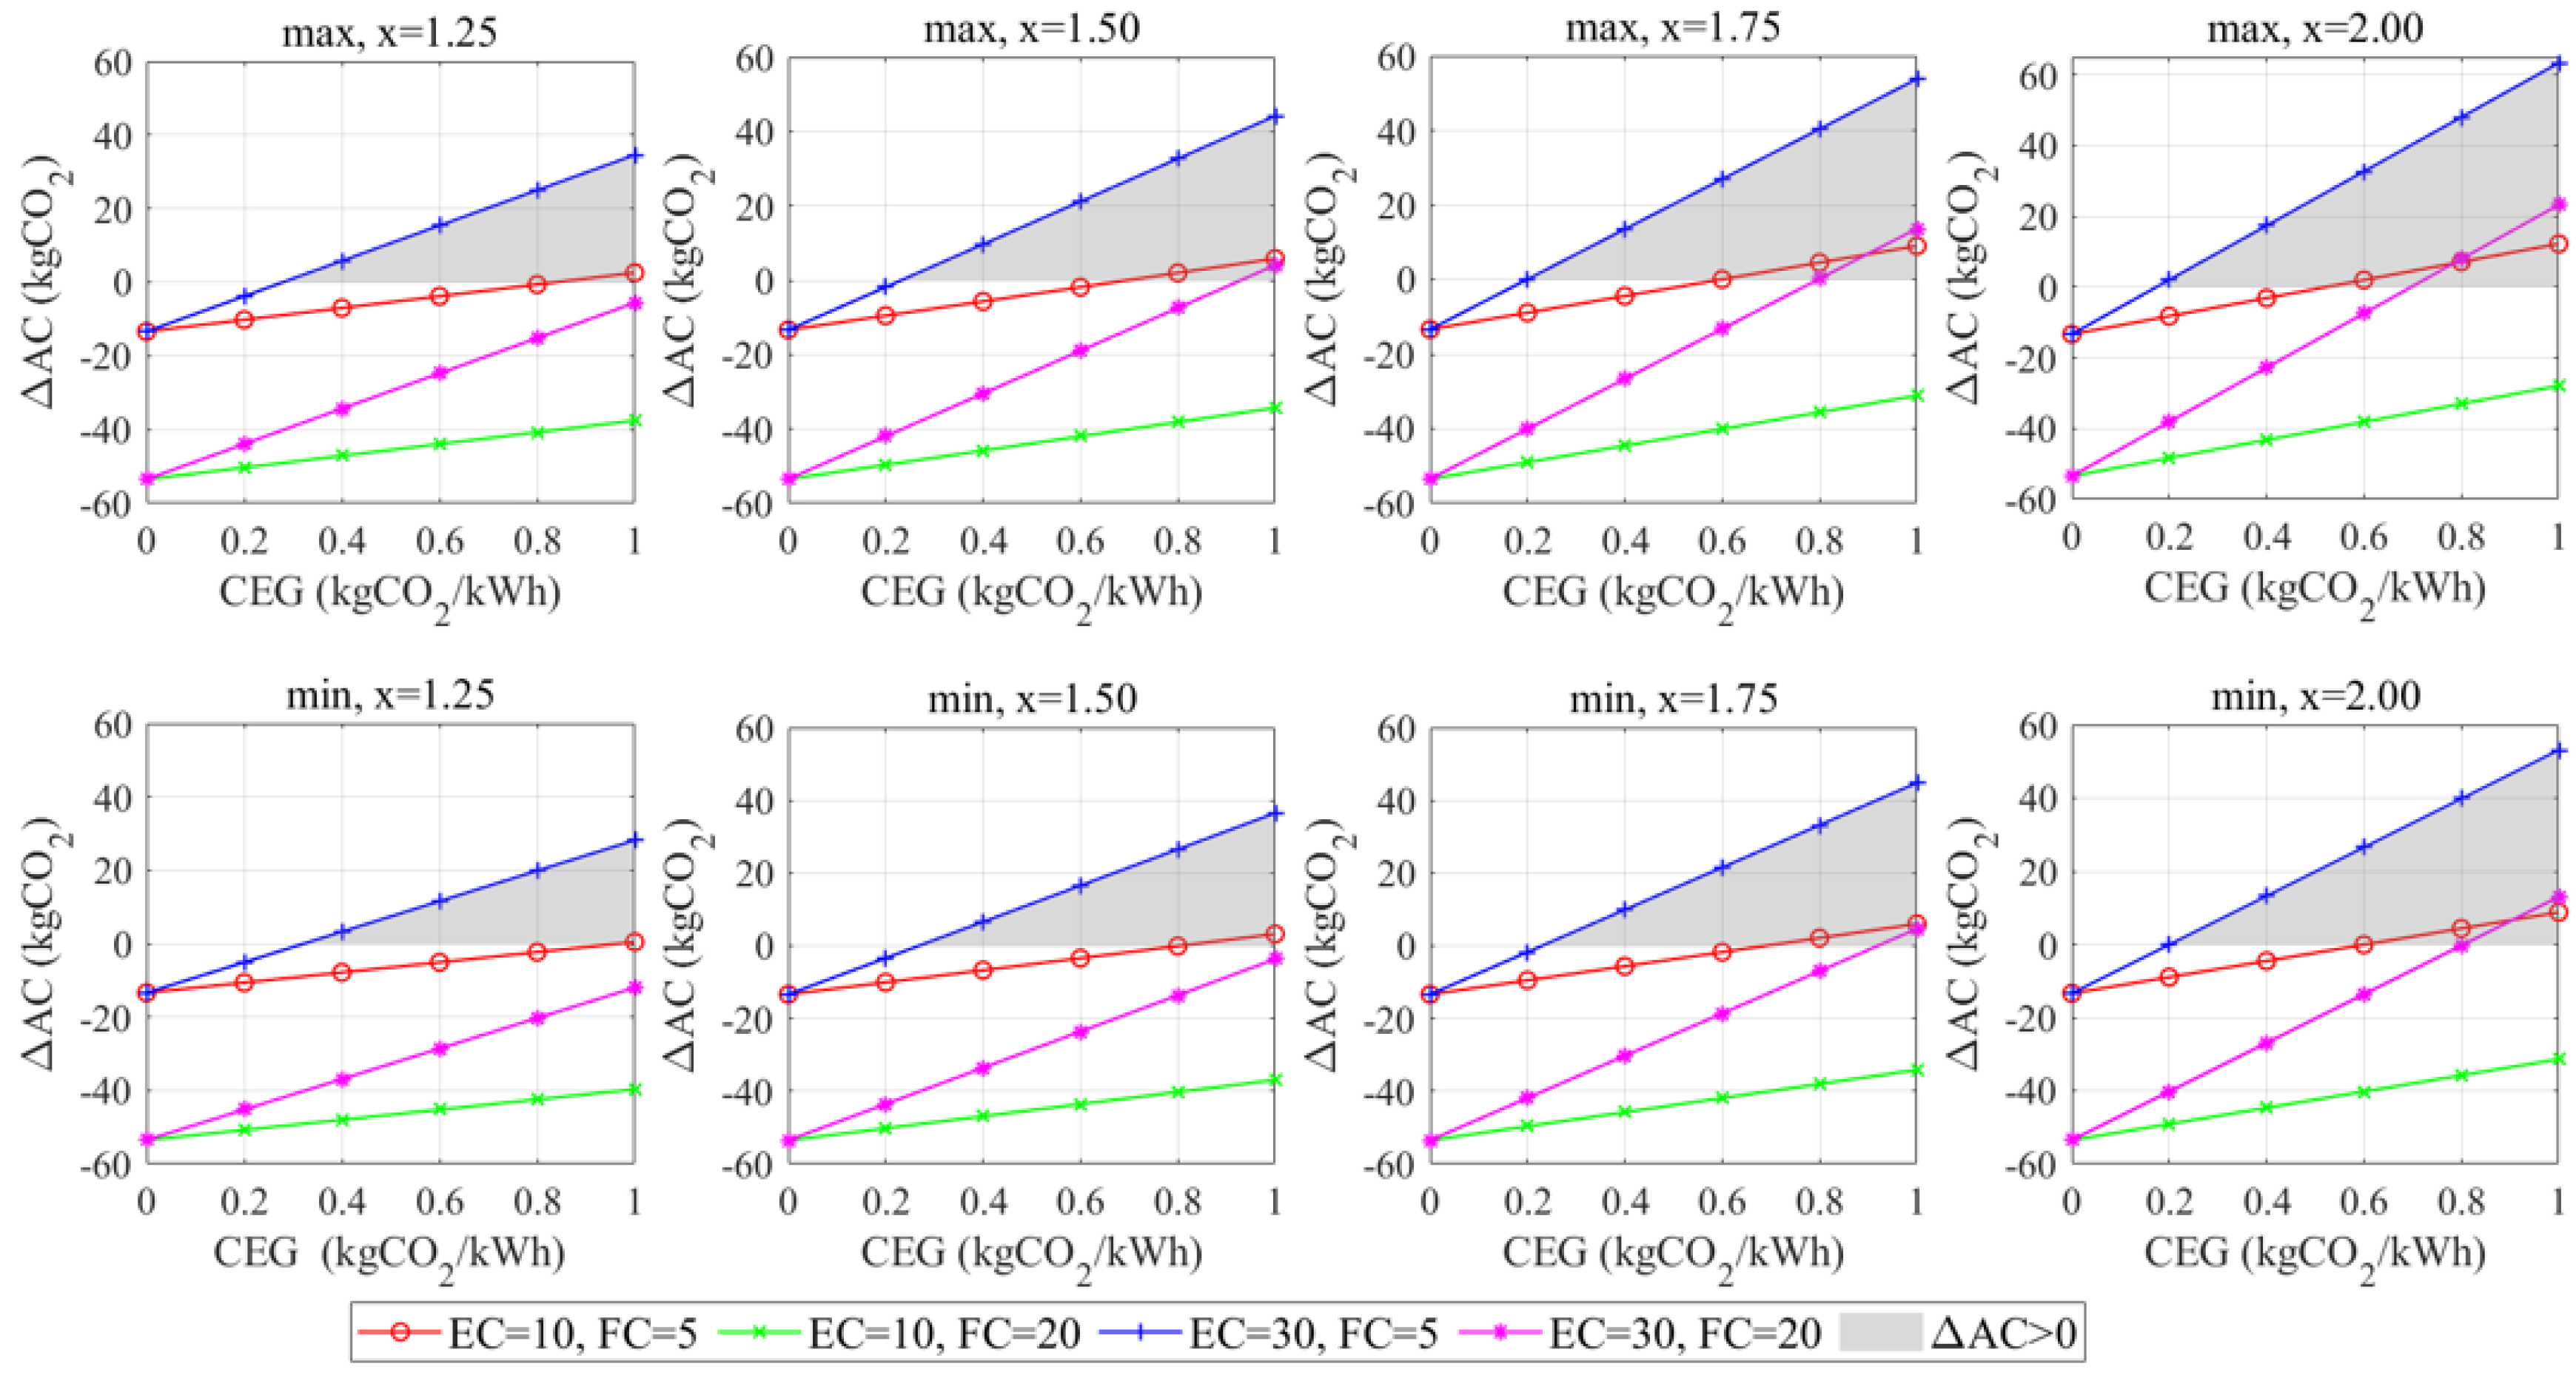
When AMEV ≠ AMICEV, the sign of ΔAC depends on x, ECEV, FCICEV, and CEG. To investigate how these parameters influence ΔAC, a simulation analysis was conducted with x set to 1.25, 1.5, 1.75, and 2. Notably, the mileage multiplier (x) is capped at 2, consistent with empirical upper limits of EV usage intensity in China [12]. While higher multipliers (e.g., x > 2) may apply to commercial fleets, they are excluded here to focus on private vehicle dynamics. This methodological constraint ensures relevance to policymakers addressing private EV adoption. Other parameters remain consistent with Scenario 1. Figure 6 illustrates ΔAC trends with varying CEG under different x values.
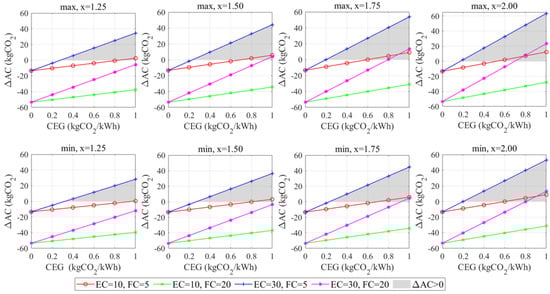
Figure 6.
Annual carbon emission disparities between EVs and ICEVs under divergent usage patterns: effect of mileage multiplier (x).
Figure 6 shows that at low grid carbon intensity (CEG), EVs emit less than ICEVs, resulting in a negative carbon emission difference (ΔAC). As CEG increases, ΔAC rises and crosses zero for certain vehicle types, indicating that EV emissions exceed those of ICEVs. The mileage multiplier (x), where x = 1 represents equal annual mileage to ICEVs, also influences ΔAC: higher x values shift the curves upward, favoring ICEVs. For example, at x = 1.25 (1.25 times the ICEV baseline), EVs maintain advantages in low CEG regions, but at x = 2 (double the ICEV mileage), this advantage diminishes even in low CEG and disappears entirely in high CEG. Additionally, Figure 6 demonstrates that EV energy consumption (ECEV) and ICEV fuel consumption (FCICEV) modulate ΔAC. For instance, low-energy EVs (ECEV = 10 kWh/100 km) paired with efficient ICEVs (FCICEV = 5 L/100 km) exhibit significantly different ΔAC trends compared to high-energy combinations (ECEV = 30 kWh/100 km, FCICEV = 20 L/100 km), underscoring the critical role of energy efficiency. Data for this analysis are derived from Zhang et al. [18] (Table 1), with charging and transmission losses fixed at 5% to isolate the effects of CEG and mileage.
Figure 7 reveals that below CEG = 0.4 kgCO2/kWh, all A0-, A-, B-, and C-class EV sedans and SUVs outperform ICEVs—even at x = 2 (double the ICEV mileage)—with their emission curves consistently below ICEV baselines. However, in high CEG regions (0.6–1.0 kgCO2/kWh), ΔAC widens with increasing x. For A-class SUVs, x = 1.25 preserves EV advantages in low CEG, but x = 2 leads to steep emission increases and premature crossings of the ICEV—particularly for high-energy EVs. These findings highlight grid CEG and mileage patterns as key determinants of EV-ICEV emission differences. Policymakers should (1) cautiously promote high-energy EVs in high-CEG regions while incentivizing low-energy models; and (2) encourage mileage optimization among EV owners to maximize emission reductions, particularly in carbon-intensive grids.
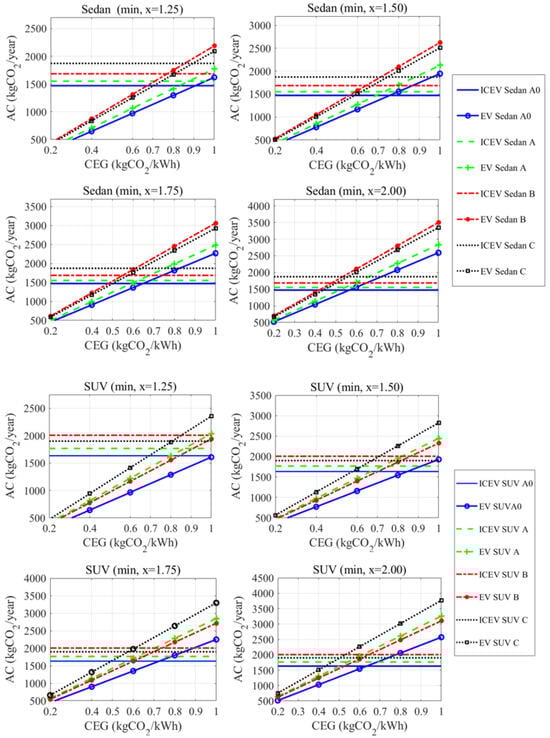
Figure 7.
Case study of carbon emissions per 100 km across vehicle classes under divergent usage patterns: impact of grid carbon intensity and charging efficiency.
4. Case Study
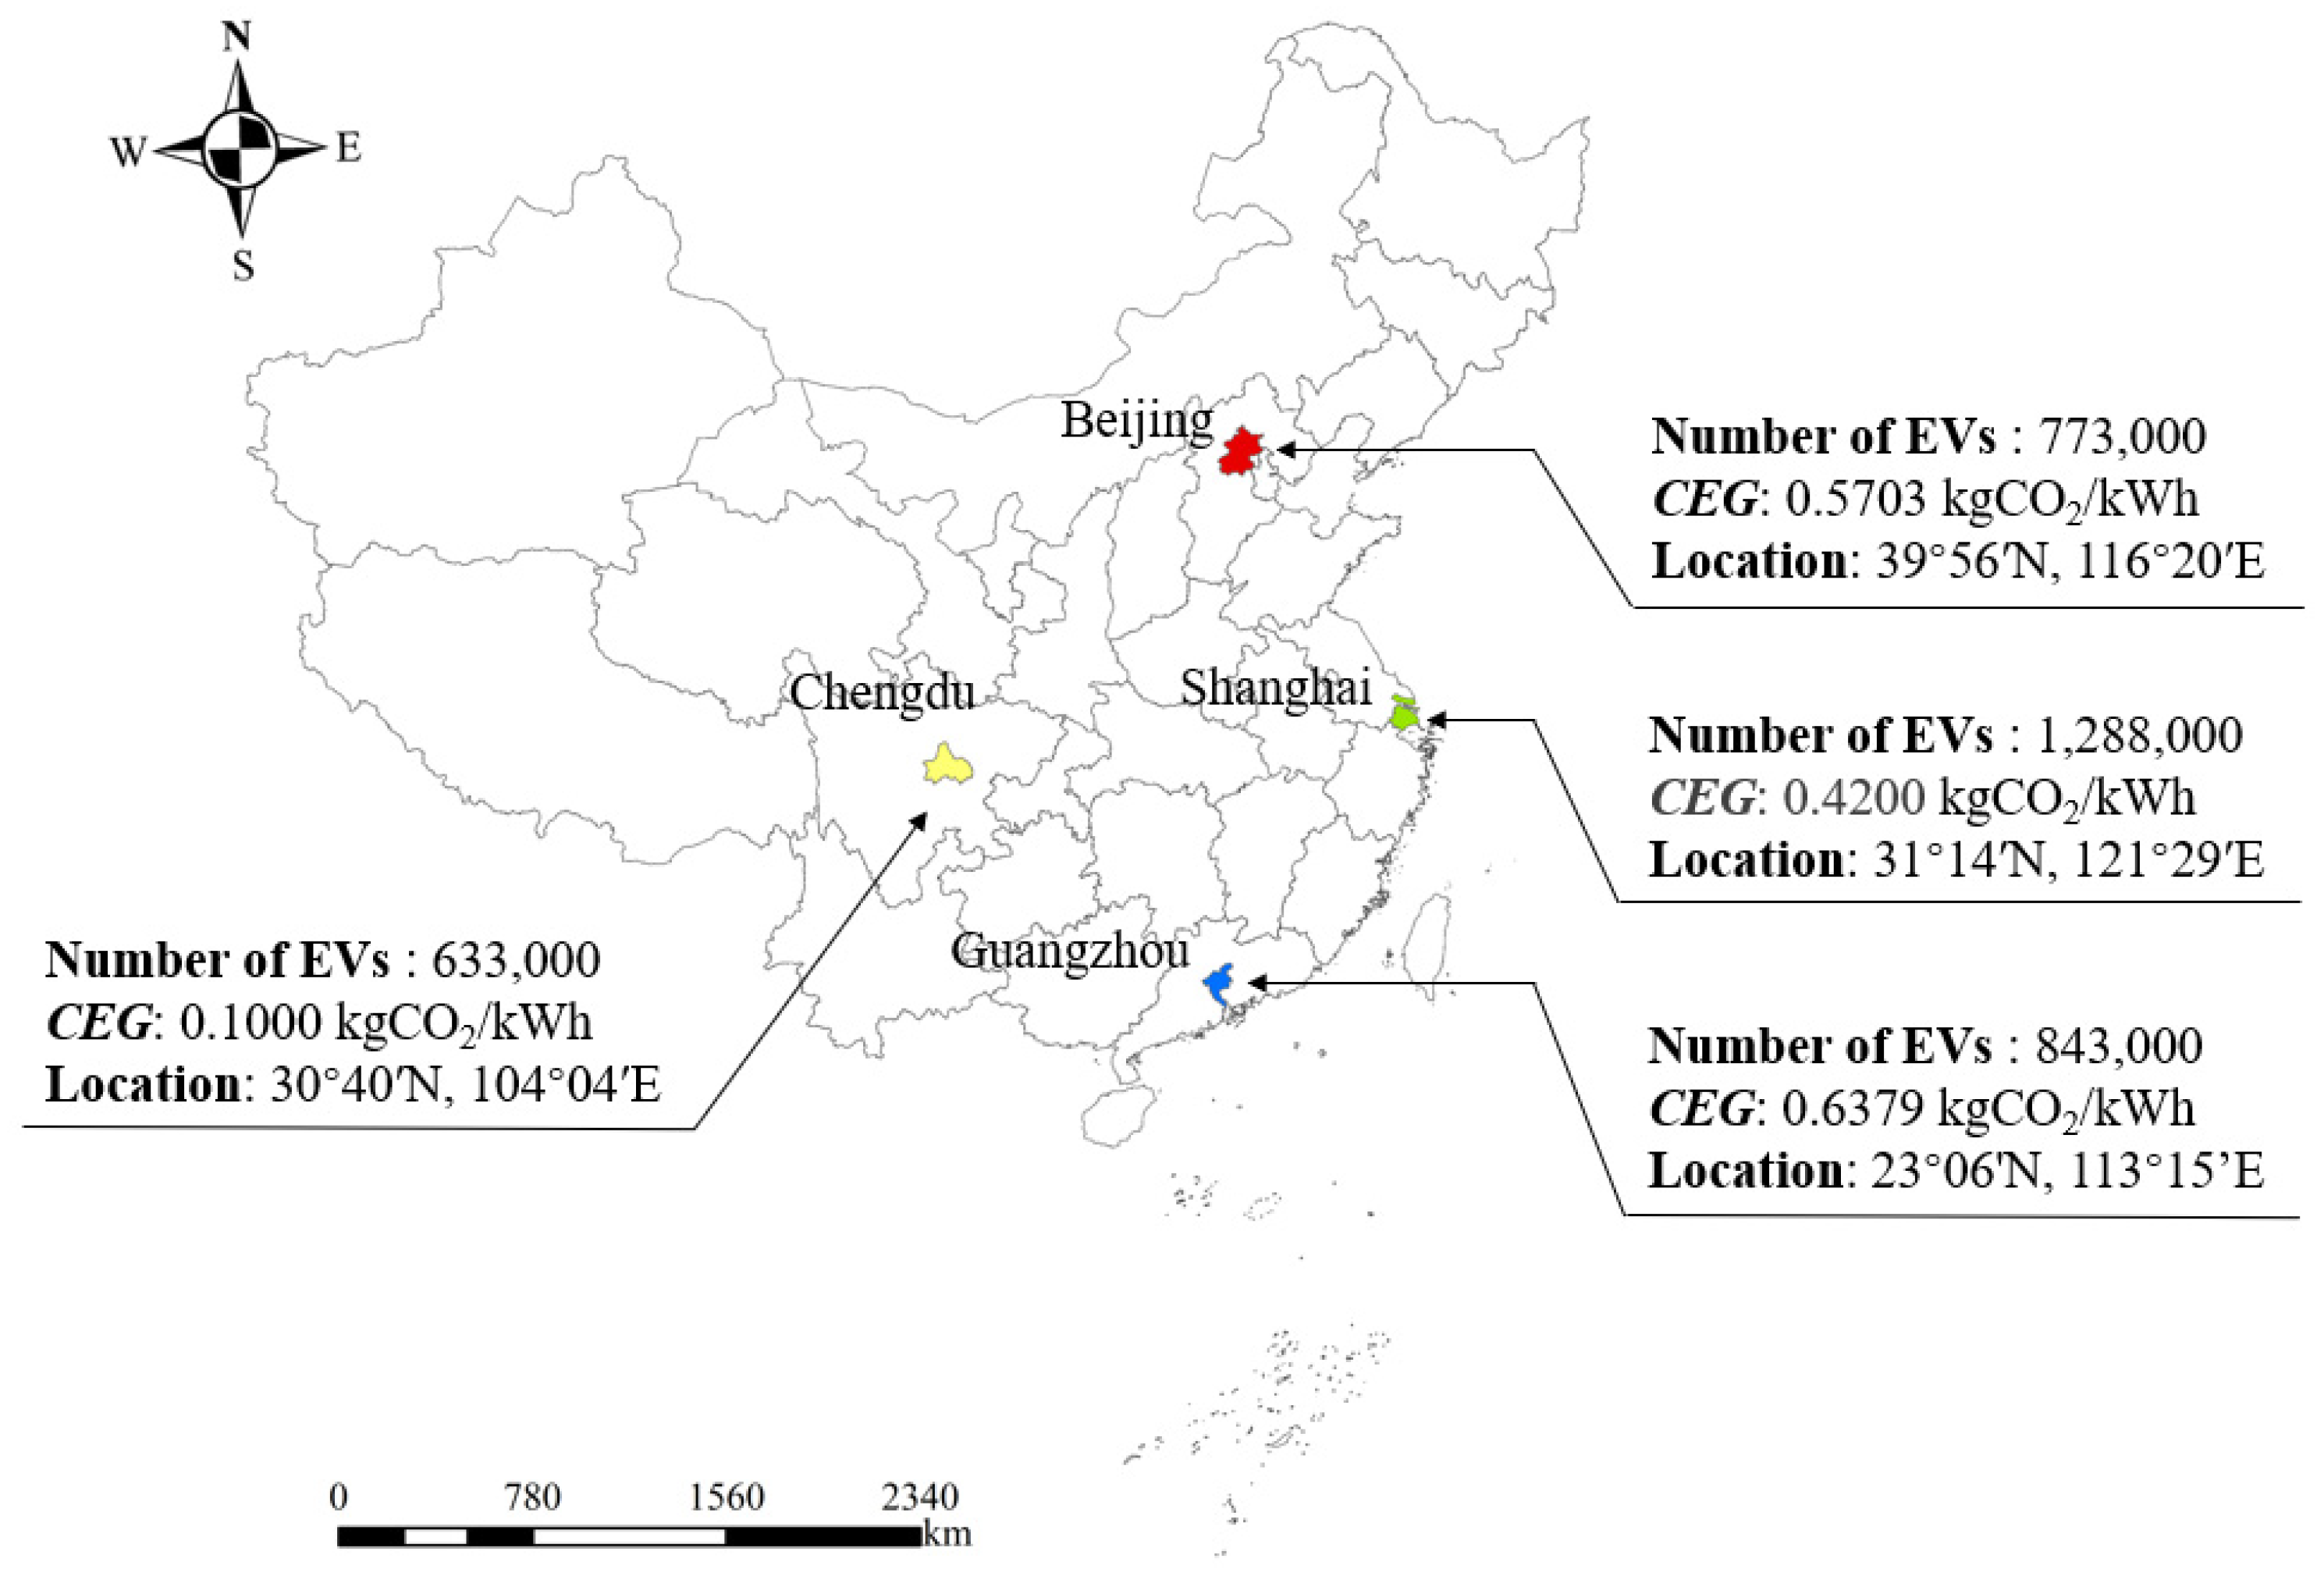
Building on the framework in Section 3—which quantifies interactions among grid carbon intensity (CEG), vehicle efficiency, and usage pattern differences—we apply this model to real-world contexts through spatial stratification. China, the world’s largest EV market (15.52 million EVs by 2023) with significant interregional energy disparities, provides an ideal case study. Provincial CEG values vary widely—from 0.095 kgCO2/kWh in hydropower-dominant regions to 1.092 kgCO2/kWh in coal-reliant areas—offering natural experiments to address two questions: (1) How do spatial CEG variations affect the carbon emission parity thresholds between EVs and ICEVs under different usage intensities? (2) Do observed behaviors (e.g., higher mileage among EV owners) erode emission advantages in specific energy regimes?
To analyze how regional energy profiles influence EVs’ emission reduction efficacy, we employ a spatially differentiated framework. Four megacities—Beijing (North China), Shanghai (East China), Guangzhou (South China), and Chengdu (Southwest China)—were selected (Figure 8) to represent diverse grid types. By 2023, each city had over 500,000 EVs, with Shanghai leading at 1.288 million. Grid CEG in 2023 varied significantly: Chengdu (0.1000 kgCO2/kWh, lowest) vs. Guangzhou (0.6379 kgCO2/kWh, highest). This disparity highlights substantial regional differences in EVs’ indirect emissions relative to ICEVs.
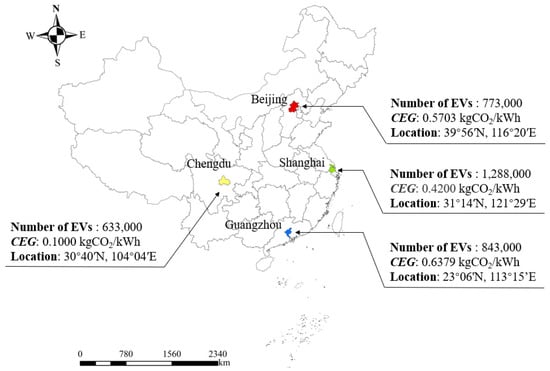
Figure 8.
Spatial distribution of case cities across China’s regional power grids (The data were derived from the official statistical report issued by the relevant government departments in 2023).
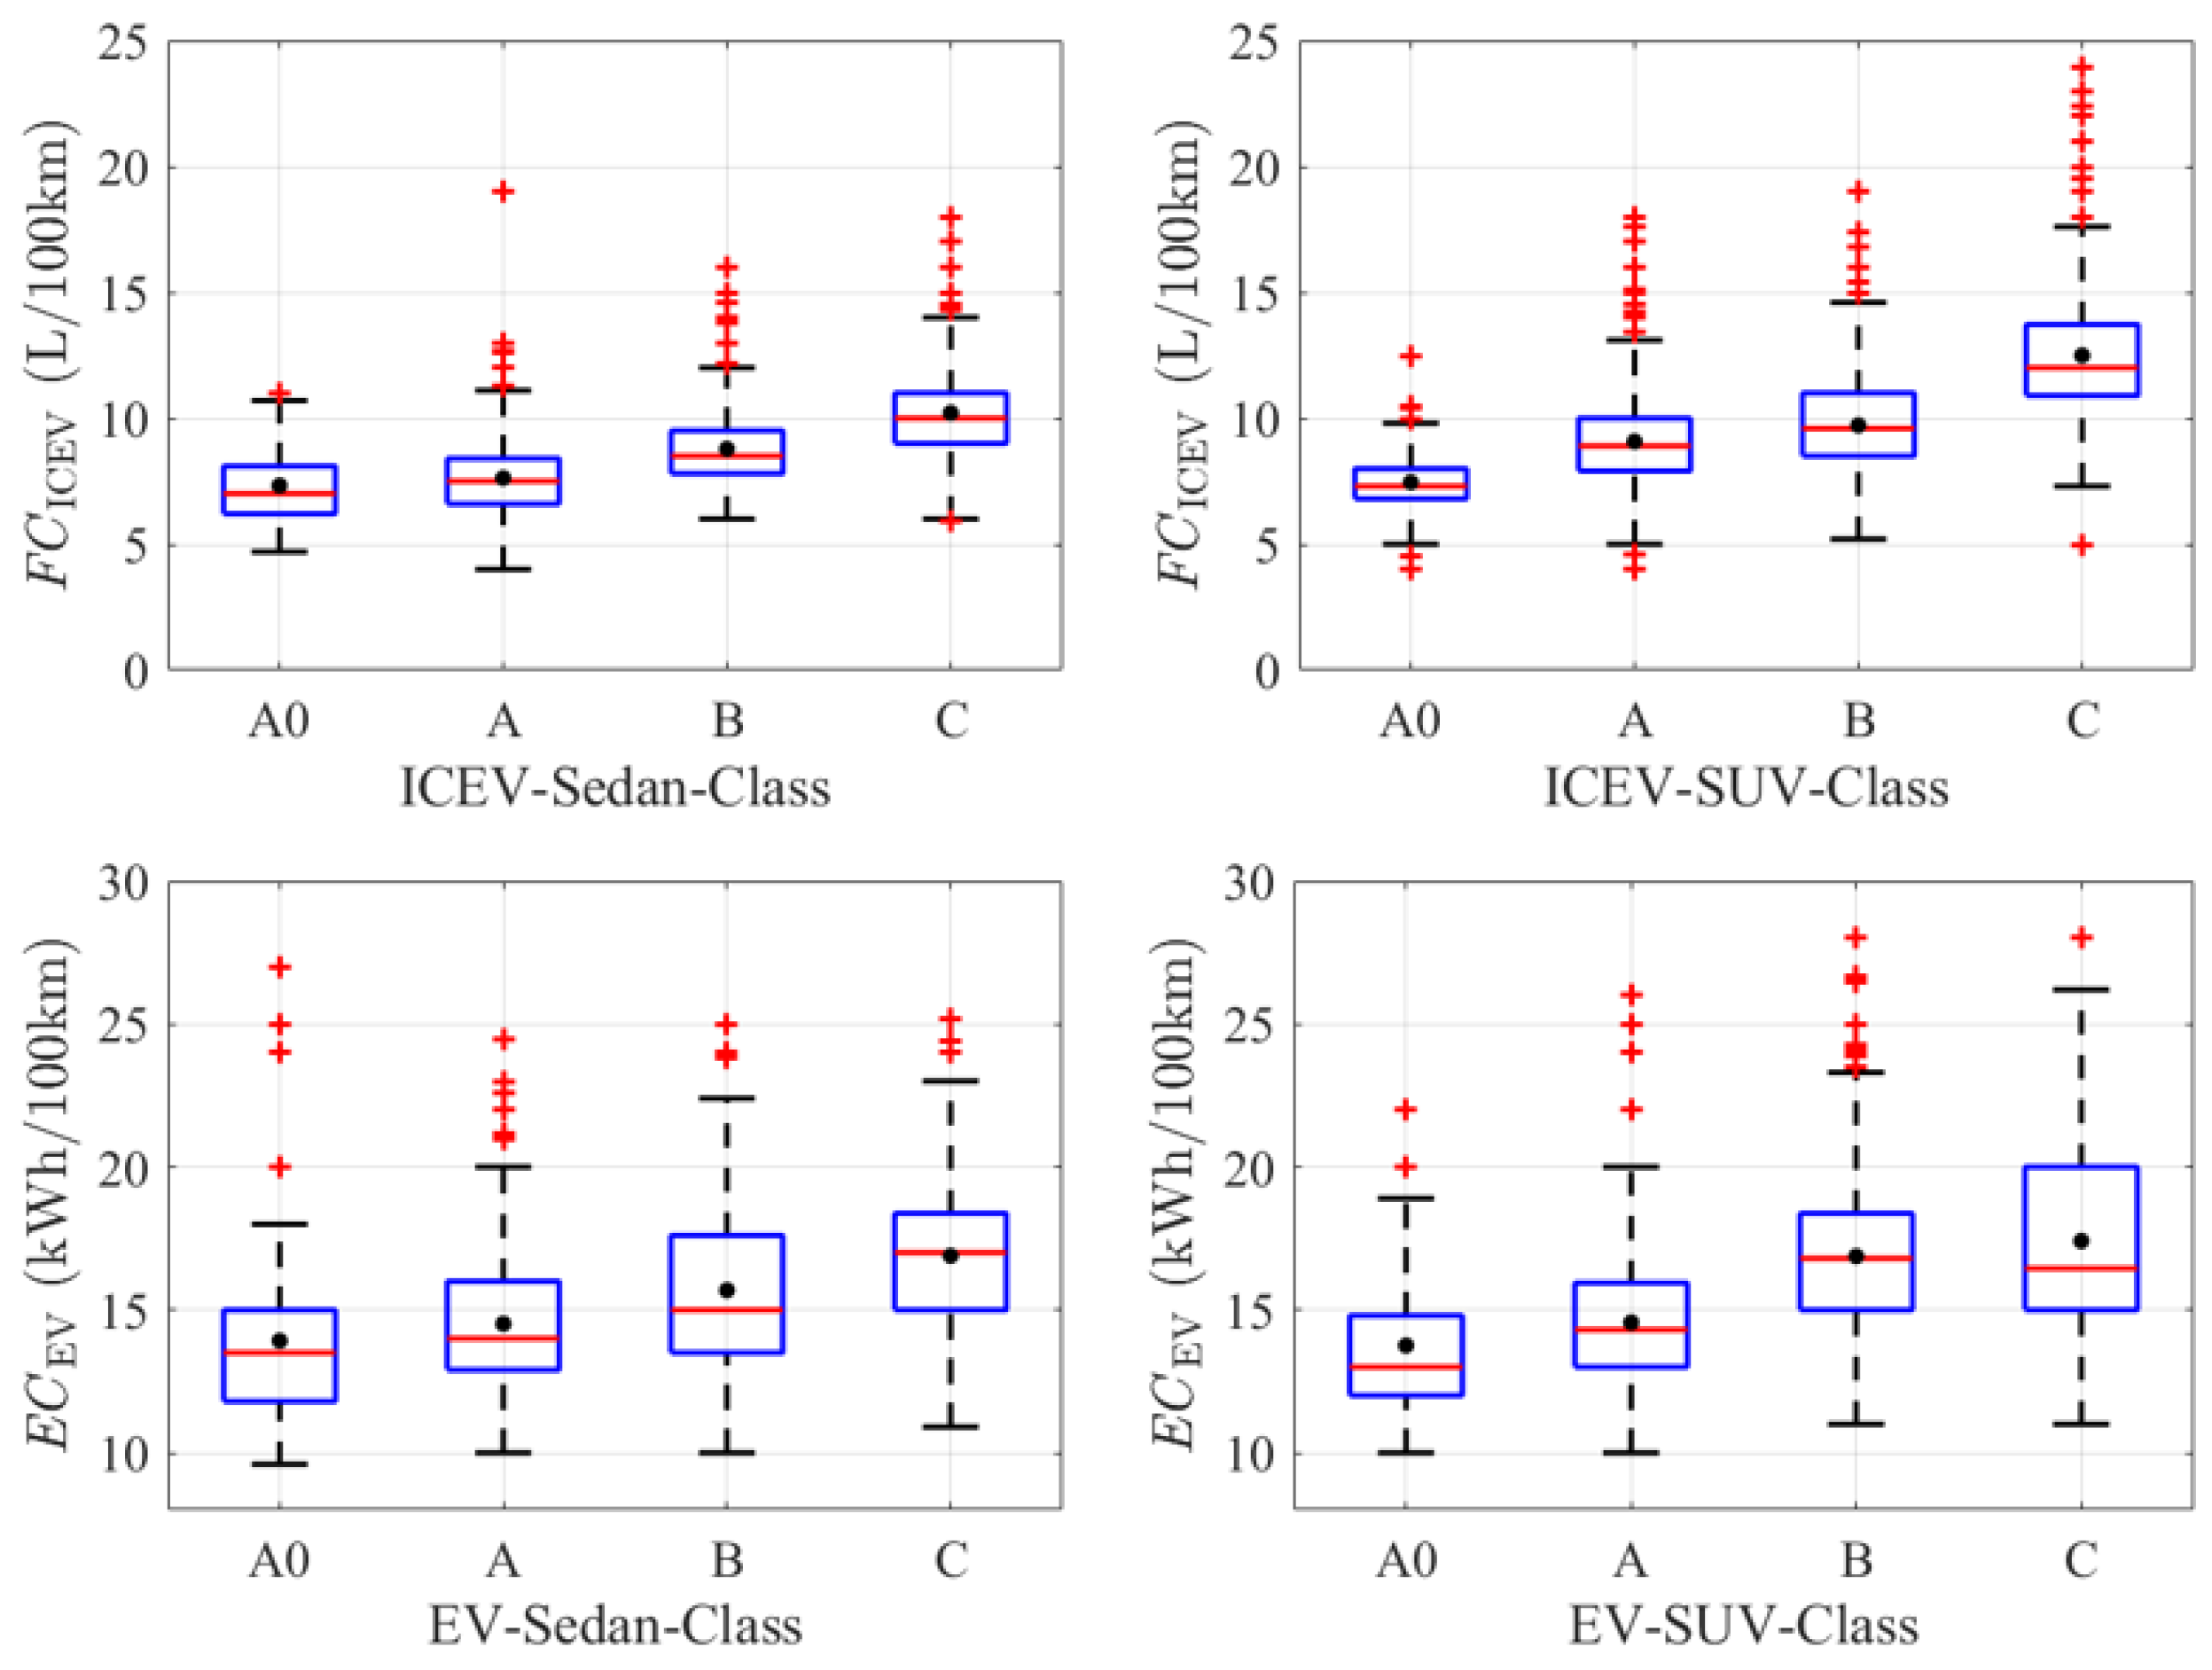
Additionally, the 100-km energy consumption gap between EVs and ICEVs is a critical determinant of their emission disparities. To capture real-world patterns, we employed web scraping to collect owner-reported 100-km energy consumption data from major platforms (e.g., Dongchedi, www.dongchedi.com (accessed on 11 April 2025); Autohome, www.autohome.com.cn (accessed on 11 April 2025)), yielding 19,057 valid records across four vehicle classes (A0, A, B, C) and two body types (sedans, SUVs): 12,268 ICEV records (6192 sedans and 6076 SUVs) and 6789 EV records (3189 sedans and 3600 SUVs). To account for regional variations in traffic, infrastructure, and driving behaviors, we analyzed energy consumption in conjunction with city-specific grid emission factors. Taking Beijing as an example, Figure 9 presents separate boxplots for EV and ICEV energy consumption, highlighting the median (red lines), mean (black dots), and outliers (+). After removing outliers, we calculated descriptive statistics (median, quartiles, max, min, mean) to characterize energy consumption patterns. Subsequently, by integrating these with grid CEG and annual mileage, we quantify annual carbon emission disparities between EV and ICEV owners.
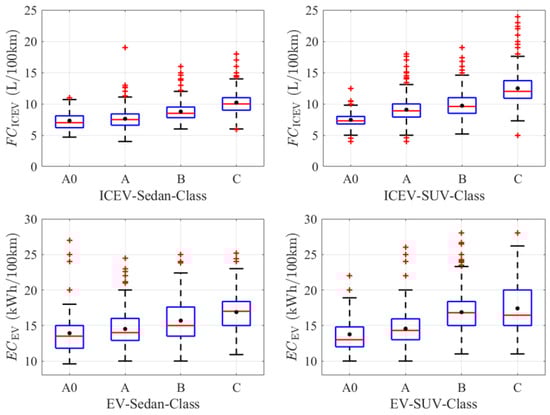
Figure 9.
Boxplot of energy consumption distributions for private EV and ICEV owners in Beijing.
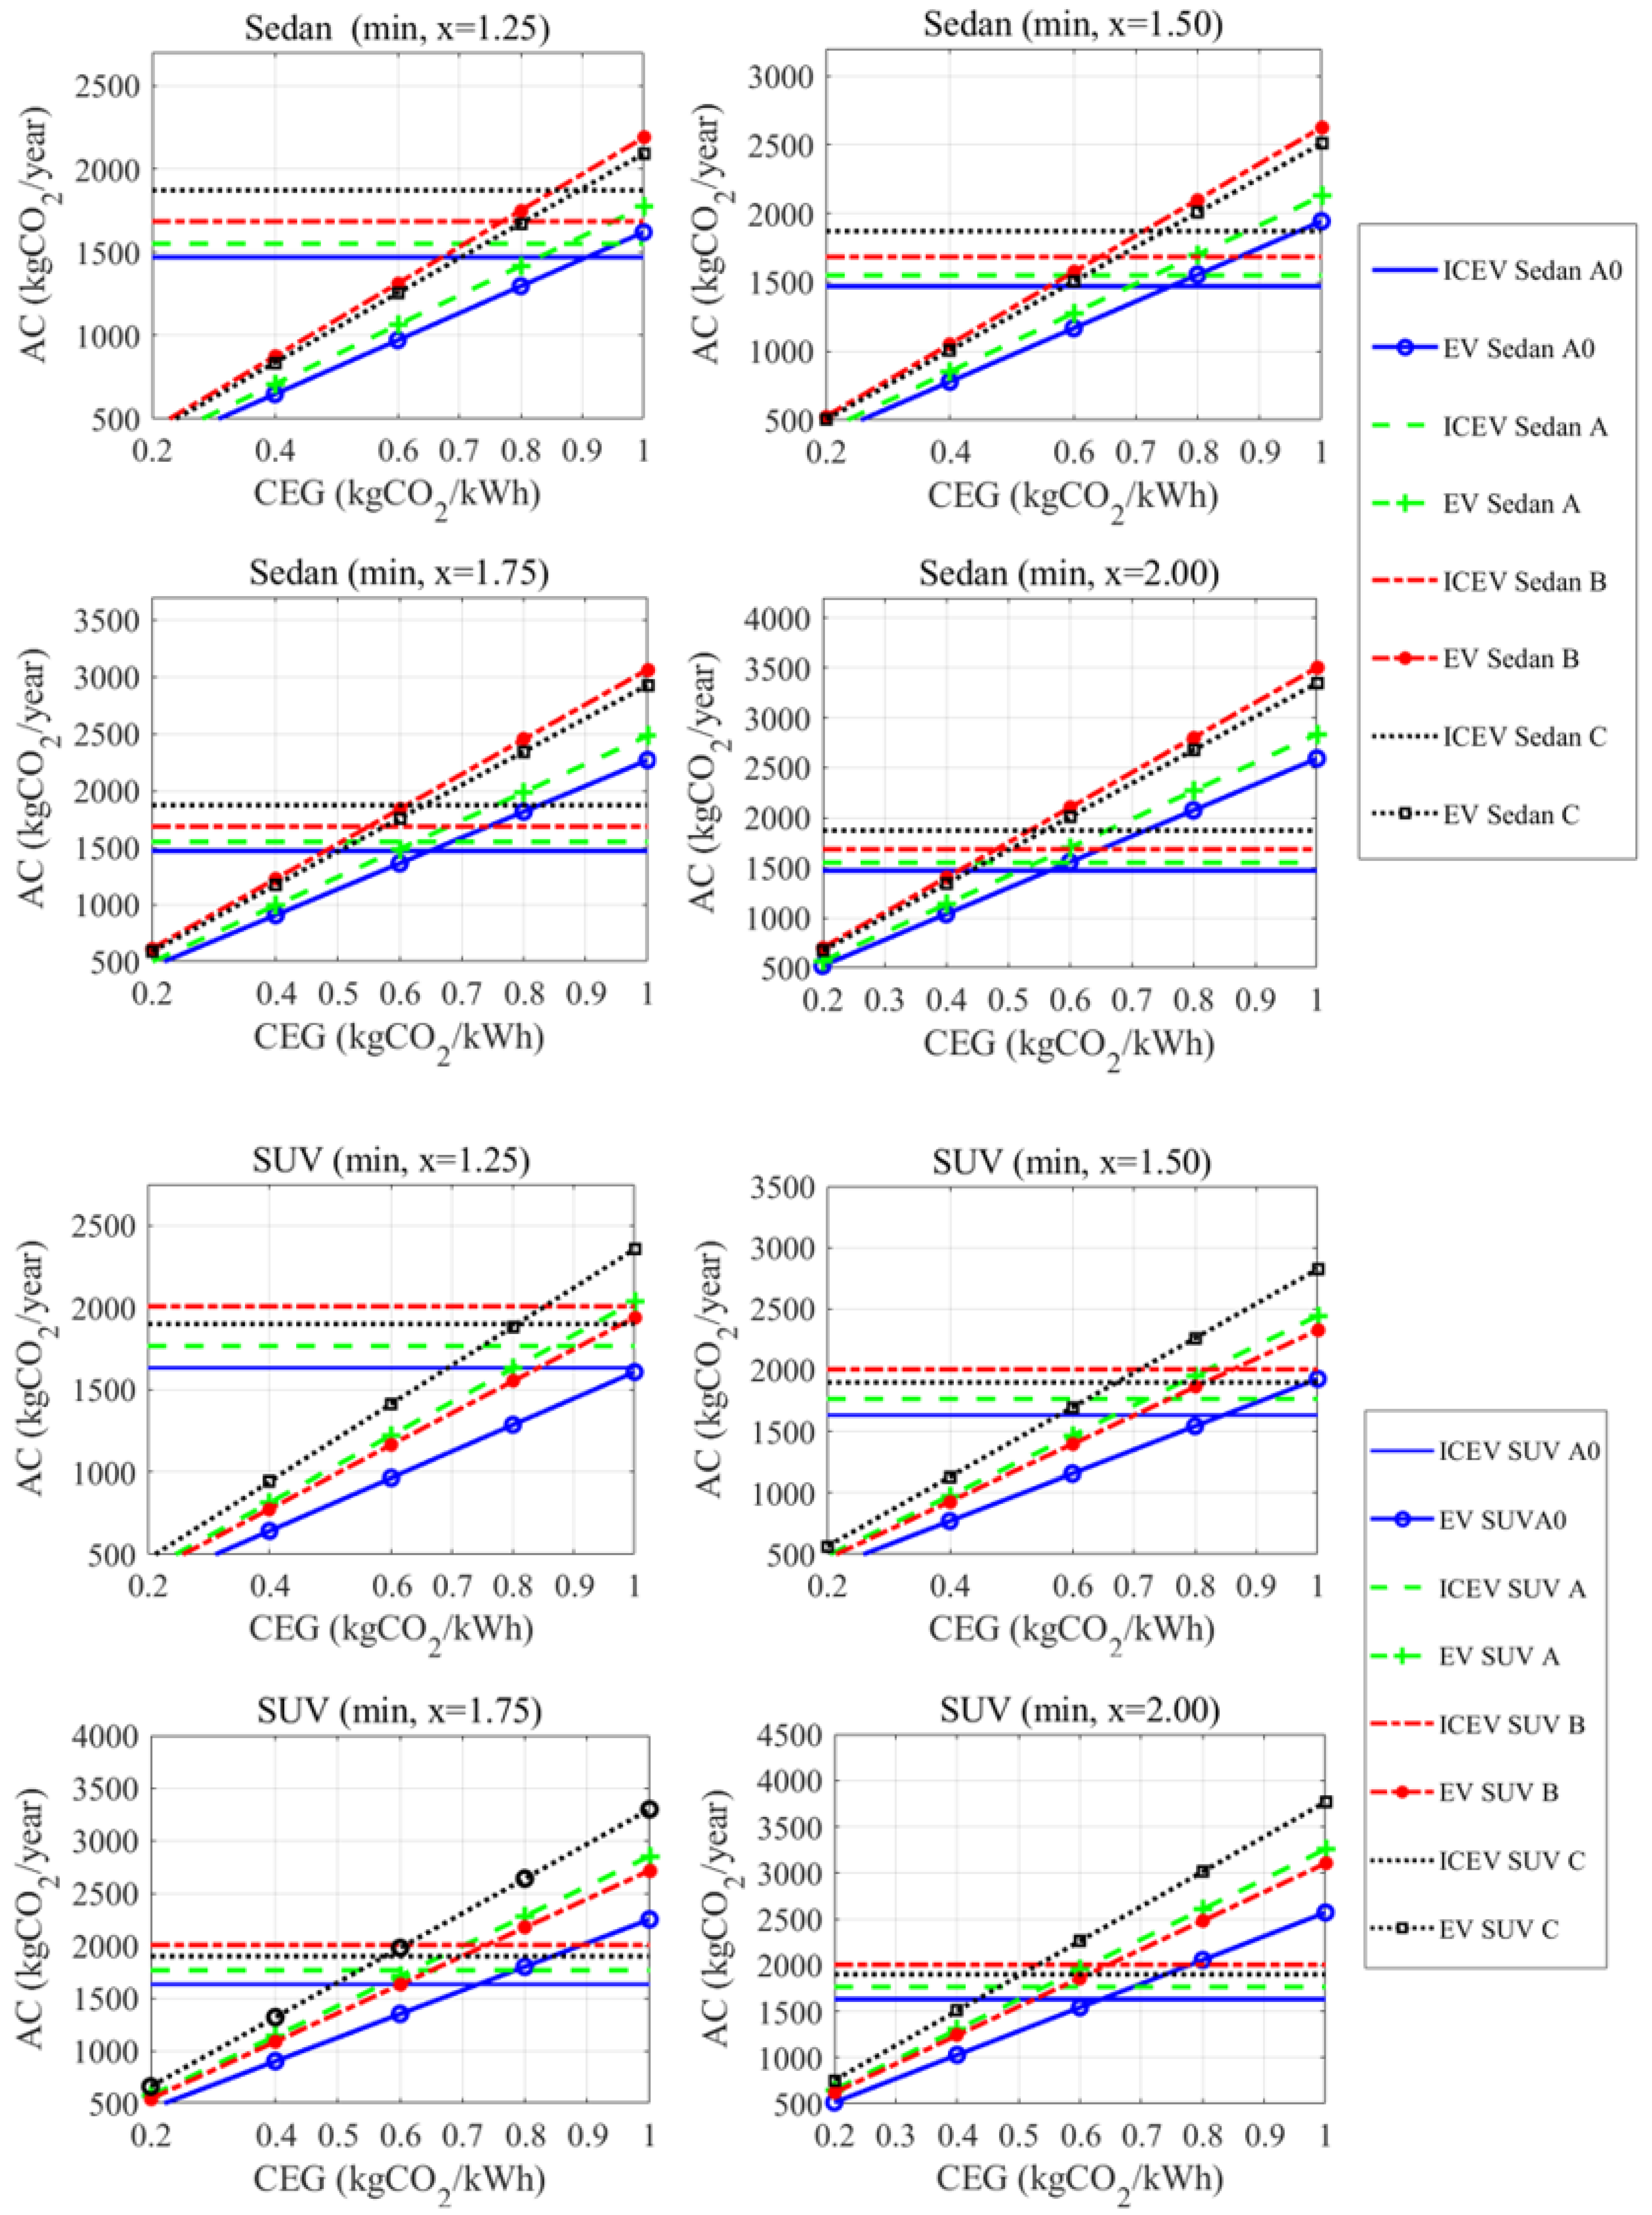
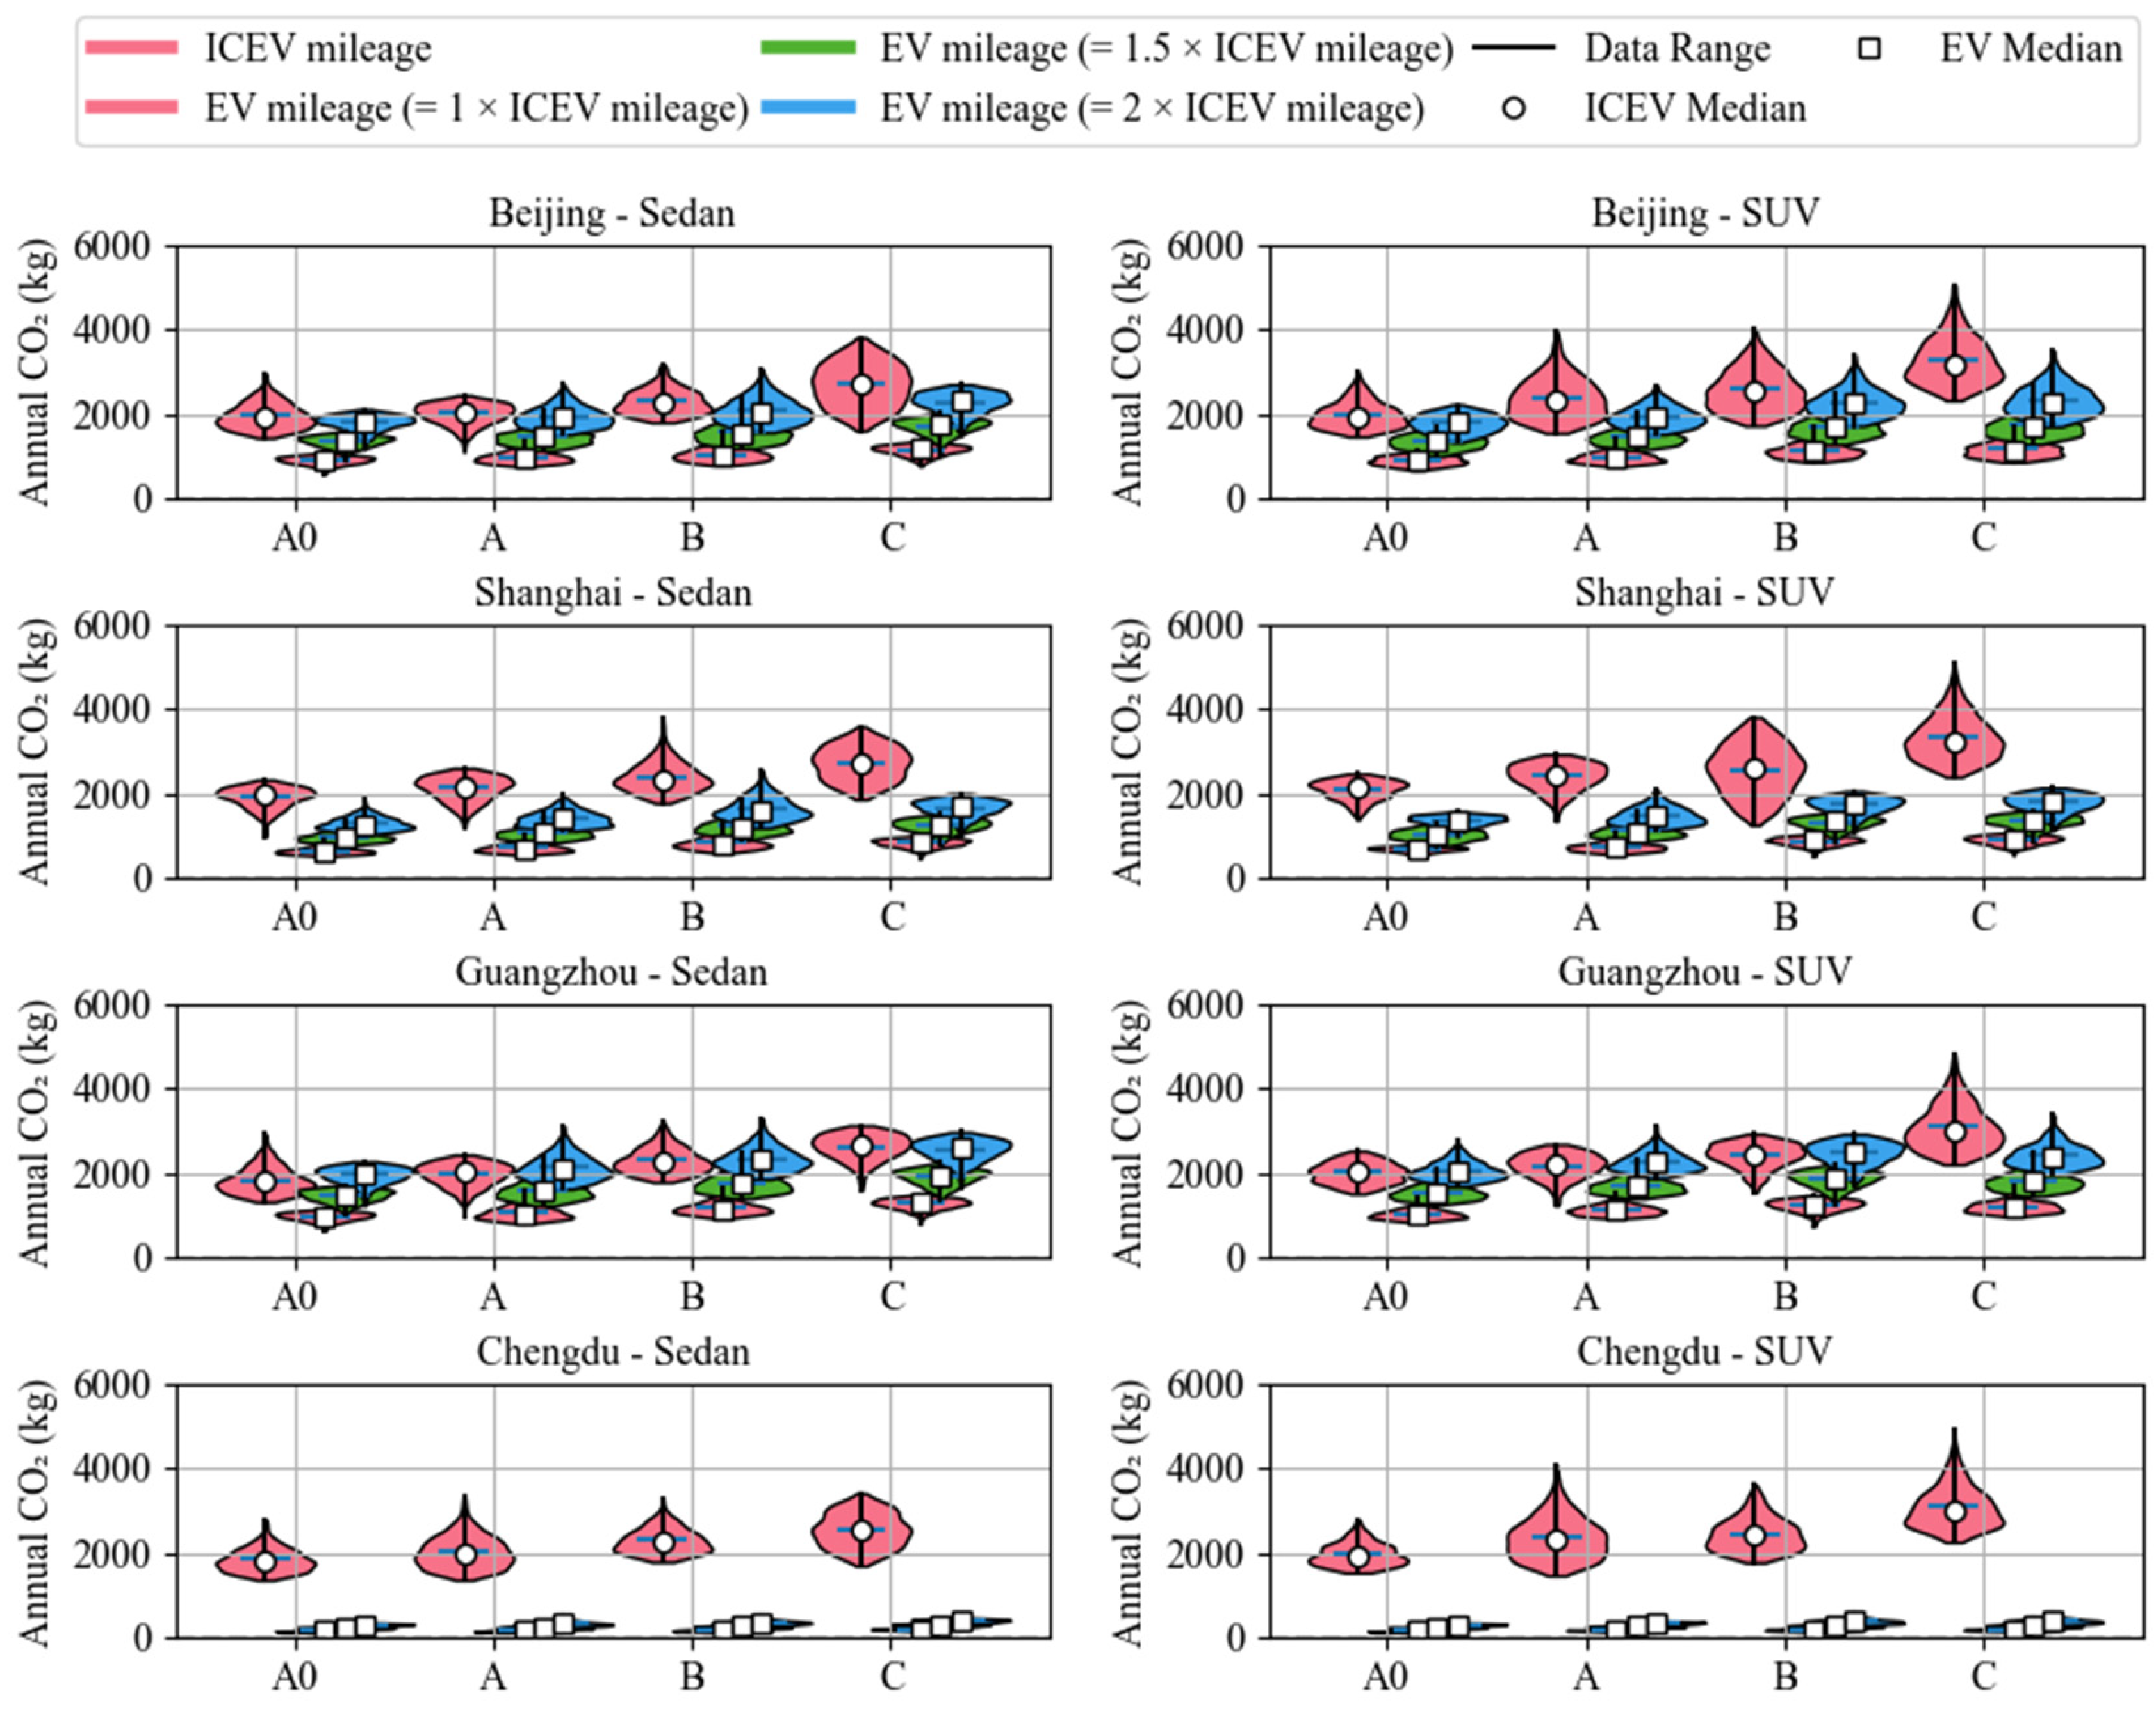
The annual CO2 emissions for ICEVs and EVs were calculated using Equations (1) and (2), respectively. During the calculation, the efficiency factors ηcharge (charging losses) and ηtrans (transmission losses) were determined based on statistical data from the National Energy Administration: ηtrans was set to 6.5%, and ηcharge was set to 10% [54]. The average annual mileage for ICEV owners was set to 10,000 km, a value synthesized from statistical datasets and real-world vehicle usage scenarios [19,33]. Using a combined visualization approach of violin plots and boxplots, this study displays the distribution and heterogeneity of carbon emissions from EVs and ICEVs across four regional grid carbon intensities (Beijing, Shanghai, Guangzhou, Chengdu); four vehicle categories (A0 to C-class sedans/SUVs); and mileage multipliers relative to the ICEV baseline (x = 1, 1.5, 2). The results are presented in Figure 10.
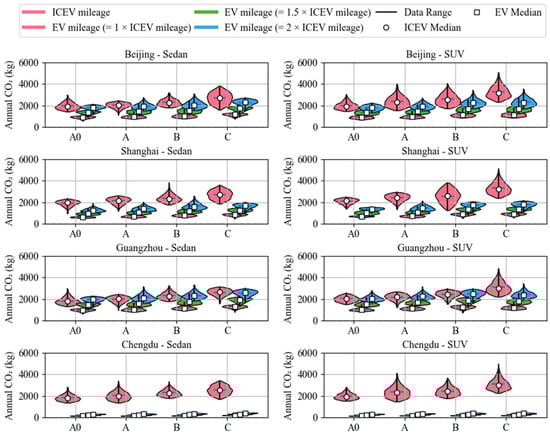
Figure 10.
Annual CO2 emissions for ICEVs and EVs under varying annual mileage multipliers across vehicle classes and cities.
As shown in Figure 10, grid carbon intensity is pivotal in shaping EV emission distributions. In high-carbon regions (e.g., Guangzhou), high-energy-consuming EVs at the maximum percentile emit more than medium/low-energy ICEVs (≤75th percentile) but less than high-energy ICEVs (maximum percentile). In contrast, low-carbon regions (e.g., Chengdu) leverage grid decarbonization to offset extreme EV usage (maximum percentile), ensuring all percentile ranges retain EVs’ absolute emission advantage. Second, regional heterogeneity exists in the impact of annual mileage multipliers (x). In high-carbon regions (e.g., Guangzhou), higher x drives nonlinear growth in EV emissions—for example, C-class SUVs exhibit a 62.5% interquartile range (IQR) increase—particularly among extreme high-energy users (maximum percentile). Low-carbon regions (e.g., Chengdu) show modest dispersion growth (IQR increase < 35%) due to the fact that grid decarbonization mitigates high-mileage emission penalties.
Moreover, energy consumption quantiles reveal technological optimization priorities. High-energy models (e.g., C-class SUVs) exhibit right-skewed EV emission distributions (long tails). In Guangzhou, x = 2 causes maximum EV emissions (5.32 tCO2/year) to exceed the ICEV 75th percentile (4.80 tCO2/year), meaning 25% of high-energy EV owners exceed medium/low-energy ICEVs (Q1–Q3). Intelligent energy management is therefore critical to mitigate extreme-scenario risks. Conversely, low-energy models (e.g., A0-class) show IQR values 35–45% of same-level ICEVs with no significant skewness. For example, Beijing’s A0-class EVs (x = 1.5) have a 25th–75th percentile range of 1.2–1.7 tCO2/year, confirming robust emission advantages across diverse driving behaviors.
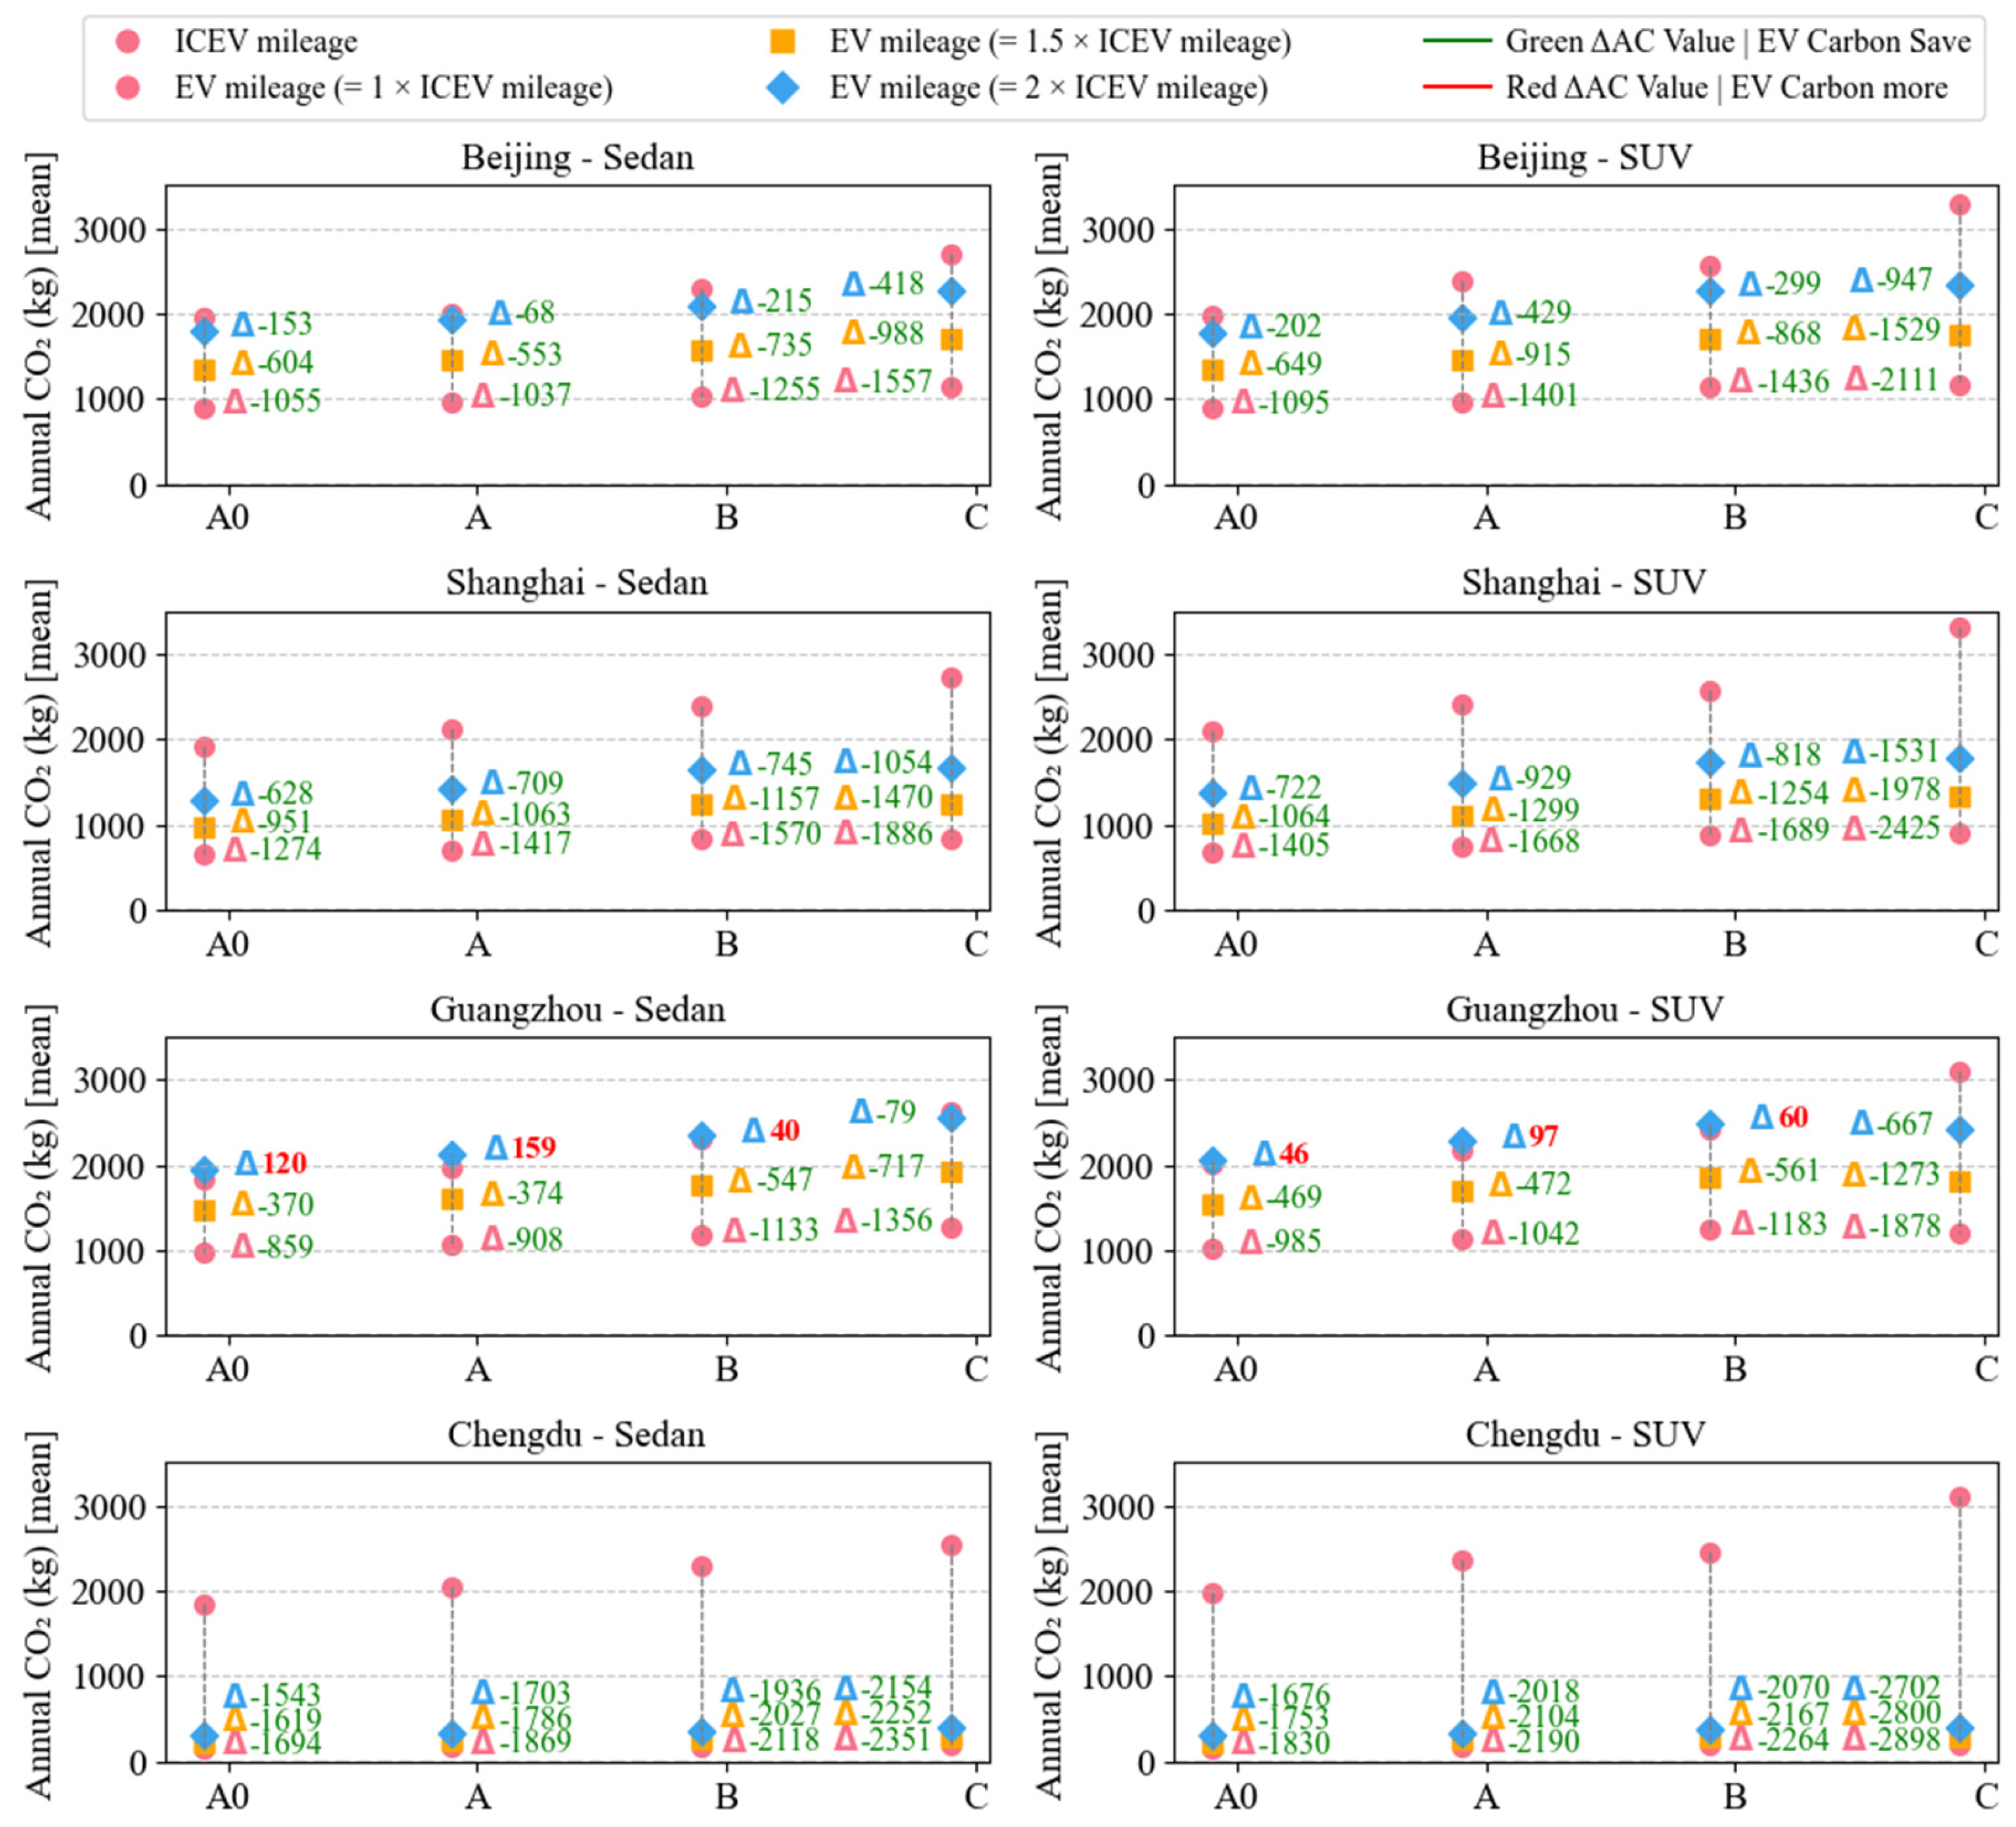
The above analysis reveals heterogeneity in carbon emission distributions of EVs and ICEVs across different cities, vehicle classes, and mileage multiplier (x) scenarios. However, real-world distributions are influenced by the interplay of user behaviors and regional grid characteristics. This necessitating the use of standardized models to identify universal patterns among core variables. Therefore, based on the average energy consumption data by vehicle class and Equation (3), the study constructs a lollipop chart (Figure 11) to quantify direct effects of grid carbon intensity (CEG) and mileage multiplier (x) on carbon emission differences (ΔAC) between equivalent EV and ICEV classes. This approach minimizes the impact of outliers and isolates the CEG-x interactions, providing robust theoretical boundaries for policy design.
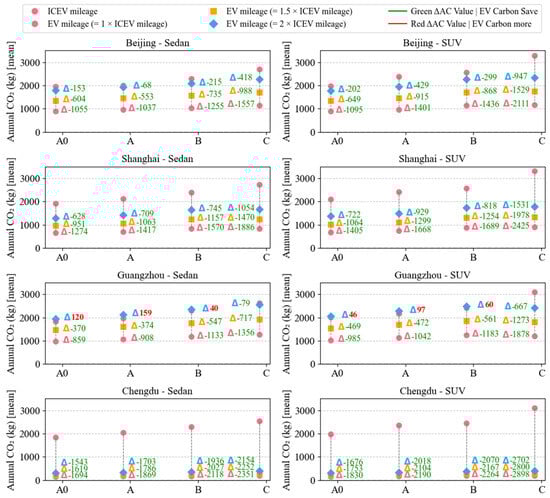
Figure 11.
Comparison of annual CO2 emissions between ICEVs and EVs across vehicle classes and cities: ΔAC values under varying annual mileage multipliers.
Figure 11 shows that in high-carbon regions (e.g., Guangzhou, CEG = 0.6379 kgCO2/kWh), higher x values (e.g., x = 2, double the baseline mileage) cause ΔAC to approach zero or become positive, particularly for A0-, A-, and B-class models. This indicates that EV emissions may surpass those of comparable ICEVs. Conversely, in low-carbon regions (e.g., Chengdu, CEG = 0.1000 kgCO2/kWh), all ΔAC values for the same vehicle classes remain negative, confirming that EVs emit significantly less than ICEVs, even when the mileage is doubled. Thus, the CEG-x interaction plays a crucial role in determining the extent of EVs’ emission advantage.
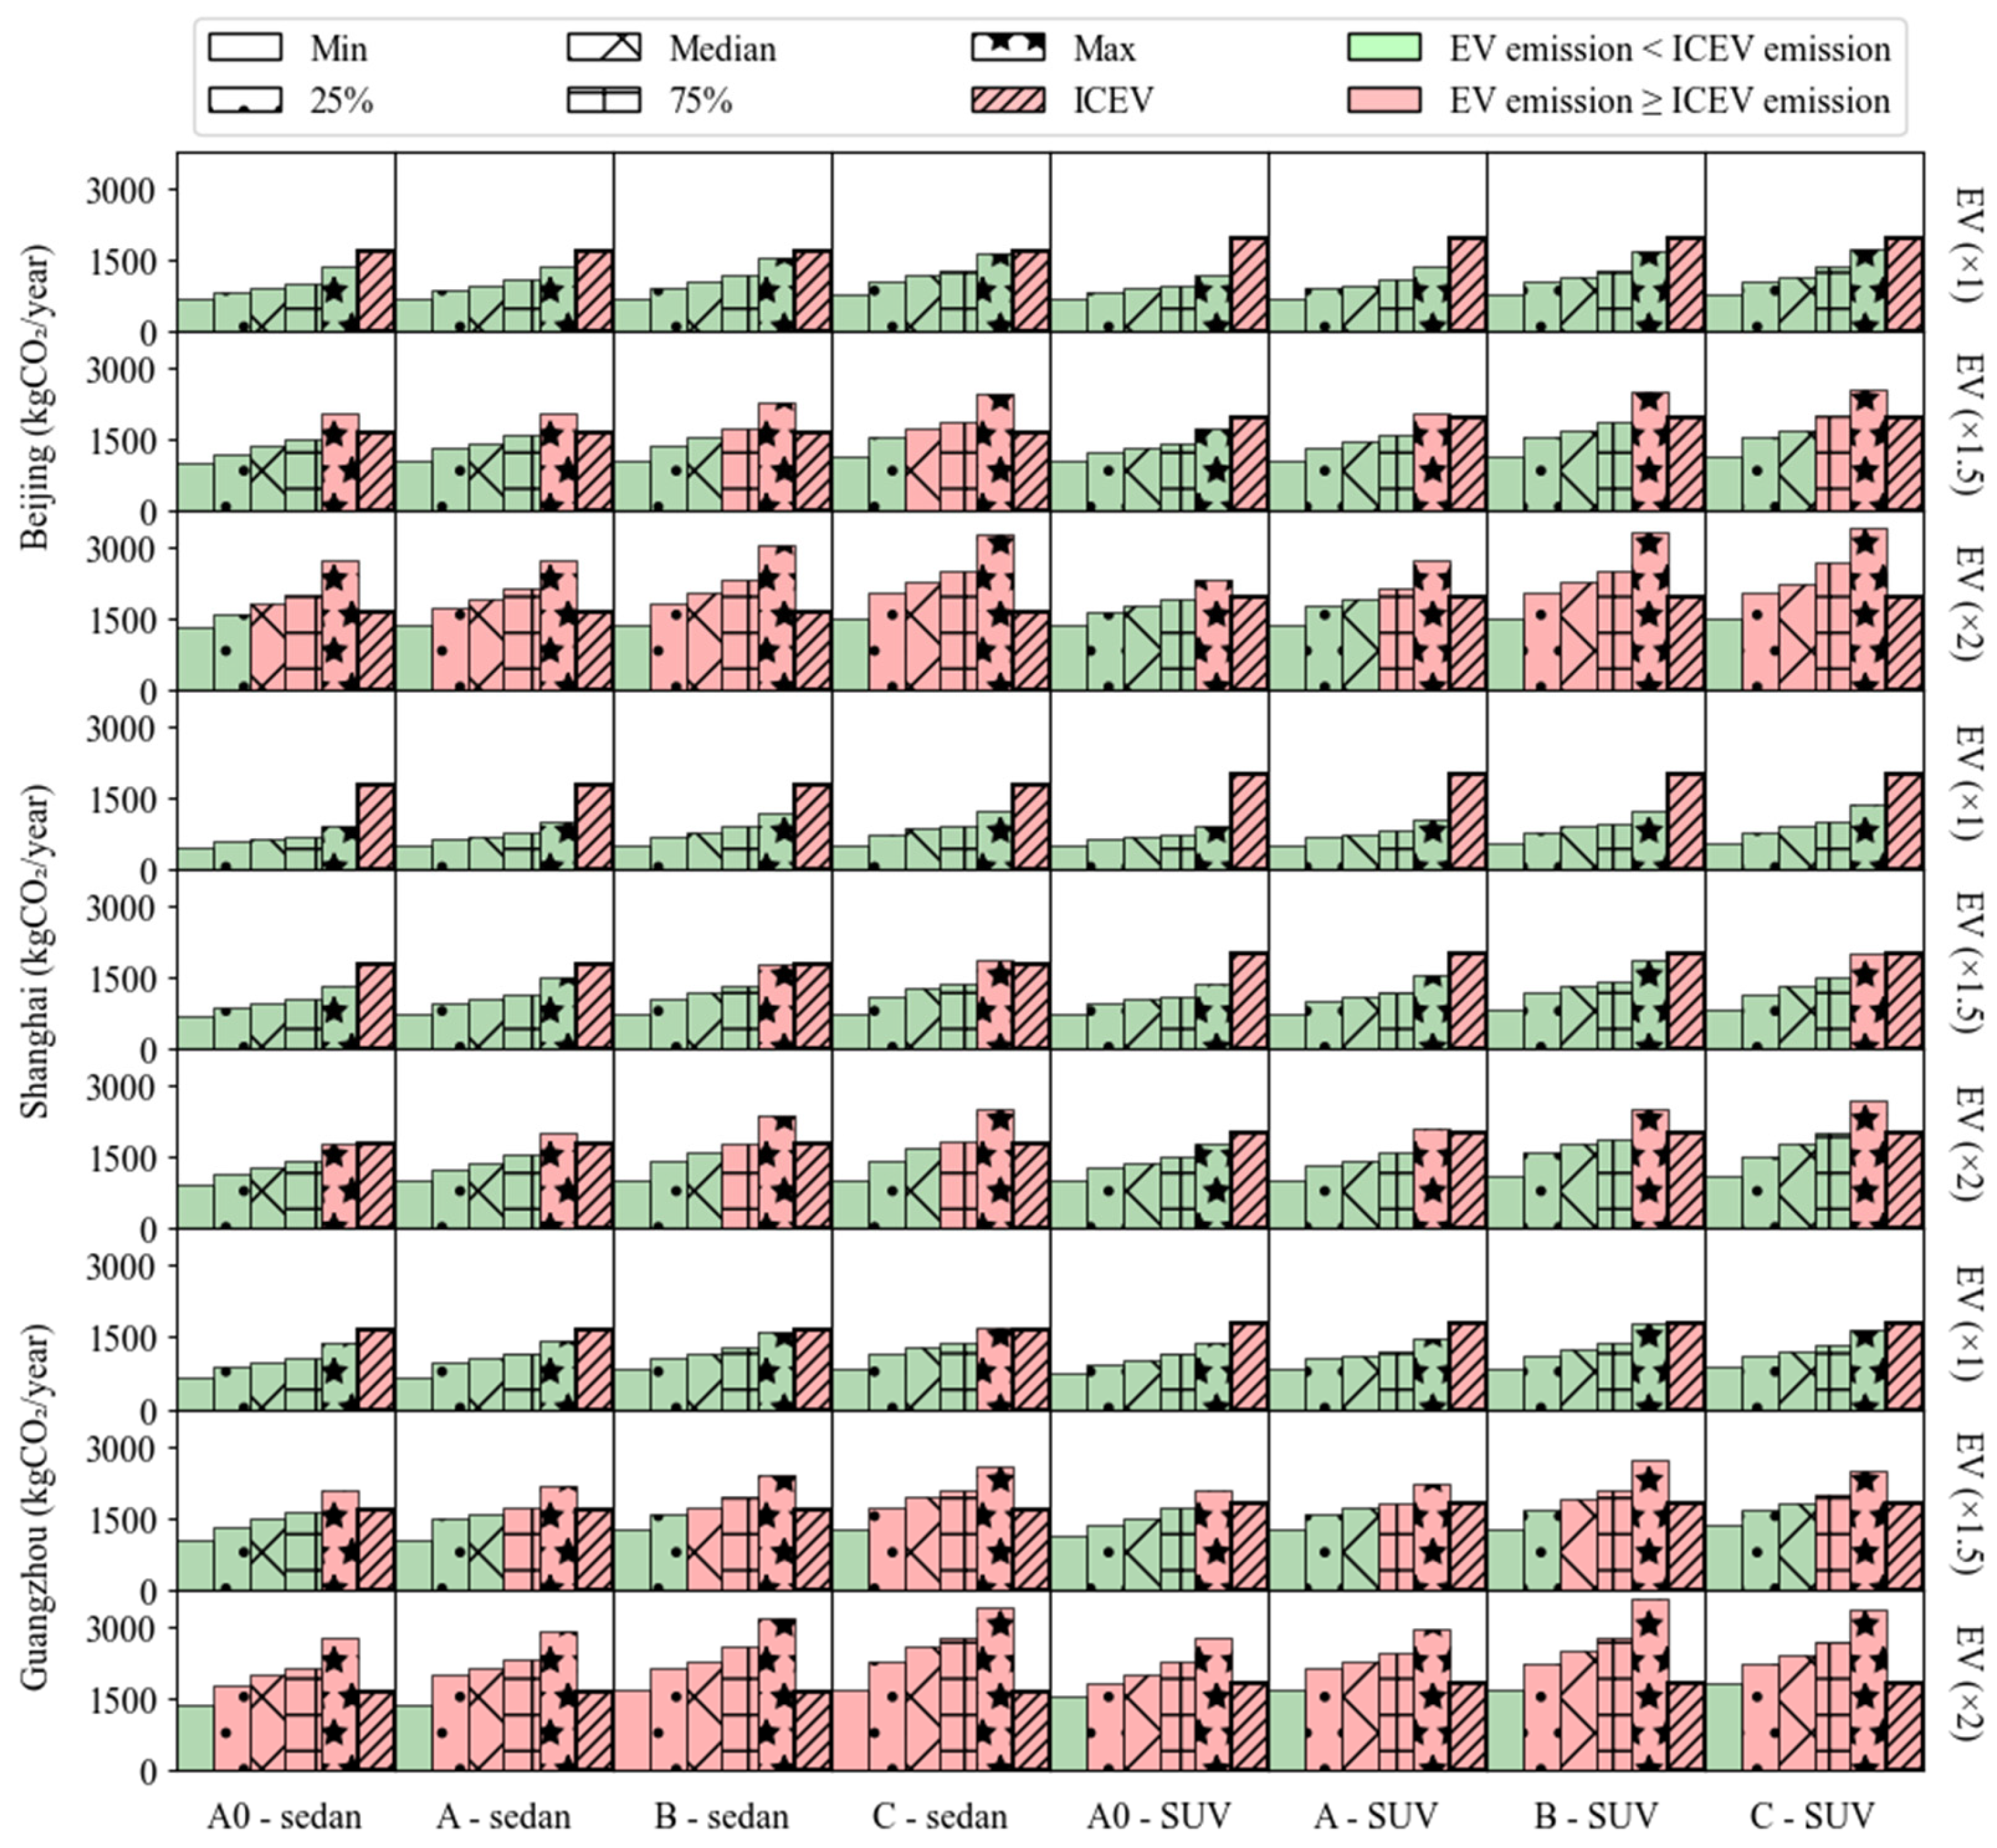
While Figure 11 explores policy-sensitive ranges for grid carbon intensity (CEG) and mileage multiplier (x) within vehicle classes, real-world consumer choices often involve cross-class comparisons (e.g., B-class EVs vs. A-class ICEVs). To address this, we extend the analysis framework by benchmarking against A-class ICEVs’ median fuel consumption—accounting for ~50% of China’s passenger car sales—and evaluating EV emission quantiles (minimum, 25th, median, 75th, maximum) from real-world data. This quantifies the impact of extreme user behavior on emission reduction potential (Figure 12). Notably, Chengdu is excluded from cross-class analysis: its ultra-low grid CEG (0.1 kgCO2/kWh) ensures all EV quantiles—including the maximum—lie below ICEVs’ 25th percentile (Figure 10), leaving no space for policy optimization. Thus, we focus on medium/high-carbon grids (Beijing, Shanghai, Guangzhou) to analyze CEG-energy consumption interactions.
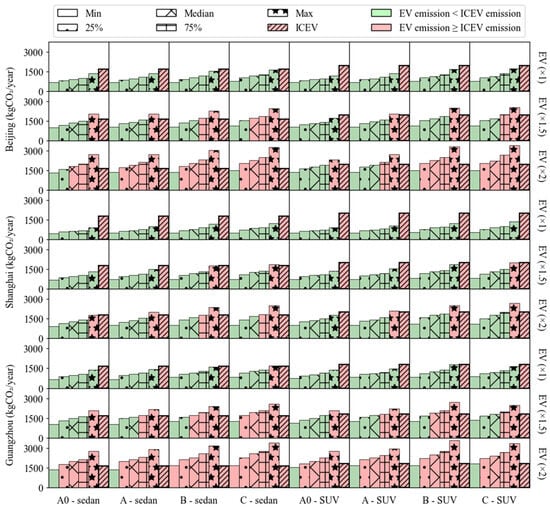
Figure 12.
Cross-class quantile comparison of EV carbon emissions: impacts of grid carbon intensity and the mileage multiplier against A-class ICEV median fuel consumption benchmark.
Figure 12 shows EVs’ emission advantage depends on vehicle energy consumption and grid CEG. A0-class EVs, with low energy consumption, remain below A-class ICEVs’ median emissions even under high-carbon grids (e.g., Guangzhou) and doubled mileage (x = 2, 20,000 km). In contrast, B- and C-class EVs are highly sensitive to both factors: C-class SUVs at Guangzhou’s maximum percentile with x = 2 emit 1.3 times A-class ICEVs’ median, exceeding the benchmark. Low-energy EVs (minimum–25th percentile) universally outperform ICEVs, but high-energy EVs (75th–max percentile) approach or surpass ICEV benchmarks in medium/high-carbon grids.
5. Discussion
Building on the above analysis, this study focuses on four critical dimensions—power grid decarbonization, class-based vehicle control, user behavior guidance, and cross-regional collaboration—to propose a targeted policy framework for systematically optimizing EVs’ carbon emission reduction potential.
First, regional grid decarbonization is pivotal to unlocking EVs’ emission reduction benefits. As shown in Figure 10, Chengdu’s low-carbon grid (CEG = 0.1 kgCO2/kWh) ensures EVs maintain absolute emission advantages even at doubled annual mileage (x = 2, 20,000 km baseline). In contrast, high-carbon grids like Guangzhou (CEG = 0.6379 kgCO2/kWh) risk emission reversals for high-energy EVs. Coal-dependent regions must prioritize grid decarbonization through wind, solar, and energy storage integration to lower CEG. Policies should include implementing carbon pricing mechanisms, establishing renewable energy quota systems, expanding carbon market coverage, and accelerating flexible thermal power plant upgrades.
Second, differentiated policies for vehicle classes are essential. A0-class EVs (e.g., 11.6 kWh/100 km energy consumption) outperform A-class ICEVs even in high-carbon grids (Figure 12), while B- and C-class EVs in high-energy scenarios may exceed ICEV emissions at x = 2. High-carbon regions (e.g., Guangzhou) should prioritize subsidies for A0/A-class EVs and restrict high-energy models (e.g., C-class SUVs), whereas low-carbon regions (e.g., Chengdu) can promote all EV classes. Strengthening energy efficiency labeling will guide consumers toward low-energy models.
Third, dynamic monitoring of owner behavior. In high-carbon grids, doubling annual mileage (x = 2) narrows or reverses the EV-ICEV emission gap (ΔAC), as seen in Guangzhou’s A0, A, and B-class vehicles (Figure 11). Policymakers should develop a driving data platform and implement dynamic carbon credit policies: (1) High-mileage owners (>20,000 km/year) of high-energy models face carbon taxes; (2) Low-energy model users with high mileage receive charging subsidies to incentivize efficiency.
Fourth, regional disparities in emissions necessitate differentiated policies. Guangzhou requires model-specific EV promotion, while Chengdu’s low CEG needs no additional measures. A national framework should do the following: (1) Mandate high-carbon regions to ensure ≥60% of EV sales are low-energy models (e.g., A0 and A-class); (2) Allow low-carbon regions to relax restrictions on higher-energy models; (3) Expand cross-regional green electricity trading (e.g., high-carbon regions purchase western hydropower/wind quotas) to lower CEG.
Finally, this study excludes upstream emissions from battery production and mineral extraction, which may lead to underestimating EVs’ full life cycle carbon footprints. However, literature shows grid decarbonization can offset these impacts: Buberger et al. (2022) found that EVs in grids with >50% renewable energy has 40–60% lower full life cycle emissions than ICEVs, even accounting for battery production [31]. Thus, grid decarbonization not only optimizes usage-phase emissions but also mitigates upstream environmental burdens holistically.
The carbon emission reduction benefits of EVs depend significantly on synergistic optimization of grid cleanliness, vehicle energy efficiency, and user behavior. Policymakers must avoid “one-size-fits-all” approaches. By accelerating grid decarbonization, enforcing class-based vehicle management, guiding user behavior adjustments, and enhancing cross-regional collaboration, the full potential of EVs’ carbon emission reduction can be realized.
6. Conclusions
This study investigates annual carbon emission disparities between EVs and ICEVs, focusing on the interplay between vehicle usage patterns (e.g., annual mileage) and regional grid carbon intensity. By developing a usage-phase life cycle assessment (LCA) model, this study systematically quantifies how key variables—energy consumption metrics (ECEV and FCICEV), grid carbon intensity (CEG), and mileage patterns—influence the carbon parity thresholds between EVs and ICEVs. Through scenario analyses and case studies in four Chinese megacities (Beijing, Shanghai, Guangzhou, Chengdu), three critical findings emerge:
(1) Dominance of grid carbon intensity. EVs exhibit significant carbon reduction advantages in low-CEG regions, even with doubled annual mileage. For example, in Chengdu (CEG = 0.1 kgCO2/kWh), A0-class EVs emitted only 1.2–1.7 tCO2/year at 1.5 × ICEV mileage (x = 1.5), 37–54% lower than comparable ICEVs (1.9–2.8 tCO2/year). Conversely, in high-CEG regions like Guangzhou (CEG = 0.6379 kgCO2/kWh), C-class EV SUVs emitted up to 5.32 tCO2/year under doubled mileage (x = 2), exceeding the 4.80 tCO2/year threshold of ICEVs’ 75th percentile.
(2) Behavioral impact of mileage intensity. Higher annual mileage among EV owners (1.5–2 × ICEV baselines) accelerates emission accumulation. At CEG = 0.8 kgCO2/kWh, doubling EV mileage (x = 2) increased A-class SUV emissions by 62.5% (from 2.1 to 3.4 tCO2/year), eroding per-kilometer advantages. In coal-dependent grids (CEG > 0.6 kgCO2/kWh), B-class EVs with x = 2 emitted 3.8 tCO2/year, surpassing ICEV baselines (3.5 tCO2/year).
(3) Vehicle class heterogeneity. Small, low-energy EVs (e.g., A0-class sedans) consistently outperform ICEVs across all CEG ranges. For instance, an EV with 11.7 kWh/100 km energy consumption generates annual emissions 40–50% lower than those of an ICEV with 5.5 L/100 km fuel consumption, even at x = 2. In contrast, high-energy models (e.g., C-class SUVs) risk carbon parity reversal in high-CEG regions. At CEG = 1.0 kgCO2/kWh, their emissions reach 20.4 kgCO2/100 km, exceeding ICEVs’ 19.2 kgCO2/100 km.
To refine the theoretical framework and strengthen policy guidance, future research on EV carbon reduction should focus on: (1) Full life cycle integration: Expand LCA boundaries to include upstream emissions (battery production, raw material extraction) and end-of-life recycling, particularly for next-generation battery technologies (e.g., solid-state, sodium-ion); (2) Behavioral economics analysis: Investigate drivers of EV owners’ high-mileage behavior (e.g., cost sensitivity, policy incentives) through mixed-method studies (surveys, experiments) to optimize incentive designs; and (3) Global comparative analysis: Compare EV carbon parity thresholds across diverse energy regimes (e.g., Norway’s renewables vs. India’s coal reliance) to develop universally adaptable policy frameworks. Addressing these dimensions will enhance the precision of EV carbon assessments and support global transitions toward sustainable transportation.
Author Contributions
Conceptualization, K.L. and F.L.; methodology, K.L., F.L. and C.G.; validation, K.L., F.L. and C.G.; formal analysis, K.L. and F.L.; data curation, F.L. and C.G.; writing—original draft preparation, K.L. and F.L.; writing—review and editing, K.L., F.L. and C.G.; visualization, F.L.; supervision, K.L.; project administration, K.L.; funding acquisition, K.L. All authors have read and agreed to the published version of the manuscript.
Funding
This research was funded by “Ministry of Education Humanities and Social Sciences Youth Research Fund, grant number 24YJCZH172”, “Jiangsu Provincial Social Science Fund Project, grant number 24SHB002” and “The APC was funded by Fangfang Liu”.
Data Availability Statement
Data will be made available on reasonable request.
Conflicts of Interest
The authors declare no conflicts of interest.
References
- Liu, R.; Ding, Z.; Wang, Y.W. The relationship between symbolic meanings and adoption intention of electric vehicles in China: The moderating effects of consumer self-identity and face consciousness. J. Clean. Prod. 2021, 288, 125116. [Google Scholar] [CrossRef]
- Adu-Gyamfi, G.; Song, H.; Asamoah, A.N.; Li, L.; Nketiah, E.; Obuobi, B.; Adjei, M.; Cudjoe, D. Towards sustainable vehicular transport: Empirical assessment of battery swap technology adoption in China. Technol. Forecast. Soc. Change 2022, 184, 121995. [Google Scholar] [CrossRef]
- Jansson, J.; Nordlund, A.; Westin, K. Examining drivers of sustainable consumption: The influence of norms and opinion leadership on electric vehicle adoption in Sweden. J. Clean. Prod. 2017, 154, 176–187. [Google Scholar] [CrossRef]
- Wongsunopparat, S.; Cherian, P. Study of factors influencing consumers to adopt EVs (Electric Vehicles). Bus. Econ. Res. 2023, 13, 155. [Google Scholar] [CrossRef]
- Kurien, C.; Srivastava, A.K. Impact of electric vehicles on indirect carbon emissions and the role of engine posttreatment emission control strategies. Integr. Environ. Assess. Manag. 2020, 16, 234–244. [Google Scholar] [CrossRef]
- Shen, W.; Han, W.; Wallington, T.J.; Winkler, S.L. China electricity generation greenhouse gas emission intensity in 2030: Implications for electric vehicles. Environ. Sci. Technol. 2019, 53, 6063–6072. [Google Scholar] [CrossRef]
- Hsieh, I.Y.L.; Chossière, G.P.; Gençer, E.; Chen, H.; Barrett, S.; Green, W.H. An integrated assessment of emissions, air quality, and public health impacts of China’s transition to electric vehicles. Environ. Sci. Technol. 2022, 56, 6836–6846. [Google Scholar] [CrossRef]
- Wu, Z.; Wang, M.; Zheng, J.; Sun, X.; Zhao, M.; Wang, X. Life cycle greenhouse gas emission reduction potential of battery electric vehicle. J. Clean. Prod. 2018, 190, 462–470. [Google Scholar] [CrossRef]
- de Souza, L.L.P.; Lora, E.E.S.; Palacio, J.C.E.; Rocha, M.H.; Renó, M.L.G.; Venturini, O.J. Comparative environmental life cycle assessment of conventional vehicles with different fuel options, plug-in hybrid and electric vehicles for a sustainable transportation system in Brazil. J. Clean. Prod. 2018, 203, 444–468. [Google Scholar] [CrossRef]
- Joshi, A.; Sharma, R.; Baral, B. Comparative life cycle assessment of conventional combustion engine vehicle, battery electric vehicle and fuel cell electric vehicle in Nepal. J. Clean. Prod. 2022, 379, 134407. [Google Scholar] [CrossRef]
- Xu, M.; Weng, Z.; Xie, Y.; Chen, B. Environment and health co-benefits of vehicle emission control policy in Hubei, China. Transp. Res. D 2023, 120, 103773. [Google Scholar] [CrossRef]
- Liu, K.; Xu, Y. Exploring disparities and similarities in daily travel mode choices between electric vehicle owners and internal combustion engine vehicle owners. Transp. Lett. 2024, 1–16. [Google Scholar] [CrossRef]
- Hunt, R.G.; Sellers, J.D.; Franklin, W.E. Resource and Environmental Profile Analysis of Nine Beverage Container Alternatives; Environmental Protection Agency: Washington, DC, USA, 1974. [Google Scholar]
- International Organization for Standardization. Environmental Management—Life Cycle Assessment—Principles and Framework (ISO Standard No. 14040). 2006. Available online: https://www.iso.org (accessed on 11 April 2025).
- Guinée, J.B.; Heijungs, R.; Huppes, G.; Zamagni, A.; Masoni, P.; Buonamici, R.; Ekvall, T.; Rydberg, T. Life cycle assessment: Past, present, and future. Environ. Sci. Technol. 2011, 45, 90–96. [Google Scholar] [CrossRef] [PubMed]
- Farzaneh, F.; Jung, S. Lifecycle carbon footprint comparison between internal combustion engine versus electric transit vehicle: A case study in the U.S. J. Clean. Prod. 2023, 390, 136111. [Google Scholar] [CrossRef]
- Qiao, Q.; Zhao, F.; Liu, Z.; He, X.; Hao, H. Life cycle greenhouse gas emissions of Electric Vehicles in China: Combining the vehicle cycle and fuel cycle. Energy 2019, 177, 222–233. [Google Scholar] [CrossRef]
- Zhang, H.; Zhao, F.; Hao, H.; Liu, Z. Comparative analysis of life cycle greenhouse gas emission of passenger cars: A case study in China. Energy 2023, 265, 126282. [Google Scholar] [CrossRef]
- Ellingsen, L.A.W.; Singh, B.; Strømman, A.H. The size and range effect: Lifecycle greenhouse gas emissions of electric vehicles. Environ. Res. Lett. 2016, 11, 054010. [Google Scholar] [CrossRef]
- Aljohani, T.; Alzahrani, G. Life Cycle Assessment to Study the Impact of the Regional Grid Mix and Temperature Differences on the GHG Emissions of Battery Electric and Conventional Vehicles. In Proceedings of the 2019 SoutheastCon, Huntsville, AL, USA, 11–14 April 2019; pp. 1–9. [Google Scholar]
- Rahman, M.M.; Zhou, Y.; Rogers, J.; Chen, V.; Sattler, M.; Hyun, K. A comparative assessment of CO2 emission between gasoline, electric, and hybrid vehicles: A Well-To-Wheel perspective using agent-based modeling. J. Clean. Prod. 2021, 321, 128931. [Google Scholar] [CrossRef]
- Singh, M.; Yuksel, T.; Michalek, J.J.; Azevedo, I.M.L. Ensuring greenhouse gas reductions from electric vehicles compared to hybrid gasoline vehicles requires a cleaner U.S. electricity grid. Sci. Rep. 2024, 14, 1639. [Google Scholar] [CrossRef]
- Hawkins, T.R.; Singh, B.; Majeau-Bettez, G.; Strømman, A.H. Comparative environmental life cycle assessment of conventional and electric vehicles. J. Ind. Ecol. 2013, 17, 53–64. [Google Scholar] [CrossRef]
- Petrauskienė, K.; Skvarnavičiūtė, M.; Dvarionienė, J. Comparative environmental life cycle assessment of electric and conventional vehicles in Lithuania. J. Clean. Prod. 2020, 246, 119042. [Google Scholar] [CrossRef]
- Nuez, I.; Ruiz-García, A.; Osorio, J. A comparative evaluation of CO2 emissions between internal combustion and electric vehicles in small isolated electrical power systems—Case study of the Canary Islands. J. Clean. Prod. 2022, 369, 133252. [Google Scholar] [CrossRef]
- Li, Y.; Ha, N.; Li, T. Research on Carbon Emissions of Electric Vehicles throughout the Life Cycle Assessment Taking into Vehicle Weight and Grid Mix Composition. Energies 2019, 12, 3612. [Google Scholar] [CrossRef]
- Sobol, Ł.; Dyjakon, A. The influence of power sources for charging the batteries of electric cars on CO2 emissions during daily driving: A case study from Poland. Energies 2020, 13, 4267. [Google Scholar] [CrossRef]
- Qiao, Q.; Zhao, F.; Liu, Z.; Jiang, S.; Hao, H. Cradle-to-gate greenhouse gas emissions of battery electric and internal combustion engine vehicles in China. Appl. Energy 2017, 204, 1399–1411. [Google Scholar] [CrossRef]
- Hao, H.; Qiao, Q.; Liu, Z.; Zhao, F. Impact of recycling on energy consumption and greenhouse gas emissions from electric vehicle production: The China 2025 case. Resour. Conserv. Recycl. 2017, 122, 114–125. [Google Scholar] [CrossRef]
- Wang, N.; Tang, G. A review on environmental efficiency evaluation of new energy vehicles using life cycle analysis. Sustainability 2022, 14, 3371. [Google Scholar] [CrossRef]
- Buberger, J.; Kersten, A.; Kuder, M.; Eckerle, R.; Weyh, T.; Thiringer, T. Total CO2-equivalent life-cycle emissions from commercially available passenger cars. Renew. Sustain. Energy Rev. 2022, 159, 112158. [Google Scholar] [CrossRef]
- Hao, H.; Cheng, X.; Liu, Z.; Zhao, F. Electric vehicles for greenhouse gas reduction in China: A cost-effectiveness analysis. Transp. Res. D 2017, 56, 68–84. [Google Scholar] [CrossRef]
- Das, P.K.; Bhat, M.Y.; Sajith, S. Life cycle assessment of electric vehicles: A systematic review of literature. Environ. Sci. Pollut. Res. 2024, 31, 73–89. [Google Scholar] [CrossRef]
- Alishaq, A.; Cooper, J.; Woods, J.; Mwabonje, O. Environmental impacts of battery electric light-duty vehicles using a dynamic life cycle assessment for qatar’s transport system (2022 to 2050). Int. J. Life Cycle Assess. 2025, 30, 110–120. [Google Scholar] [CrossRef]
- Naseri, H.; Waygood, E.O.D.; Patterson, Z.; Wang, B. Which variables influence electric vehicle adoption? Transportation 2024, 1–28. [Google Scholar] [CrossRef]
- Chowdhury, V.; Mitra, S.K.; Hernandez, S. Electric Vehicle Usage Patterns in Multi-Vehicle Households in the US: A Machine Learning Study. Sustainability 2024, 16, 5200. [Google Scholar] [CrossRef]
- Mitropoulos, L.K.; Prevedouros, P.D. Life cycle emissions and cost model for urban light duty vehicles. Transp. Res. D 2015, 41, 147–159. [Google Scholar] [CrossRef]
- Wang, X. A view of Beijing’s traffic policy: Evaluation on the policies released in 2010 to ease traffic congestion. Macro Manag. Public Policy 2021, 3, 45–52. [Google Scholar] [CrossRef]
- Li, G.; Walls, W.D.; Zheng, X. Differential license plate pricing and electric vehicle adoption in Shanghai, China. Transp. Res A 2023, 172, 103672. [Google Scholar] [CrossRef]
- Apostolaki-Iosifidou, E.; Codani, P.; Kempton, W. Measurement of power loss during electric vehicle charging and discharging. Energy 2017, 127, 730–742. [Google Scholar] [CrossRef]
- Ahmad, F.; Iqbal, A.; Ashraf, I.; Marzband, M.; Khan, I. Placement of electric vehicle fast charging stations in distribution network considering power loss, land cost, and electric vehicle population. Energy Sources Part A 2022, 44, 1693–1709. [Google Scholar] [CrossRef]
- Ding, Q.; Wu, Z.; He, Y.; Zhou, M.; Long, S. A novel approach to transmission loss rate calculation for electricity transactions. In Proceedings of the 2017 China International Electrical and Energy Conference (CIEEC), Beijing, China, 25–27 October 2017; pp. 215–222. [Google Scholar]
- Majid, Z.S.; Arief, A.; Akil, Y.S. Minimization of Transmission Loss in Application of HVDC Networks under Load Increase Scenario. Int. J. Electr. Electron. Eng. Telecommun. 2021, 10, 333–340. [Google Scholar] [CrossRef]
- IPCC. 2006 IPCC Guidelines for National Greenhouse Gas Inventories; Intergovernmental Panel on Climate Change: Geneva, Switzerland, 2006. [Google Scholar]
- Lajunen, A. Energy consumption and cost-benefit analysis of hybrid and electric city buses. Transp. Res. C 2014, 38, 1–15. [Google Scholar] [CrossRef]
- Costagliola, M.A.; Costabile, M.; Prati, M.V. Impact of road grade on real driving emissions from two Euro 5 diesel vehicles. Appl. Energy 2018, 231, 586–593. [Google Scholar] [CrossRef]
- Fiori, C.; Arcidiacono, V.; Fontaras, G.; Makridis, M.; Mattas, K.; Marzano, V.; Thiel, C.; Ciuffo, B. The effect of electrified mobility on the relationship between traffic conditions and energy consumption. Transp. Res. D 2019, 67, 275–290. [Google Scholar] [CrossRef]
- Pielecha, J.; Skobiej, K.; Kubiak, P.; Wozniak, M.; Siczek, K. Exhaust Emissions from Plug-in and HEV Vehicles in Type-Approval Tests and Real Driving Cycles. Energies 2022, 15, 2423. [Google Scholar] [CrossRef]
- Hao, X.; Wang, H.; Lin, Z.; Ouyang, M. Seasonal effects on electric vehicle energy consumption and driving range: A case study on personal, taxi, and ridesharing vehicles. J. Clean. Prod. 2020, 249, 119403. [Google Scholar] [CrossRef]
- Serin, D.A.; Serin, O. Analysis of Energy Consumption and Performance of BEV, HEV and an ICEV: A Case Study of Real-Life Road Simulation. Acad. Perspect. Proc. 2022, 5, 50–59. [Google Scholar] [CrossRef]
- Yang, L.; Yu, B.; Yang, B.; Chen, H.; Malima, G.; Wei, Y.M. Life cycle environmental assessment of electric and internal combustion engine vehicles in China. J. Clean. Prod. 2021, 285, 124899. [Google Scholar] [CrossRef]
- EIA. Electric Power Monthly. 2024. Available online: https://www.eia.gov/electricity/monthly/ (accessed on 11 April 2025).
- Tian, Z.; Xia, G.; Duan, M.; Ouyang, Z.; Gong, D.; Mu, X.; Li, H. Research on Energy Efficiency Measurement Scheme for Electric Vehicle DC Charging Pile. In Proceedings of the 2021 IEEE 4th International Conference on Electronics Technology (ICET), Chengdu, China, 7–10 May 2021. [Google Scholar]
- National Energy Administration. Statistical Data on China’s Power Industry; National Energy Administration: Beijing, China, 2024. Available online: http://www.nea.gov.cn (accessed on 11 April 2025).

Disclaimer/Publisher’s Note: The statements, opinions and data contained in all publications are solely those of the individual author(s) and contributor(s) and not of MDPI and/or the editor(s). MDPI and/or the editor(s) disclaim responsibility for any injury to people or property resulting from any ideas, methods, instructions or products referred to in the content. |
© 2025 by the authors. Licensee MDPI, Basel, Switzerland. This article is an open access article distributed under the terms and conditions of the Creative Commons Attribution (CC BY) license (https://creativecommons.org/licenses/by/4.0/).