Abstract
Microcystin-LR (MCLR) is a toxin produced by harmful algal blooms that is emerging as a threat to drinking and recreational water systems worldwide. Nanofiltration (NF) is an effective technique for purifying contaminated water sources; however, membrane fouling caused by coexisting organic matter limits the practicality of the process. This research studies the use of an electrocoagulation (EC) pretreatment to limit fouling during the NF process. Water for this study was taken from Lake Fayetteville, a local body of water where MCLR concentrations have been recorded to be >15 µg/L. EC was performed using polyaluminum chloride as a background electrolyte at various operating conditions. EC-treated water was then further treated with NF to assess the impact of the EC pretreatment on NF fouling. It was found that the larger particle size of the sludge produced using aluminum electrodes at pH 7 had the best combination of settling ability and organic carbon removal (92%). This also led to the smallest flux decline during six-hour NF experiments of just 9%. These results highlight the potential of an EC pretreatment as an antifouling technique for the NF treatment of water contaminated with algal toxins.
1. Introduction
Harmful algal blooms (HABs) pose serious threats to ecosystems worldwide. These HABs are well known for consuming nutrients and dissolved oxygen, which leads to plant and animal death [1]. A lesser-known impact of HABs is the metabolic production of a class of toxins known as cyanotoxins [2]. Recreational exposure to cyanotoxins can lead to fever, headaches, diarrhea, vomiting, ulcers, etc., and acute exposure can lead to seizures, liver failure, and potentially cancer or death [3]. Of these cyanotoxins, Microcystin-LR (MCLR) is typically the most detected and known to be the most toxic. The World Health Organization (WHO) has set the guideline for MCLR to be 1 µg/L for drinking water and 10 µg/L for recreational exposure [4]. Many states have adopted lower levels of <0.5 µg/L as points to act and enact drinking or recreational activity bans. This includes Lake Fayetteville, which for the past five years has been closed for recreational activities due to the detection of MCLR above the action limit of 0.3 µg/L. At its peak, Lake Fayetteville has seen MCLR levels of ≥15 µg/L [5].
MCLR management is a complex task that involves the consideration of both intracellular and extracellular toxins. The rupture of the cyanobacteria cells within the bloom either naturally or during treatment processes can lead to the accumulation of extracellular toxins to dangerous levels [6]. Conventional water treatment processes such as coagulation–flocculation can remove cyanobacteria but struggle to remove cyanotoxins [7]. Extracellular toxin is typically remediated through treatment with potassium permanganate, ozone, free chlorine, UV radiation, or activated carbon [8,9,10,11]. Membrane technologies offer a promising alternative as a method of removing extracellular microcystins. Nanofiltration (NF) is an appropriate membrane process for the removal of MCLR based on the size of the molecule. NF membranes are known to have a molecular weight cutoff (MWCO) of ≤200 Da while the size of MCLR is 994 Da. Multiple studies have been published using NF for the removal of MCLR with rejection consistently reaching ≥97 according to reports [12,13,14]. The advantages of NF processes for MCLR removal include this strong rejection, scalability, reliability, and a lack of toxic byproducts. The practical limitation of using NF to remove extracellular MCLR is membrane fouling [15,16]. Natural organic matters (NOMs), including polysaccharides, proteins, and humic and fulvic acids, coexist with MCLR in lake waters and have been shown to lead to membrane fouling [17,18]. Pretreatment [19,20,21] and the surface modification of the membrane [22,23,24] are used to prevent organic fouling during NF.
This research focused on the use of electrocoagulation (EC) as a pretreatment to address membrane fouling during NF. Water for this study was taken from Lake Fayetteville in Fayetteville, AR. This lake was chosen due to regular occurrences of extracellular MCLR since 2019. EC is an attractive pretreatment process since it does not rely on size exclusion to remove NOMs and other membrane foulants. Instead, EC accomplishes the removal of these compounds through a coagulation–flocculation process. Electrodes are placed in situ and the following electrochemical reactions then take place:
Anode:
M → MX+ + X e−
Cathode:
where M corresponds to the metal used for the electrodes. Metal cations that are produced through the oxidation of the sacrificial anode combine with hydroxide anions that form through the reduction of water at the cathode to form an insoluble hydroxide precipitate. Contaminants are removed by these precipitates through adsorption [25]. Further, H2 gas produced at the cathode forms a foam that provides an additional removal mechanism by flotation. Through these processes, NOMs and MCLR are isolated in the sludge created during flocculation and the foam formed during floatation. The sludge and foam can then be separated from the treated water, thus concentrating and removing the contaminant and foulants of interest. Contaminant removal depends on the identity and properties of the contaminant, the composition of the feed water, and the EC operating conditions. Smaller contaminants may require a filtration step such as NF to ensure complete removal after EC. EC has successfully been used to capture both cyanobacteria and MCLR from surface waters. Multiple studies report successful cyanobacteria removal without stimulating further MCLR release [26,27], as well as an 80%+ removal of MCLR using different anode materials under optimized conditions [28,29,30,31]. This versatile and nonspecific method has potential further utility in the concentration and degradation of other emerging contaminants that are toxic in trace amounts similar to MCLR [32].
2 H2O + 2e− → H2 + 2 OH−
Coagulation pretreatment is a common practice for membrane filtration. The advantages of EC over chemical coagulation have been well documented, namely, a better removal of small colloidal species, more separable flocs, a lower sludge volume, and lower reaction times all leading to lower operating costs and simpler operation [33]. In addition to the mechanical removal methods of flocculation and flotation, additional destabilizations of colloidal species lead to the promotion of adsorption onto the floc. The applied electric field in the EC process disrupts the electric double layer that stabilizes colloidal particles in solution. Without these repulsive forces present, the aggregation of the particles is favored. Metal ions generated by the sacrificial electrodes may lead to further destabilization through charge neutralization [34]. Additionally, the process is ideal for fouling mitigation pretreatment based on its ability to be scaled into a continuous process and allowing for the use of commercially available membranes. The removal of both organic and inorganic foulants during EC has translated into fouling reduction for the NF of different feed waters, including lake water [35], textile wastewater [36], car wash wastewater [37], brackish water [38], and landfill leachate [39]. Previous work by the Wickramasinghe group has also highlighted the ability to reduce fouling as a continuous pretreatment for membrane distillation [40] and reverse osmosis processes [41]. Other than our previous work and a study by Teixiera et al. [18,21], a gap in the literature exists seeking to apply antifouling techniques to enable the NF of MCLR from naturally occurring sources.
Combining EC with NF may lower operating costs over EC or NF alone given the long operating time necessary to achieve total MCLR removal in a standalone EC process and the costs caused by membrane fouling. To be an effective pretreatment to NF in a continuous setting, EC must effectively remove foulants while allowing for the easy separation of the sludge and treated water. The primary focus of this work was to develop a combined EC-NF process to remove MCLR by determining the optimal EC conditions for the NF process. In a continuous setting, the resonance time of the water in the EC reactor would be manipulated to provide enough time for the sludge to settle. Therefore, it is favorable for the sludge generated during the process to settle quickly to the bottom of the reactor. This project sought to investigate the effect of different EC operating conditions on dissolved organic carbon (DOC) removal and the settling ability of generated sludge, as well as the associated impact on subsequent NF fouling. DOC concentration was used as a method to account for multiple different types of NOM foulants simultaneously [42]. Operating conditions included the electrode material used, reaction time, initial pH, and electrolyte concentration. In water systems of low conductivity, it is common to add an electrolyte to reduce the applied voltage needed to achieve the desired current. Here the use of polyaluminum chloride (PAC) as an electrolyte was investigated. PAC was chosen since it is a known chemical coagulant and may introduce additional sludge formation mechanisms in addition to acting as a supporting electrolyte [43]. It was expected that the EC would be responsible for removing the majority of organic foulants present while only a smaller percentage of the MCLR. The NF step that followed the EC was carried out in tangential flow to model the recycling of uncaptured MCLR back to the EC where it could be captured in a subsequent pass. The optimal EC conditions were chosen based on their ability to produce a sludge that readily settles, allowing for the rapid separation of the treated water in a continuous setting, and resulting in an NF fouling decrease. No such study seeking to identify these optimal conditions for the treatment of real water has been reported previously. This study also addresses the existing gap in the literature relating to understanding the impact of antifouling techniques on the NF treatment of real water systems contaminated with MCLR.
2. Materials and Methods
2.1. Materials
The water used in this study was collected directly from Lake Fayetteville at the same location each time between December 2024 and February 2025. Water properties are reported in Table 1 and were collected using EPA standard methods [44]. Prior to adding PAC, bovine serum albumin (BSA) (Microbiological Grade, Millipore Corporation, Kanakakee, IL, USA) and sodium alginate (Thermo Scientific Chemicals, Waltham, MA, USA) were added at 10 ppm to supplement the naturally occurring natural organic matter (NOM) present. This was conducted both because BSA and alginate are known membrane foulants [24] and to account for potential seasonal variations in NOM content. Further, these higher concentrations of NOM were used to mimic areas of the lake with higher NOM content to ensure the system would be effective at treating the toxin at the point of generation. PAC in solution was provided by Kemira (Helinski, Finland) at a concentration of 18–32%. MCLR was purchased from Enzo Life Sciences (≥95%, Farmingdale, NY, USA) and spiked into the solution at a concentration of 10 ppb during the MCLR removal studies.

Table 1.
Lake Fayetteville water properties.
2.2. Electrocoagulation Process
EC was carried out in a custom-made polycarbonate reactor with notches cut to suspend the metal electrodes in solution. The inter electrode distance and effective electrode area were fixed at 1.0 cm and 700 cm2, respectively [45]. Five electrodes of either aluminum, iron, or zinc were mounted in the reactor and submerged in 500 mL of feed water. These metals were chosen based on previous reports describing their ability to capture algae during EC [27]. A DC power supply was connected to the electrodes such that the system was operated in a bipolar configuration. Experiments were performed at a constant current between 0.15 and 0.71 A at a constant voltage of 32 V. The EC process was run for 5, 10, and 15 min. After the process was completed, the solution was left to sediment for at least two hours prior to collecting samples for DOC or MCLR concentration analysis. The DOC concentration was measured by a TOC analyzer (OI Analytical, College Station, TX, USA) (USEPA Method 9060A [46]). Samples were filtered through a 0.22 µm filter prior to DOC analysis. The MCLR concentration was measured by liquid chromatography mass spectrometry (LCMS) (Shimadzu 8040, Kyoto, Japan) during experiments assessing MCLR removal. Added PAC was removed using solid phase extraction prior to LCMS analysis. After sedimentation, the supernatant was vacuum filtered through a 10 µM filter to remove any particulate present in the supernatant prior to NF. Two concentrations of PAC were studied: 0.44–0.88 g/L and 0.11–0.22 g/L. The higher concentration of PAC dropped the pH to approximately 4 while the lower concentration dropped the pH less. Based on this observation, one set of experiments was conducted at pH 4 and pH 7 at 0.44–0.88 g/L PAC to understand the differences in DOC removal and sludge settling ability at different pH values. The experiments were conducted at pH 7 through the addition of NaOH after PAC. A basic pH value was not investigated to avoid further NaOH addition and because acidic and neutral pH values promote the formation of more positively charged flocs which have been shown to better adsorb negatively charged algae [47]. After this, the electrolyte concentration was reduced to 0.11–0.22 g/L at pH 7 to understand the effect of electrolyte concentration on the system.
2.3. Sludge Characterizations
The settling ability and particle size were compared for the generated sludge at different current and pH values. Particle size was confirmed using Dynamic Light Scattering (DLS) (LS 13,320 Particle Size Analyzer, Beakman Coulter, Brea, CA, USA). Sludge settling tests were performed by transferring the treated solution to a graduated cylinder immediately after treatment. The height of the liquid–sludge interface was monitored over time. The liquid–sludge interface was defined as the interface between clear water and sludge. Settling time was compared between conditions by calculating the dimensionless height H/H0, where H is the height at time t and H0 is the initial liquid–sludge interface height. The final parameter used to characterize the sludge produced at different conditions was the Sludge Volume Index (SVI). The SVI is a frequently used parameter that describes the settling ability of the sludge normalized by the amount produced.
H30 is the height after 30 min of settling and SS is the initial sludge concentration calculated immediately after the EC treatment [40].
2.4. Nanofiltration
NF was performed in a crossflow cell (CF042 Membrane Module, Sterlitech, Auburn, WA, USA) for 6 h following EC (Figure 1). Commercially available flat sheet NF270 membranes (Dupont, Wilmington, DE, USA) with an effective area of 42 × 10−4 m2 were precompacted in the cell for 30 min prior to filtration. Experiments used a volume of 1.5 L and were carried out at 6.9 bar. A control experiment was performed using only vacuum filtration as a pretreatment to study the impact of introducing EC into the process. Fouling was characterized by measuring the permeability decline during filtration and measuring the water contact angle of the membrane after filtration (model 100, Rame-Hart Instrument Company, Netcong, NJ, USA). This measurement involved exposing the membrane to a single drop of distilled water at a rate of 0.5 µL s−1 and imaging the resulting angle between the drop and membrane. The average value of the contact angle from at least five places was reported.
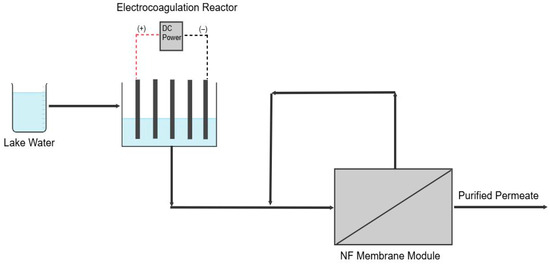
Figure 1.
Schematic of the EC-NF process.
3. Results and Discussion
3.1. Sludge Property Characterization
The particle size of the sludge was confirmed through DLS immediately after the EC process was completed to investigate changes to the sludge using different anode materials and pH values (Figure A1). At pH 7, Al electrodes led to the largest particle size, consistent with the literature findings based on the hydrolysis reactions of Al hydroxide flocs. These hydrolysis reactions result in polymeric species such as Al13(OH)345+ Al13O4(OH)247+ that eventually form large flocs of amorphous Al(OH)3. Fe and Zn do not form these same polymeric species, and thus, the resulting floc particle size is smaller [25,27,40]. The differences in particle size between pH 4 and 7 can be explained by the fact that higher pH favors nucleated growth and the formation of heavier flocs of larger particle sizes [48]. This particle size data can be used to explain settling behaviors of the sludge produced using different anode materials at different pH values and electrolyte concentrations. Figure 2 compares the calculated SVI for each condition to the measured particle size. The SVI accounts for the amount of sludge produced during the process, and a lower SVI indicates better compressibility as the amount of sludge produced increases. Complete settling profiles presenting the normalized height of the liquid–sludge interface, defined as the region where sludge particles cause turbidity, have been provided in Figure A2. As the particle size increased, the SVI tended to decrease. Fe and Zn settled faster at pH 4 compared to pH 7 due to the lower operating current and smaller amount of sludge produced (Table 2). The better settling ability of the Al than the Fe and Zn at pH 7 can be attributed to the larger particle size [49]. Particle size difference can also explain why the Al-treated solution settled at pH 7 but not at pH 4. At pH 4, the smaller sludge particles remained stable such that the liquid–sludge interface did not appear. The Al particles at pH 4 were also much smaller than the Fe and Zn particles at pH 4, explaining why they were more stable in solution and did not settle in the way that Fe and Zn particles did.
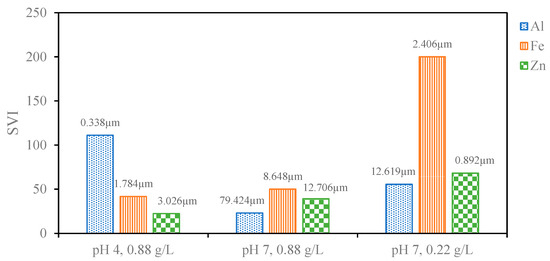
Figure 2.
SVI for sludge produced from different electrode materials at different combinations of pH values and PAC concentrations labeled with the corresponding sludge particle size.
Table 2.
Operating current and Sludge Volume Index (SVI) for electrocoagulation processes with different electrode materials and initial pH values.
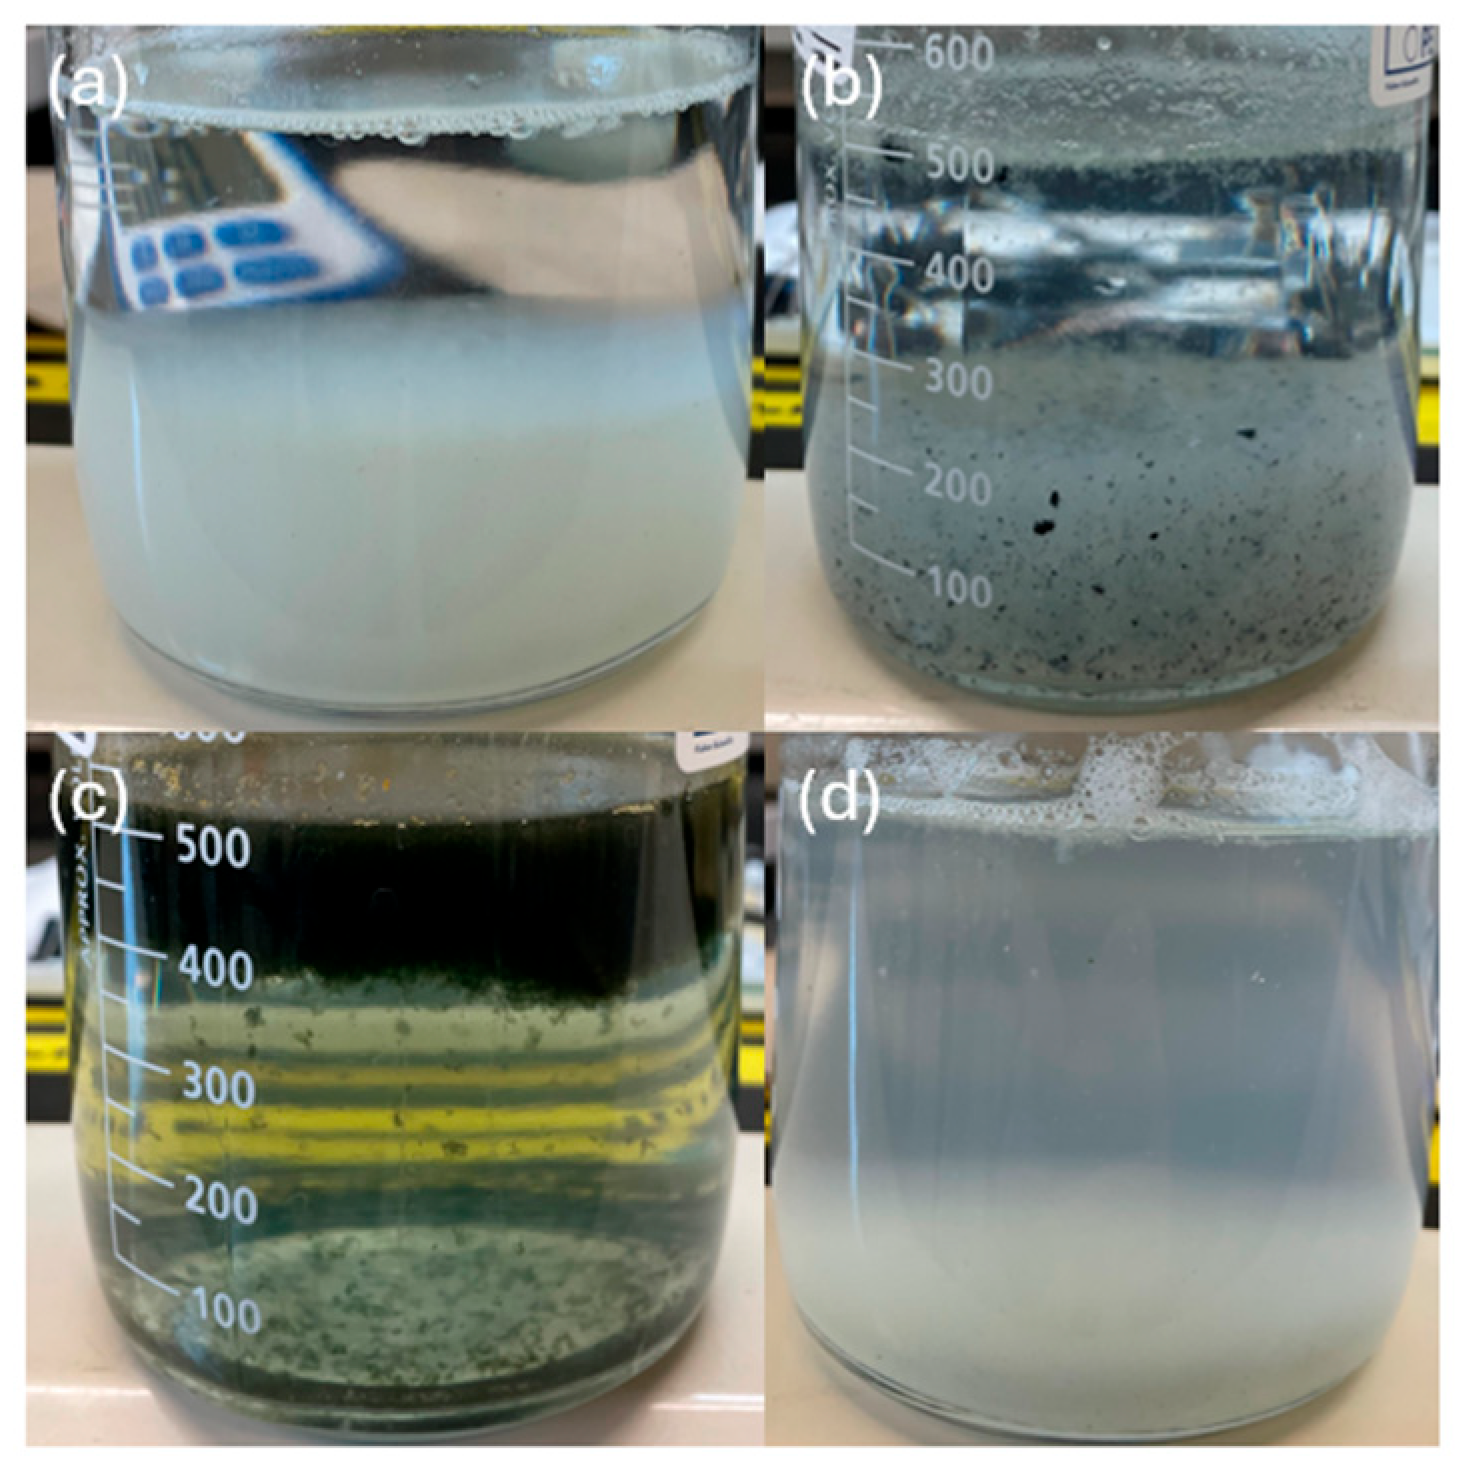
It is also clear that the sludge settles better at higher electrolyte concentrations. At lower electrolyte concentrations, the lower current resulted in less sludge produced and therefore a more dilute sludge concentration. Under these dilute conditions, the particles do not form a cohesive network that leads to faster sedimentation [49]. This led to the sludge floating for a period of time instead of immediately sinking in the case of Fe and Zn, thus leading to longer settling times needed before the supernatant could be collected for NF (Figure 3). The larger particle size of Al under these conditions likely prevented its sludge from floating in the same way, and the larger particle size of Zn likely can explain its faster settling time than that of Fe. The higher operating current at higher electrolyte concentrations led to a lower SVI for each of the anode materials tested, which is in agreement with the observed settling behavior. As expected, based on the measured particle sizes and the observed liquid–sludge interface behavior, the SVI for Fe and Zn at pH 4 are lower than at pH 7, whereas the SVI for Al was very high at pH 4 and much lower at pH 7. The value for Al at pH 7 stands out as lower or comparable to the best values of Fe and Zn, which is also consistent with the particle size measurements and theory that larger particle sizes lead to better compressibility. Since the sludge produced by the Al electrodes at pH 7 is highly compressible even when a high volume of sludge is produced, these conditions are optimal for an NF pretreatment process.

Figure 3.
Sludge suspension of 30 min of sedimentation for EC processes with different electrode materials, initial pH values and electrolyte concentrations, including (a) Al at pH 7 and 0.88 g/L, (b) Zn at pH 4 and 0.88 g/L, (c) Fe at pH 7 and 0.22 g/L, and (d) Al at pH 4 and 0.88 g/L. All samples were left to settle for 30 min prior to imaging to compare the height of the liquid–sludge interface after a constant settling time.
3.2. DOC Removal
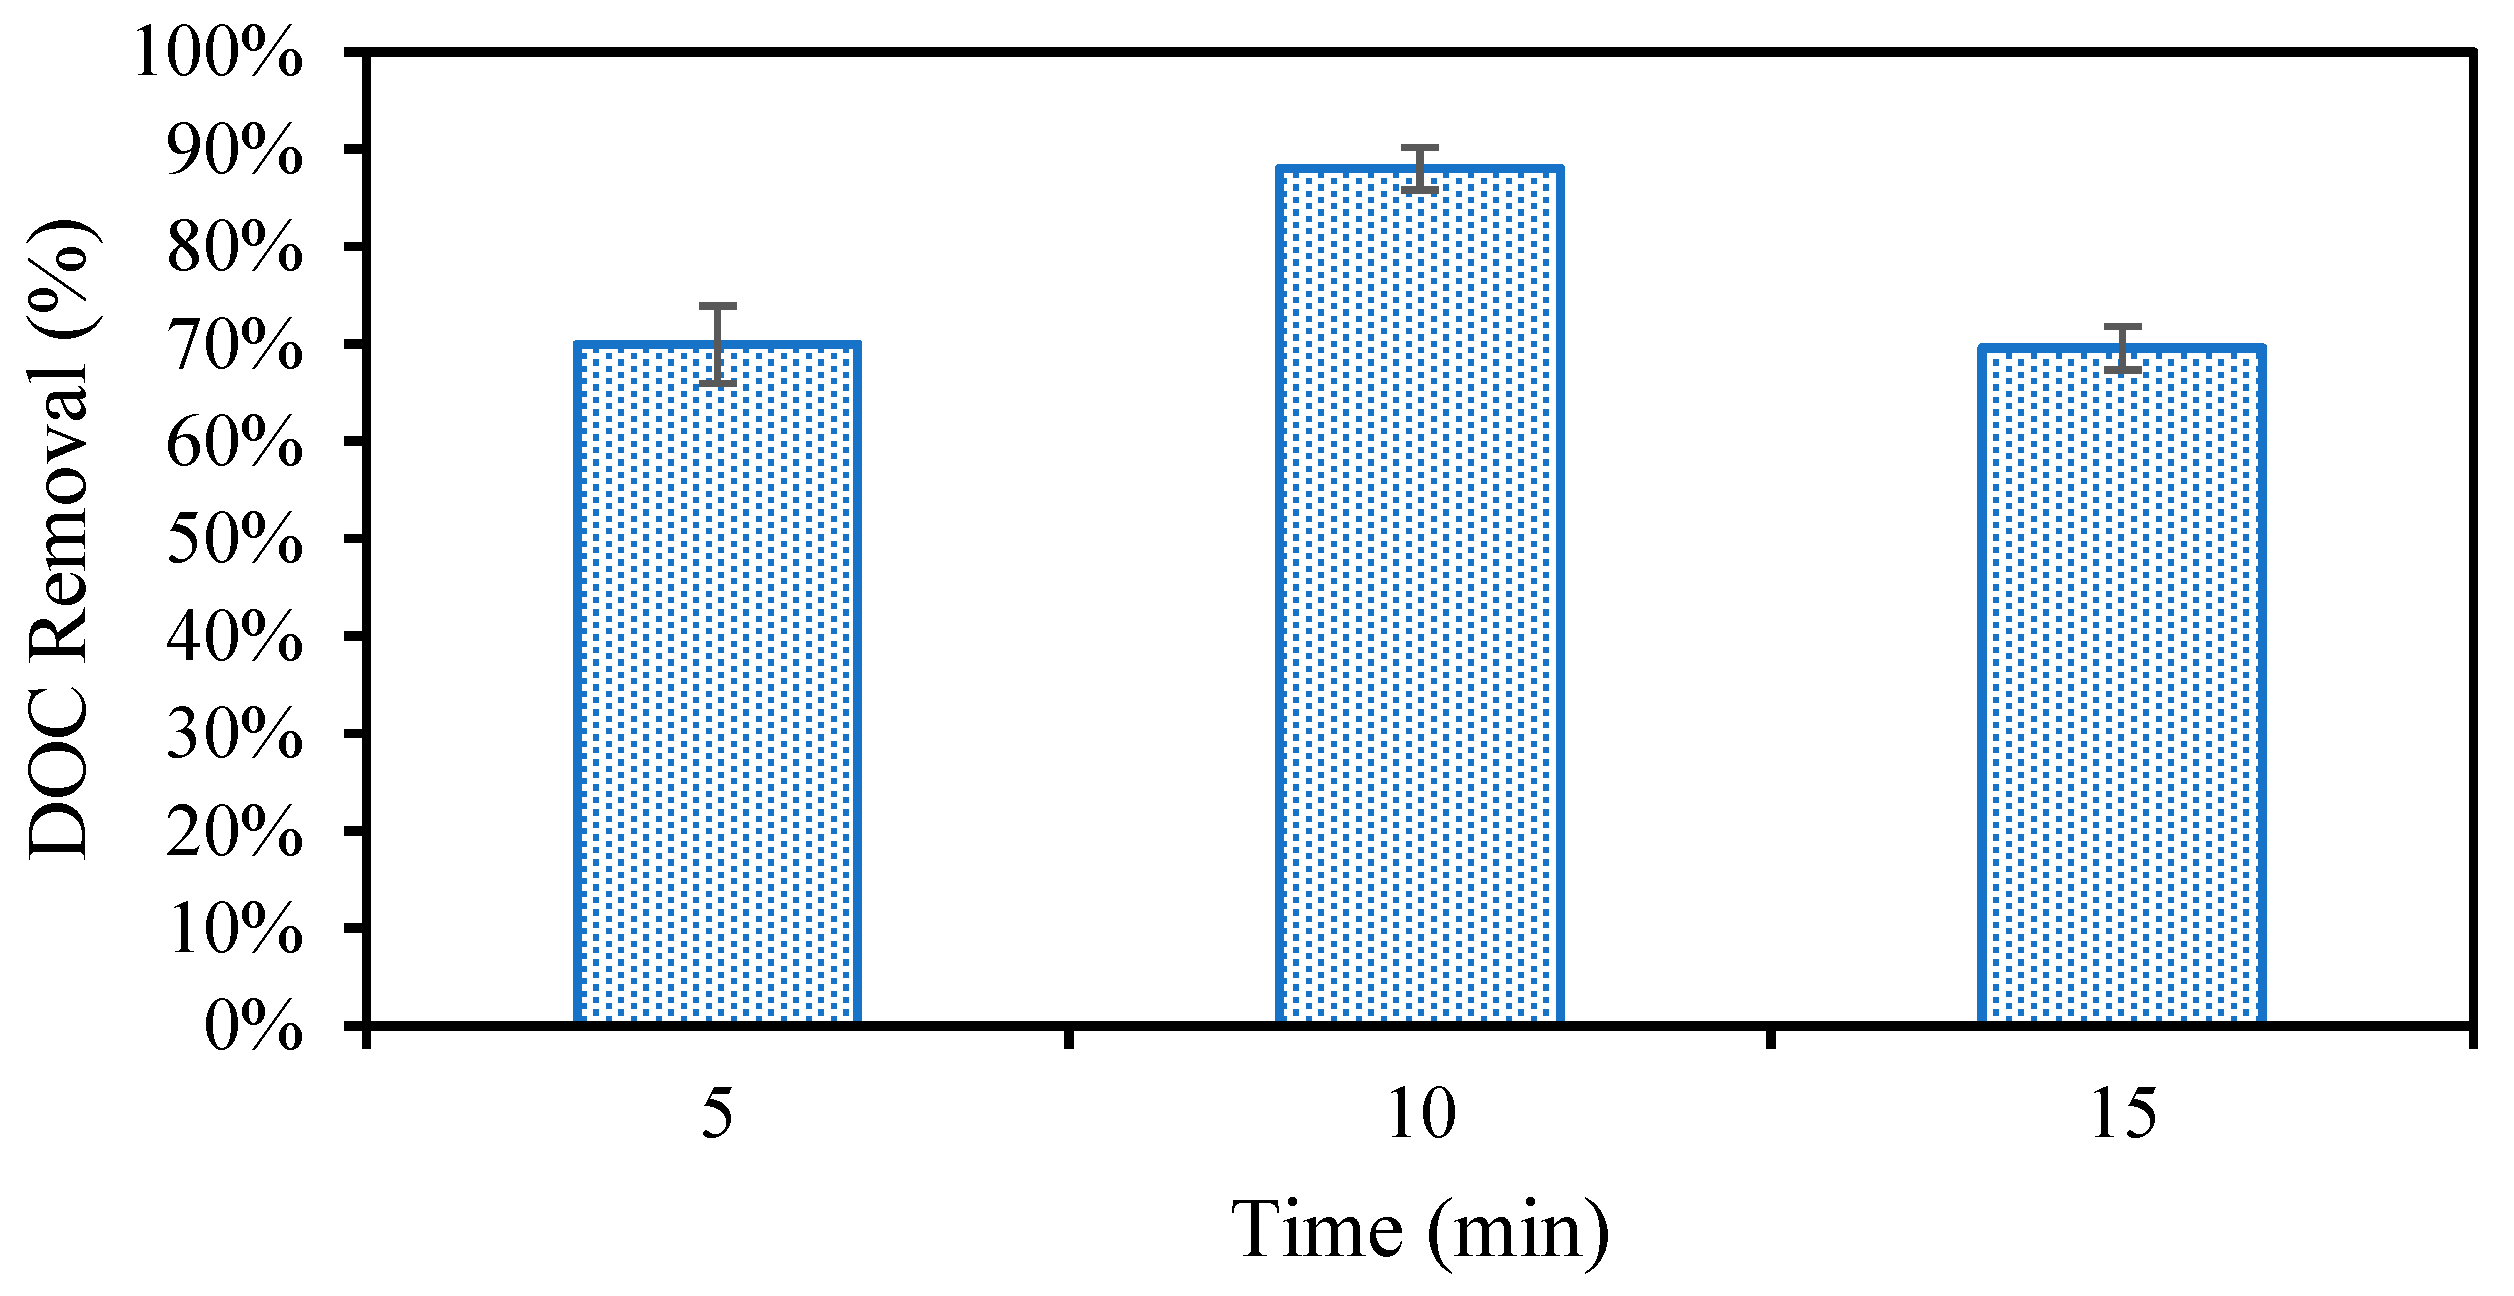
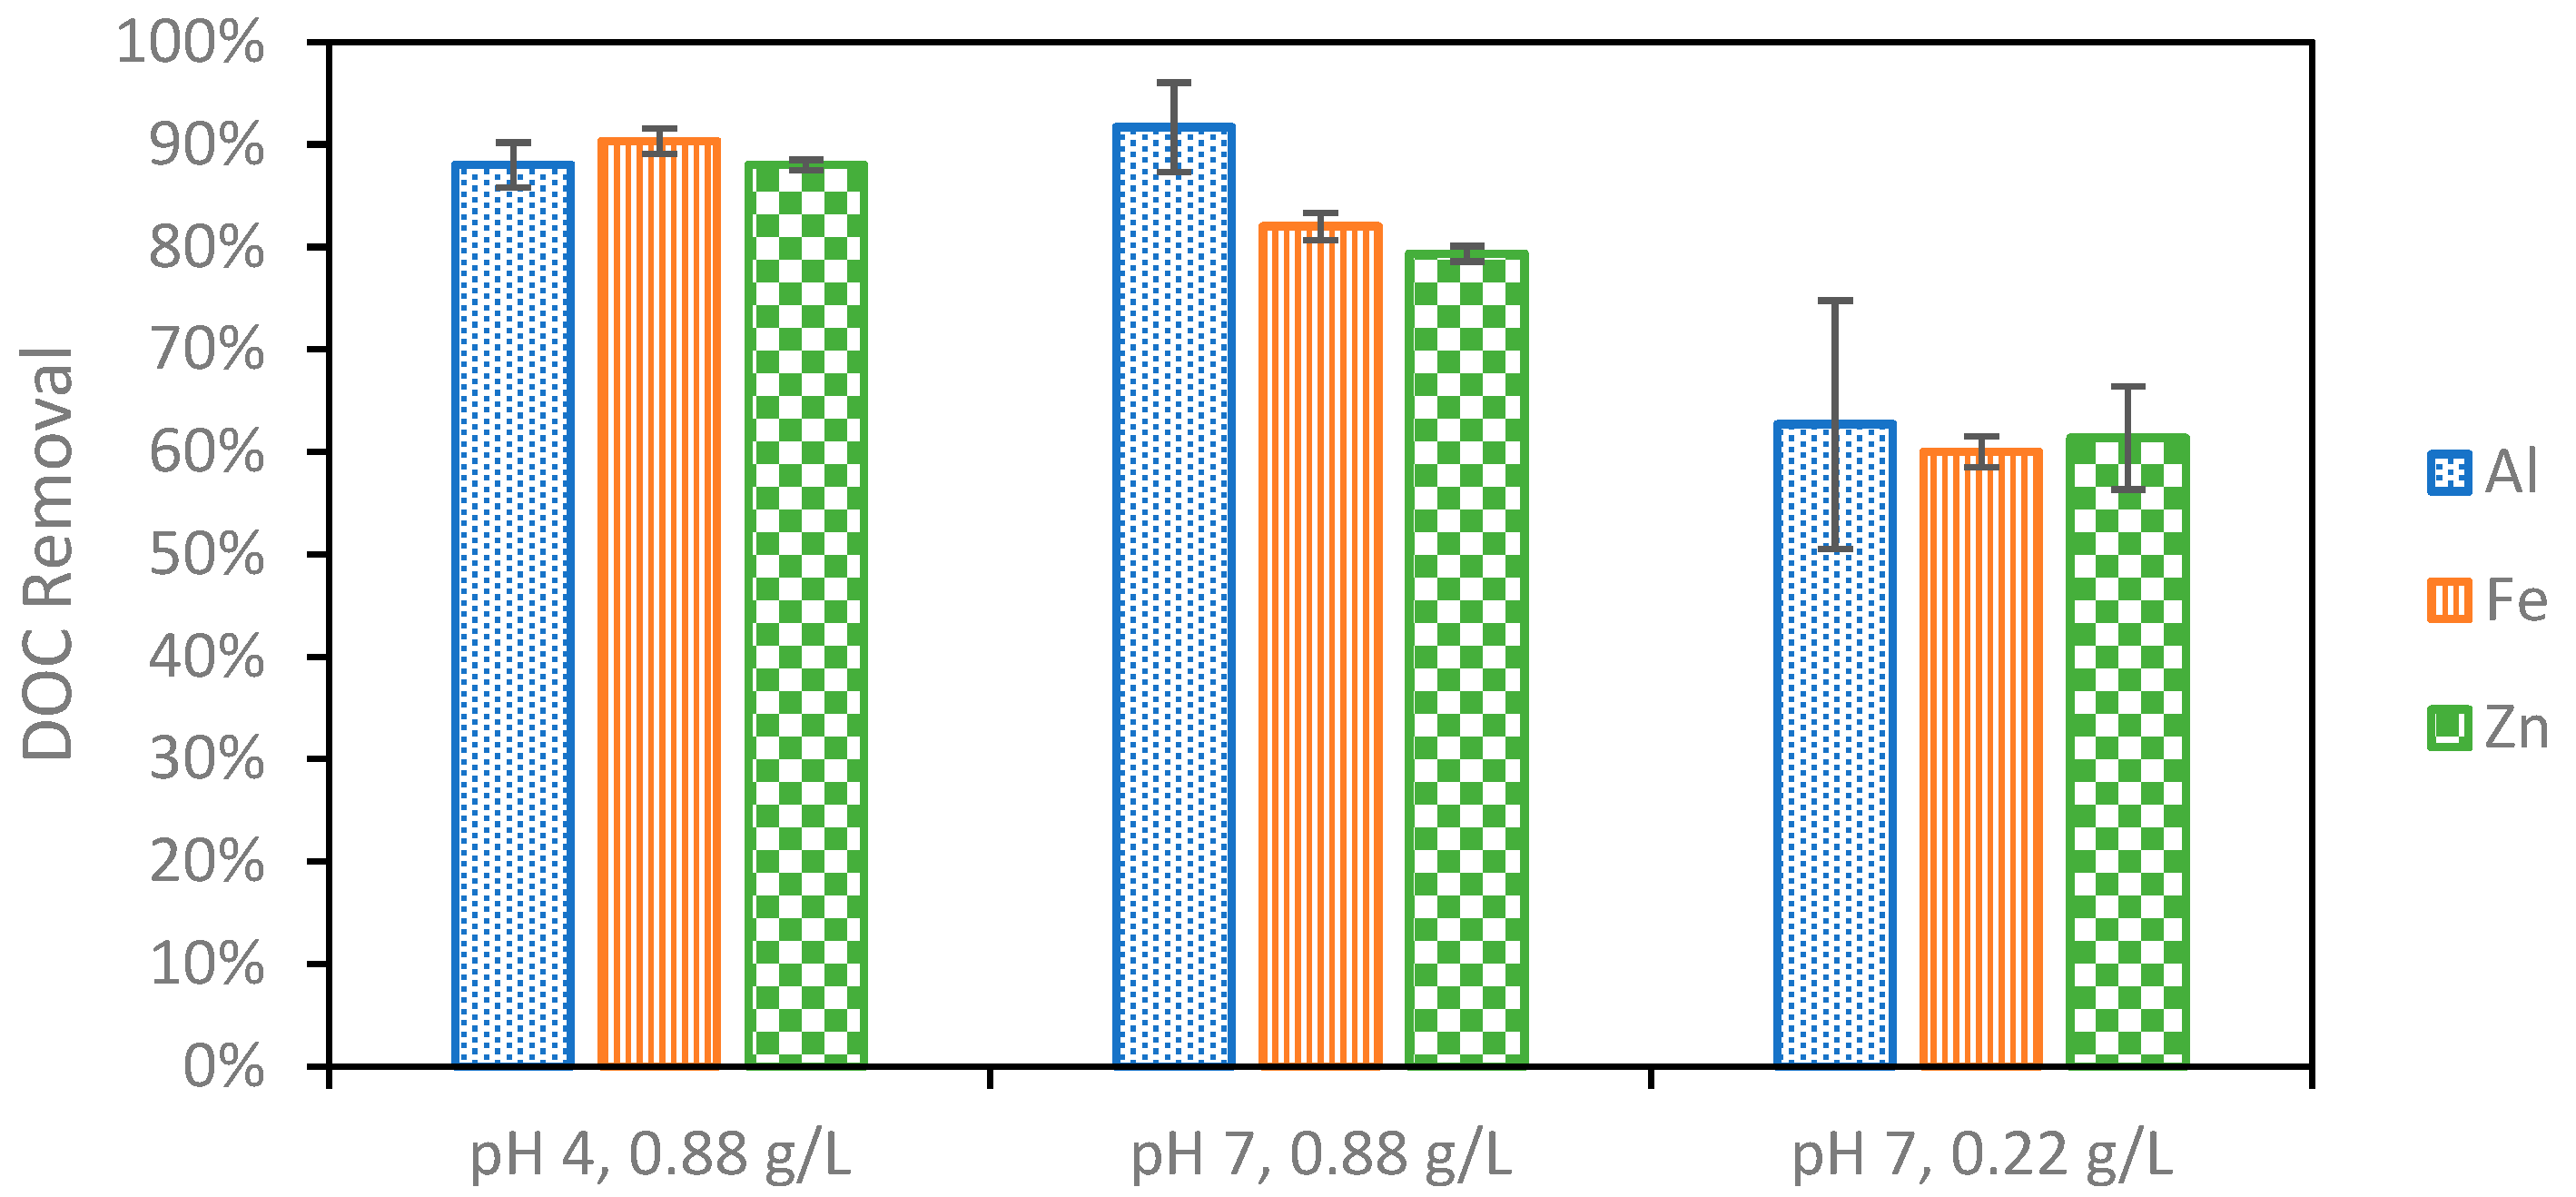
In addition to producing sludge that readily settles, the optimal EC conditions must effectively remove organic compounds that will foul the NF membrane in the following treatment. First, the EC reaction time was studied from 5 to 15 min (Figure 4). It was found that the DOC removal was the greatest at ten minutes. The additional flocculant formed when extending the reaction from five to ten minutes leads to this increase in removal. After ten minutes, however, it is possible that the degradation of the sludge leads to the desorption of organic matter and ultimately a lower overall removal [50]. Once the reaction time was set to ten minutes following the initial investigation, the effect of changing the pH and electrolyte concentration on DOC removal was studied for different anode materials (Figure 5). It was first found that increasing the electrolyte concentration led to additional DOC removal as expected. This could be due to both the higher current reached as a result of additional electrolytes, the increased production of sludge, or the stronger settling ability of the sludge produced under these conditions. DOC removal remained consistent for each of the different metals used at the lower electrolyte concentration. Next, pH 4 and pH 7 were compared for the different electrode materials. Strong DOC removal was observed for all metals at pH 4. DOC removal decreased at pH 7 for Fe and Zn, whereas the DOC removal improved using Al and achieved the highest removal overall at pH 7. Contaminant removal typically increases with current; however, this was not observed in this study. The highest current of 0.71 A, recorded using Fe at pH 7, did not result in the strongest DOC removal. This can be explained by the differences in floc properties when using different anode materials caused by differences in the reduction potentials, solubilities, and hydrolysis reaction kinetics for different metals. Al forms larger surface area “sweep” flocs than Fe and Zn, which cannot undergo the same hydrolysis reactions Al can [25,27]. These larger flocs with more surface area captured more organic carbon despite the lower operating current. This suggests that the physical properties of the floc influence the removal more than the operating current.
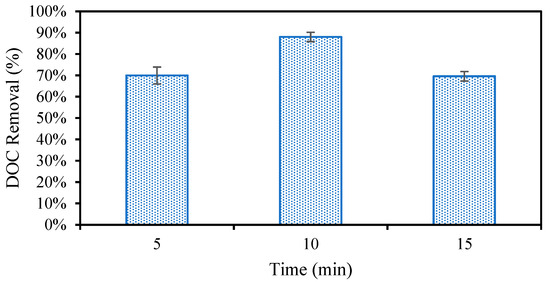
Figure 4.
Organic carbon removal during EC measured between a 5- and 15-min reaction time.
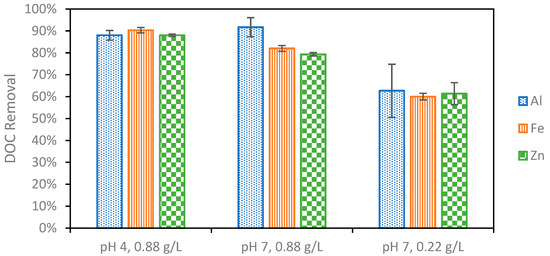
Figure 5.
Organic carbon removal during EC at different combinations of initial pH value and PAC concentration. pH variation studies were performed at a PAC concentration of 0.22 g/L, and electrolyte concentration variation experiments were performed at pH 7.
3.3. Microcystin-LR Removal
MCLR removal was tested for each of the three anode materials at pH 4 (Figure 6). The Al electrode led to the best removal, reaching 99+% compared to 90% and 45% from Zn and Fe, respectively. It is likely that the higher surface area sweep flocs produced when using Al electrodes were able to adsorb more MCLR, leading to better removal. The applied electric field in the process also may have led to a further destabilization of MCLR due to its negative charge. An amount of 10 µg/L was chosen as the feed concentration in these experiments. Lake Fayetteville’s peak concentrations typically range from 15 to 30 µg/L, and this value was chosen to be representative of the local algal bloom concentration [5]. Based on previous reports, it is likely the EC removal will decrease as the MCLR concentration increases [28]. Typical processes require extended reaction times or extreme reaction conditions to achieve comparable removal in water systems containing extracellular microcystins at concentrations of 100+ µg/L [29]. This work explores the use of NF as a post-treatment to avoid the use of these extreme conditions. The results from our previous study testing the ability of NF to remove MCLR from Lake Fayetteville water at higher concentrations support this direction of using NF for toxin removal even at higher toxin concentrations [18].
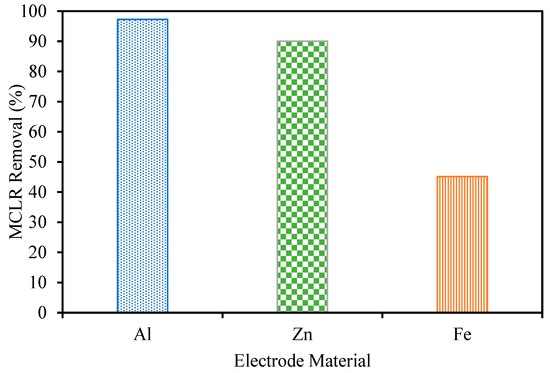
Figure 6.
Microcystin-LR removal during EC at pH 4 and an electrolyte concentration of 0.88 g/L.
3.4. Fouling Reduction
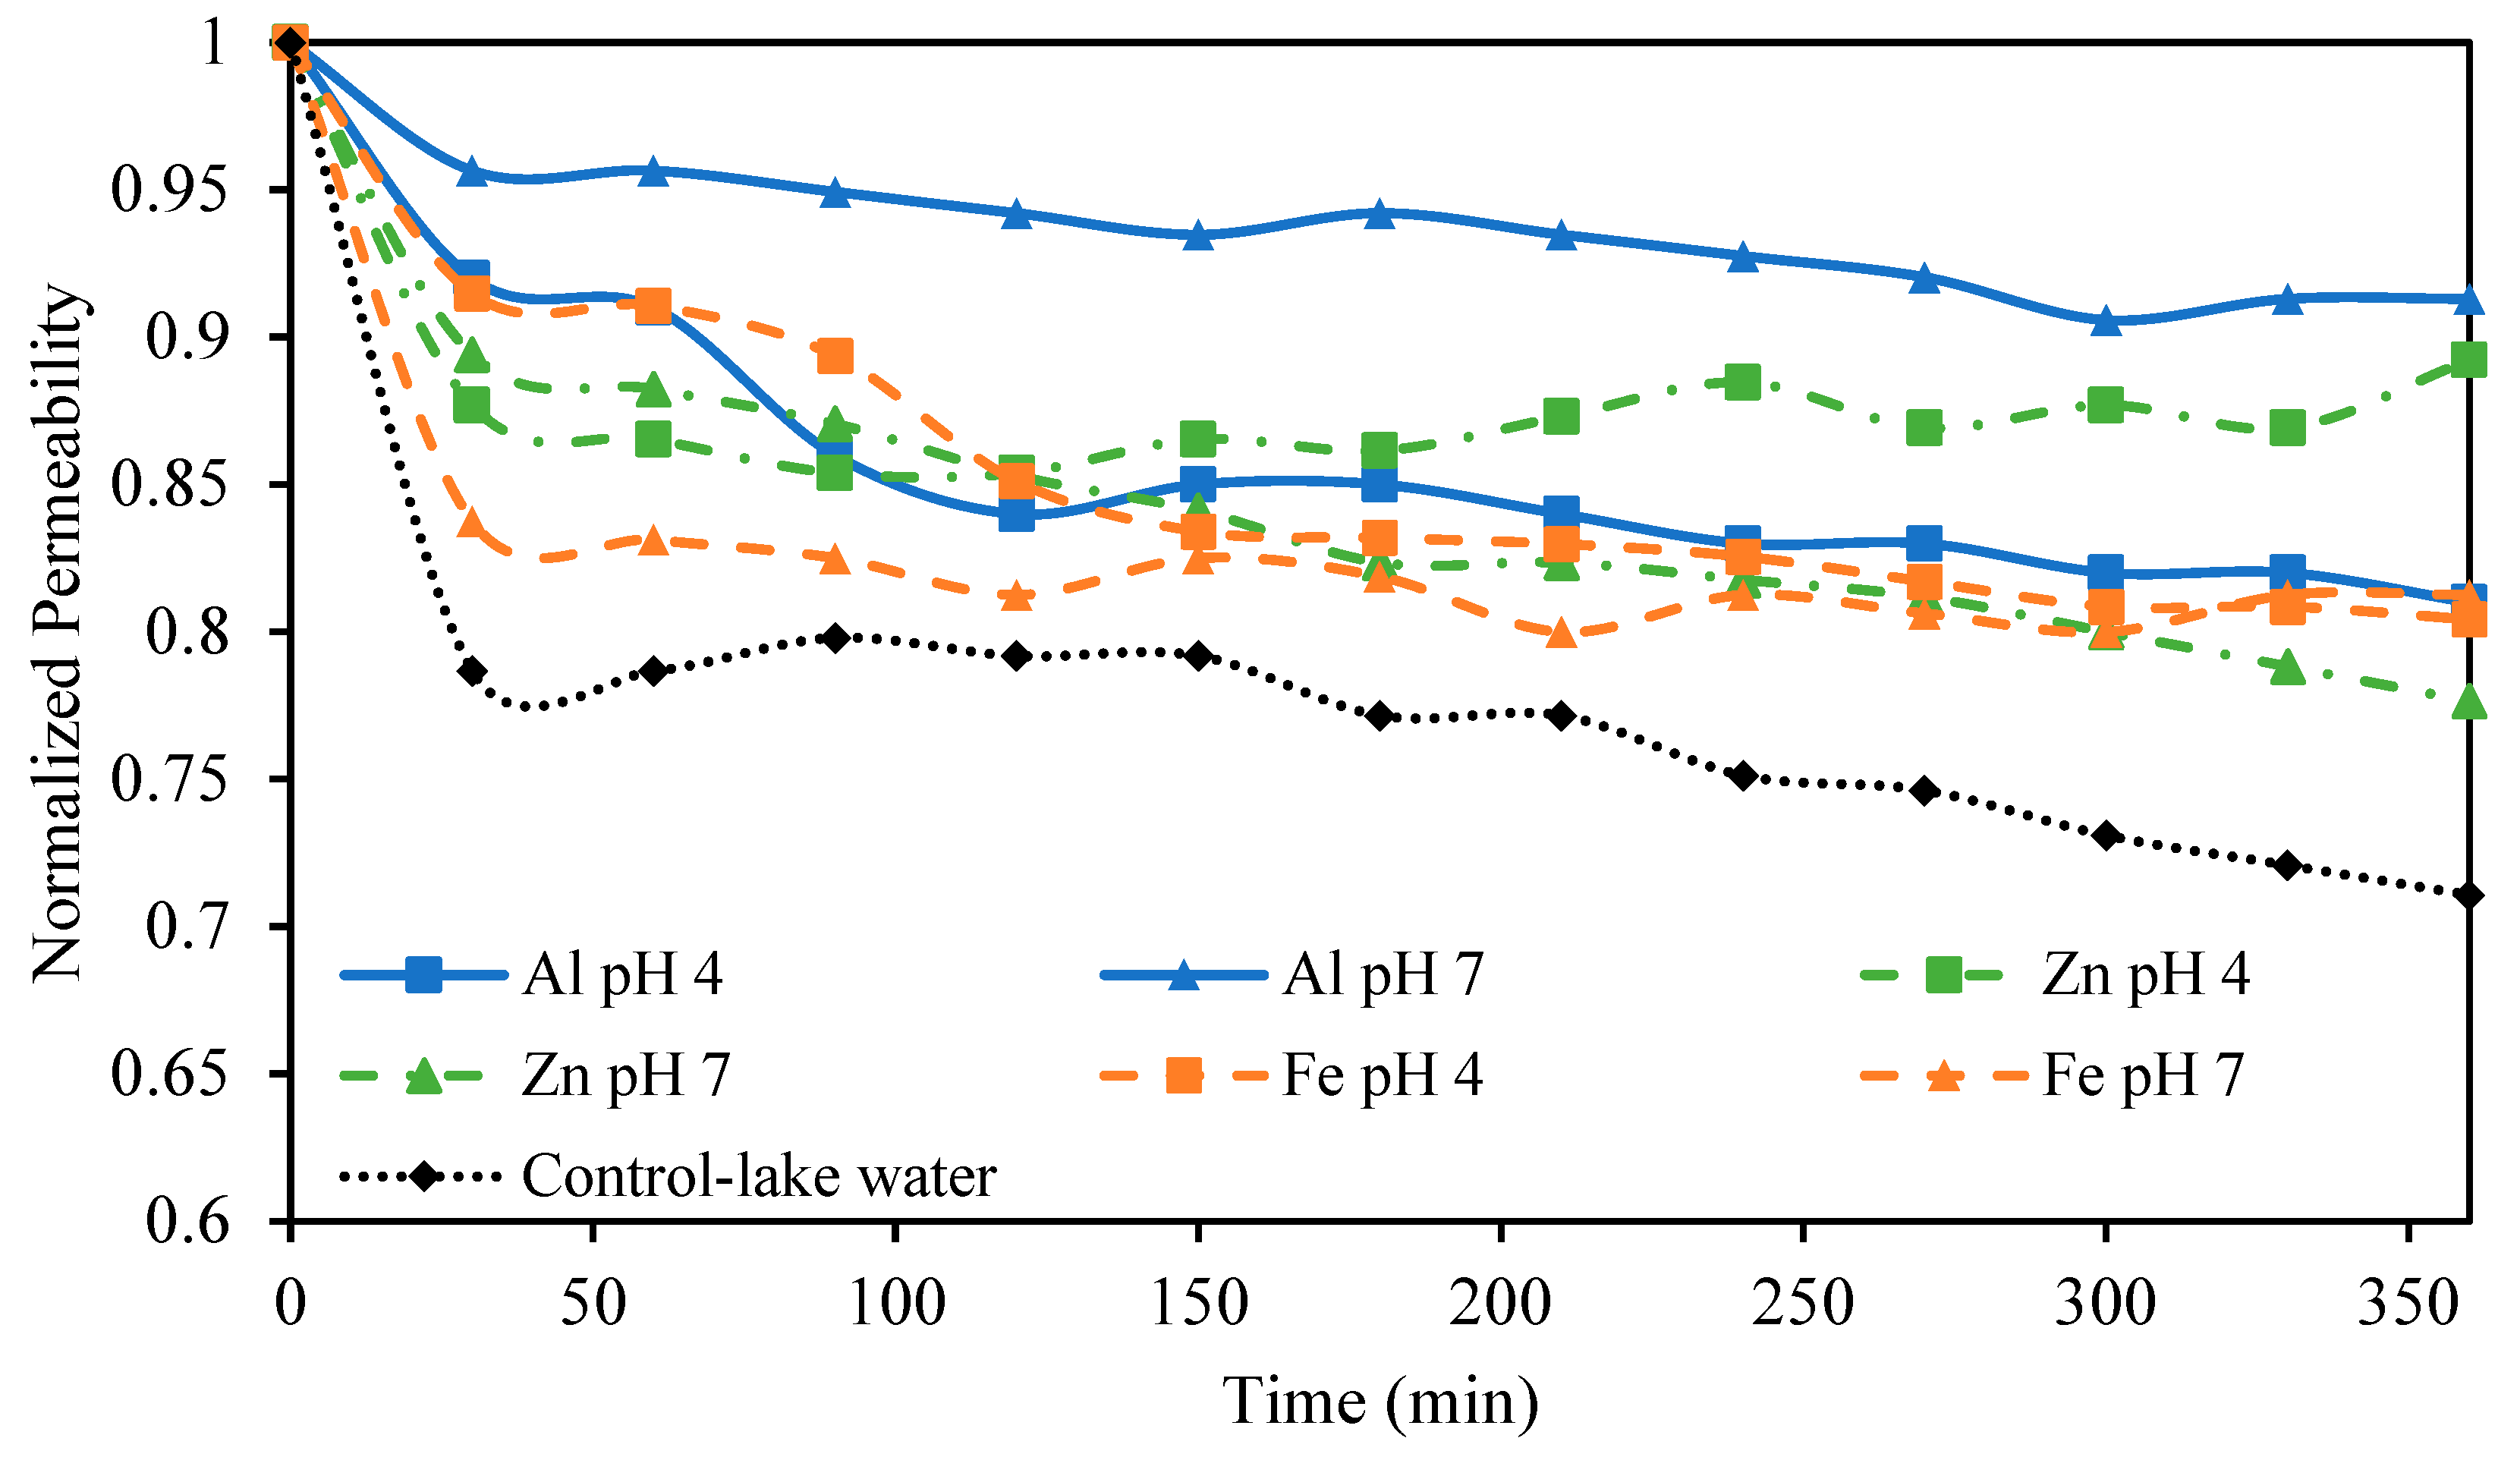
After treating the lake water with EC, NF was used as a final polishing step tasked to provide complete MCLR removal. Our previous work found that NF was capable of rejecting 99%+ of MCLR and that MCLR alone at low concentrations did not lead to membrane fouling [18]. The observed fouling was attributed to the NOM present in the lake water; therefore, it was expected that removing these NOMs in the EC step would greatly reduce fouling during NF. This work sought to investigate the effect of EC conditions on membrane fouling caused by NOMs in the NF step. NF was performed on solutions treated with EC using different anode materials and different pH values. Lower PAC concentrations were not investigated as pretreatments due to the lower DOC removal and poor settling ability of the sludge at low PAC concentrations. The permeability stability results are presented in Figure 7. The smallest permeability decline of just 9% was observed when pretreating the solution with Al electrodes at an initial pH of 7. Zn electrodes at pH 4 also showed a small permeability decline of just 11%. The other conditions tested, including Al electrodes at pH 4, Zn electrodes at pH 7, and Fe electrodes at both pH values tested, showed higher permeability declines between 19 and 24%. Even these higher permeability declines were less than the 29% permeability decline observed in the control sample. These results, particularly the smaller permeability decline observed using Al and Zn electrodes at pH 7 and 4, respectively, reflect the DOC removal and sludge settling trends previously discussed. Namely that these two conditions that resulted in the smallest decline also showed excellent DOC removal, ideal SVI values, and larger particle sizes. The smaller particle sizes for Fe and Zn at pH 7 resulting from differences in hydrolysis reactions undergone at pH 7 may explain their higher permeability drop compared to Al at pH 7. The lower DOC removal also contributes to this difference in observed fouling. The poor performance of Al and Fe at pH 4 could be related to floc particles that remain present in the treated water even after the sludge has settled. The turbidity of the treated water at pH 4 using these electrodes supports this explanation.
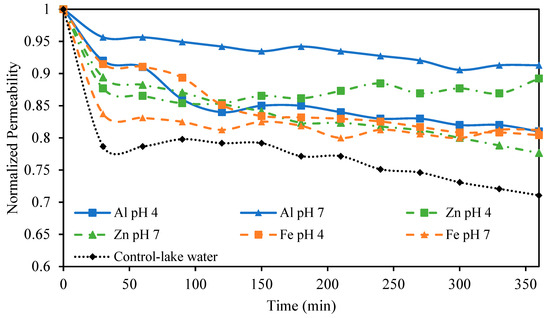
Figure 7.
Normalized permeability for NF processes pretreated with different EC conditions. All EC experiments were performed at an electrolyte concentration of 0.88 g/L.
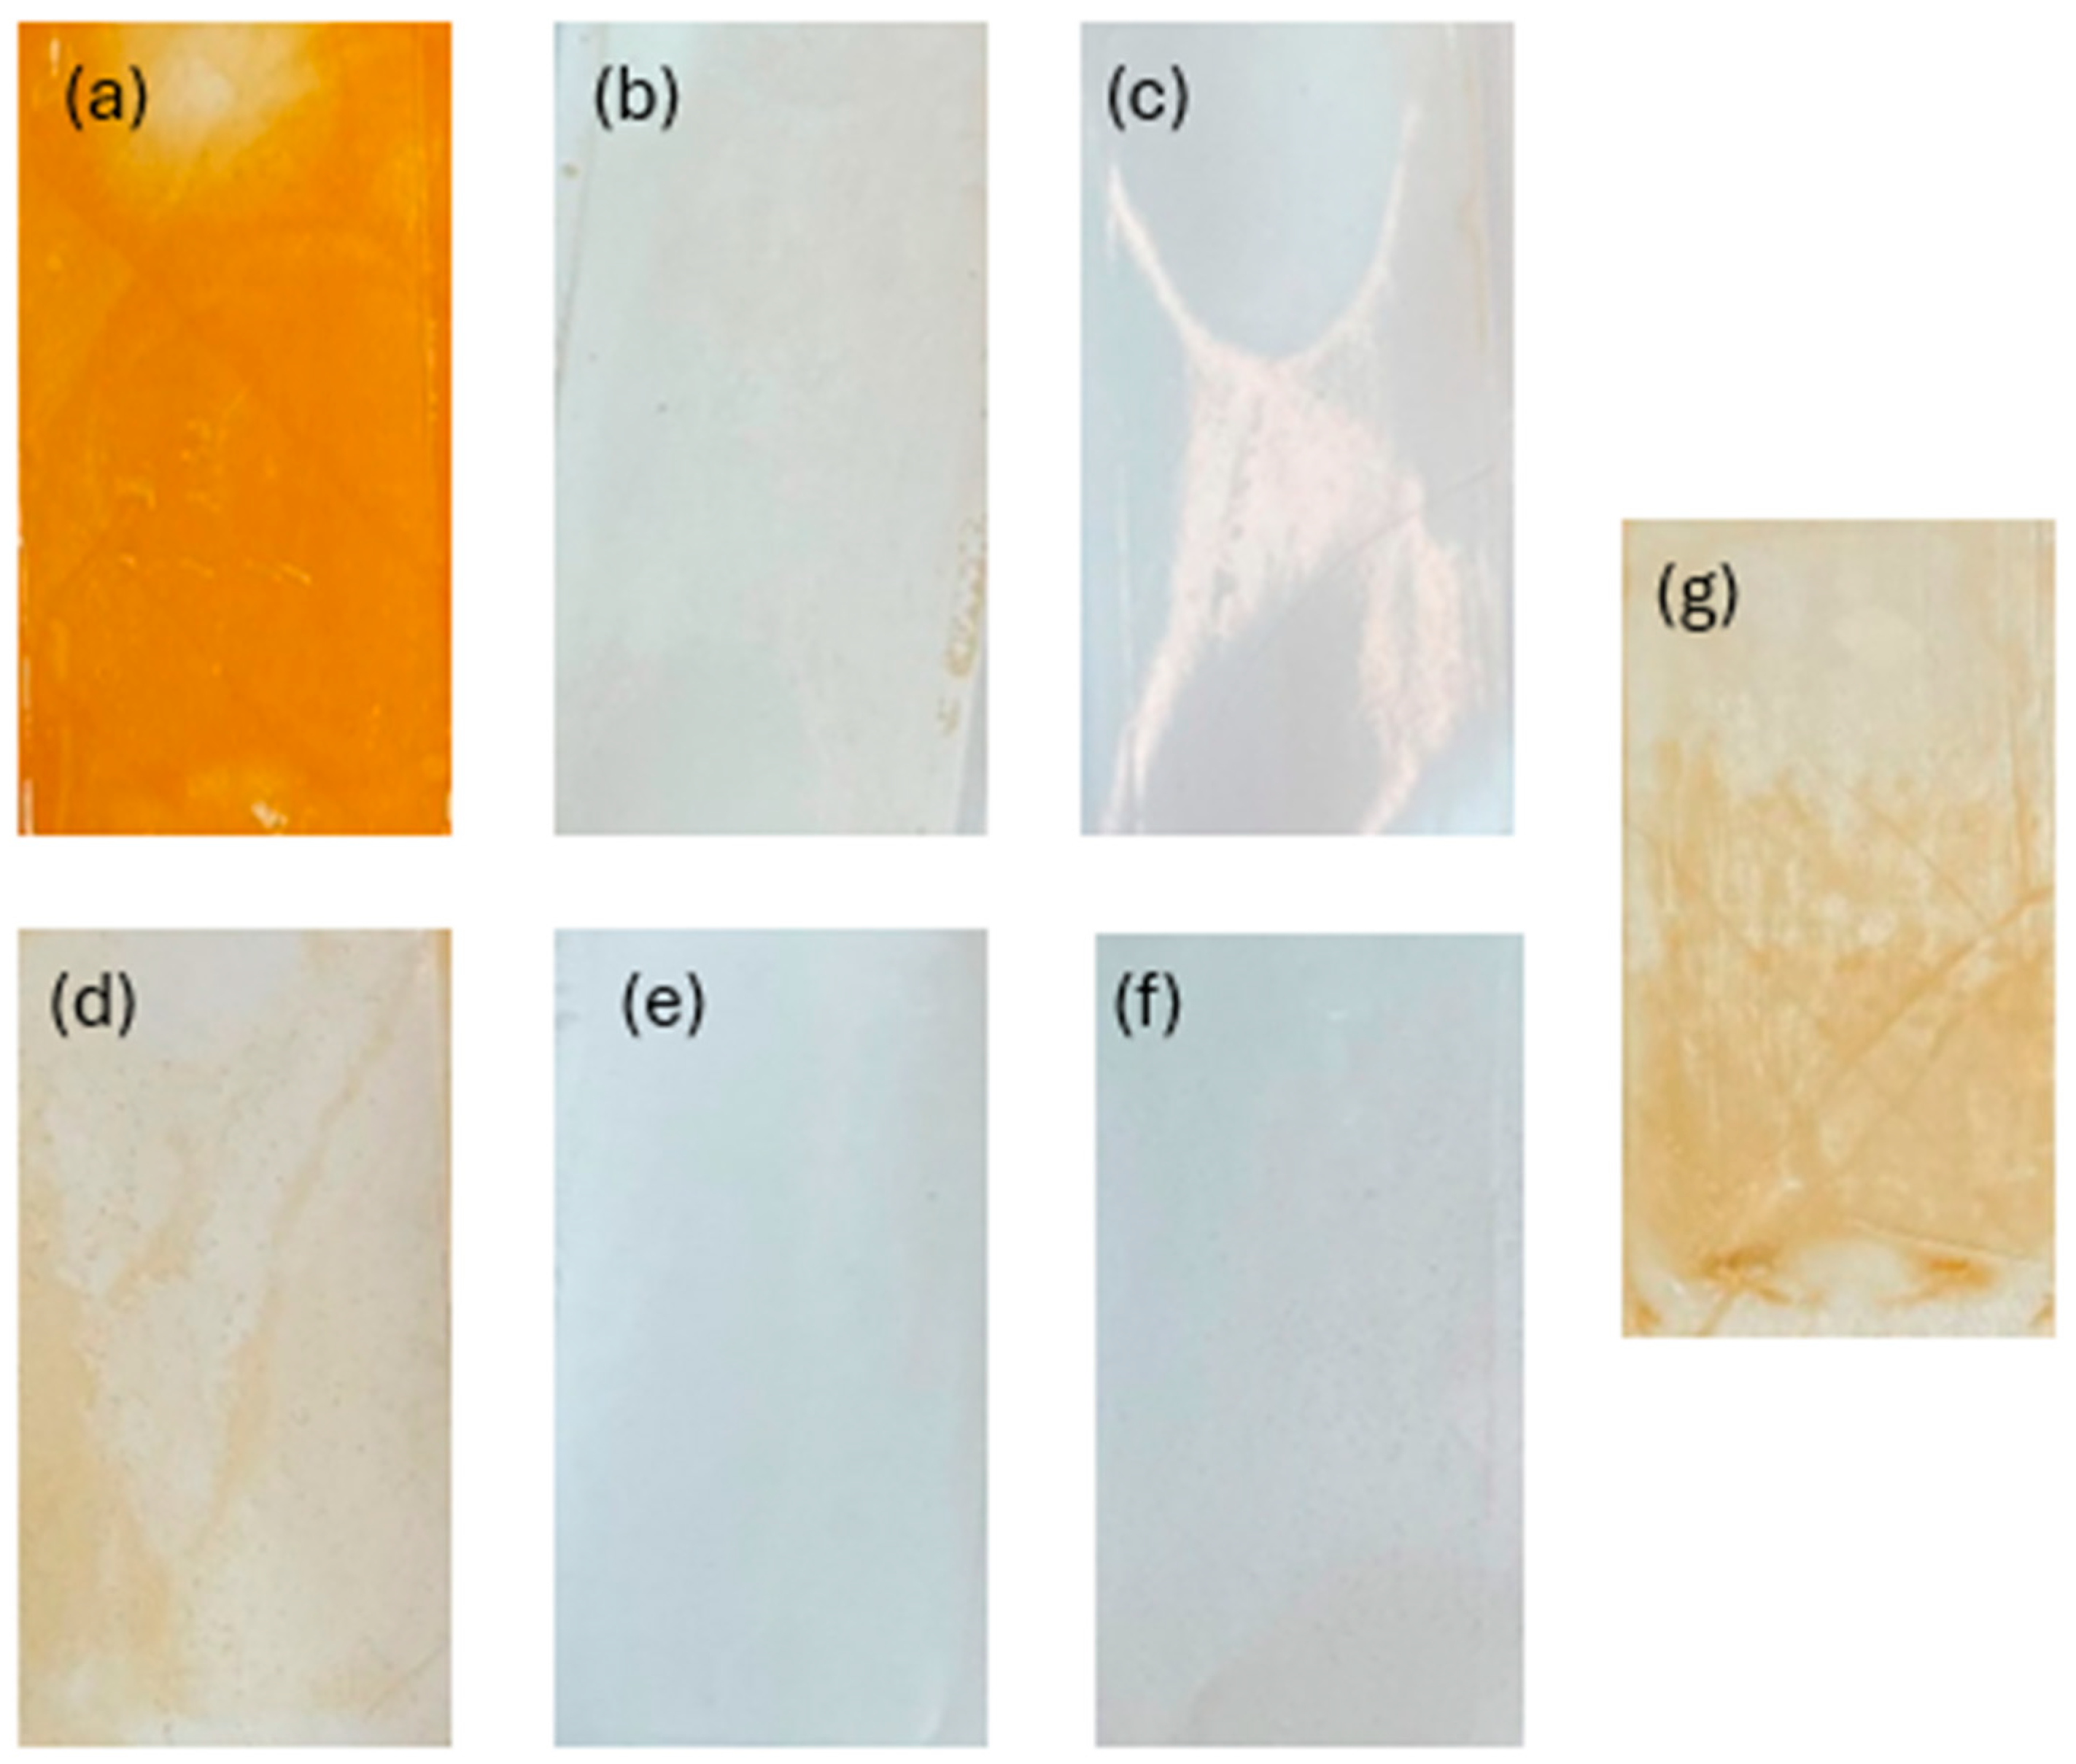
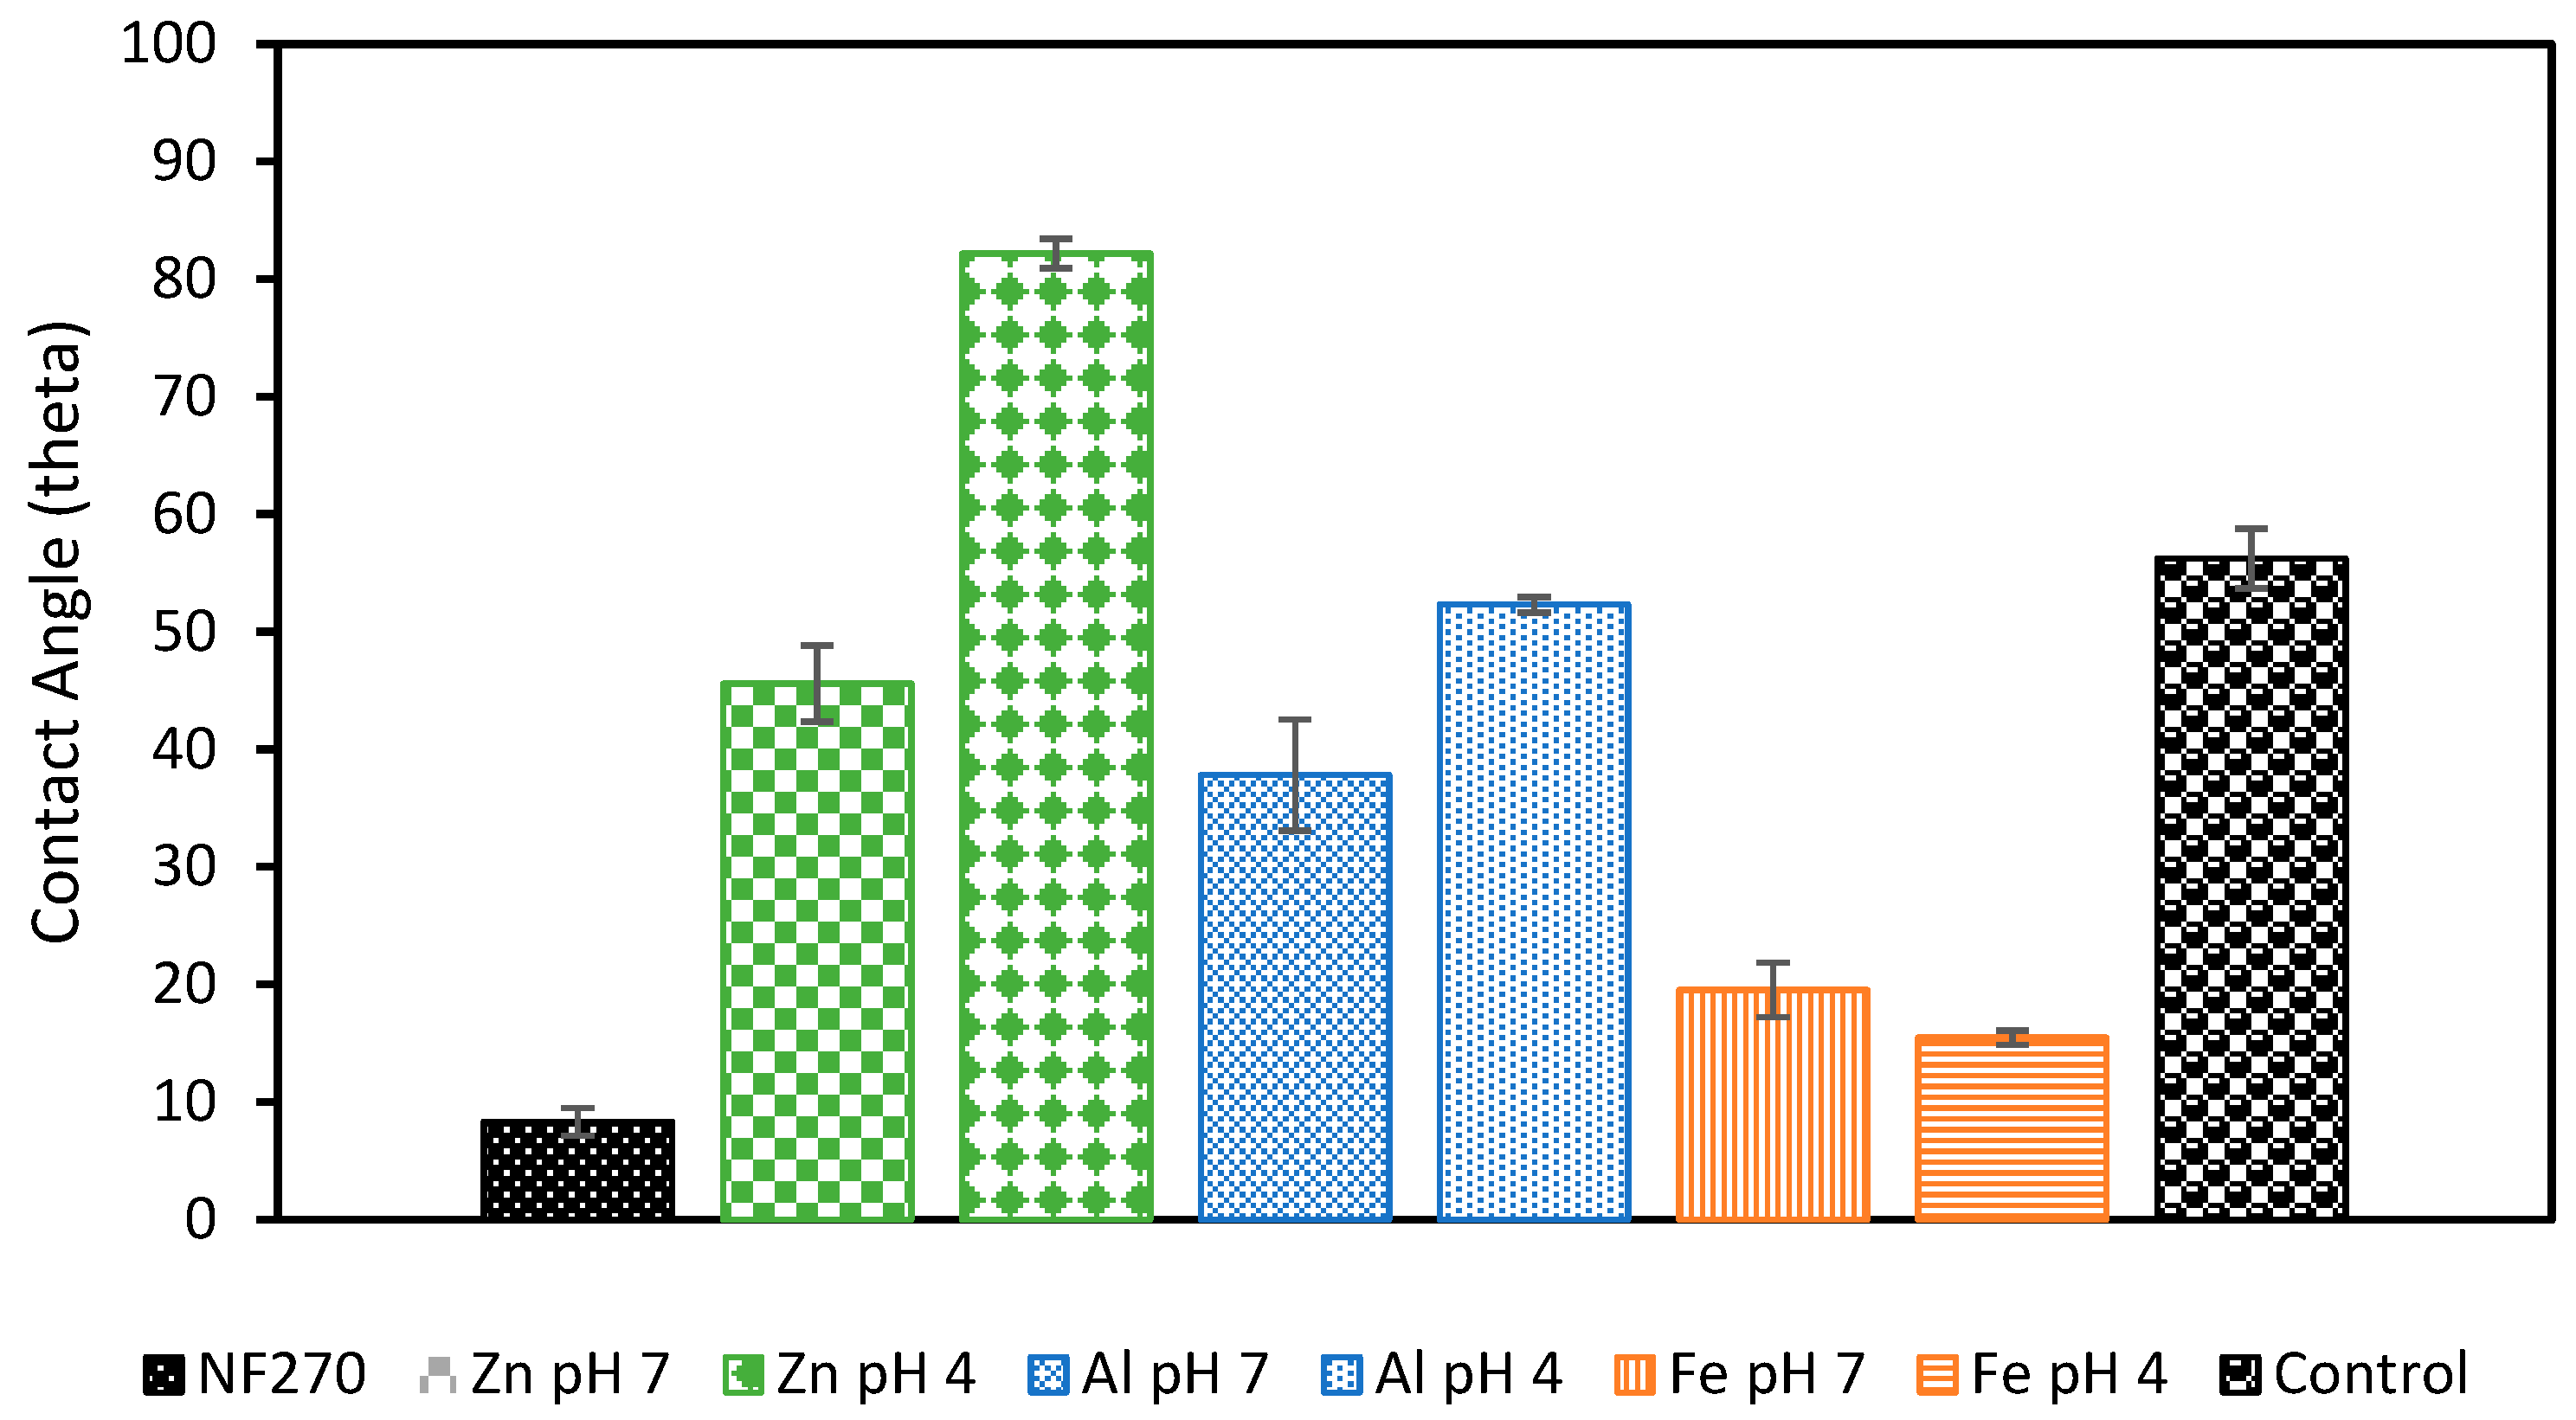
Membrane fouling was also studied by examining the surface of the membrane following filtration (Figure 8). Organic fouling can be seen on the control membrane and orange buildup can be seen on the membranes used with Fe-based pretreatments. Visible flocs can also be seen on the Zn pH 7 membrane, and a slight discoloration is also present on the Al pH 4 membrane. The membranes that showed the lowest permeability decline tended to be the clearest. These membranes were further examined through contact angle testing to check for the presence of hydrophobic foulants or flocs (Figure 9). As expected, the increase in hydrophobicity due to membrane fouling was reduced using EC pretreatment. The observed change in contact angle for the EC-pretreated membranes relates to the hydrophilicity of particles remaining in solution that are rejected by the NF membrane. The results suggest that Fe flocs are the most hydrophilic, followed by Al flocs, and ending with Zn flocs being the most hydrophobic. Despite the smaller increase in contact angle when using Fe electrodes, more fouling was observed using these electrodes than the Al electrodes. This result of more permeability decline in the presence of more hydrophilic particles is in agreement with the literature and can be explained by the higher porosity of the cake layer formed by Al flocs compared to layers produced by Fe flocs [51]. To the best of the authors’ knowledge, less research exists studying the morphology of the Zn cake layer. It is possible that the cake layer formed under these conditions is similarly porous to that of Al, but more studies into the morphology of this layer are needed to explain the smaller permeability drop observed in this work. Overall, based on floc properties and the interactions between the floc particles and membrane’s surface, Al electrodes at pH 7 appear to be the optimal EC configuration.
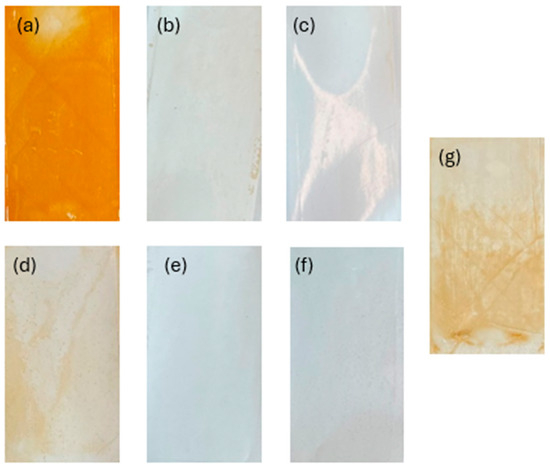
Figure 8.
Membrane surfaces after filtration and pretreatment with different EC conditions: (a) Fe pH 4, (b) Al pH 4, (c) Zn pH 4, (d) Fe pH 7, (e) Al pH 7, (f) Zn pH 7, and (g) control.
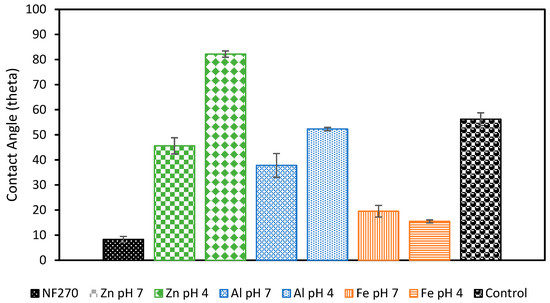
Figure 9.
Contact angle measurements of NF membranes after filtration. Membranes were first pretreated with different EC conditions. All experiments were performed at an electrolyte concentration of 0.88 g/L.
4. Conclusions
This work demonstrates the efficacy of EC as a pretreatment for NF when processing lake water contaminated with HABs. NF is an effective strategy for removing cyanotoxins like MCLR from these waters and EC was able to successfully remove organic foulants responsible for membrane fouling. It was found that using Al electrodes at a pH of 7 led to the largest flocs that settled most readily and removed the most organic matter. This was also found to lead to the most stable permeate flux during filtration, indicating that this combination of electrode material and initial pH is optimal for pretreatment. This information will contribute to the development of a larger scale EC-NF system that can be deployed on lakes contaminated with cyanotoxins produced by HABs. Such technology represents an attractive method for capturing cyanotoxins at the point of generation, thus preventing the accumulation of cyanotoxins to harmful levels in lake water systems.
Author Contributions
Conceptualization, T.M., C.T., and S.R.W.; methodology, T.M., C.T., S.D., and S.R.W.; validation, T.M., C.T., and S.D.; formal analysis, T.M., and C.T.; investigation, T.M.; resources, S.R.W.; data curation, T.M., and C.T.; writing—original draft preparation, T.M.; writing—review and editing, T.M., C.T., and S.R.W.; project administration, T.M., C.T., and S.R.W.; funding acquisition, T.M., and S.R.W. All authors have read and agreed to the published version of the manuscript.
Funding
This research was funded by the Arkansas Water Research Center (AWRC), the University of Arkansas, Fayetteville, AR, USA, and the United States Geological Survey (USGS) 104(b) program under grant number G21AP10581 and NSF 2150436 and NSF 1822101.
Data Availability Statement
The original contributions presented in this study are included in the article. Further inquiries can be directed to the corresponding author.
Conflicts of Interest
The authors declare no conflicts of interest.
Abbreviations
The following abbreviations are used in this manuscript:
| DLS | Dynamic Light Scattering |
| DOC | Dissolved Oxygen Content |
| EC | Electrocoagulation |
| HAB | Harmful Algal Bloom |
| MWCO | Molecular Weight Cut Off |
| NF | Nanofiltration |
| PAC | Polyaluminum Chloride |
| SVI | Sludge Volume Index |
| WHO | World Health Organization |
Appendix A. Supplementary Information
Figure A1.
Sludge particle size characterized by DLS for different anode materials at pH 4 and 0.88 g/L PAC (a), pH 7 and 0.88 g/L PAC (b), and pH 7 and 0.22 g/L PAC (c). Samples were taken immediately after the EC process finished.
Figure A1.
Sludge particle size characterized by DLS for different anode materials at pH 4 and 0.88 g/L PAC (a), pH 7 and 0.88 g/L PAC (b), and pH 7 and 0.22 g/L PAC (c). Samples were taken immediately after the EC process finished.

Figure A2.
Normalized height of liquid-sludge interface during sedimentation for sludge suspensions produced with different anode materials.
Figure A2.
Normalized height of liquid-sludge interface during sedimentation for sludge suspensions produced with different anode materials.
References
- Anderson, D.M.; Glibert, P.M.; Burkholder, J.M. Harmful Algal Blooms and Eutrophication: Nutrient Sources, Composition, and Consequences. Estuaries 2002, 25, 704–726. [Google Scholar] [CrossRef]
- Bláha, L.; Babica, P.; Maršálek, B. Toxins Produced in Cyanobacterial Water Blooms—Toxicity and Risks. Interdiscip. Toxicol. 2009, 2, 36. [Google Scholar] [CrossRef]
- Cyanobacteria and Cyanotoxins: Information for Drinking Water Systems. Available online: https://www.epa.gov/sites/default/files/2014-08/documents/cyanobacteria_factsheet.pdf (accessed on 1 September 2023).
- Lone, Y.; Koiri, R.K.; Bhide, M. An Overview of the Toxic Effect of Potential Human Carcinogen Microcystin-LR on Testis. Toxicol. Rep. 2015, 2, 289–296. [Google Scholar] [CrossRef]
- Harmful Algae Present at Lake Fayetteville. Available online: https://www.fayetteville-ar.gov/CivicSend/ViewMessage/message/114543 (accessed on 1 September 2023).
- Zhang, H.; Cheng, M.; Zhang, B. Release and Removal of Intracellular and Extracellular Microcystins (RR, LR) Using Nano-Fe3O4 Particles as a Coagulant Aid for Polyaluminum Chloride. Water-Energy Nexus 2024, 7, 143–150. [Google Scholar] [CrossRef]
- Qi, J.; Ma, M.; Miao, S.; Liu, R.; Hu, C.; Qu, J. Pre-Oxidation Enhanced Cyanobacteria Removal in Drinking Water Treatment: A Review. J. Environ. Sci. 2021, 110, 160–168. [Google Scholar] [CrossRef] [PubMed]
- Huang, T.L.; Zhao, J.W.; Chai, B.B. Mechanism Studies on Chlorine and Potassium Permanganate Degradation of Microcystin-LR in Water Using High-Performance Liquid Chromatography Tandem Mass Spectrometry. Water Sci. Technol. 2008, 58, 1079–1084. [Google Scholar] [CrossRef]
- Brooke, S.; Newcombe, G.; Nicholson, B.; Klass, G. Decrease in Toxicity of Microcystins LA and LR in Drinking Water by Ozonation. Toxicon 2006, 48, 1054–1059. [Google Scholar] [CrossRef] [PubMed]
- Chintalapati, P.; Mohseni, M. Degradation of Cyanotoxin Microcystin-LR in Synthetic and Natural Waters by Chemical-Free UV/VUV Radiation. J. Hazard. Mater. 2020, 381, 120921. [Google Scholar] [CrossRef]
- Ho, L.; Lambling, P.; Bustamante, H.; Duker, P.; Newcombe, G. Application of Powdered Activated Carbon for the Adsorption of Cylindrospermopsin and Microcystin Toxins from Drinking Water Supplies. Water Res. 2011, 45, 2954–2964. [Google Scholar] [CrossRef]
- Teixeira, M.R.; Rosa, M.J. How Does the Adsorption of Microcystins and Anatoxin-a on Nanofiltration Membranes Depend on Their Co-Existence and on the Water Background Matrix. Water Sci. Technol. 2012, 66, 976–982. [Google Scholar] [CrossRef]
- Dixon, M.B.; Falconet, C.; Ho, L.; Chow, C.W.K.; O’Neill, B.K.; Newcombe, G. Removal of Cyanobacterial Metabolites by Nanofiltration from Two Treated Waters. J. Hazard. Mater. 2011, 188, 288–295. [Google Scholar] [CrossRef] [PubMed]
- Lebad, M.S.; Ballot, A.; Vogelsang, C.; Abdessemed, D.; Krzeminski, P. Removal of a Cyanotoxins Mixture by Loose Nanofiltration Membranes Applied in Drinking Water Production. J. Water Process Eng. 2024, 57, 104694. [Google Scholar] [CrossRef]
- Dixon, M.B.; Falconet, C.; Ho, L.; Chow, C.W.K.; O’Neill, B.K.; Newcombe, G. Nanofiltration for the Removal of Algal Metabolites and the Effects of Fouling. Water Sci. Technol. 2010, 61, 1189–1199. [Google Scholar] [CrossRef]
- Teixeira, M.R.; Sousa, V.S. Fouling of Nanofiltration Membrane: Effects of NOM Molecular Weight and Microcystins. Desalination 2013, 315, 149–155. [Google Scholar] [CrossRef]
- Guo, Y.; Li, T.Y.; Xiao, K.; Wang, X.M.; Xie, Y.F. Key Foulants and Their Interactive Effect in Organic Fouling of Nanofiltration Membranes. J. Memb. Sci. 2020, 610, 118252. [Google Scholar] [CrossRef]
- Thamaraiselvan, C.; McKean, T.; Khalili, M.; Do, S.; Hackett, C.; Liyanage, R.; Qian, X.; Wickramasinghe, R. Synergistic Effect of Electrocoagulation and Antifouling Nanofiltration Membranes for Microcystin Removal. Chemosphere 2025, 376, 144298. [Google Scholar] [CrossRef]
- Gijsbertsen-Abrahamse, A.J.; Schmidt, W.; Chorus, I.; Heijman, S.G.J. Removal of Cyanotoxins by Ultrafiltration and Nanofiltration. J. Membr. Sci. 2006, 276, 252–259. [Google Scholar] [CrossRef]
- Kum, S.; Landsman, M.R.; Su, G.M.; Freychet, G.; Lawler, D.F.; Katz, L.E. Performance of a Hybrid ED−NF Membrane System for Water Recovery Improvement via NOM Fouling Control. ACS ES&T Eng. 2021, 1, 1420–1431. [Google Scholar] [CrossRef]
- Teixeira, M.R.; Rosa, M.J. Integration of Dissolved Gas Flotation and Nanofiltration for M. Aeruginosa and Associated Microcystins Removal. Water Res. 2006, 40, 3612–3620. [Google Scholar] [CrossRef]
- Alhweij, H.; Emanuelsson, E.A.C.; Shahid, S.; Wenk, J. Organic Matter Removal and Antifouling Performance of Sulfonated Polyaniline Nanofiltration (S-PANI NF) Membranes. J. Environ. Chem. Eng. 2022, 10, 107906. [Google Scholar] [CrossRef]
- Mallya, D.S.; Abdikheibari, S.; Dumée, L.F.; Muthukumaran, S.; Lei, W.; Baskaran, K. Removal of Natural Organic Matter from Surface Water Sources by Nanofiltration and Surface Engineering Membranes for Fouling Mitigation—A Review. Chemosphere 2023, 321, 138070. [Google Scholar] [CrossRef] [PubMed]
- Ruan, H.; Li, B.; Ji, J.; Sotto, A.; Van Der Bruggen, B.; Shen, J.; Gao, C. Preparation and Characterization of an Amphiphilic Polyamide Nanofiltration Membrane with Improved Antifouling Properties by Two-Step Surface Modification Method. RSC Adv. 2018, 8, 13353–13363. [Google Scholar] [CrossRef] [PubMed]
- Duan, J.; Gregory, J. Coagulation by Hydrolysing Metal Salts. Adv. Colloid Interface Sci. 2003, 100–102, 475–502. [Google Scholar] [CrossRef]
- Shen, W.; An, L.; Xu, X.; Yan, F.; Dai, R. Microcystis Aeruginosa Removal and Simultaneous Control of Algal Organic Matter (AOM) Release Using an Electro-Flocculation–Electro-Fenton (EC-EF) System without Chemical Addition. Water 2024, 16, 162. [Google Scholar] [CrossRef]
- Meetiyagoda, T.A.O.K.; Fujino, T. Comparison of Different Anode Materials to Remove Microcystis Aeruginosa Cells Using Electro-Coagulation–Flotation Process at Low Current Inputs. Water 2020, 12, 3528. [Google Scholar] [CrossRef]
- Huang, C.; Huang, W.; Xiong, J.; Song, H.; Wang, S. Advanced Electrochemical Strategies for Simultaneous Removal of Microcystis Aeruginosa and Microcystin-LR: On-Demand Optimization and Mechanistic Insights. Sep. Purif. Technol. 2025, 354, 129283. [Google Scholar] [CrossRef]
- Zhou, Y.; Peng, H.; Jiang, L.; Wang, X.; Tang, Y.; Xiao, L. Control of Cyanobacterial Bloom and Purification of Bloom-Laden Water by Sequential Electro-Oxidation and Electro-Oxidation-Coagulation. J. Hazard. Mater. 2024, 462, 132729. [Google Scholar] [CrossRef]
- Liang, D.; Li, N.; An, J.; Ma, J.; Wu, Y.; Liu, H. Fenton-Based Technologies as Efficient Advanced Oxidation Processes for Microcystin-LR Degradation. Sci. Total Env. 2021, 753, 141809. [Google Scholar] [CrossRef]
- Opoku-Duah, S.; Johnson, D. Removal of Perfluorooctanoic Acid and Microcystins from Drinking Water by Electrocoagulation. J. Chem. 2020, 2020, 1836264. [Google Scholar] [CrossRef]
- Ebersbach, I.; Ludwig, S.M.; Constapel, M.; Kling, H.W. An Alternative Treatment Method for Fluorosurfactant-Containing Wastewater by Aerosol-Mediated Separation. Water Res. 2016, 101, 333–340. [Google Scholar] [CrossRef] [PubMed]
- Harif, T.; Khai, M.; Adin, A. Electrocoagulation versus Chemical Coagulation: Coagulation/Flocculation Mechanisms and Resulting Floc Characteristics. Water Res. 2012, 46, 3177–3188. [Google Scholar] [CrossRef] [PubMed]
- Moussa, D.T.; El-Naas, M.H.; Nasser, M.; Al-Marri, M.J. A Comprehensive Review of Electrocoagulation for Water Treatment: Potentials and Challenges. J. Environ. Manage. 2017, 186, 24–41. [Google Scholar] [CrossRef]
- Ahmed, M.T.; Chaabane, T.; Maachi, R.; Darchen, A. Efficiency of a Pretreatment by Electrocoagulation with Aluminum Electrodes in a Nanofiltration Treatment of Polluted Water. Procedia Eng. 2012, 33, 465–474. [Google Scholar] [CrossRef]
- Tavangar, T.; Jalali, K.; Alaei Shahmirzadi, M.A.; Karimi, M. Toward Real Textile Wastewater Treatment: Membrane Fouling Control and Effective Fractionation of Dyes/Inorganic Salts Using a Hybrid Electrocoagulation—Nanofiltration Process. Sep. Purif. Technol. 2019, 216, 115–125. [Google Scholar] [CrossRef]
- Gönder, Z.B.; Balcıoğlu, G.; Vergili, I.; Kaya, Y. An Integrated Electrocoagulation–Nanofiltration Process for Carwash Wastewater Reuse. Chemosphere 2020, 253, 126713. [Google Scholar] [CrossRef]
- Den, W.; Wang, C.J. Removal of Silica from Brackish Water by Electrocoagulation Pretreatment to Prevent Fouling of Reverse Osmosis Membranes. Sep. Purif. Technol. 2008, 59, 318–325. [Google Scholar] [CrossRef]
- Mariam, T.; Nghiem, L.D. Landfill Leachate Treatment Using Hybrid Coagulation-Nanofiltration Processes. Desalination 2010, 250, 677–681. [Google Scholar] [CrossRef]
- Cao, Y.; Malmali, M.; Qian, X.; Wickramasinghe, S.R. Continuous Electrocoagulation-Membrane Distillation Unit for Treating Hydraulic Fracturing Produced Water. J. Water Proc. Eng. 2022, 50, 103219. [Google Scholar] [CrossRef]
- Jebur, M.; Chiao, Y.H.; Matsuyama, H.; Wickramasinghe, S.R. Electrocoagulation as a Pretreatment for Reverse Osmosis for Potable Water from Brackish Groundwater. Water Resour. Ind. 2024, 31, 100243. [Google Scholar] [CrossRef]
- Volk, C.; Wood, L.; Johnson, B.; Robinson, J.; Zhu, H.W.; Kaplan, L. Monitoring Dissolved Organic Carbon in Surface and Drinking Waters. J. Environ. Monit. 2002, 4, 43–47. [Google Scholar] [CrossRef]
- Ahmadi, S.; Sardari, E.; Javadian, H.R.; Katal, R.; Sefti, M.V. Removal of Oil from Biodiesel Wastewater by Electrocoagulation Method. Korean J. Chem. Eng. 2013, 30, 634–641. [Google Scholar] [CrossRef]
- Haggard, B.; Grantz, E.; Austin, B.; Lasater, A.; Haddock, L.; Ferri, A.; Wagner, N.; Scott, J. Microcystin Shows Thresholds and Hierarchical Structure With Physiochemical Properties At Lake Fayetteville, Arkansas, May Through September 2020. J. ASABE 2023, 66, 307–317. [Google Scholar] [CrossRef]
- Jebur, M.; Cao, Y.; Malmali, M.; Qian, X.; Wickramasinghe, S.R. Treating Hydraulic Fracturing Produced Water by Electrocoagulation. Sep. Sci. Technol. 2023, 58, 1111–1120. [Google Scholar] [CrossRef]
- USEPA Method 9060A Total Organic Carbon. Available online: https://www.epa.gov/sites/default/files/2015-12/documents/9060a.pdf (accessed on 13 May 2025).
- Gao, S.; Yang, J.; Tian, J.; Ma, F.; Tu, G.; Du, M. Electro-Coagulation–Flotation Process for Algae Removal. J. Hazard. Mater. 2010, 177, 336–343. [Google Scholar] [CrossRef] [PubMed]
- Hu, C.; Sun, J.; Wang, S.; Liu, R.; Liu, H.; Qu, J. Enhanced Efficiency in HA Removal by Electrocoagulation through Optimizing Flocs Properties: Role of Current Density and pH. Sep. Purif. Technol. 2017, 175, 248–254. [Google Scholar] [CrossRef]
- Font, R.; García, P.; Rodriguez, M. Sedimentation Test of Metal Hydroxides: Hydrodynamics and Influence of PH. Colloids Surf. A Physicochem. Eng. Asp. 1999, 157, 73–84. [Google Scholar] [CrossRef]
- Khandegar, V.; Saroha, A.K. Electrochemical Treatment of Textile Effluent Containing Acid Red 131 Dye. J. Hazard. Toxic Radioact. Waste 2014, 18, 38–44. [Google Scholar] [CrossRef]
- Zhao, K.; Sun, J.; Hu, C.; Qu, J. Membrane Fouling Reduction through Electrochemically Regulating Flocs Aggregation in an Electro-Coagulation Membrane Reactor. J. Environ. Sci. 2019, 83, 144–151. [Google Scholar] [CrossRef]


Disclaimer/Publisher’s Note: The statements, opinions and data contained in all publications are solely those of the individual author(s) and contributor(s) and not of MDPI and/or the editor(s). MDPI and/or the editor(s) disclaim responsibility for any injury to people or property resulting from any ideas, methods, instructions or products referred to in the content. |
© 2025 by the authors. Licensee MDPI, Basel, Switzerland. This article is an open access article distributed under the terms and conditions of the Creative Commons Attribution (CC BY) license (https://creativecommons.org/licenses/by/4.0/).