Error in Figure
In the original publication, there was a mistake in Figure 2 as published [1]. Due to Figure 2a,b in original publication actually being from the retracted paper “Characterizing the Hydraulic Fracture Propagation Behavior in Deep Fractured Formations Based on DDM and FVM” (Wang, B.; Dong, J.; Zhou, P.; Kong, H.; Liu, K.; Ding, K.; Zheng, H. RETRACTED: Characterizing the Hydraulic Fracture Propagation Behavior in Deep Fractured Formations Based on DDM and FVM. Processes 2024, 12, 2469), while the citations for Figure 2a,b in the original text are labeled as “New variable compliance method for estimating closure stress and fracture compliance from DFIT data” (Wang, H.; Sharma, M.M. New variable compliance method for estimating closure stress and fracture compliance from DFIT data. In Proceedings of the SPE Annual Technical Conference and Exhibition, San Antonio, TX, USA, 9–11 October 2017; SPE-187348), this citation is incorrect. Under this situation, the effectiveness of the proposed model cannot be verified. In order to further dispel readers’ doubts about the model validation part, we conducted true tri-axial hydraulic fracturing experimental tests and compared the numerical simulation results with the experimental results to verify the effectiveness of the model.
The corrected description of Figure 2 appears below, which should be correct paragraph in Section 2.4 of original publication:
“To verify the effectiveness of the proposed model, a true tri-axial hydraulic fracturing experiment was conducted with maximum and minimum horizontal principle stresses of 28.4 MPa and 21.4 MPa and vertical stress of 32.4 MPa. The Young modulus and Poisson rate of the prepared rock sample were 35.7 GPa and 0.32, the injection rate was 15 mL/s, and the viscosity of the fracturing fluid was 1.0 mPa.s. Figure 2a indicates the fracture geometry after the hydraulic fracturing experiment, and Figure 2b shows the numerical simulation result. From the comparison, it can be found that the fracture created during the experiment had a slight curve, which was the same in the numerical simulation. For the injection pressure, the breakdown pressures of the experiment and numerical simulation were 35.4 MPa and 34.8 MPa, with an error of 1.69%, and the average extension pressures of the experiment and numerical simulation were 21.6 MPa and 22.4 MPa, with an error of 3.7%. From the comparison, the effectiveness of the proposed model is verified.”
With this correction, the original ref. [25] has been removed accordingly.
The corrected Figure 2 and it’s caption appear below:
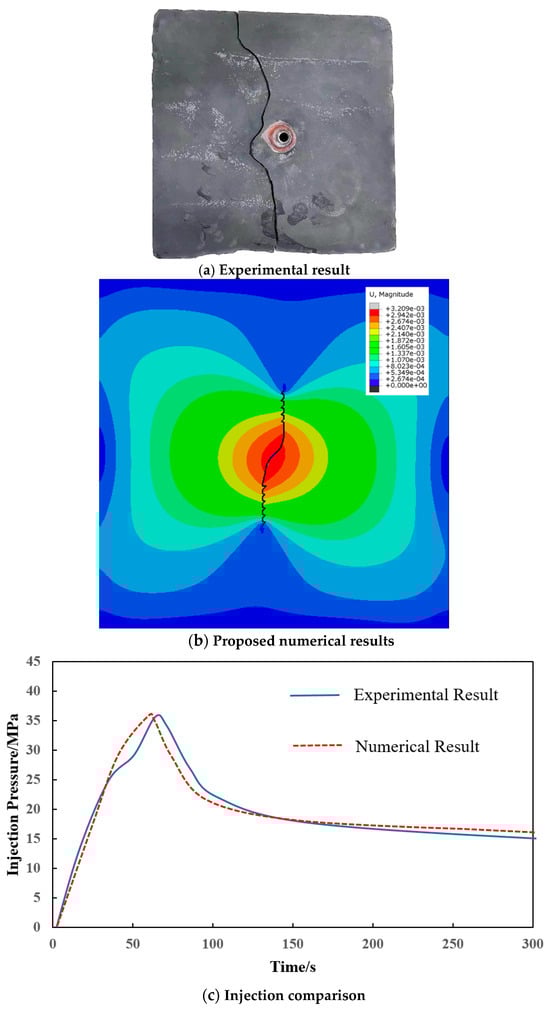
Figure 2.
(a) Experimental numerical results. (b) Proposed model. (c) Injection comparison. Simulation results comparison between the experimental results and the proposed model.
The authors state that the scientific conclusions are unaffected. This correction was approved by the Academic Editor. The original publication has also been updated.
Reference
- Zheng, H.; Li, F.; Wang, D. Numerical Investigation of Complex Hydraulic Fracture Propagation in Shale Formation. Processes 2024, 12, 2630. [Google Scholar] [CrossRef]
Disclaimer/Publisher’s Note: The statements, opinions and data contained in all publications are solely those of the individual author(s) and contributor(s) and not of MDPI and/or the editor(s). MDPI and/or the editor(s) disclaim responsibility for any injury to people or property resulting from any ideas, methods, instructions or products referred to in the content. |
© 2025 by the authors. Licensee MDPI, Basel, Switzerland. This article is an open access article distributed under the terms and conditions of the Creative Commons Attribution (CC BY) license (https://creativecommons.org/licenses/by/4.0/).