Abstract
The arching effect of surrounding rock pressure is critical for ground pressure control in mining areas. Taking a stope in Malipo tungsten mine as the engineering background, this study optimizes stope structural parameters based on the arching pressure theory. Analysis of the stope pressure arch shape equation shows that the pressure arch shape is mainly determined by the lateral pressure coefficient (λ) and stope span (L), while the actual load on pillars equals the weight of rock mass within the overlying pressure arch shell. Pillar loads differ at various stope locations. Combined with the pillar area bearing theory, the rock weight supported by pillars at different stope positions under the arching pressure theory was determined, and a load calculation formula for pillars at various locations was derived. A stope pillar size optimization method was also proposed, which overcomes the defect of excessively large pillar sizes caused by the pillar area bearing theory. It ensures pillar stability during mining while improving ore recovery rates. Taking an existing 830 m-deep stope in the tungsten mine as an example, the optimization method based on the arching pressure theory determined the actual required widths of pillars at different locations. This increased the ore recovery rate from the original 67.56% to 69.47% (an increase of 1.91%). This study provides a reference for the reasonable setting of pillar sizes.
1. Introduction
Mineral resources are highly non-renewable and serve as a crucial material foundation for the rapid development of the national economy. Due to the increasing demand driven by social and economic development, coupled with advancements in mining technology, the scale and intensity of mineral resource extraction have significantly increased. Shallow resource reserves have been depleted, and mining depths are becoming greater and greater. Compared to shallow mining, deep mining presents many challenges for mine operation and production due to the “three highs and one disturbance” environment [1,2]. The room and pillar method, known for its low cost, high capacity, and high productivity, is widely used in underground mining [3]. However, a large number of pillars are left unmined during the extraction process, leading to resource loss and the formation of extensive voids [4,5,6]. If these voids are not promptly and properly managed, they can result in accidents such as roof falls and pillar spalling, posing risks to the safety of people, property, and equipment in the mine. The excavation of rooms in room-and-pillar mining disrupts the initial stress equilibrium of the surrounding rock, causing a redistribution of stress in the rock around the void [7,8]. This leads to an increase in tangential stress and a decrease in radial stress in certain areas of the surrounding rock, forming an arch-shaped compression zone known as a “pressure arch” [9,10,11,12]. The pressure arch effect exhibits the mechanical characteristics of an arch, helping to ensure the stability of the overlying rock mass and preventing collapse, which is beneficial for maintaining the stability of the void [13]. By effectively utilizing the arching effect of the rock mass, support costs can be reduced, ore recovery rates can be improved, and a balance between economic efficiency and the safe management of mined-out areas can be achieved. Due to the influence of the stress redistribution in the surrounding rock, the shape of the pressure arch in the stope continuously changes with variations in the mining range [14,15,16]. This has significant implications for the design of structural parameters in room-and-pillar stopes and for the control of stability in mined-out areas.
Research on the progressive failure of tunnel surrounding rock indicates that the range of the initial pressure arch increases with the depth of surrounding rock failure and tunnel burial depth, and it gradually moves inward into the surrounding rock as excavation progresses [10,17,18]. The changes in the shape and range of the pressure arch affect the stress distribution in the surrounding rock of the excavation site. If the pressure arch shell becomes unstable and fails, it can cause severe disturbances to the surrounding rock, necessitating a reasonable adjustment of the excavation site’s structural parameters to control the shape of the pressure arch and improve the stress distribution in the surrounding rock [19,20]. After excavation, the radial stress in the surrounding rock decreases, leading to an increase in tangential stress in both the plastic and elastic regions [21,22,23], which can be used to determine the boundary of the pressure arch. Researchers also proposed using the range of stress concentration areas in the surrounding rock after excavation as the criterion for defining the boundary of the pressure arch [24], and established a method to identify and quantify the range of the pressure arch through inner and outer boundaries and the centroid line [25,26]. The room and pillar mining method requires the retention of pillars to support the overlying strata and ensure the stability of the mining area. Previous studies have shown that the stability of pillars is proportional to their size—the larger the pillar, the higher its strength and the better its stability. The design of pillar dimensions is typically based on pillar strength theories and load calculations. Ian William Farmer (1985) [27] derived a relationship between the size effect and strength of pillars and rock samples from the perspective of converting strain energy into fracture surface energy. Holland (1964) [28] analyzed the strength of a large number of specimens with different width-to-height ratios and proposed a formula for estimating the strength of coal mine pillars. Hoek and Brown (2019) [29], based on field investigations and laboratory tests, considered factors affecting rock mass strength, such as the integrity of the rock mass and rock quality index, and proposed and refined the Hoek–Brown failure criterion. This criterion also addresses the size effect problem and is widely used in the estimation of rock mass mechanical parameters.
The load calculation for mine pillars typically uses the pillar area-bearing theory. This theory assumes that the load on the pillar is the total weight of the rock column above its distributed area, extending up to the surface, with the pillar cross-section subjected to uniformly distributed loads. Based on this theory, Qiu et al. (2022) [15] indicates that the center of the pillar and the roof and floor of the stope are prone to tensile stress, while compressive stress concentrations are likely to occur at the junctions of the pillar, stope sidewalls, roof, and floor. The impact of shear stress on pillar failure is minimal. Increasing the size of the pillar can enhance the stability of the stope and tunnels, but it also reduces the recovery rate of the stope, increases ore loss, and diminishes the economic efficiency of the mine. Balancing pillar size while maintaining controlled stope and tunnel deformation is crucial for maximizing resource recovery. Gong et al. (2023) [30] studied the impact of coal pillar width on the recovery of remaining resources; the results show that controlling pillar width significantly affects tunnel deformation. When the pillar width exceeds 10 m, it generally meets the requirements for controlling surrounding rock pressure relief in tunnels. However, when the coal pillar width is 5 m, the risk of large deformations in the tunnel increases. Zang et al. (2024) [31] argue that when the coal pillar width is less than 6 m, cracks will penetrate the coal pillar, leading to complete failure of the pillar, which is detrimental to the control of surrounding rock deformation. Zhang, D. M. et al. (2022) [16] through theoretical calculations, demonstrate that roof cutting and pressure relief can further reduce the size of coal pillars and conclude that the key strata play a major controlling role in rock mass activity.
However, existing research on the stress arch in mining operations primarily focuses on underground tunnels or coal roadways, with limited studies on the stress arch of surrounding rock in non-coal mining stopes. Due to the unique structure of room-and-pillar stopes, the evolution of the stress arch in these settings differs from that in coal roadways or tunnels. Moreover, the current application of stress arch theory is mostly concentrated on excavation plan design and support, often leading to an overestimation of the load on pillars during pillar design. This results in excessively large pillar dimensions, leading to a high ore loss rate. Therefore, this paper aims to calculate pillar loads and pillar strength based on the stope stress arch theory, and to conduct optimization studies on pillar dimensions. This provides a basis for the rational design of pillar dimensions and effectively improving ore recovery rates.
2. Theoretical Analysis
Due to the evolution and distribution of the pressure arch in the pillar–roof system, the load on the pillars within a stope after mining is not uniformly distributed. The pillars in the central area bear a higher load than those at the edges, leading to instability and failure in the central pillars. Therefore, if pillars are designed based on the pillar area bearing theory, it will result in excessive load on the edge pillars of the stope. By deriving the equation for the pressure arch axis, a formula for calculating the roof pressure in a square stope based on pressure arch theory was obtained. Combining this with the pillar area bearing theory, a new method for calculating pillar load was proposed. This method effectively compensates for the shortcomings of the load distribution theory when applied to deep stopes, thereby improving the stope recovery rate.
2.1. Formation Mechanism and Mechanical Model of the Pressure Arch in Stopes
The excavation of the stope disrupts the stress equilibrium of the surrounding rock and induces stress redistribution, leading to stress concentration within a specific area of the roof strata. The concentrated compressive stress in the surrounding rock is distributed in an arched zone, which is referred to as the pressure arch. The overlying rock mass, under its self-weight and in situ stress, tends to deform and shift toward the nearest free surface. To counteract this deformation, the rock mass undergoes spontaneous stress redistribution, resulting in the pressure arch effect. Analysis of the principal stress vector distribution before and after stope excavation reveals that the principal stress within the arched surrounding rock is significantly lower than the pre-excavation level. Moreover, pressure arches form not only in the roof area but also in the sidewalls and roof of the stope, as illustrated in Figure 1.
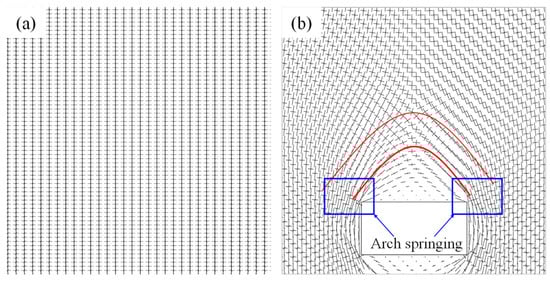
Figure 1.
Principal stress vector changes before and after room excavation. (a) Principal stress vector diagram of original rock, (b) Principal stress vector after excavation of the mine house.
After excavation of the stope, the radial stress in the surrounding rock decreases, and the tangential stress in some plastic and elastic zones increases. The arching coefficient k value method can be used to determine the boundary of the pressure arch, as shown in Equation (1).
where and represent the tangential stresses before and after excavation, respectively.
The stress distribution of surrounding rock in a single stope formed by underground mining can be analyzed based on the Protodyakonov’s arch theory model, as shown in Figure 2.
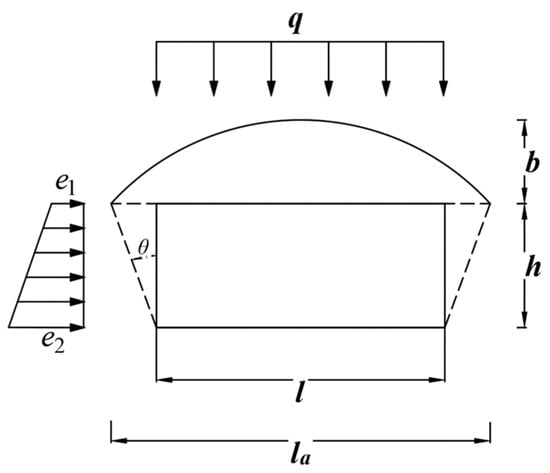
Figure 2.
Calculation model of Equilibrium arch for single chamber.
l is the span of the stope; h is the height of the stope; b is the height of the balanced arch; θ is the angle between the slip surface of the two sidewalls of the stope and their vertical lines, generally determined by θ = 45° − φ/2 (where φ is the internal friction angle of the surrounding rock); la is the length of the intersection line between the Protodyakonov arch and the horizontal plane of the stope roof; q is the vertical uniformly distributed load; e1 and e2 are the horizontal compressive stresses at the roof and floor of the stope, respectively. According to the assumption of the Protodyakonov arch theory, the vertical pressure q acting on the upper part of the stope can be expressed as:
The arch height b can be calculated by the following formula:
where γ is the unit weight of the surrounding rock, and f is the rock strength coefficient.
The lateral trapezoidal distribution pressures on the stope sides, denoted by e1 and e2, can be obtained using the following formulas:
After the surrounding rock arch effect bears the load, the reasonable arch axis of the pressure arch in the goaf roof area should be a quadratic curve. Therefore, the Protodyakonov arch of the goaf roof can be simplified as a horizontal two-hinged arch. Based on the Protodyakonov arch theory, the following assumptions can be made: ① The arch formed by the collapsed rock mass above the goaf can only withstand compressive stress and cannot withstand tensile stress; ② The arch is only subjected to the overlying rock load.
Based on the above assumptions, the physical model of the Protodyakonov arch in Figure 2 is simplified into the mechanical model of a two-hinged arch in Figure 3. Considering the structural symmetry, the right half of the arch is simplified as a horizontal thrust TO acting at point O, and only the right half of the arch structure is analyzed.
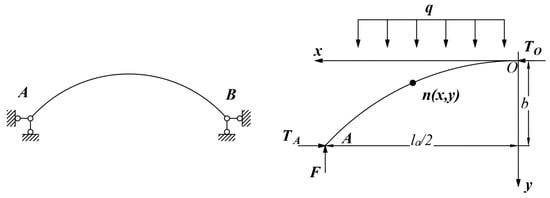
Figure 3.
Two hinged arch model and stress analysis sketch.
Based on the assumption that the arch is not subjected to tensile stress, the bending moment M at any point n(x, y) on the arch axis is 0. Taking the moment about point n, we obtain:
where TA and TB are the horizontal thrusts at points A and B, respectively; q1 and q2 are the horizontal loads of the overlying strata at the vault and the arch springing, respectively.
Thus, the equation of the arch axis can be obtained as:
and the vertical stress qn at any point n(x, y) within the pressure arch rock mass is determined as:
Due to the low bending moment capacity of the stope pressure arch, the two arch springing of the pressure arch can be regarded as hinged supports, and the unstable failure-prone area at the crown can also be considered as a hinged support. Thus, the axis of the pressure arch is assumed to be a three-hinged arch structure, as shown in Figure 4. Based on the mechanical characteristics of the three-hinged arch structure, when the arch is in equilibrium, the bending moment and shear force at any cross-section are both zero, with only axial force present. This arch axis is referred to as the optimal arch axis for the arch structure. The equation of the optimal arch axis can be determined based on the condition that the bending moment M is zero.
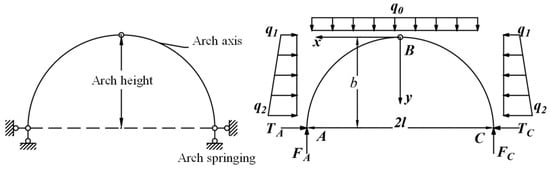
Figure 4.
Three hinged arch model and stress diagram.
2.2. Equation for the Pressure Arch Shape in the Mining Field
According to the mechanical model of the pressure arch in the mining field, after the excavation of a single-side mining chamber is completed, the support pressure arch spanning the roof area of the mining field can be simplified to a three-hinged arch structure, as shown in Figure 5. Considering the relatively small variation in lateral loads from the crown to the base of the arch, the horizontal stress is simplified to a uniformly distributed load λq.
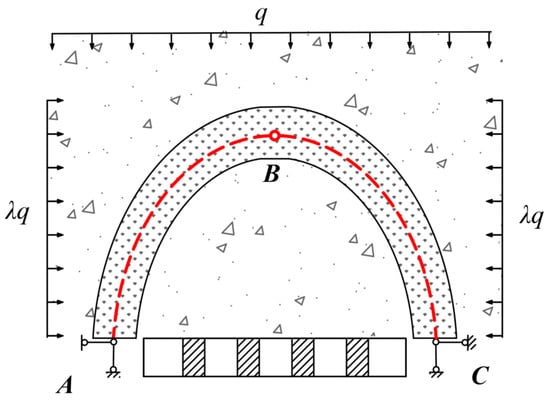
Figure 5.
Three-hinged arch structure of overlying rock in stope.
When the pressure arch is in a stable state, the arch axis is overall in equilibrium under various forces. By analyzing the forces acting on the left half (segment AB) of the pressure arch shown in Figure 6, the moment equilibrium of the system can be expressed as follows:

Figure 6.
Stress diagram of the left half of the pressure arch.
Figure 6.
Stress diagram of the left half of the pressure arch.

Further, taking the moment at any arbitrary point on segment AB of the arch axis, and considering that the bending moment on the arch axis of a three-hinged arch is zero, we can obtain:
where x and y represent the horizontal and vertical distances from the coordinate origin O, respectively. The general equation of the ellipse obtained by simplifying Equation (12) is:
It is evident that when the lateral pressure coefficient λ = 0, the basic assumption of the Prandtl arch is satisfied, and the shape is a parabolic arch.
When λ > 0, Equation (13) can be further simplified into the standard equation of an ellipse.
where
where I and J are geometry parameters where I denotes the vertical shift of the ellipse center, and J controls the arch size; both depend on λ and L. From Equation (15), it is observed that when λ = 1, the pressure arch takes the shape of a semicircular arch, and the equation of the arch axis is:
When 0 < λ < 1, the foci of the ellipse are located along the y-axis, with the lengths of the major and minor axes given, respectively, by and . When λ > 1, the foci of the ellipse are located along the x-axis, and the lengths of the major and minor axes are given, respectively, by and . The ratio of the major to minor axes of the pressure arch ellipse is .
2.3. Calculation of Pillar Load
- (1)
- Pillar Area Bearing Theory
According to the classical theory of pillar load calculation, the pillar load mainly consists of the weight of the overlying rock layers. In the estimation of pillar load in room and pillar mining, the commonly used method is the pillar area bearing theory. This method assumes that the load that a pillar in the mining area must bear is equal to the weight of the rock column that extends vertically from the roof area supported by the pillar to the surface (as shown in Figure 7). The average load on the pillar is calculated as:
where represents the unit weight of the overlying strata; H is the depth of the overlying strata in meters; AT is the base area of the pillar, ; B is the span of the stope in meters; and W is the width of the pillar in meters.
The average load on the pillar can be calculated using this information.
where e represents the extraction rate, ; and S0 represents the average stress on the pillars after the excavation of the mining site.
Based on Equation (20), the relationship between the extraction rate and the pillar stress concentration factor can be further derived, as shown in Figure 8.

Figure 7.
Calculation method of apportioned load.
Figure 7.
Calculation method of apportioned load.


Figure 8.
The change of pillar-stress concentration coefficient with the increase of recovery rate.
Figure 8.
The change of pillar-stress concentration coefficient with the increase of recovery rate.

The pillar area loading theory has been widely used in the design of stopes for shallow-buried ore bodies, yielding good results. However, when applied to deep-level pillar load calculations, it tends to significantly overestimate the pillar load [32,33]. This leads to overly conservative selection of the pillar safety factor and excessive pillar sizing, which greatly reduces the ore recovery rate.
- (2)
- Calculation of Pillar Load Based on the Pressure Arch Theory
After the excavation of the stope chamber induces a redistribution of stress in the surrounding rock, pressure arches form along both the strike and dip directions. These pressure arches bear the weight of the overlying rock mass and transfer the overlying load along the arch trace to the abutments on both sides. The weight of the rock mass within the arch is supported by the pillars below, meaning that the load on the pillars in the stope is the weight of the rock mass within the pressure arch shell. In the case of a square stope chamber, a “three-dimensional arch shell structure” forms in the overlying rock, leading to the conclusion that the load on the pillars within the stope mainly originates from the weight of the rock mass within the arch shell.
To determine the load on the ore pillar, the square stope is simplified into a cylindrical model with a square base inscribed in a circle, as shown in Figure 9. The height of the cylinder is consistent with that of the stope. If the pressure arch formed by the horizontal ore body excavation is symmetrical on both sides, each pressure arch formed by a cross-sectional plane passing through the center axis of the stope constitutes an ellipsoidal surface. The ellipsoidal surface shares the same characteristics as a single pressure arch. When the stope is stable, analyzing the moment for any basic unit on the ellipsoidal surface (∑Mi = 0) yields the fundamental equation of the ellipsoidal surface:


Figure 9.
Schematic diagram of simplified stope model.
Figure 9.
Schematic diagram of simplified stope model.
The simplified equatorial radius of the pressure arch ellipsoidal shell in a cylindrical stope (along the XOY plane) can be easily obtained as . According to the aspect ratio of the pressure arch obtained in Section 2.2, we can have , this can further derive the basic equation of the elliptical shell of the pressure arch above the stope:
Translate the coordinate axes of Equation (23) so that the origin of the coordinates is located at the lower-left corner of the mining site. The equation of the ellipsoid after translation is:
The load distribution at the roof of the stope pillar–roof system can be determined as follows:
Furthermore, the weight of the rock mass between the arch shell surface supported by the pillar–roof system and the roof can be obtained by integrating Equation (25):
According to the load-bearing theory of pillar area, as shown in Figure 10, the weight of the rock pillar borne by a single pillar in the mining field Qi is given by
where i and j represent the position of the pillar in the i th row and j th column within the stope; Vij is the volume of the rock pillar borne by the target pillar, measured in cubic meters m3; n represents the number of rows of pillars in the stope, as shown in Figure 10.
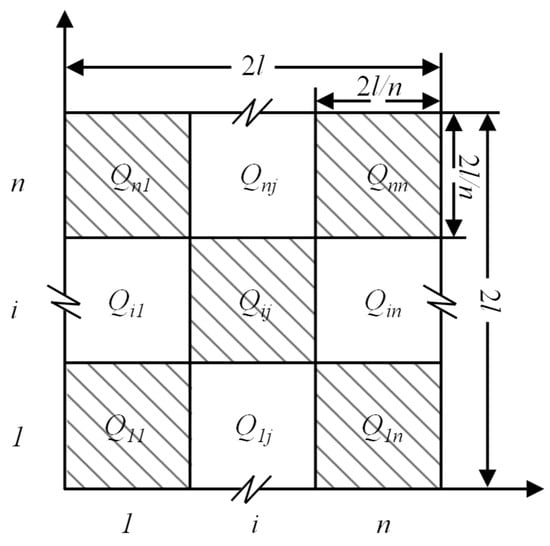
Figure 10.
Schematic diagram of load distribution of each pillar under pressure arch shell.
From Figure 11, the column load borne under the action of a single pillar can be determined as follows:
where A represents the cross-sectional area of the pillar in square meters m2.
The load on the pillars within a square mining field, arranged in an n × n pattern, is calculated using Equations (27) and (28):

Figure 11.
Schematic diagram of pillar bearing arch rock pillar.
Figure 11.
Schematic diagram of pillar bearing arch rock pillar.

2.4. Estimation of Pillar Strength
Pillar strength is defined as the peak load at which a pillar fails under compression. Accurately estimating pillar strength is of great importance for the design of mine pillars and the assessment of mine stability.
- (1)
- Bieniawski formula
Bieniawski proposed a formula for calculating pillar strength by analyzing the results of laboratory tests on samples with varying width-to-height ratios, combined with field test results [34]:
where Sp represents the pillar strength, in MPa; σrm represents the compressive strength of the rock mass, in MPa.
- (2)
- Lunder’s formula for estimating the strength of hard rock pillars
Lunder combined detailed studies on pillar stability with empirical engineering data to propose a comprehensive formula for estimating pillar strength [35]. This formula not only takes into account classical estimation methods but also incorporates the friction coefficient of the pillar, denoted as Ka. The formula has proven effective in practical applications.
where Ka represents the friction coefficient of the ore pillar, which can be calculated using the following formula:
where CP represents the average strength coefficient of the pillar, which is calculated based on the width and height of the pillar:
Considering that metal ore deposits are primarily composed of hard rock, and the Bieniawski formula was mainly proposed for coal pillars, this study uses the Lunder formula to calculate the load on the mine pillars.
2.5. Calculation of Pillar Safety Factor
When designing the dimensions of mine pillars and evaluating the stability of voids, the safety factor method is often used. This method measures the stability of the pillar by calculating the ratio between the pillar strength and the actual load on the pillar. The pillar safety factor K can be derived from Equation (34):
where S represents the load on the pillar, measured in MPa. By substituting Equations (27), (28) and (31) into Equation (34), we can obtain the following result:
Using Equation (35) to sequentially calculate the safety factors of each pillar within the mining area, the safety factor of the pillars in a square mining area with a layout of n × n pillars is finally obtained as:
2.6. Optimization Process for Pillar Size Based on Pressure Arch Theory
Based on the conclusions of the previous research, the pressure arch theory can be used to optimize the size of square room-and-pillar mine pillars. The optimization method is illustrated in Figure 12, and the specific steps are as follows:
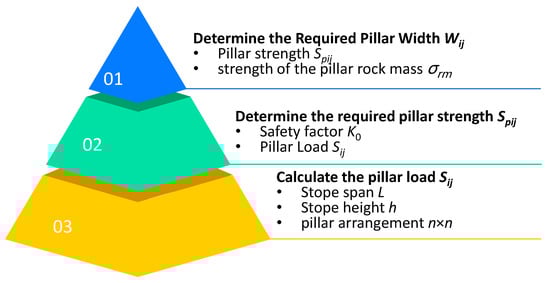
Figure 12.
Pillar size optimization process based on pressure arch theory.
- (1)
- Calculate the Pillar Load Sij
Determine the total span of the stope L = 2l, stope height h, lateral pressure coefficient λ, and the pillar arrangement n × n. Substitute these parameters into Equations (27) and (28) to sequentially calculate the load Sij on each pillar based on the pressure arch theory.
- (2)
- Determine the Required Pillar Strength Spij
Select a reasonable pillar safety factor K0 based on the actual stope conditions. Substitute the values of K0 and Sij into Equation (34) to calculate the required strength Spij for each pillar. In this study, K0 is chosen as 1.15.
- (3)
- Determine the Required Pillar Width Wij
Substitute the pillar strength Spij obtained in the previous step, the uniaxial compressive strength of the pillar rock mass, and the stope height h into Equation (31) to Equation (33) to ultimately determine the required pillar width Wij.
These three steps optimize the pillar size in a square stope, improving the accuracy of pillar load calculations and effectively avoiding the overestimation of pillar loads that can result in excessive pillar support using traditional pillar area bearing calculation methods. This approach enhances recovery rates and improves the economic efficiency of the mine while maintaining stope stability.
3. Numerical Simulation Analysis of Stope Excavation
3.1. Numerical Simulation Scheme and Model Establishment
The numerical simulation model is shown in Figure 13a. The mining depth is H = 800 m, with a stope dimension of 70 m × 70 m. The pillar width is W = 5 m, the room span is B = 10 m, and the mining height is H = 6 m. The width of the inter-panel pillar is 15 m. The geometric dimensions of the model are 215 m × 130 m × 110 m, corresponding to the x, y, and z directions, respectively. The model consists of 380,000 zones and 400,000 grid nodes. The Mohr–Coulomb constitutive model was adopted to analyze the yielding behavior of the surrounding rock. The reduced mechanical parameters of the rock mass, including the roof, floor, and ore rock, are presented in Table 1.
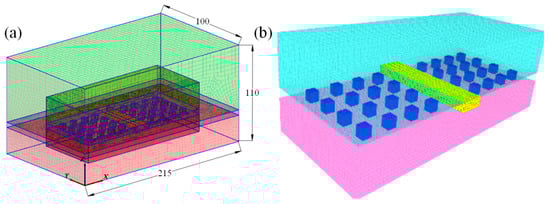
Figure 13.
Schematic diagram of grid model. (a) Numerical modeling, (b) Pillar–Roof systems.

Table 1.
Mechanical parameters of rock mass after reduction.
3.2. Stope Excavation Scheme and Stress Analysis
The panel stope excavation process follows the sequence of stope numbers shown in Figure 14a. First, the five stopes in Stope 1 on the right side of the panel are excavated sequentially along the strike direction in the order of I→V. Then, the five stopes in Stope 2 on the left side of the panel are excavated sequentially along the strike direction in the order of VI→X. The excavation of a single stope follows the actual production method, involving unidirectional excavation along the dip direction. Each advance progresses 14 m, and after the model calculates 4000 time steps until rebalancing, the next advance is performed. A single stope is excavated in five stages (①→⑤), totaling 20,000 time steps, as shown in Figure 14b.
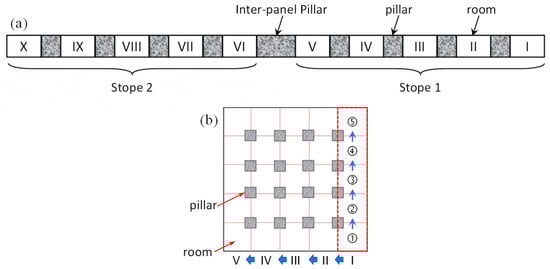
Figure 14.
Panel stope simulation excavation scheme. (a) Stope excavation sequence, (b) Schematic diagram of stope layout.
Figure 15 presents the vertical stress distribution nephograms along the strike of the model after the excavation of ore rooms 1, 4, 7, and 10 during the stope excavation process. It can be observed from Figure 15 that ore room excavation disrupts the stress balance of the surrounding rock, triggering stress redistribution. Tensile stress gradually emerges in the roof and increases with the progression of ore room excavation. after the completion of ore room 10 excavation, numerical simulation results indicate that the tensile stress in the roof is 0.64 MPa, which is less than the tensile strength of the roof rock mass (0.78 MPa). This demonstrates that the roof does not experience tensile failure and remains stable. Following ore room excavation, the stress in the roof stress relief zone is transferred to the pillars or sidewalls on both sides of the ore rooms due to the pressure arch effect, resulting in the formation of a stress concentration area at the top of the pillars, namely the “pressure-bearing zone”. The stress in the pressure-bearing zone is transmitted downward, leading to the maximum vertical stress at the center of the middle section of the pillars. Meanwhile, due to the superposition of the arch foot regions of the stress relief zones above the ore rooms on both sides, the load on the pillars located in the center of the stope is greater than that on the edge pillars. This differs from the “pillar area bearing theory”, which posits that the loads on stope pillars are uniform and independent of their positions. This further confirms that pressure arch structures are also formed in the surrounding rock after the excavation of hard rock mines. Accordingly, in stope design, the size of the central pillars can be appropriately increased while reducing the size of the edge pillars. This approach improves the recovery rate and generates greater economic benefits while ensuring safety.
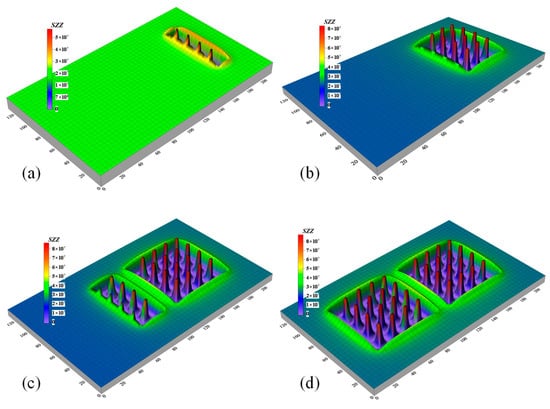
Figure 15.
Distribution of vertical stress in roof during excavation. (a) Excavation of room 1 completed, (b) Excavation of room 4 completed, (c) Excavation of room 7 completed, (d) Excavation of room 10 completed.
Owing to the roof stress transfer induced by ore room excavation, the span and height of the pressure arches above each ore room continuously increase, causing the fusion and connection of the stress relief zones above adjacent ore rooms to form a larger-scale stress relief zone. This also implies that the pressure arches outside the stress relief zones gradually evolve from single open pressure arches to expanded pressure arches, resulting in an increased weight of the stress relief zone borne by the top of the pillars. Finally, after the completion of the excavation of the two stopes in the panel, an arched stress relief zone spanning the entire stope is formed above the roof of each stope, which is the final stope pressure arch. This effectively controls ground pressure and ensures stope stability.
4. Case Analysis
4.1. Project Overview
The Nanwen River Tungsten Mine is a karstic underground mine located in Wenshan Prefecture, Yunnan Province, near the China–Vietnam border, with geographic coordinates ranging from 104°38′56′′ to 104°40′06′′ E longitude and 22°58′05′′ to 22°59′06′′ N latitude. The geological structure of the mining area is relatively simple, dominated by folds and faults, with a generally gentle dip angle of 2° to 15°, classifying it as a strata-bound deposit. The ore bodies in the mining area are distributed in a banded pattern, primarily consisting of stratiform skarn-type scheelite. The deeper rock is hard and relatively intact, with hydrological conditions favorable for mining. The ore-bearing rock, or ore rock, is skarn, while the hanging wall and footwall rocks mainly consist of skarn, granitic gneiss, and schist.
The ore body is distributed at depths ranging from 221 to 1210 m, with the current mining depth reaching 780 to 960 m underground. The stope areas are generally square regions measuring 80 m × 80 m, within which circular or square cross-sectional pillars (also known as point pillars) with diameters ranging from 3 to 7 m are left in place. The span between these point pillars is 8 to 12 m, and the height of the stopes generally ranges from 3 to 8 m, depending on the distribution of the ore body. The total area of the formed voids has reached 770,000 square meters, with a volume of approximately 2 million cubic meters, and this is expected to increase by about 300,000 cubic meters annually, posing a significant safety threat.
4.2. Optimization Analysis of Pillar Size
According to the geological data of the mine, the overburden density in the stope is 27.8 kN/m3, the compressive strength of the pillar rock mass is 38.1 MPa, and the lateral pressure coefficient is λ = 0.5. The current structural parameters of the stope are shown in Table 2.
Table 2.
The stope structure parameters need to be optimized.
- (1)
- Current pillar strength calculation
Substitute the current pillar width W = 6 m, pillar height h = 6 m, and pillar rock compressive strength into Equation (31) to Equation (33) to obtain the results:
- (2)
- Calculation of the actual load on the pillar
- a.
- Theoretical Load Calculation Based on Pillar Area
Substituting the above stope structural parameters into Equation (20) yields the average load on the pillar under the theoretical assumption of distributed area.
It can be observed that the pillar load S0 calculated using the method based on the pillar area load-bearing calculation is significantly greater than the pillar strength Spn, making this method unsuitable for estimating the load on deep pillars.
- b.
- Pillar Load Calculation Based on the Pressure Arch Theory
Typically, a pillar safety factor K ≥ 1 is considered sufficient to ensure pillar stability. In the design of pillars within a stope, a safety factor 1.1 ≤ K ≤ 1.5 is generally required. Given the high strength and good integrity of the rock in this tungsten mine, and considering the disturbances to the pillars caused by mechanical vibrations and blasting during mining operations, a safety factor of K0 = 1.15 is selected.
Substituting the values for the stope l = L/2 = 35 m, h = 6 m, λ = 0.5 and n = 4 into Equation (27), the weight Qij of the rock pillars within the arch shell of the pressure arch, bearing different pressures at various locations in the stope, is sequentially calculated according to the procedure shown in Figure 16.


Figure 16.
Load distribution of ellipsoidal arch shell in stope area.
Figure 16.
Load distribution of ellipsoidal arch shell in stope area.
Substituting the above results into Equation (28), the actual load on the current ore pillar (MPa) is obtained as follows:
Substituting the current pillar’s actual load Sijn and current pillar strength Spn = 21.24 MPa into Equation (35) yields the safety factor at various positions within the pillar for the current pillar dimensions:
It can be observed that the current safety factors of the pillars are slightly conservative, all exceeding the reasonable safety factors (K0 = 1.15) for the pillars. This is particularly evident for the edge pillars of the stope, where the safety factor has reached 2.02. Therefore, it is necessary to further optimize the pillar dimensions.
- (3)
- Calculation of the Actual Required Pillar Width Wij
Based on the selected reasonable safety factor (K0 = 1.15) for the pillar and the weight of the rock column within the arch borne by each pillar Qij, the actual required width Wij of the pillar can be determined using Equations (28) and (31). The relationship between Wij and the above two parameters is given by Equation (38):
where Wij represents the actual required width of each pillar, and Kaij is the friction coefficient of each pillar.
By further solving Equation (38), the width Wij of the pillar, which is based on the pressure arch load calculation method and satisfies the reasonable safety factor for the pillar, is obtained. This width represents the optimized target width for the pillar dimensions.
- (4)
- Recovery Rate of Ore Blocks Before and After Optimization
- ①
- Recovery Rate Before Optimization (e1)
Before optimization, the ore pillar width, ore pillar height, and ore block size are 80 m × 80 m, with the edge pillar width being 5 m and the stope span L = 2l = 70 m.
where Apij represents the cross-sectional area of each pillar within the stope, measured in square meters, m2; Ae is the cross-sectional area of the boundary pillar of the stope, m2; Az denotes the total area of the ore block, m2; e represents the ore block recovery rate.
- ②
- Optimized Recovery Rate e2
By comparison, it can be observed that optimizing the size of the pillars significantly improved the recovery rate, with an increase of 1.91%, demonstrating a notable effect.
5. Discussion
5.1. Analysis of the Application Limitations of the Pressure Arch Model
The pressure arch model proposed in this paper assumes a homogeneous and isotropic rock mass, neglecting the influence of rock mass anisotropy. In anisotropic and fractured rock masses, the strength and behavior of the rock mass exhibit strong directionality, leading the pressure arch to most likely develop along the direction of the highest rock mass strength. Furthermore, the failure of the pressure arch may not be an overall arch collapse, but rather local sliding, bending, or spalling along weak planes. When the rock mass quality is poor, the rock mass tends to behave as a loose medium, which is unfavorable for the accurate calculation of pillar loads. Therefore, for anisotropic or fractured rock masses, the pressure arch theory facilitates understanding of the manifestation of stress redistribution but cannot be directly used for the accurate calculation of pillar loads, as this would overestimate the integrity of the rock mass structure.
Dynamic loads generated during the mining process instantly exert enormous inertial forces, leading to the instantaneous load borne by the pressure arch far exceeding the static design value. Stress waves generated by dynamic loads undergo reflection and refraction when encountering fractures, easily forming tensile stress zones that induce the continuous propagation of microcracks in the rock mass, thereby weakening the strength of the rock mass and pillars. After ore room excavation, stress redistribution occurs in the rock mass, and the load is gradually transferred to the pillars. Under the action of sustained high stress, the pillar rock mass will experience time-dependent creep deformation, which further causes changes in the shape and internal force distribution of the pressure arch. Eventually, the pressure arch may enter the accelerated creep stage, leading to failure.
5.2. The Influence of Lateral Pressure Coefficient and Stope Span on Recovery Rate
The lateral pressure coefficient reflects the ratio relationship between horizontal stress and vertical stress. When the stope span is constant (L = 70 m), with the increase of the lateral pressure coefficient, the recovery rate exhibits a significant positive correlation with the lateral pressure coefficient, as shown in Figure 17a. This is mainly due to the fact that higher horizontal stress facilitates the formation of a more stable and higher load-bearing capacity “pressure arch” above the stope roof. This arch structure can effectively transfer the load of the overlying strata to the pillars on both sides of the stope, thereby reducing the load and deformation of the immediate roof and lowering the risk of roof collapse. When the λ value is large, the surrounding rock is in a higher triaxial compressive state. This stress state can significantly inhibit the propagation of tensile cracks in the rock mass, maintaining better integrity of the rock mass. This means that during the mining process, the reserved roof protection coal pillars or the coal walls to prevent rib spalling can be thinner, thereby improving the recovery rate of the working face.
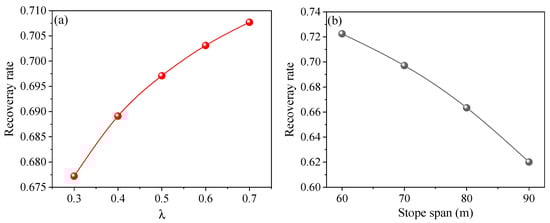
Figure 17.
Variation pattern of recovery rate with the lateral pressure coefficient (a) and stope span (b).
Figure 17b shows that when the lateral pressure coefficient is constant (λ = 0.5), with the increase of the stope span, the recovery rate gradually decreases, exhibiting an obvious negative correlation. The increase in stope span increases the exposure degree of the stope roof. According to the knowledge of material mechanics, the bearing capacity of a beam is inversely proportional to the square of its span. As the span increases, the tensile stress and bending deformation in the middle of the roof strata will increase rapidly. When the stope span exceeds a certain critical value, the roof will undergo fracture and collapse. For safe production, wider safety coal pillars must be set to support the roof, resulting in a reduction in recoverable resources and a decline in recovery rate. In addition, an excessively large stope span will also lead to the instability of the “pressure arch” above. The larger the span of the arch, the greater the arch height required to maintain its stability, and the stress concentration at the arch feet will be extremely severe, which may cause rock burst or creep failure of the pillars. Once the pressure arch loses stability, the entire load of the overlying strata will act directly on the pillars. This is highly prone to triggering catastrophic failure. To control ground pressure, it is imperative to retain a large number of permanent pillars, thereby significantly reducing the recovery rate.
6. Conclusions
Based on the analysis of mining arch morphology theory, this paper addresses the limitations of existing pillar load estimation methods in deep mining environments and proposes a pillar load calculation method based on the mechanical characteristics of pressure arch shell structures. The specific conclusions are as follows:
- (1)
- By simplifying the pressure arch in the mining field into a three-hinged arch structure and conducting mechanical analysis on this structure, it was determined that the pressure arch morphology follows an elliptical trajectory, with the ratio of the major to minor axes being , which was determined by the lateral pressure coefficient λ and the mining field span L.
- (2)
- There is an ellipsoidal shell structure within the overburden of a three-dimensional square mining stope, and the load on the pillars varies at different locations within the stope. By combining the load-bearing area theory of pillars, it is determined that the pillars at various locations in the stope bear the weight of the overlying rock based on the pressure arch theory. This approach can be used to accurately estimate the load on pillars at different locations.
- (3)
- The study on optimizing the size of stope pillars based on the pressure arch theory shows that this method can effectively increase the recovery rate by 1.91%. The recovery rate of the ore block increased from 67.56% to 69.47%, an increase of 1.91%, resulting in significant economic benefits.
Author Contributions
W.G.: Methodology, Software, Investigation, Formal Analysis, Writing—Original Draft, Funding Acquisition. L.Z.: Software, Formal Analysis, methodology. T.Z.: resources, Conceptualization. S.G.: Validation, Visualization, Writing—Review & Editing, Funding Acquisition. G.H.: Conceptualization, Supervision. Y.X.: Methodology, Investigation. All authors have read and agreed to the published version of the manuscript.
Funding
This research was funded by the Scientific Research Foundation of Hunan Provincial Education Department (23B0826, 24A0651), the Hunan Provincial Natural Science Foundation (2025JJ70124), the Research Start-up Fund Project of Hunan Institute of Technology (HQ23013, HQ23040), the Science and Technology Research Program of Chongqing Municipal Education Commission (KJQN202304402).
Data Availability Statement
Data supporting the findings of this study are available from the corresponding author upon request.
Acknowledgments
Thanks to reviewers and editors for their careful review of this manuscript.
Conflicts of Interest
Author Tihua Zhang was employed by the company Zhongjian Siju Jiaotong Investment and Construction Co., Ltd. The remaining authors declare that the research was conducted in the absence of any commercial or financial relationships that could be construed as a potential conflict of interest. The company had no role in the design of the study; in the collection, analyses, or interpretation of data; in the writing of the manuscript, or in the decision to publish the results.
References
- He, M.; Wang, Q. Rock dynamics in deep mining. Int. J. Min. Sci. Technol. 2023, 33, 1065–1082. [Google Scholar] [CrossRef]
- Jiang, B.; Xin, Z.; Zhang, X.; Deng, Y.; Wang, M.; Li, S.; Ren, W. Mechanical properties and influence mechanism of confined concrete arches in high-stress tunnels. Int. J. Min. Sci. Technol. 2023, 33, 829–841. [Google Scholar] [CrossRef]
- Li, X.; Huan, H.; Lin, H.; Li, Z.; Du, F.; Cao, Z.; Fan, X.; Ren, H. Determination method of rational position for working face entries in coordinated mining of section coal pillars and lower sub-layer. Sci. Rep. 2025, 15, 29440. [Google Scholar] [CrossRef]
- Androulakis, V.; Sottile, J.; Schafrik, S.; Agioutantis, Z. Navigation system for a semi-autonomous shuttle car in room and pillar coal mines based on 2D LiDAR scanners. Tunn. Undergr. Sp. Tech. 2021, 117, 104149. [Google Scholar] [CrossRef]
- Kang, B.-Y.; Hyuk, B.S.; Roh, C.-K.; Kim, D. Stability evaluation of room-and-pillar underground method by 3D numerical analysis model. J. Korean Tunn. Undergr. Space Assoc. 2023, 25, 1–11. [Google Scholar] [CrossRef]
- Liu, Y.; Gu, T.; Wang, Y.; Xiong, W.; Yang, X. Deformation characteristics of overlying strata in room and pillar mined-out areas under coal pillar instability. Sci. Rep. 2024, 14, 1006. [Google Scholar] [CrossRef]
- Chaoshang, S.; Chaoyang, S.; Zhiming, Z.; Haixiao, L.; Zhenhua, L.; Feng, D.; Zhengzheng, C.; Pengtao, L.; Lin, L. Overburden failure characteristics and fracture evolution rule under repeated mining with multiple key strata control. Sci. Rep. 2025, 15, 28029. [Google Scholar] [CrossRef] [PubMed]
- Cao, Z.; Zhang, S.; Xue, Y.; Wang, Z.; Du, F.; Li, Z.; Huang, C.; Wang, S.; Yu, Y.; Wang, W.; et al. Disaster-Causing Mechanism of Spalling Rock Burst Based on Folding Catastrophe Model in Coal Mine. Rock Mech. Rock Eng. 2025, 58, 7591–7604. [Google Scholar] [CrossRef]
- Sarfarazi, V.; Babanouri, N.; Fattahi, S.; Asgari, K. Study on failure mechanism of room and pillar with different shapes and configurations under uniaxial compression using experimental test and numerical simulation. Undergr. Space 2023, 9, 105–121. [Google Scholar] [CrossRef]
- Sun, F.W.; Sun, Z.Y.; Zhang, D.L.; Li, M.Y. Large-scale model test and numerical analysis of load-bearing arch characteristics of large cross-section tunnel under high geostress. Eng. Fail. Anal. 2024, 163, 108600. [Google Scholar] [CrossRef]
- Wang, X.Q.; Kang, H.P.; Gao, F.Q. Numerical study on the formation of pressure arch in bolted gravel plate. Comput. Geotech. 2021, 130, 103933. [Google Scholar] [CrossRef]
- Yang, Y.L.; Zhao, Y.X.; Ma, J.Q.; Han, P.H. Study on stability and bearing characteristics of macroscopic pressure arch of surrounding rock in western deep buried stope of China. Front. Earth Sci. 2023, 11, 1125689. [Google Scholar] [CrossRef]
- Zhou, P.; Jiang, Y.F.; Zhou, F.C.; Li, J.Y.; Lin, M.; Lin, J.Y.; Wang, Z.J. Study on pressure arch effect of xigeda strata tunnel based on experiment and discrete element simulation. Bull. Eng. Geol. Environ. 2022, 81, 199. [Google Scholar] [CrossRef]
- Sun, C.X.; Zhang, Y.M.; Guan, L.; Zhang, L.Y.; Peng, J.F. Force-Chain-Based Analysis of Factors Influencing Pressure Arch Around Tunnel Under Earthquake. Front. Earth Sci. 2022, 10, 851285. [Google Scholar] [CrossRef]
- Qiu, H.Y.; Huang, M.Q.; Weng, Y.J. Stability Evaluation and Structural Parameters Optimization of Stope Based on Area Bearing Theory. Minerals 2022, 12, 808. [Google Scholar] [CrossRef]
- Zhang, D.M.; Zhao, H.; Li, G. Study on Size Optimization of a Protective Coal Pillar under a Double-Key Stratum Structure. Appl. Sci. 2022, 12, 11868. [Google Scholar] [CrossRef]
- Wang, S.R.; Li, N.; Li, C.L.; Zou, Z.S.; Chang, X. Instability mechanism analysis of pressure-arch in coal mining field under different seam dip angles. Dyna 2015, 90, 279–284. [Google Scholar] [CrossRef]
- Li, Q.S.; Zhang, Y.J.; Zhao, Y.Q.; Zhu, Y.H.; Yan, Y.G. Study on Stability Discrimination Technology of Stope Arch Structure. Sustainability 2022, 14, 11082. [Google Scholar] [CrossRef]
- Hu, Z.H.; Wu, B.B.; Xu, N.W.; Wang, K. Effects of discontinuities on stress redistribution and rock failure: A case of underground caverns. Tunn. Undergr. Space Technol. 2022, 127, 104583. [Google Scholar] [CrossRef]
- Zhang, B.C.; Sun, D.Q.; Zheng, R.L. Evolution Law of Coal Seam Abutment Pressure under the Influence of Shallow Buried Complex Strata: A Case Study. Shock Vib. 2021, 2021, 6670175. [Google Scholar] [CrossRef]
- He, S.H.; Wang, D.H.; Liu, X.B.; Zhang, J.W. Assessment of the arching effect and the role of rock bolting for underground excavations in rock masses—A new numerical approach. Arab. J. Geosci. 2020, 13, 562. [Google Scholar] [CrossRef]
- Wang, S.R.; Li, C.L.; Wang, Y.G.; Zou, Z.S. EVOLUTION CHARACTERISTICS ANALYSIS OF PRESSURE-ARCH IN A DOUBLE-ARCH TUNNEL. Teh. Vjesn.-Tech. Gaz. 2016, 23, 181–189. [Google Scholar] [CrossRef]
- Wang, S.R.; Wu, X.G.; Zhao, Y.H.; Hagan, P. Mechanical Performances of Pressure Arch in Thick Bedrock during Shallow Coal Mining. Geofluids 2018, 2018, 2419659. [Google Scholar] [CrossRef]
- Wang, W.; Zhang, H.; Bian, J. Research on the Opportunity of Construction Method Conversion in Upper-Soft and Lower-Hard Stratum Based on Pressure Arch Theory. In Proceedings of the 1st GeoMEast International Congress and Exhibition on Sustainable Civil Infrastructures, Sharm El Sheikh, Egypt, 15–19 July 2017; Springer: Cham, Switzerland, 2018; pp. 8–16. [Google Scholar] [CrossRef]
- Kong, X.; Liu, Q.; Pan, Y.; Liu, J. Stress redistribution and formation of the pressure arch above underground excavation in rock mass. Eur. J. Environ. Civ. Eng. 2021, 25, 722–736. [Google Scholar] [CrossRef]
- Kong, X.X.; Liu, Q.S.; Zhang, Q.B.; Wu, Y.X.; Zhao, J. A method to estimate the pressure arch formation above underground excavation in rock mass. Tunn. Undergr. Space Technol. 2018, 71, 382–390. [Google Scholar] [CrossRef]
- Farmer, I.W. Coal Mine Structures; Springer: Dordrecht, The Netherlands, 1985. [Google Scholar] [CrossRef]
- Holland, C.T. The strength of coal in mine pillars. In Proceedings of the 6th US Symposium on Rock Mechanics (USRMS), Rolla, MO, USA, 28–30 October 1964; OnePetro: Houston, DA, USA, 1964. [Google Scholar]
- Hoek, E.; Brown, E.T. The Hoek–Brown failure criterion and GSI—2018 edition. J. Rock Mech. Geotech. Eng. 2019, 11, 445–463. [Google Scholar] [CrossRef]
- Gong, P.; He, Z.X.; Ma, Z.G.; Zhou, F.Y.; Li, Y. Size optimization and co-operative support mechanism of coal pillar in residual resources recovery working face. Therm. Sci. 2023, 27, 697–703. [Google Scholar] [CrossRef]
- Zang, C.W.; Jiang, B.Z.; Wang, X.S.; Wang, H.; Zhou, J.; Chen, M.; Cong, Y. Study on damage law and width optimization design of coal pillar with the discrete element method. Geomech. Geoeng. 2024, 37, 555–563. [Google Scholar] [CrossRef]
- Poulsen, B. Coal pillar load calculation by pressure arch theory and near field extraction ratio. Int. J. Rock Mech. Min. Sci. 2010, 47, 1158–1165. [Google Scholar] [CrossRef]
- Zipf, R. Toward Pillar Design to Prevent Collapse of Room-and-Pillar Mines. In Proceedings of the 108th Annual Exhibit and Meeting, Society for Mining, Metallurgy, and Exploration, Denver, CO, USA, 26–28 February 2001; Available online: https://stacks.cdc.gov/view/cdc/162014 (accessed on 7 December 2025).
- Ren, Q.; Wang, F.; Chen, B.; Zhao, M.; Peng, Z.; Yang, M. Study on Stability Prediction of Pillars Based on Bieniawski Pillar Strength Formula: A Case of a Phosphate Mine. Geotech. Geol. Eng. 2020, 38, 4033–4044. [Google Scholar] [CrossRef]
- Walton, G.; Sinha, S. Improved empirical hard rock pillar strength predictions using unconfined compressive strength as a proxy for brittleness. Int. J. Rock Mech. Min. Sci. 2021, 148, 104934. [Google Scholar] [CrossRef]


Disclaimer/Publisher’s Note: The statements, opinions and data contained in all publications are solely those of the individual author(s) and contributor(s) and not of MDPI and/or the editor(s). MDPI and/or the editor(s) disclaim responsibility for any injury to people or property resulting from any ideas, methods, instructions or products referred to in the content. |
© 2025 by the authors. Licensee MDPI, Basel, Switzerland. This article is an open access article distributed under the terms and conditions of the Creative Commons Attribution (CC BY) license (https://creativecommons.org/licenses/by/4.0/).