Abstract
The WieZhou12 oilfield (also known as WZ12 oilfield, the same below) is in urgent need of development using large-scale volumetric fracturing technology since it is a typical complex fault-block oilfield with low porosity, low permeability, and no natural production capacity. To study the fracturing measures with surfactants in offshore oilfields like WZ12, the surfactant fracturing fluid types were experimentally selected based on their effect of decreasing interfacial tension and enhancing matrix wettability. The water cut law and oil displacement efficiency in displacement experiments were also analyzed, according to surfactant type and fluid characteristics. Next, using the numerical simulation software CMG, the study completed the integrated simulation of volumetric fracturing in the “injection–soaking–flowback” process. Finally, some critical parameters were optimized for the block model, including the quantity of injected fluids, the soaking time, and the rate of fluid flowback. The results showed that the most suitable surfactant was 0.5% ammonium lauryl polyether sulfate (ALES), which had a low interfacial tension of 1.7 × 10⁻² mN/m, a contact angle of 20.071° with the core, and a 52% oil displacement efficiency. From the simulations, the suggested production parameters for energy storage fracturing are as follows: a daily injection volume of 600 m3/d, a soaking time of 25 days post fracturing, and a fluid production rate of 270 m3/d. The findings of this study establish a significant theoretical foundation for optimizing surfactant type and provide construction advice for the integrated measure of fracturing, well shut-in, and production in offshore oilfields.
1. Introduction
The typical characteristics of unconventional oil and gas reservoirs are ultra-low permeability and insufficient flow capacity [1,2,3]. Horizontal wells combined with large-scale volumetric fracturing methods are frequently used to achieve industrial production [4,5,6]. The fracturing methods are mainly divided into two categories: energy storage pre-fracturing and during fracturing [7,8]. The latter refers to a high amount of fluid being injected into the well, along with additives such as surfactants, as pad fluid to enhance reservoir energy and create fractures [9,10]. The fluid flows back and is collected after the well is shut in for a predetermined amount of time. By increasing the injection rate during the pumping step, this method facilitates fracture propagation and increases the fracture network’s complexity [11,12,13]. In the meantime, it makes full use of the fracturing fluid to restore formation pressure and the surfactant to improve imbibition with fluid exchange during the soaking period [14,15]. Compared with conventional fracturing techniques, energy storage fracturing operations have shown an obvious EOR effect in the low-permeability oil reservoir of China [16,17].
Entering the formation, the fracturing fluid will diffuse between fractures and the matrix. By adding surfactant components, the flow resistance of crude oil will be decreased, hence increasing oil output [18,19]. In 2016, Li et al. conducted indoor experiments to examine the influence of surfactant on fluid displacement and imbibition during soaking time after fracturing [20]. The findings demonstrated that surfactant could alter the reservoirs’ wettability and increase the production of a single well by 3~6 t/d. In 2020, Tu et al. [21] carried out experimental and numerical simulation studies on the imbibition process of surfactant solution in shale reservoirs at room temperature and atmospheric pressure. It can be concluded that the use of surfactant solution, which makes the reservoir more hydrophilic, and maintaining a relatively high interfacial tension can improve the oil recovery of shale reservoirs sufficiently. In 2022, Zhang et al. examined the impact of surfactant solution on the imbibition effect in shale cores using nuclear magnetic resonance (NMR) technology [22]. It was determined that the composite surfactant FST-1 can lower the oil–water interfacial tension and alter the wettability of the rock, achieving an oil displacement efficiency of 25% to 39.4%. In 2025, Li et al. studied the influence of surfactant concentration on the reservoir interface properties and the oil displacement and imbibition efficiency to reveal their microscopic mechanism, using amphoteric surfactant (EAB-40) as the main agent of the clean fracturing fluid system [23].
During the process of flowback after fracturing, an excessively high production rate will deplete the reservoir’s energy, while a slower production rate may result in a significant volume of fracturing fluid being held in the reservoir, causing water lock and other damage. Therefore, it is impossible to overlook how drainage parameters affect oil output. In 2014, by comparing the changes in fracture length before and after well shut-in, Sharak et al. [24] investigated the effects of soaking time and delayed production on oil wells and concluded that extended soaking time reduces fracture conductivity. In 2018, You et al. [25] carried out experiments on the shale under confining pressure conditions, and they found that the permeability of high-permeability rock samples was damaged to a certain extent under hydration, while low-permeability rock samples showed a certain increase under the imbibition of small hole throats. In 2019, Wang [26] developed a single well block model and a one-fracturing-stage model using numerical simulation techniques, examined the influence of the wells’ energy storage effect on production, and examined the characteristics of formation pressure change over time. In 2020, Wang et al. [27] completed numerical simulation work and thoroughly considered the shale reservoir’s characteristics, including the fracturing pressure, capillary pressure, and chemosmosis impacts. It was concluded that closing the well after fracturing could increase gas production and restore the formation’s energy by simulating the movement of fracturing fluid. In 2023, an oil–water two-phase flow model that takes capillary pressure into account was developed by Wei et al. [28]. They also studied how soaking time affected the amount of absorbed water and the produced oil. In 2025, based on core spontaneous imbibition experiments and physical flat core simulations, Wang et al. [29] found that introducing surfactant in energy storage fracturing fluid can enhance the oil-water exchange efficiency. During the well shut-in and production process, the flat core with fractures under the high-pressure rapid storage method has a large swept area [30,31].
At present, the integrated simulation of volumetric fracturing and flowback with surfactants is mainly concentrated in onshore low-permeability oilfields, while there is a gap in its application for offshore tight oil reservoirs. To study the issue, this paper carried out experimental and numerical simulation studies based on the WZ12 oilfield in the Beibu Gulf Basin, which has a permeability of 3 × 10⁻³ μm2, and requires fracturing technologies. Firstly, the surfactant flow performance and displacement experiments were conducted on the core, and the oil–water interface characteristics, rock wettability measurements, and oil displacement efficiency of various fracturing fluid systems are thoroughly compared. Then, numerical simulations of fracturing and fluid flowback in low-permeability reservoirs were conducted based on the selection of the best surfactant for the target block. Finally, the parameter combinations of fracturing in the “injection–soaking–flowback” process in the actual block model were ultimately optimized by designing simulation schemes with varying injection volumes, soaking times, and fluid production rates. The mechanism and issue of numerous influencing factors were addressed in the integrated energy storage fracturing process, and the results of this paper will provide theoretical references for similar oil and gas reservoirs.
The novelties of this work include the following: (1) The incompatibility of conventional surfactants in offshore oilfields was resolved by screening out the ALES surfactant. It has heat and salt resistance in response to the high-temperature and high-mineralization environment of WZ12 offshore oilfield. (2) The use of energy storage fracturing in offshore complex fault-block tight oilfields was expanded by the establishment of a computational model that took double-porosity and double-permeability into account. An operation system that is better suited for offshore oil and gas development has been formed through optimization of injection–production parameters.
2. Field Background
It is challenging to develop low-permeability or shale reservoirs effectively with conventional water and gas injection methods, and therefore, reservoir evaluation needs to be carried out first [32]. Due to significant variations in the diagenesis environment, the WZ12 oilfield shows changes in porosity, permeability, and the development of fracture structures. The dual media of matrix and fracture form strong heterogeneous characteristics. It has high threshold pressure, clear non-Darcy flow characteristics, and the absence of an oil well’s natural production capacity. High injection pressure and a sharp decline in output are all difficulties with low economic benefits.
2.1. Geological Structure
As illustrated in Figure 1, the WZ12 oilfield is situated in the west-central region of the Wei depression in the Beibu Gulf Basin of the South China Sea, a complex fault-block structure. The field is separated into the South, Middle, and the North Block by two major faults, F1 and F2. The South Block is a huge and entire zone, while the Middle Block is separated into zones A and B by the fault F2A. There are some small faults in the region, and the F81, F82, and F9 faults cut through the North Block. The formation of the WZ12 oil reservoir mainly belongs to the Paleogene system, which is numbered W-II, W-III, and W-IV from top to bottom [33].
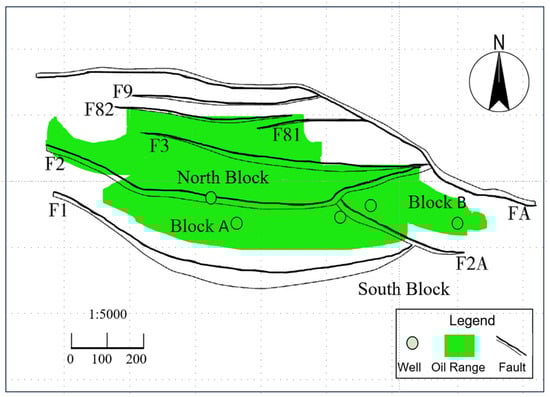
Figure 1.
Planar structural diagram of WZ12 Oilfield. All faults are normal faults.
2.2. Physical Properties of the Reservoir
The WZ12 oilfield has an average porosity of 15%, with intergranular and filling internal pores predominating. More than half of all pore types in sandstones are intergranular dissolved pores. Feldspars and neutral acidic rock chips, some of which include carbonate cementation and some of which contain quartz, make up most of the dissolved minerals.
Under the condition of similar porosity, the differences in sedimentary microfacies and particle sizes lead to variations in permeability. For instance, the grain diameter of the sand body in the diversion bay is relatively fine, and the diverse lithologies include fine sandstone and muddy siltstone (Figure 2). All of these will lead to changes and differences in the reservoir permeability. Therefore, the overall permeability of the reservoir is mainly in the low permeability range, while the permeability of the ultra-low porosity layer section corresponds to grades such as ultra-low permeability, extra-low permeability, and non-permeability, with an average value of 3 × 10⁻³ μm2.
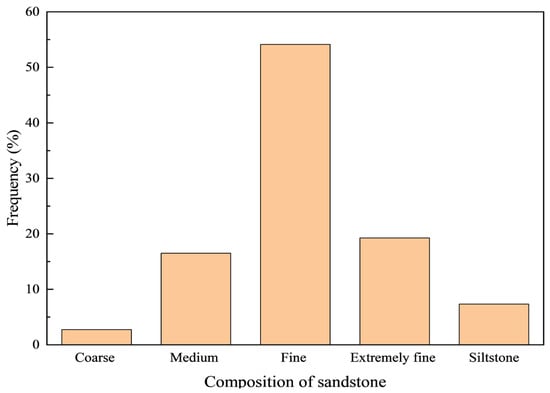
Figure 2.
Grain size classification of WZ12 oilfield.
2.3. Temperature and Pressure Characteristics
About 100 pressure tests were conducted in the field, and the depth distribution of the logging points ranged from 1925.1 to 2658.2 m. The data results clearly showed that initial formation pressure coefficients of 0.9762 to 1.0668 in the field fell within the normal pressure system.
All three of the high-pressure wells that were examined were more than 2000 m deep. As seen in Figure 3, the maximum temperature was 114 °C in the formation, while the lowest was 85.6 °C. Fluids in different regions of the same layer have slightly varying PVT characteristics; the dissolved gas-oil ratio ranges from 56 m3/m3 to 218 m3/m3, and the saturation pressure ranges from 8.7 to 21.4 MPa.
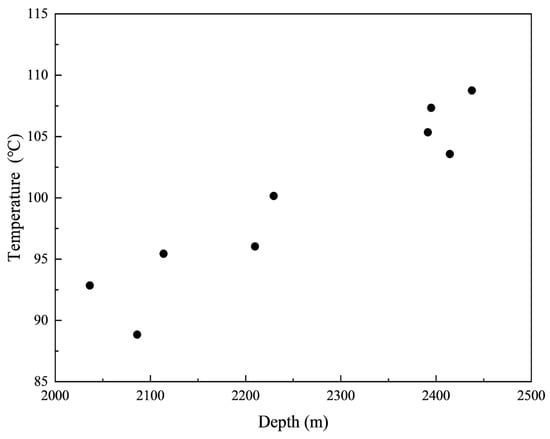
Figure 3.
The relation curve between reservoir temperature and depth.
3. Materials and Methods
3.1. Experimental Materials
To optimize the adoption of surfactant agents that are appropriate for energy storage fracturing in target reservoirs, water flooding core experiments were conducted using five surfactants. The surfactants were initially chosen to test the mobility properties of various fracturing fluid systems, such as interfacial tension and contact angle.
- (1)
- The following are examples of surfactants: sodium dodecyl diphenyl ether sulfonate (also known as “DB-45”), lauramidopropyl betaine (known as “LHSB”), tween 80 (known as “T-80”), dodecyl dimethyl betaine (known as “BS-12”), and ammonium lauryl polyether sulfate (known as “ALES”). The effective contents of the five surfactants are close, approximately ranging from 40% to 50%, and the concentrations of their solutions are 0.5%.
- (2)
- The experimental water was simulated formation water configured according to the salinity of the WZ12 oilfield. The salinity composition is shown in Table 1. The experimental oil was formulated from crude oil and kerosene. At a temperature of 60 °C, the viscosity of the degassed crude oil was 3.33 mPa ·s.
 Table 1. Ionic composition of experimental formation water.
 - (3)
- Core: The columnar cores used in the experiment have an average cross-section diameter of 2.50 cm and an average length of 9.71 cm. Their dry weights are about 89.05 g. The average porosity of the core is 14.82%, which is comparable to the reservoir’s physical characteristics.
3.2. Multiphase Interfacial Experiment
3.2.1. Measurement Procedures for Interfacial Tension
The TX-500C spinning droplet interfacial tension mete, which is sourced from USA KINO Industry Co. Ltd, Boston, MA, USA, is the experimental apparatus to be used, and device connection is illustrated in Figure 4a.
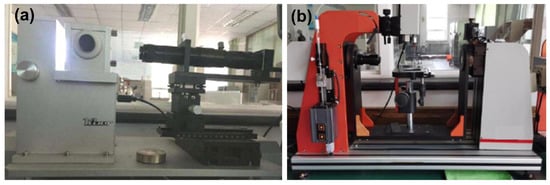
Figure 4.
Experimental devices. (a) TX-500C Spinning droplet interfacial tension meter. (b) optical contact angle measuring instrument.
- (1)
- Activate the computer, the instrument, and the test program.
- (2)
- The sample tube should be cleaned with distilled water before a specific surfactant to be evaluated is injected using a syringe from underneath. Then, the oil phase is gradually pushed into the tube with another syringe, taking care to avoid air bubbles in the process.
- (3)
- After inserting the sample tube into the test chamber, firmly press and fix the protective cover in place.
- (4)
- Set the temperature and rotational speed to a tiny initial value, and the machine began to rotate according to the instructions, once the temperature of the internal and external phases in the sample tube is constant.
- (5)
- Enter the necessary speed into the computer, press the start button, and rotate the button until the oil droplets are visible in the center of the image. When the rotational speed reaches the set value, we begin to observe and document the development of cylindrical oil phase droplets in the surfactant solution, and use the software to determine the interfacial tension value between the oil and water.
- (6)
- Repeat steps (2) to (5) after removing the sample tube for cleaning, until all of the surfactants that need to be tested have been measured.
3.2.2. Measurement Procedures for Contact Angle
An optical contact angle measuring device served as the experimental apparatus, and Figure 4b illustrates how the device was linked.
- (1)
- The core column was cut, cleaned repeatedly with distilled water, and finally placed in a drying box with a constant temperature.
- (2)
- A few droplets of designed simulated formation water were applied to the core pieces to obtain the contact angle before immersion, followed by a rinse with distilled water and another drying.
- (3)
- Immerse the core pieces in various surfactant solutions for two hours, and take them out for aging in a drying box with a constant temperature. After that, measure the core surface’s contact angle.
- (4)
- Determine the ability of surfactants to change the wettability of rocks based on the difference in contact angle changes.
3.3. Oil Displacement Experiment
The unsteady-state method was used to test the surfactant fracturing fluid system’s relative permeability curve, oil output, and oil displacement efficiency: maintain a constant flow rate of water injection and use Darcy’s formula to determine the absolute permeability of the core.
- (1)
- Dry the core and then vacuum it to saturate with water, record the dry and wet weights before and after the operation. The saturated volume and porosity of the core were determined by utilizing the difference between the two, as well as the density of the water phase (Table 2).
Table 2. Physical parameters of experimental cores.
- (2)
- The permeability of water was measured at a constant flow rate of 0.1 mL/min while the experimental temperature was maintained at 60 °C.
- (3)
- Oil flooding was carried out in a constant temperature box at 60 °C to establish bound water and saturated simulated oil. Oil saturation was calculated after recording the water output, and the core was placed for aging for 24 h.
- (4)
- The water flooding experiment was then initiated at an inlet rate of 0.1 mL/min after the surfactant fracturing fluid system prepared with formation water was put in an intermediate container.
- (5)
- Production of water and oil was recorded every ten minutes, and the water flooding process was continued until the outlet end of the core reached a high water cut of 98%.
3.4. Numerical Simulation of Integrated Energy Storage Fracturing
After the optimal performance surfactant is injected into the formation, it needs to go through the stage of soaking and drainage [34,35]. There are many influencing factors to improve the production of energy storage fracturing. To overcome the shortcomings of high cost and difficulty of repetition with the experimental method, this paper established an integrated numerical model of “injection–soaking–flowback” with the matrix and fracture porous media. Simulation work on the optimization of the different injection–production parameters was carried out, such as injection volume, well shut-in time, and fluid production rate.
3.4.1. Governing Equations
The oil/water and surfactant flow within a dual-media model is the main theory of this paper, i.e., the sum of two-phase saturation is 1. We assume that the fluid in the pore medium is weakly compressible, and the flow process follows Darcy’s law. The porous medium in the model is water-wetted, and the capillarity is the pressure difference between the non-wetted phase (oil) and the wetted phase (water). Oil and water are not mutually soluble, and the pore pressure can be regarded as the average pressure of the two. Then, the model satisfies the following continuity equation:
where M = m,f represent the matrix and the fracture, respectively; μo, μw are the viscosities of oil and water, mPa·s; Bo, Bw are the volume coefficients of oil and water, dimensionless; K is the permeability of reservoir, m2; Kro, Krw are the relative permeabilities of oil and water, dimensionless; Po, Pw are the pressures of oil and water, Pa; ρo, ρw are the densities of oil and water, kg/m3; g is the acceleration of gravity, m/s2; H is the thickness of oil layer, m; is the porosity, %; So, Sw are the saturations of oil and water, %.
The fluid flow of different media in the matrix and fractures is expressed by the cross-flow rate.
where Qmf represents the cross-flow rate; σ is the shape factor of porous media. In this study, σ = 0.1 m−2.
The surfactant is assumed to be modeled by the Langmuir isotherm adsorption. The injection of surfactant will lead to the consideration of a transport equation for the chemical species. In this work, the surfactant is transported in the water phase. Therefore, the following equation is employed [36]:
where ρR is the rock density, cs is the surfactant concentration, ci is the salinity, and a (cs, ci) is the adsorbed concentration of surfactant on the rock.
3.4.2. Model Settings
Based on the geological conditions of the WZ12 oilfield, a numerical model of multi-segment fracturing horizontal wells has been established, with a size of 1250 m × 1250 m × 250 m. The research subject of this paper is a single-well model, and the well control range is limited. Therefore, it may not be able to cover the entire fault, focusing more on hydraulic fractures during energy storage fracturing measures.
The porosity of the model is about 15%, and the permeability is 3 × 10⁻³ μm2. The values of other parameters are adopted from the actual reservoirs (Table 3), and the basic model of the segmented fracturing horizontal wells with a length of 800 m is shown in Figure 5.
Table 3.
Basic Parameters of Model.
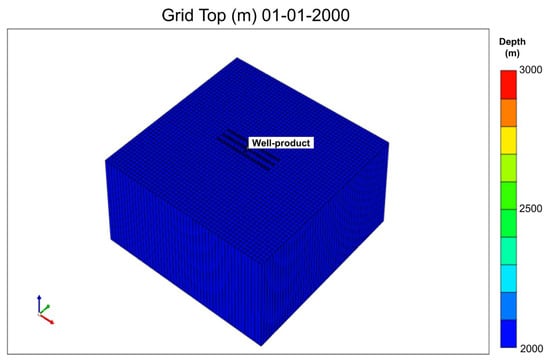
Figure 5.
Numerical model of horizontal wells for integrated energy storage fracturing.
The numerical simulation of surfactant flooding was completed in the STARS module of CMG software (Version 2022.1). Due to the hydraulic factures, a dual-media model with double porosity and double permeability was selected, i.e., the porosity at the fracture is set to be 1, and the relative permeability curve is adopted from Figure 6. It is completely different from the parameters of the matrix zone, which are based on the results of the oil displacement experiment with cores. The fracture network then undergoes local grid refinement for equivalent treatment. We divide the refinement grid into 5 parts in the two directions (i and j) of the Cartesian coordinate system.
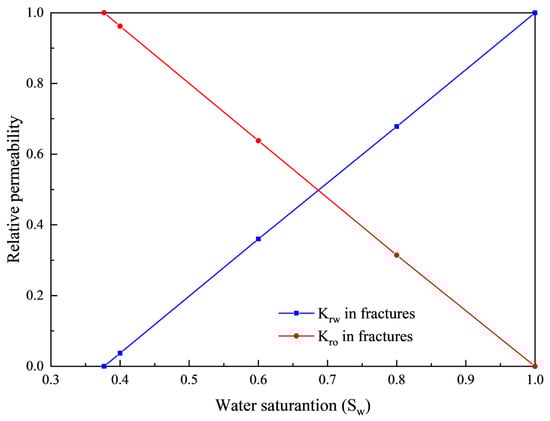
Figure 6.
The relative permeability curves of the fractured medium in the dual-porosity and dual-permeability model.
3.4.3. Parameter Optimization Design
The injected fluid has two functions in energy storage fracturing: it creates cracks and replenishes formation energy. As a result, the intended fracturing effect can be used to determine the injection–production parameters. For instance, based on the reservoir stimulation volume (SRV), set the injection rate to 600 m3/d in the basic case of parameter optimization. Influencing factors like bottom hole pressure and pressure propagation speed can also be used to determine how other parameters, like well soaking time and oil production rate, affect the production effect. A total of 15 simulation programs were designed in this paper (Table 4) to simulate the production characteristics of the target block.
Table 4.
Simulation programs for different injection–production parameters.
4. Results and Discussions
4.1. Multiphase Interfacial Experiment Results
4.1.1. Measurement for Interfacial Tension
At the interface between the water and oil phases, surfactant molecules form directional adsorption. Taking ALES surfactant (main component is C18H41NO7S) as an example, it lowers the interfacial tension by attracting the hydrophilic group (-O-(CH2-CH2-O)3-SO3NH4) to the water medium and dissolving the lipophilic group (C12H25-)with the crude oil in the pore space. Reduced interfacial tension between water and oil can facilitate the fluid’s passage through the microscopic rock pores and enhance the amount of oil recovered by dispersing large oil droplets into smaller ones and lowering the resistance to fluid flow in the pore space.
The experimental findings of the interfacial tension measured by various surfactants are displayed in Table 5. The average interfacial tension between the crude oil and the five surfactants was 2.6 × 10⁻² mN/m. The highest interfacial tension value among them was 4.2 × 10⁻² mN/m for lauramidopropyl betaine (LHSB) (Figure 7b), while Ammonium lauryl polyether sulfate (ALES) had the lowest interfacial tension, measuring 1.7 × 10⁻² mN/m (Figure 7e).
Table 5.
Surfactant interfacial tension and contact angle test results.
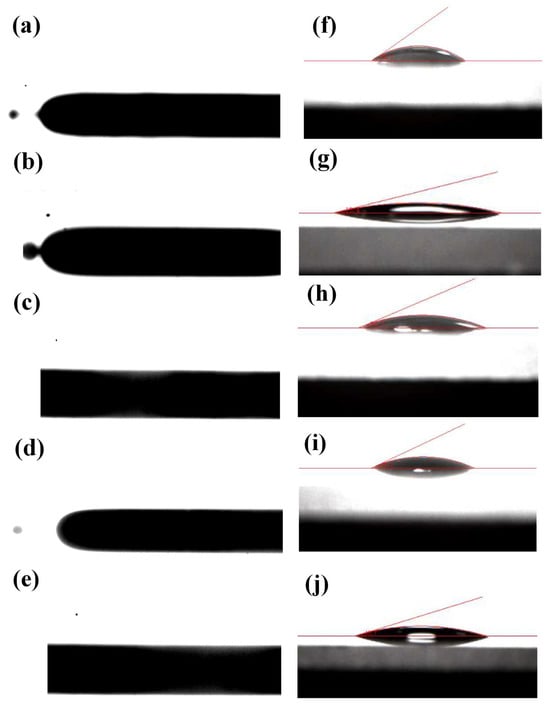
Figure 7.
Results of multiphase interfacial experiments with different surfactants: (a–e) interfacial tension measuring results for DB-45, LHSB, T-80, BS-12, and ALES; (f–j) contact angle measuring results for DB-45, LHSB, T-80, BS-12, and ALES.
4.1.2. Measurement for Contact Angle
The contact angle between the fluid system and the core can also be impacted by the surfactant types. The surfactant solution can strengthen the core’s hydrophilicity, shift the rock into a trend that facilitates water and oil flow, and improve wettability, which allows the capillary pressure to be converted to the driving force and effectively encourages flow action.
According to the observed data, all five surfactants exhibit high hydrophilic properties and good wettability, with contact angles less than 90°. Among them, laurylamidopropyl betaine (LHSB) had a contact angle of 15.43° with the core in the experiment, and sodium dodecyl diphenyl ether sulfonate (DB-45) had a contact angle of 35.13°.
4.2. Oil Displacement Experiment Results
4.2.1. Relative Permeability Curves
The oil–water relative permeability curve is the basis of a two-phase flow study, which is also the crucial information for determining oilfield development parameters, performing production dynamic analysis, and conducting numerical simulations [37]. It is also an important factor for designing a reservoir development program and assessing the recovery effect [38].
The five surfactants’ relative permeability curves show a generally similar trend, which is consistent with the general rule that the relative permeability of the water phase gradually rises while the relative permeability of the oil phase falls as water saturation increases. All the isotonic points on the curve, as seen in Figure 8a, correlate to water saturation levels of more than 50%, suggesting that the rock is water-wetted. This is also in line with the findings of the interface tests mentioned above. However, each of the five surfactants had a different oil displacement effect. The residual oil saturation in the core was lower when dodecyl dimethyl betaine (BS-12) and tween-80 (T-80) were injected. The two-phase flow zone area was the smallest when lauramidopropyl betaine (LHSB) was injected, and the water saturation range in the two-phase flow zone was between 0.46 and 0.69 (Figure 8b).
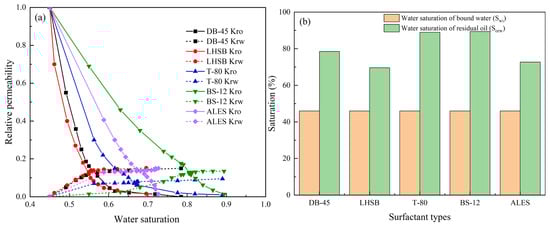
Figure 8.
Experimental results of oil displacement from cores with different surfactants: (a) relative permeability curves; (b) bound water and residual oil saturation statistics.
4.2.2. Water Cut and Recovery Curves
Throughout the unsteady-state method’s experimental procedure, the distribution of oil (water) saturation within the model varies with time and distance [39]. Plotting the water cut and recovery curves of several surfactants led to the following findings: The surfactants’ water cut curves all show a somewhat similar upward tendency, having a convex shape, meaning that it rises quickly in the early stages and slowly in the later stages, with a platform period between them (Figure 9a). Sodium dodecyl diphenyl ether sulfonate (DB-45) has the earliest water breakthrough time, beginning to produce water in roughly 2.5 h. In contrast, ammonium lauryl polyether sulfate (ALES) starts to produce water after about 4.2 h, which means that this surfactant has the longest stage of pure oil production.
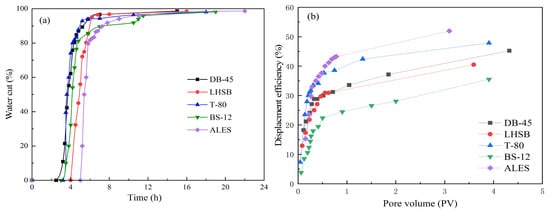
Figure 9.
Experimental results of oil repulsion from cores with different surfactants: (a) Water cut curve; (b) displacement efficiency curve.
The displacement efficiency is the ratio of the amount of oil recovered during injection to the amount of oil saturated in the core. The water cut at the outlet end of the five experimental cores reached 98% after injecting a 3~4 PV fracturing fluid system with surfactants, and the oil displacement efficiency was roughly 40%~50%. The oil displacement efficiency of the cores rose quickly in the early stages, and the rate of increase slowed down in the later stages as the injection volume increased. With an oil displacement efficiency of 52%, ammonium lauryl polyether sulfate (ALES) is the best among them, while dodecyl dimethyl betaine (BS-12) only has an efficiency of 33%.
The comprehensive analysis of multiphase interfacial experiments and oil displacement experiments in the cores shows that, of the five surfactants, the ammonium lauryl polyether sulfate (ALES) has the second lowest interfacial tension. The contact angle of it is much less than 30°, and the saturation range of two-phase flow zone is moderate. The ammonium laureth sulfate (ALES) has the longest period of pure oil production, and the highest oil displacement efficiency. Therefore, it is the optimized surfactant for integrated energy storage fracturing during injection, soaking, and production in the targeted WZ12 oilfield.
The optimized surfactant for integrated energy storage fracturing in the target block is ammonium lauryl polyether sulfate (ALES), but we still need to investigate the system’s effects at different concentrations. Here, five mass fraction gradients of 0.1%, 0.3%, 0.5%, 0.7%, and 0.9% were set for the ALES surfactant in the experiment. The test results showed that the interfacial tension of 0.5% ALES was the lowest (1.7 × 10⁻² mN/m), which was 26.1% lower than that of 0.1% ALES (2.3 × 10⁻² mN/m). The contact angle of 0.5% ALES is 20.07°, although it is higher than that of 0.9% concentration (15.63°), it has already made the core strongly hydrophilic. Moreover, an excessively high concentration will increase the adsorption capacity and cost of surfactants. The oil displacement efficiency of 0.5% ALES reached 52%, which was 10.6% and 14.8% higher than that of 0.3% ALES (47%) and 0.7% ALES (45.3%), respectively. Taking into account the interfacial tension, wettability, and economy comprehensively, 0.5% is determined as the optimal concentration.
4.3. Simulation Results of Integrated Energy Storage Fracturing
4.3.1. Pressure Characteristic
The energy storage fracturing with added surfactant is different from the conventional fracturing measure, and it is more complicated, since the injection and production process has many links. The basic parameters designed for the conceptual model are as follows: daily injection volume is 600 m3, and after 25 days of soaking, the flowback and production rate is controlled at 270 m3/d. Figure 10 shows the formation pressure map at different stages of injection–soaking–flowback.
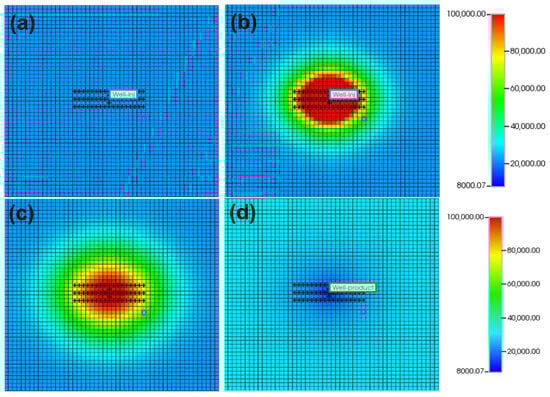
Figure 10.
Formation pressure variation at different production stages of energy storage fracturing: (a) surfactant injection begins at the initial moment; (b) injection is completed; (c) well is shut in for a period of time; (d) wells are opened for drainage and flowback.
During the injection stage, the pressure increases and the wave gradually spreads around as the surfactant fracturing fluid enters the formation [40]. Considering the controlled space range of the horizontal well, the pressure wave is roughly distributed in an oval shape. After about 25 days of soaking, the pressure in the core formation near the horizontal well decreased slightly compared with that during injection. The pressure in the formation at the distal end of the horizontal well gradually increased but did not yet propagate completely to the reservoir boundary. It suggests that imbibition may have occurred here, which plays a role of energy replenishment and further displacement of the fracturing fluid in the absence of external fluid supplementation during the soaking stage. Until the well is opened again and fluid is produced in the flowback stage, the pressure of the horizontal well gradually drops below the surrounding grid pressure.
4.3.2. Parameter Optimization Results
- (1)
- Injection rate
Under the same injection time, the size of daily injection volume affects the scale of fracturing energy replenishment and the length of produced fractures [41,42]. Fluctuating above and below the base case of 600 m3/d, energy storage fracturing programs with daily injection volumes of 550, 650, 700, 750, and 800 m3/d were designed, and the simulation results are shown in Figure 11.
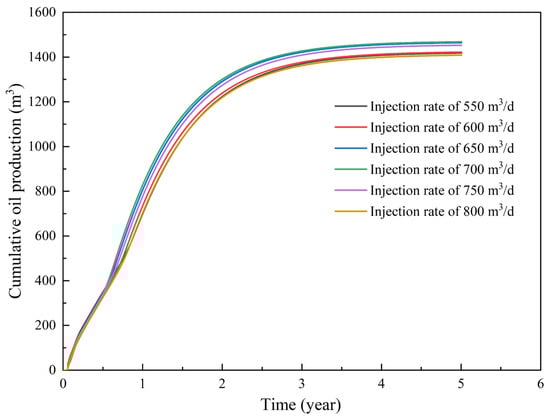
Figure 11.
Simulation results of different injection rate programs for energy storage fracturing.
The cumulative oil production after five years increased from 1417 m3 to 1468 m3 when the injection rate increased from 550 m3/d to 700 m3/d. If the injection rate further increases to more than 700 m3/d, the volume of water in the output liquid will increase, and the cumulative oil production will decrease. It is recommended that the injection volume be controlled at 650–700 m3/d, which is more appropriate.
- (2)
- Soaking time
During the fracturing operation, the time of well shut-in will affect the imbibition function of fracturing fluid [43,44,45]. Therefore, under the condition of soaking time for 25 days, referring to the basic case and keeping other parameters unchanged, simulation programs with soaking times of 5, 10, 15, 20, and 30 days were designed. The simulation results are shown in Figure 12.
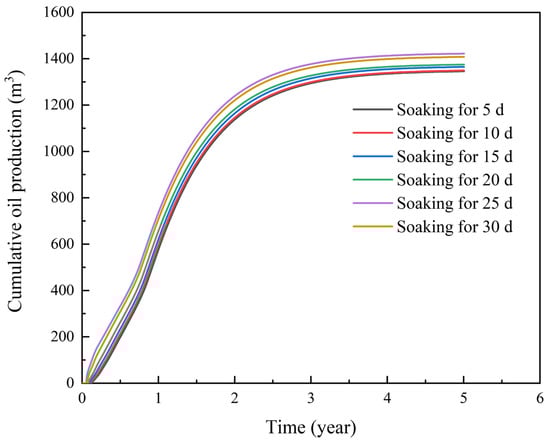
Figure 12.
Simulation results of different soaking time programs for energy storage fracturing.
Surfactants play a dual role during well shut-in: On the one hand, they can reduce the flow resistance of the medium and enhance the ability of water to flow into the matrix and displace crude oil. On the other hand, after adding the active agent, the interfacial tension between oil and water decreases, and the capillary pressure that causes the imbibition effect also decreases accordingly. With the increase in soaking time, the cumulative oil production of different programs shows an increasing trend, and the maximum can reach 1422 m3. When the soaking time exceeds 25 days, the cumulative oil production slightly decreases. Moreover, the production cycle becomes longer if the soaking time is too long. Comprehensively, the preferred value is about 25 days.
- (3)
- Flowback rate
During the well opening and production period, the magnitude of the production rate determines the flowback efficiency of the fracturing fluid [46,47]. Therefore, in addition to the basic case with a flowback rate of 270 m3/d, simulation programs with flowback rates of 210, 240, 300, and 330 m3/d were designed. The simulation results are shown in Figure 13.
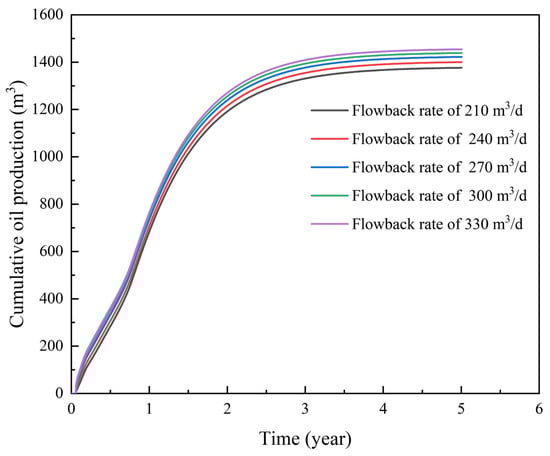
Figure 13.
Simulation results of different flowback rates for energy storage fracturing.
It can be seen from the simulation results that the cumulative oil production increases with the increase in the flowback and production rate. When the flowback rate exceeds 300 m3/d, the rate of this increasing trend gradually slows down, and the excessively high liquid production rate will lead to high water cut and a large cumulative water production volume. Therefore, the optimal flowback rate for energy storage fracturing is 270~300 m3/d.
5. Conclusions
This study presents an integrated methodology, combining experimental analysis and numerical simulation, to optimize the design of energy storage fracturing with surfactants for the offshore complex fault-block and tight sandstone WZ12 oilfield.
Comprehensive interfacial performance tests on five surfactant candidates identified ammonium lauryl polyether sulfate (ALES) as the most effective agent. The ALES system achieved an ultra-low interfacial tension of 1.7 × 10⁻² mN/m and effectively altered the rock wettability to a strongly water-wetted state, evidenced by a contact angle of less than 30°. Subsequent core flooding experiments under reservoir conditions confirmed its superior performance, where it delivered the highest oil displacement efficiency of 52% and an extended pure oil production period of 4.2 h, despite a relatively narrow two-phase flow zone. This demonstrates its high efficiency in mobilizing and producing crude oil.
Furthermore, a physics-driven numerical simulation of the integrated fracturing “injection–soaking–flowback” process was conducted. The model elucidated the dynamics of pressure propagation during injection, the imbibition and fluid exchange during shut-in, and the pressure depletion during flowback. Based on parametric optimization, the recommended operation strategy is to employ a daily injection volume of 650 m3/d, followed by a shut-in period of 25 days to allow for sufficient imbibition, and a controlled flowback rate of 270 m3/d to maintain reservoir energy and maximize oil recovery.
The ALES-based surfactant fracturing fluid, combined with the optimized operational parameters, provides a technically reasonable solution in the challenging offshore low-permeability reservoirs similar to the WZ12 oilfield for enhancing oil recovery.
There are still some limitations in this study. The model did not take into account the distribution of secondary faults and fractures, nor did it consider the long-term adsorption attenuation characteristics of surfactants. In the future, the direction of our efforts is to introduce the discrete fault and fracture network and establish the concentration attenuation model, so that the research method can take into account as many factors as possible.
Author Contributions
Conceptualization, Y.Z. (Yujie Zhang 1) and Z.P.; methodology, Y.Z. (Yujie Zhang 1) and G.H.; software, Y.Z. (Yujie Zhang 2) and R.Z.; validation, Z.P. and G.H.; formal analysis, F.N. and Y.L. (Ye Li); investigation, C.G., F.G. and P.B.; data curation, X.Y., Y.L. (Yunli Lu) and D.W.; writing—original draft preparation, Y.Z. (Yujie Zhang 1); writing—review and editing, Z.P. and G.H.; supervision, G.H.; funding acquisition, G.H. All authors have read and agreed to the published version of the manuscript.
Funding
This research was funded by the Open Fund (PLN202402) of the State Key Laboratory of Oil and Gas Reservoir Geology and Exploration (Southwest Petroleum University) and the Science Foundation of China University of Petroleum, Beijing (No. 2462023BJRC001).
Data Availability Statement
The data presented in this study are available on request from the corresponding author.
Acknowledgments
We thank the anonymous reviewers and the editor for their instructive comments that considerably improved the manuscript’s quality.
Conflicts of Interest
Author Fei Gu is employed by CNPC Research Institute of Petroleum Exploration and Development. The remaining authors declare that the research was conducted in the absence of any commercial or financial relationships that could be construed as a potential conflict of interest.
Abbreviations
| Character | Meaning and Units |
| μo, μw | the viscosities of oil and water, mPa·s |
| Bo, Bw | the volume coefficients of oil and water, dimensionless |
| K | the permeability of reservoir, m2; |
| Kro, Krw | the relative permeabilities of oil and water, dimensionless |
| Po, Pw | the pressures of oil and water, Pa |
| ρo, ρw | the densities of oil and water, kg/m3 |
| g | the acceleration of gravity, m/s2 |
| H | the acceleration of gravity, m/s2 |
| the thickness of oil layer, m | |
| So, Sw | the saturations of oil and water, %; |
| Qmf | represents the cross-flow rate |
| σ | the surfactant concentration |
| ρR | the rock density |
| cs | the salinity |
| a(cs, ci) | the adsorbed concentration of surfactant on the rock |
References
- Li, Y.; Pan, L.; Zhang, K.; Hu, L.; Wang, J.; Guo, C. Numerical Modeling Study of a Man-Made Low-Permeability Barrier for the Compressed Air Energy Storage in High-Permeability Aquifers. Appl. Energy 2017, 208, 820–833. [Google Scholar] [CrossRef]
- Hui, G.; Chen, S.; He, Y.; Wang, H.; Gu, F. Machine Learning-Based Production Forecast for Shale Gas in Unconventional Reservoirs via Integration of Geological and Operational Factors. J. Nat. Gas Sci. Eng. 2021, 94, 104045. [Google Scholar] [CrossRef]
- Liao, Q.; Wang, B.; Chen, X.; Tan, P. Reservoir Stimulation for Unconventional Oil and Gas Resources: Recent Advances and Future Perspectives. Adv. Geo-Energy Res. 2024, 13, 7–9. [Google Scholar] [CrossRef]
- Zhao, H.; Zhang, M.; Sheng, G.; Liu, X.; Liu, B.; Sun, J.; Deng, H.; Liu, Y. A New Approach for Fracture Parameters Optimization of Multi-Fractured Horizontal Wells: Virtual Boundary Method. Geoenergy Sci. Eng. 2024, 243, 213184. [Google Scholar] [CrossRef]
- Pi, Z.; Hui, G.; Wang, Y.; Chen, Z.; Li, J.; Qin, G.; Meng, F.; Song, Y.; Yao, F.; Bao, P.; et al. Coupled 4D Flow-Geomechanics Simulation to Characterize Dynamic Fracture Propagation in Tight Sandstone Reservoirs. ACS Omega 2025, 10, 1735–1747. [Google Scholar] [CrossRef]
- Lei, Z.; Meng, S.; Peng, Y.; Tao, J.; Liu, Y.; Liu, H. Evaluation of the adaptability of CO2 pre-fracturing to Gulong shale oil reservoirs, Songliao Basin, NE China. Pet. Explor. Dev. 2025, 52, 459–470. [Google Scholar] [CrossRef]
- Li, N.; Yu, J.; Wang, C.; Zhang, S.; Liu, X.; Jia, K.; Yuan, W.; Dai, Y. Fracturing Technology with Carbon Dioxide: A Review. J. Pet. Sci. Eng. 2021, 205, 108793. [Google Scholar] [CrossRef]
- Zhang, D.; Ma, S.; Zhang, J.; Zhu, Y.; Wang, B.; Zhu, J.; Fan, X.; Yang, H.; Liang, T. Field Experiments of Different Fracturing Designs in Tight Conglomerate Oil Reservoirs. Sci. Rep. 2022, 12, 3220. [Google Scholar] [CrossRef]
- Li, Q.; Li, Q.; Wang, F.; Wu, J.; Wang, Y.; Jin, J. Effects of Geological and Fluid Characteristics on the Injection Filtration of Hydraulic Fracturing Fluid in the Wellbores of Shale Reservoirs: Numerical Analysis and Mechanism Determination. Processes 2025, 13, 1747. [Google Scholar] [CrossRef]
- Rajbongshi, A.; Gogoi, S.B. A Review on Oilfield Produced Water and Its Treatment Technologies. Pet. Res. 2024, 9, 640–656. [Google Scholar] [CrossRef]
- Soleiman Asl, T.; Habibi, A.; Yassin, M.R.; Ezulike, O.D.; Dehghanpour, H. An Experimental and Field Case Study to Evaluate the Effects of Shut-in on Well Performance. J. Pet. Sci. Eng. 2022, 208, 109318. [Google Scholar] [CrossRef]
- Wang, J.; Zhang, Z.; Chen, X.; Jin, X.; You, X. Research on the Impact of Overflow Well Shut-in on Wellbore Integrity and Safety. Geoenergy Sci. Eng. 2024, 243, 213304. [Google Scholar] [CrossRef]
- Hui, G.; Chen, S.; Gu, F. Strike–Slip Fault Reactivation Triggered by Hydraulic-Natural Fracture Propagation during Fracturing Stimulations near Clark Lake, Alberta. Energy Fuels 2024, 38, 18547–18555. [Google Scholar] [CrossRef]
- Wu, Q.; Xu, Y.; Wang, X.; Wang, T.; Zhang, S. Volume Fracturing Technology of Unconventional Reservoirs: Connotation, Design Optimization and Implementation. Pet. Explor. Dev. 2012, 39, 377–384. [Google Scholar] [CrossRef]
- Wang, B.; Cao, R.; Pi, Z.; Cheng, L.; Jia, Z.; Hu, J. Displacement-Imbibition Coupling Mechanisms between Matrix and Complex Fracture during Injecting-Shut in-Production Process Using Pore-Scale Simulation and NMR Experiment. Geoenergy Sci. Eng. 2024, 242, 213254. [Google Scholar] [CrossRef]
- Li, N.; Zhu, S.; Li, Y.; Zhao, J.; Long, B.; Chen, F.; Wang, E.; Feng, W.; Hu, Y.; Wang, S.; et al. Fracturing-Flooding Technology for Low Permeability Reservoirs: A Review. Petroleum 2024, 10, 202–215. [Google Scholar] [CrossRef]
- Qu, G.; Su, J.; Zhao, M.; Bai, X.; Yao, C.; Peng, J. Optimizing Composition of Fracturing Fluids for Energy Storage Hydraulic Fracturing Operations in Tight Oil Reservoirs. Energies 2022, 15, 4292. [Google Scholar] [CrossRef]
- Shen, Z.; Jia, C.; Xia, Y.; Xu, S.; Xia, X.; Cai, J. Interaction between Fracturing Fluids and Shale from the Ziliujing Formation of the Jurassic in the Sichuan Basin and the Mechanism of Imbibition-Driven Oil Displacement. Energy Fuels 2025, 39, 7285–7304. [Google Scholar] [CrossRef]
- Lv, J.; Hou, B. Fractures Interaction and Propagation Mechanism of Multi-Cluster Fracturing on Laminated Shale Oil Reservoir. Pet. Sci. 2024, 21, 2600–2613. [Google Scholar] [CrossRef]
- Li, S.; Ding, Y.; Cai, B.; Lu, Y.; He, C. Wettability Reversal Experiment and Simulation in Tight Reservoir with Volume Stimulation. Spec. Oil Gas Reserv. 2016, 23, 107–110+146–147. [Google Scholar]
- Tu, J.; Sheng, J.J. Experimental and Numerical Study of Surfactant Solution Spontaneous Imbibition in Shale Oil Reservoirs. J. Taiwan Inst. Chem. Eng. 2020, 106, 169–182. [Google Scholar] [CrossRef]
- Zhang, J.; Liang, C.; Chen, Y.; Xu, T.; Xu, Z. Influence Factors of Surfactant on High-temperature and High-pressure Imbibition Displacement Effect of Shale Oil Reservoir. Geol. Dev. Daqing 2023, 42, 167–174. [Google Scholar] [CrossRef]
- Li, G.; Gao, H.; Qi, Y.; Zhang, C.; Cheng, Z.; Li, T.; Wang, C.; Li, H. Study on imbibition displacement mechanism of clear fracturing fluid in tight oil reservoir based on 2D NMR. Pet. Sci. Bull. 2025, 10, 283–297. [Google Scholar]
- Zolfaghari Sharak, A.; Noel, M.; Dehghanpour, H.; Bearinger, D. Understanding the Origin of Flowback Salts: A Laboratory and Field Study. In Proceedings of the SPE/CSUR Unconventional Resources Conference, Calgary, AB, Canada, 30 September–2 October 2014; p. D011S002R005. [Google Scholar]
- You, L.; Xie, B.; Kang, Y.; Yang, B. The Synergistic Effect of hydration fracture and imbibition in Shale Gas Well Shut-in Process. In Proceedings of the 2018 National Natural Gas Academic Conference (03 Unconventional Gas Reservoirs), Fuzhou, China, 14–16 November 2018; pp. 13–19. [Google Scholar] [CrossRef]
- Wang, R. Numerical Simulation Study on the Law of Energy Storage in Shut-In Schedule after Fracturing of Tight Oil. Bachelor’s Thesis, China University of Petroleum, Beijing, China, 2019. [Google Scholar] [CrossRef]
- Wang, F.; Chen, Q.; Ruan, Y. Hydrodynamic Equilibrium Simulation and Shut-In Time Optimization for Hydraulically Fractured Shale Gas Wells. Energies 2020, 13, 961. [Google Scholar] [CrossRef]
- Wei, S.; Jin, Y.; Xia, Y.; Xu, D.; Zeng, P. Influence of Spontaneous Imbibition on Post-fracturing Well Soaking in the Shale Oil Reservoirs. Oil Drill. Prod. Technol. 2023, 45, 756–765. [Google Scholar]
- Wang, X. Research and Application of Energy Storage Fracturing Technology in Well Block Bei 83 of Zhundong Oilfield. Technol. Superv. Pet. Ind. 2025, 9, 62–66. [Google Scholar] [CrossRef]
- Zhao, J.; Wang, Q.; Hu, Y.; Ren, L.; Zhao, C. Numerical Investigation of Shut-in Time on Stress Evolution and Tight Oil Production. J. Pet. Sci. Eng. 2019, 179, 716–733. [Google Scholar] [CrossRef]
- Golparvar, A.; Zhou, Y.; Wu, K.; Ma, J.; Yu, Z. A Comprehensive Review of Pore Scale Modeling Methodologies for Multiphase Flow in Porous Media. Adv. Geo-Energy Res. 2018, 2, 418–440. [Google Scholar] [CrossRef]
- Hui, G.; Chen, Z.; Wang, Y.; Zhang, D.; Gu, F. An Integrated Machine Learning-Based Approach to Identifying Controlling Factors of Unconventional Shale Productivity. Energy 2023, 266, 126512. [Google Scholar] [CrossRef]
- Chen, G. Origin and Distribution Prediction of Anomalously High Permeability Zones in Sandstone Reservoir—A Example in Weizhou 12-X Oilfield, Weixinan Sag, Beibu Gulf Basin. Ph.D. Thesis, Northeast Petroleum University, Daqing, China, 2022. [Google Scholar] [CrossRef]
- Bao, P.; Hui, G.; Hu, Y.; Song, R.; Chen, Z.; Zhang, K.; Pi, Z.; Li, Y.; Ge, C.; Yao, F.; et al. Comprehensive Characterization of Hydraulic Fracture Propagations and Prevention of Pre-Existing Fault Failure in Duvernay Shale Reservoirs. Eng. Fail. Anal. 2025, 173, 109461. [Google Scholar] [CrossRef]
- Wang, Q.; Zhao, J.; Hu, Y.; Ren, L.; Zhao, C. Shut-in Time Optimization after Fracturing in Shale Oil Reservoirs. Pet. Explor. Dev. 2022, 49, 671–683. [Google Scholar] [CrossRef]
- Preux, C.; Malinouskaya, I.; Nguyen, Q.-L.; Flauraud, E.; Ayache, S. Reservoir-Simulation Model with Surfactant Flooding Including Salinity and Thermal Effect, Using Laboratory Experiments. SPE J. 2020, 25, 1761–1770. [Google Scholar] [CrossRef]
- Hui, G.; Chen, Z.; Schultz, R.; Chen, S.; Song, Z.; Zhang, Z.; Song, Y.; Wang, H.; Wang, M.; Gu, F. Intricate Unconventional Fracture Networks Provide Fluid Diffusion Pathways to Reactivate Pre-Existing Faults in Unconventional Reservoirs. Energy 2023, 282, 128803. [Google Scholar] [CrossRef]
- Gan, L.; Dang, L.; Zhang, H.; Bai, S.; Duan, C.; Wang, C.; Deng, R. A Method for Calculating the Relative Permeability of Tight Sandstone Oil Reservoirs Based on Nuclear Magnetic Resonance Logging. SPE J. 2025, 30, 4252–4270. [Google Scholar] [CrossRef]
- Yu, Q.; Mu, Z.; Liu, P.; Hu, X.; Li, Y. A New Evaluation Method for Determining Reservoir Parameters for the Development of Edge-Water-Driven Oil Reservoirs. J. Pet. Sci. Eng. 2019, 175, 255–265. [Google Scholar] [CrossRef]
- Hu, J.; Zhao, H.; Du, X.; Zhang, Y. An Analytical Model for Shut-in Time Optimization after Hydraulic Fracturing in Shale Oil Reservoirs with Imbibition Experiments. J. Pet. Sci. Eng. 2022, 210, 110055. [Google Scholar] [CrossRef]
- Huang, T.; Su, L.; Da, Y.; Yang, L. Research and Field Test on Energy Storage Fracturing Mechanism of Horizontal Wells in Ultra-Low Permeability Reservoirs. Pet. Drill. Tech. 2020, 48, 80–84. [Google Scholar]
- Yang, C.; Liu, J. Petroleum Rock Mechanics: An Area Worthy of Focus in Geo-Energy Research. Adv. Geo-Energy Res. 2021, 5, 351–352. [Google Scholar] [CrossRef]
- Cheng, Y. Impact of Water Dynamics in Fractures on the Performance of Hydraulically Fractured Wells in Gas-Shale Reservoirs. J. Can. Pet. Technol. 2012, 51, 143–151. [Google Scholar] [CrossRef]
- Li, L.; Zhang, D.; Su, Y.; Zhang, X.; Lu, M.; Wang, H. Microfluidic Insights into CO2 Sequestration and Enhanced Oil Recovery in Laminated Shale Reservoirs: Post-Fracturing Interface Dynamics and Micro-Scale Mechanisms. Adv. Geo-Energy Res. 2024, 13, 203–217. [Google Scholar] [CrossRef]
- Eltahan, E.; Rego, F.B.; Yu, W.; Sepehrnoori, K. Impact of Well Shut-in after Hydraulic-Fracture Treatments on Productivity and Recovery of Tight Oil Reservoirs. J. Pet. Sci. Eng. 2021, 203, 108592. [Google Scholar] [CrossRef]
- Mu, Y.; Zou, C.; Hu, Z.; Duan, X.; Guo, Q.; Jing, Z. Impacts of Multi-Scale Water-Rock Interaction on Mineral Alteration, Mechanical Weakening and Pore-Fracture Evolution in Marine Shales. Adv. Geo-Energy Res. 2025, 17, 68–81. [Google Scholar] [CrossRef]
- Zolfaghari, A.; Dehghanpour, H.; Noel, M.; Bearinger, D. Laboratory and Field Analysis of Flowback Water from Gas Shales. J. Unconv. Oil Gas Resour. 2016, 14, 113–127. [Google Scholar] [CrossRef]
Disclaimer/Publisher’s Note: The statements, opinions and data contained in all publications are solely those of the individual author(s) and contributor(s) and not of MDPI and/or the editor(s). MDPI and/or the editor(s) disclaim responsibility for any injury to people or property resulting from any ideas, methods, instructions or products referred to in the content. |
© 2025 by the authors. Licensee MDPI, Basel, Switzerland. This article is an open access article distributed under the terms and conditions of the Creative Commons Attribution (CC BY) license (https://creativecommons.org/licenses/by/4.0/).