Abstract
MCSGP (Multicolumn Countercurrent Solvent Gradient Purification) with AutoPeak control is increasingly used for production of synthetic peptides and oligonucleotides at scale, requiring guidance on how to perform regulatory-compliant Process Validation. This work, for the first time, presents a Process Characterization and Process Performance Qualification approach to support regulatory filings of therapeutics produced using MCSGP, based on the relevant Process Validation guidelines. The approach was demonstrated for the purification of synthetic Bivalirudin. During Process Characterization, MCSGP process parameter criticality was investigated, and the gradient slope was classified as a critical process parameter to be controlled within tighter limits. As a further outcome of Process Characterization, a supervision strategy was developed and verified in four Process Performance Qualification MCSGP runs. The strategy was backed by AutoPeak, a UV-based Process Analytical Technology. The Process Validation/Process Performance Qualification (PPQ) runs not only confirmed the selected control and supervision strategy but also the advantages of MCSGP/AutoPeak as a continuous manufacturing technology, including the fully automatic operation and the reduction in in-process control sampling and Process Mass Intensity (PMI). In the presented case, the PMI was reduced from around 5200 to 1400 kg/kg, the number of in-process controls (IPCs) was reduced from 81 IPCs (60 cm i.D. column batch) per kg to 3.2 IPCs per kg (2 × 30 cm i.D. column MCSGP), while yield (gross-to-gross) increased from 57% to 62%, comparing MCSGP/AutoPeak to a process with extensive side-cut recycling.
1. Introduction: Multicolumn Countercurrent Solvent Gradient Purification (MCSGP) and AutoPeak
MCSGP is a continuous countercurrent preparative chromatography technology employing linear gradients [1,2]. In its twin-column embodiment, the technology is in operation at several companies and research institutes worldwide. Due to its core feature of internal recycling of impure side-fractions, MCSGP ensures achievement of high yield and purity simultaneously. Its high degree of automation, reduction in in-process-controls (IPCs) and reduction in Process Mass Intensity (PMI) make it an attractive and sustainable tool for peptide and oligonucleotide purification [3,4,5,6,7,8,9]. For robust operation of MCSGP, the spectroscopy-based control “AutoPeak” was proven to be critical [10]. AutoPeak monitors UV detector signals at the column outlets and initiates responses to shifts in the elution profiles of the MCSGP process. By employing absolute and relative UV triggers, process phases for the internal recycling and product collection can be started and stopped. Thereby AutoPeak safeguards the correct positioning of MCSGP internal recycling and product collection phases, ensuring consistent product pool collection. AutoPeak therefore can be considered Process Analytical Technology (PAT) in the sense of the FDA PAT guidance [11]. The MCSGP process principle and AutoPeak have both been described in the literature [2,10].
2. Introduction: Process Validation
The FDA Process Validation Guideline describes three elements of successful Process Validation [12] (Figure 1): firstly, Process Design to build scientific process understanding, of which Process Characterization is a central piece; secondly, Process Performance Qualification to confirm the equipment and process performs as intended and is capable of reproducible commercial manufacture; thirdly, Continued Process Verification (CPV) for ongoing monitoring in routine manufacturing. This study covers Process Characterization (PC) and Process Performance Qualification (PPQ). With regard to AutoPeak, in the context of Process Validation, FDA’s Process Validation and PAT guidance documents, as well as ICH Q8/Q11/Q13 [13,14,15], explicitly support PAT and real-time monitoring as part of a control strategy.
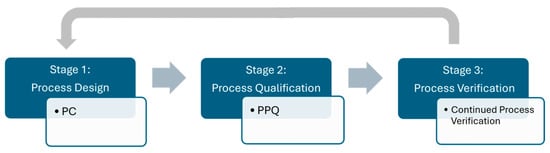
Figure 1.
Schematic of the elements of Process Validation according to FDA’s Process Validation Guideline.
3. Introduction: Process Characterization for Batch and MCSGP Chromatography
Process Characterization aims to develop a thorough understanding of the purification process and to identify potential critical process parameters (CPPs) which may influence critical quality attributes (CQAs) such as related substances or counter ion content [16]. Process Characterization starts with a process description, i.e., listing the process parameters for each of the sub-steps (equilibration, loading, washing, elution, and cleaning-in-place (CIP)). The process parameters are then subject to a risk assessment (for example FMEA [17]) and ranked for potential impact on CQAs. High-ranked parameters are then tested experimentally within pre-defined limits, typically using a Design of Experiments (DoE) or one-factor-at-a-time (OFAT) approach. Based on the outcome of the tests, the CPPs are identified and the Proven Acceptable Ranges (PARs), indicating the ranges within which CQAs are met, are defined. Operating ranges are narrowed if the analysis reveals that the parameter has to be controlled more tightly. This approach has been presented previously for CaptureSMB, a simpler twin-column continuous chromatography process, applicable for affinity capture of biologics [18]. In summary, during Process Characterization, the process control strategy is developed for manufacturing, defining which process parameters to monitor and their operating ranges. A scientifically justified understanding is developed of how process parameters affect CQAs.
For peptides, the most common approach for purification is reversed phase (RP) HPLC [19]. For the definition of relevant process parameters and ranges to be tested for this unit operation, a split between the chromatographic part, which is the same for traditional batch chromatography and MCSGP, and the product collection and recycling part may be performed, as conceptually illustrated in Figure 2:
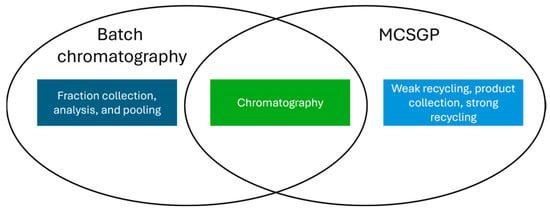
Figure 2.
Venn diagram of batch mode purification and MCSGP.
The only difference in the experimental approach for Process Characterization is then the number of elutions needed to generate meaningful data. While for batch purification, one elution per tested parameter is considered sufficient, MCSGP experiments will need at least three cycles with two elutions each. This number of cycles/elutions is required to confirm that the process has reached the cyclic steady state, that no enrichment of impurities via weak or strong recycling is occurring, and to evaluate whether potential changes in the column load due to the internal recycling impact the process.
4. Introduction: Process Performance Qualification (PPQ)
The purpose of Process Performance Qualification (PPQ) is to demonstrate that the commercial process consistently delivers product that meets specifications when running at scale in the actual facility with trained operators and qualified equipment. At least three consecutive, representative PPQ batches are run under normal operating conditions, to confirm that the control strategy works in routine manufacturing. PPQ verifies that the ranges and controls established during characterization are robust at a commercial scale at conditions comparable to the ones during routine manufacture (equipment, operators, eluents, and feed). In summary, the successful PPQ provides documented evidence that the process is fit for commercial use.
5. Materials and Methods: Bivalirudin as Peptide Test System
The RP purification of Bivalirudin was used as the test system for the presented PC/PPQ approach. Bivalirudin is a 20-mer direct thrombin inhibitor (DTI), with a molecular weight of 2180 g/mol. In this work, a crude material of 81% purity, produced via solid-phase peptide synthesis, was used. Purity was determined by analytical RP-HPLC. The target purity specification for the product pool was >99.0% with the additional constraint that the impurity profile must be comparable to the legacy batch process. Analytics (IPCs) were performed using a Waters CSH C18 1.7 um stationary phase (Waters, Milford, MA, USA) with a TFA/ACN mobile phase on an Acquity UPLC system (Waters, Milford, MA, USA). The preparative purification was based on a C-18 stationary phase in combination with a TFA/acetonitrile/water solvent system. PC work was carried out on a Contichrom CUBE 30 system (YMC ChromaCon, Zurich, Switzerland). MCSGP PPQ runs were carried out on a Contichrom TWIN 500 system (YMC America, Devens, MA, USA) with 30 cm i.D. DAC columns (Novasep, Pompey, France). All MCSGP runs were performed with activated AutoPeak UV-based process control. UV detection was performed at 280 nm.
6. Results: Process Characterization for Batch and MCSGP for Bivalirudin
In the first step of Process Characterization, for both batch and MCSGP chromatography, the process parameters shown in the following tables were identified (Table 1):

Table 1.
Process parameters and relevant variation sources for the chromatographic purification of Bivalirudin.
The commonly used process parameter equilibration, cleaning-in-place, and wash volumes are derived from the duration of the specific step and the applied volumetric flow rate. The same principle applies to the column load, which is a function of the duration of the feeding step and the volumetric flow rate as well as the concentration of the peptide in the feed solution. For the MCSGP-specific part of the purification process, the process parameters in (Table 2) were identified.
Table 2.
Process parameters and relevant variation sources specific to MCSGP.
The parameters listed in Table 1 and Table 2 may be critical process parameters for the MCSGP process, as they have the potential to influence peak shape and product distribution, thereby affecting the composition of the recycling and collection zones. However, the majority of these parameters are maintained within narrow operational ranges due to the high accuracy of the equipment employed in large-scale MCSGP processing. For these parameters, the variability assessed using the specifications and re-qualification data of the respective control sensors was deemed to be insufficient to cause any impact on peak shape or product distribution. Consequently, these well-controlled parameters were excluded from the Process Characterization activities to focus the practical work on relevant parameters.
For example, a Contichrom TWIN system has four three-head pumps: two for gradient generation, one for feeding, and one for in-line dilution, cleaning-in-place, and equilibration. Each pump is controlled with a dedicated flow meter with a calibration tolerance of +/−2%. Thus, while reporting the accurate flow rate, the effective flow rate may fluctuate by +/−2%. Whether this variance has an impact on the process depends on what is performed in the chromatographic sub-step: while +/−2% can be considered negligible for column equilibration, in-line dilution, cleaning-in-place, and any chase washes, a reduction in the column load by 2% should be investigated since it affects the peak shape and thus may change the content and impurity profile of the recycling zones. For the latter point, the parameter would be classified as a potentially critical process parameter that needs experimental data for further assessment, while all other parameters would be classified as well-controlled parameters that do not need experiments for Process Characterization.
Based on the outcome of this variance assessment, three individual parameters and the lumped parameter column load were identified as potentially critical process parameters for the Bivalirudin MCSGP process due to the calculated variances and basic chromatographic theory (Table 3). The parameter impurity profile has to be checked on a case-by-case basis for each new crude lot with a small-scale use test on a CUBE system until significant batch experience for upstream manufacturing is available and the standard parameters for MCSGP can be defined. The column lifecycle is not reported in this publication since it is usually stand-alone work that tends to go well beyond the manufacturing of PPQ batches.
Table 3.
Relevant process parameters for the Process Characterization of the Bivalirudin MCSGP process.
Experimental characterization studies for potentially critical process parameters were conducted using a classical OFAT approach with tested ranges being at least three times the calculated variation range. In some cases, even higher values were tested to stress the system further and build more confidence around the potential criticality of a parameter. It is worth noting that OFAT does not reveal interactions between parameters (as opposed to a DoE approach) but allows the testing of much larger ranges. For the presented study, an OFAT strategy was selected instead of DoE based on the following considerations: While a DoE could provide insights into potential parameter interactions, the primary observable effect of variations for peptides tends to be the width of the overall peak. In general, the relevant related substances of a peptide can be considered regular samples, meaning that they tend to exhibit similar retention behavior under gradient conditions. Therefore, the primary indicator of process variation is peak broadness rather than changes in resolution. Observed changes in purity for MCSGP tend to be due to misalignment of the recycling and discarding zones. Cumulative reductions or increases in peak width due to combinations of parameter variations (e.g., lower column load and steeper slope combined with a variation in wavelength that leads to overall lower signal levels), in combination with fixed recycling zones, may significantly increase the likelihood of a failed DoE and require repeated iterations of the DoE setup. For DoE tests with molecules with very stringent purity specifications, such as Bivalirudin, it is recommended to include combinations of parameters that lead to the smallest and broadest peaks as fixed experiments. In addition, testing smaller ranges should be considered.
The following parameter ranges were tested for the Bivalirudin MCSGP process (Table 4):
Table 4.
Process parameters, normal operating ranges, and tested ranges for the Process Characterization of the Bivalirudin MCSGP process.
For each parameter set point, at least five MCSGP cycles (each comprising two elutions, i.e., one from each column) were performed to confirm cyclic steady state operation. The two elutions per cycle were pooled to obtain the average product pool purity. Purity and yield were determined by analytical HPLC. As shown in Figure 3, all experiments resulted in product purity > 99.0%. The average purity was 99.30% and all purity values remained in a band given by the average purity value +/−3 σ (three standard deviations), i.e., 99.30% +/− 0.32%. In statistics, ±3σ typically captures ~99.7% of expected values (assuming normal distribution). All observed purity values under parameter variation fall within that band, which indicates that the parameters do not strongly influence purity within the tested ranges. Therefore, the parameters are not considered CPPs. In practice, this means that the effect of the parameters is indistinguishable from normal process variability (noise) and the process is robust within the investigated range (i.e., the Proven Acceptable Range (PAR) would be identical to the characterized range).
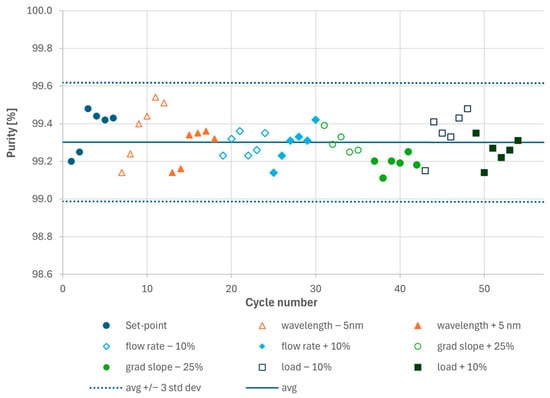
Figure 3.
Results of the analytical HPLC analyses of the main cuts generated during the Process Characterization experiments. Each dot represents one cycle pool consisting of the two elutions from columns 1 and 2.
In addition to overall purity, samples from each eluate pool were evaluated for content of individual impurities (Figure 4). Comparison of the impurity profiles showed very consistent results for all runs besides the run with −25% displacer slope, where a single impurity was slightly elevated from <LOQ (limit of quantitation) to 0.13% (uppermost trace in Figure 4).
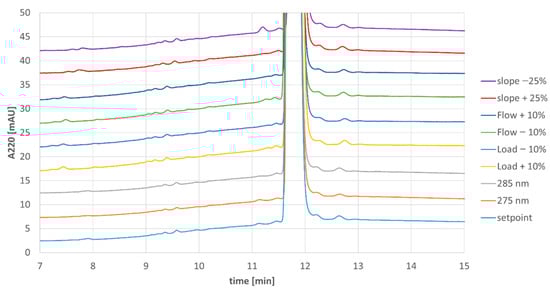
Figure 4.
Analytical chromatograms of MCSGP product pools from Process Characterization.
Since the impurity profile for the shallower slope experiment was not consistent with the legacy process, the parameter gradient slope was designated as a critical process parameter and the maximum possible variance during routine manufacturing was reduced with organizational measures. The other tested parameters, column load, elution flow rate, and detection wavelength, could be designated as non-critical process parameters.
To be consistent with the legacy process, the gross-to-gross yields were evaluated (Figure 5) based on the mass of crude loaded (ignoring purity and peptide content) and the mass of API produced. The latter was obtained by combination of the main cuts per experiment followed by dilution with water and isolation via freeze-drying. For the yield, a surprising increase for the experiment with the shallow slope was observed (Figure 5). Excluding this run from further evaluation due to elevated levels of the single impurity and considering the crude purity of 86% and residual solvents from the TFA cleavage stage, the actual yields of the MCSGP processes would be well above 75% (gross-to-gross yields of 60–65%).
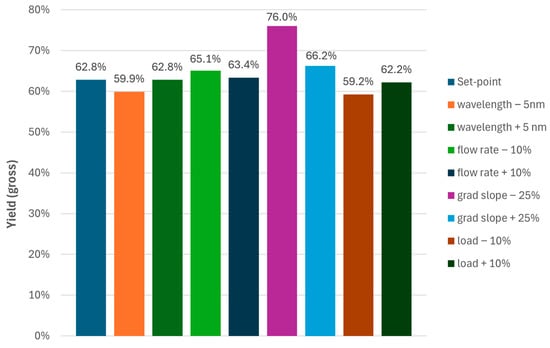
Figure 5.
Gross-to-gross yields for the MCSGP operating points investigated during Process Characterization.
7. Results: Process Performance Qualification (PPQ)
7.1. MCSGP Control Strategy
MCSGP is a fully automated process that operates with predefined recycling and collection windows. Unlike traditional batch chromatography, where adjustments can be made during the pooling step to compensate for changes in separation, MCSGP does not allow for such remediation. As a result, the chromatographic separation itself has a greater influence on the final product quality. Therefore, besides the recycling and collection windows controlled by the AutoPeak PAT feature, all parameters discussed in Table 1 and Table 2 are considered integral parts of the overall control strategy. The IPC performed on the isolated material is the final gatekeeper regarding product quality in both processes (batch and MCSGP), ensuring adequate detection of related impurities and confirming compliance with the target purity profile.
7.2. Process Supervision Strategy
With MCSGP operating in a cyclic manner over several hours to days, continuously generating product eluates, a suitable supervision and sampling strategy needs to be defined, as well as an online control mechanism. Since it is not cost-effective to collect all main cuts separately on a production scale, a two-phased supervision strategy is applied. During the start-up of any MCSGP process, an intensive monitoring phase is initiated in which all main cuts are analyzed with an adequate in-process control (IPC) method. This is performed until the following criteria for the cyclic steady state are fulfilled:
- Comparable impurity profiles for the main cuts according to the (IPC);
- Good overlay of the overall UV traces per column according to MCSGP online monitoring;
- Comparable main cut volume on a column basis according to MCSGP online monitoring.
The main cut borders are defined by UV thresholds that were entered into the AutoPeak control.
Once the cyclic steady state is achieved, with AutoPeak adjusting for peak retention time shifts occurring over time and keeping the process at its set point, the sampling program for analytical HPLC is significantly reduced. More specifically, just two samples per day (strategic IPC sampling), the UV trace overlay and the main cut volume per column, are used for process supervision. An exemplary display of main cut trending and the sampling strategy is provided in Figure 6.
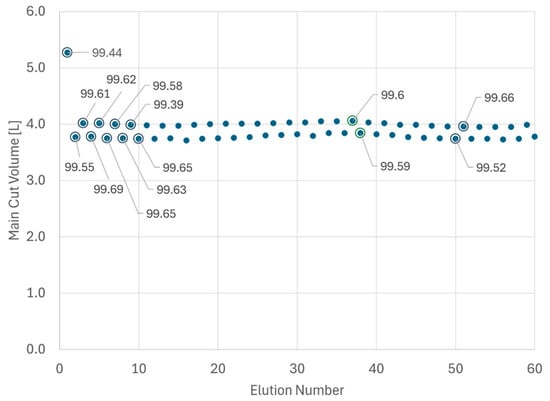
Figure 6.
Trending of main cut volume for the first 60 elutions of a large-scale MCSGP run. Marked dots = main cut was sampled and analyzed by analytical HPLC. Data labels indicate purity.
This approach fulfills the risk management expectations related to product availability as outlined in the ICH Q9 (R1) guideline [20].
7.3. Pre-PPQ Batch
To ensure a successful Process Performance Qualification, a pre-PPQ batch is usually performed. For the Bivalirudin case, this GMP-MCSGP run consisting of eleven elutions was successfully conducted. In this pre-PPQ MCSGP run, a total of 1.5 kg of crude peptide was successfully purified, generating 0.8 kg of the intermediate product with a PMI of 1402 kg/kg (purification only) and a purity of 99.6%.
7.4. Process Performance Qualification (PPQ)
After the successful pre-PPQ batch, the actual PPQ activities were initiated. As it was the goal to manufacture at least three drug substance batches covering a large size range, a campaign consisting of four multiday MCSGP runs was conducted (the last batch was divided into two parts). A typical overlay of the obtained UV traces is provided below (Figure 7). In this run, over time, a slight peak shift was observed from cycle to cycle, (Figure 7 left); this, however, was corrected by AutoPeak, as visualized by the exact overlay of the peaks when adjusted to the AutoPeak trigger point that corresponds to the start of the product collection interval.
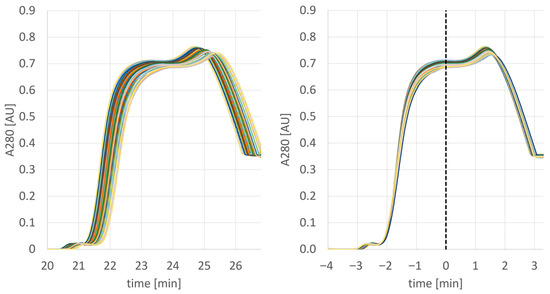
Figure 7.
UV traces of 43 elutions as performed on column 2 of PPQ batch 1 (left) and adjusted to the first trigger point to simulate the AutoPeak correction (right).
In all four MCSGP runs, consistent elution profiles, main cut sizes, and product purities were realized. A comparison of the impurity profiles for elution 3 (first elution in cyclic steady state) with elution 106 (last measured elution) of the longest MCSGP run is provided below (Figure 8).
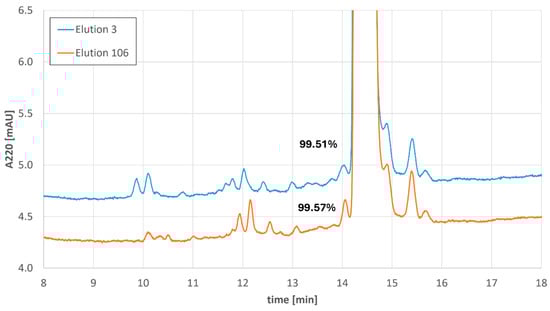
Figure 8.
Impurity profiles of the 3rd elution and the 106th elution of the longest Bivalirudin MCSGP run including the values of the product peak purity.
Figure 9 shows the IPC results generated for all PPQ MCSGP runs. For all full elutions, product purity remained within the +/−3 σ band as anticipated from Process Characterization, confirming process robustness.
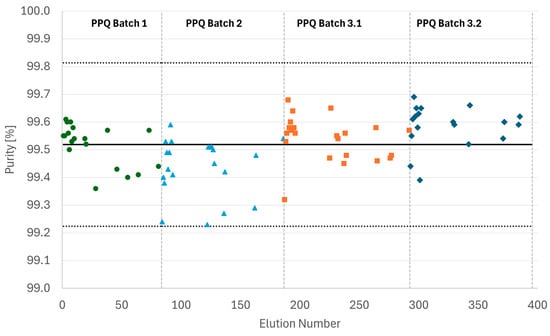
Figure 9.
Purity as determined by IPC (%Area HPLC) of all samples collected from the four PPQ MCSGP runs. The solid line represents the average purity value, and the dotted lines indicate the borders of the +/−3 σ band.
The PPQ batches were followed by a solid phase extraction (SPE) performed on the same Contichrom TWIN system and columns. In this process the columns were alternatingly loaded and eluted using a sharp gradient.
A summary of the manufacturing campaign is provided in Figure 10.
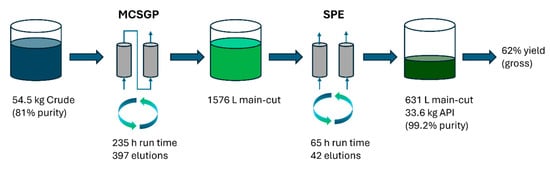
Figure 10.
Overview of the Bivalirudin PPQ campaign.
During the PPQ campaign, a total of 54.5 kg of crude peptide was converted to 33.6 kg purified material. This corresponds to a gross-to-gross yield of 62% and an effective yield of 76%, taking only product/crude purity into account. For comparison, the gross-to-gross yield of the legacy batch process with extensive side-cut re-chromatography is 57%. Compared to the legacy process based on batch chromatography on a 60 cm column, the number of IPCs could be reduced from 81 IPCs per kg to 3.2 IPCs per kg (i.e., from 2753 IPCs total to 108 IPCs). Also, the PMI of the downstream manufacturing stage was reduced from around 5200 to 1400 kg/kg. The chromatography processes were completed within 300 h of operating time. A large advantage of MCSGP, facilitated by the robust control strategy supported by online measurements, was its capability of running uninterrupted over several days. Data integrity and electronic batch record handling requirements are identical in batch and MCSGP processes.
8. Conclusions
In this work, an approach for Process Characterization (PC) and Process Performance Qualification (PPQ) for continuous chromatography (MCSGP) is proposed based on the purification of Bivalirudin. Thereby the process description of MCSGP resulting in the list of process parameters is largely identical to the one of batch chromatography, with only a few additional MCSGP-specific parameters. Out of the 34 identified process parameters, 4 were identified as potentially critical process parameters due to the inherent process variability and basic chromatographic theory: linear elution velocity, gradient slope, column load, and detection wavelength (These parameters would also be investigated in the Process Characterization of the corresponding batch process). The impact of variations in these process parameters on the relevant Critical Quality Attributes (CQAs) was evaluated experimentally based on criteria for product purity, levels of individual related substances, and yield. Only the parameter gradient slope was identified as a Critical Process Parameter (CPP) and tighter limits were introduced in the updated control strategy. For different peptides or oligonucleotides, other parameters may be identified as potential CPPs. During Process Characterization, MCSGP requires more crude material than batch chromatography as the cyclic steady state needs to be confirmed based on subsequent identical elution profiles. However, in the presented study, the extra experimental time for MCSGP characterization could be minimized by daisy-chaining and automatically executing the required MCSGP runs.
An MCSGP supervision strategy was developed containing the three elements of IPCs, online UV elution profile monitoring, and main cut volume recording. The PPQ runs then verified that the ranges and controls established during characterization were robust at a commercial scale, with real-world variability of equipment, operators, and raw materials. Through a sampling scheme adapted to the start-up phase (with frequent sampling) and the cyclic steady state phase (with less frequent, strategic sampling), and with AutoPeak as PAT, the supervision strategy was actively enforced. The PPQ runs also demonstrated the advantages of MCSGP with regard to continuous, automated operation and reduction in IPCs and PMI. Overall, the presented approach of PC and PPQ for the first time provides a stringent pathway to form the foundation of the Process Validation lifecycle. It is expected to also be suitable for other synthetic peptides and oligonucleotides.
Author Contributions
Conceptualization, R.E. and T.M.-S.; Methodology, R.E.; Validation, R.E.; Formal analysis, R.E. and T.M.-S.; Investigation, R.E.; Resources, R.E.; Data curation, R.E. and T.M.-S.; Writing—original draft, R.E. and T.M.-S.; Visualization, R.E. and T.M.-S.; Supervision, R.E. All authors have read and agreed to the published version of the manuscript.
Funding
This research received no external funding.
Data Availability Statement
The original contributions presented in this study are included in the article. Further inquiries can be directed to the corresponding author.
Acknowledgments
The internal manuscript review by Ralph Schönleber, Anja Erdin, Tanja Huth, and Stefan Sperner (Bachem AG) and Sebastian Vogg and Thomas Hug (ChromaCon AG) is greatly appreciated.
Conflicts of Interest
Author Ralf Eisenhuth was employed by the company Bachem AG. Author Thomas Müller-Späth was employed by the company ChromaCon AG. The remaining authors declare that the research was conducted in the absence of any commercial or financial relationships that could be construed as a potential conflict of interest.
References
- Aumann, L.; Morbidelli, M. A semicontinuous 3-column countercurrent solvent gradient purification (MCSGP) process. Biotechnol. Bioeng. 2008, 99, 728–733. [Google Scholar] [CrossRef] [PubMed]
- Steinebach, F.; Ulmer, N.; Decker, L.; Aumann, L.; Morbidelli, M. Experimental design of a twin-column countercurrent gradient purification process. J. Chromatogr. A 2017, 1492, 19–26. [Google Scholar] [CrossRef] [PubMed]
- Luca, C.D.; Felletti, S.; Lievore, G.; Buratti, A.; Vogg, S.; Morbidelli, M.; Cavazzini, A.; Catani, M.; Macis, M.; Ricci, A.; et al. From batch to continuous chromatographic purification of a therapeutic peptide through multicolumn countercurrent solvent gradient purification. J. Chromatogr. A 2020, 1625, 461304. [Google Scholar] [CrossRef] [PubMed]
- Weldon, R.; Lill, J.; Olbrich, M.; Schmidt, P.; Müller-Späth, T. Purification of a GalNAc-cluster-conjugated oligonucleotide by reversed-phase twin-column continuous chromatography. J. Chromatogr. A 2022, 1663, 462734. [Google Scholar] [CrossRef] [PubMed]
- Vetter-Joss, L.; Sellberg, A.; Hansen, E.B. Model-Supported Design of Multicolumn Countercurrent Solvent Gradient Purification Processes for Rapid Implementation. Ind. Eng. Chem. Res. 2024, 63, 17612–17624. [Google Scholar] [CrossRef]
- Weldon, R.; Vandermeersch, T.; Müller-Späth, T. Continuous Purification of a Conjugated Short Interfering RNA Therapeutic Using Anion Exchange Twin-Column Chromatography (MCSGP). Org. Process Res. Dev. 2025, 29, 1400–1410. [Google Scholar] [CrossRef]
- Abe, A.; Časar, Z. Overview and Recent Advances in the Purification and Isolation of Therapeutic Oligonucleotides. Org. Process Res. Dev. 2025, 29, 15–33. [Google Scholar] [CrossRef]
- Kekessie, I.; Wegner, K.; Martinez, I.; Kopach, M.E.; White, T.D.; Tom, J.K.; Kenworthy, M.N.; Gallou, F.; Lopez, J.; Koenig, S.G.; et al. Process Mass Intensity (PMI): A Holistic Analysis of Current Peptide Manufacturing Processes Informs Sustainability in Peptide Synthesis. J. Org. Chem. 2024, 89, 4261–4282. [Google Scholar] [CrossRef] [PubMed]
- De Luca, C.; Felletti, S.; Bozza, D.; Lievore, G.; Morbidelli, M.; Sponchioni, M.; Cavazzini, A.; Catani, M.; Cabri, W.; Macis, M.; et al. Process Intensification for the Purification of Peptidomimetics: The Case of Icatibant through Multicolumn Countercurrent Solvent Gradient Purification (MCSGP). Ind. Eng. Chem. Res. 2021, 60, 6826–6834. [Google Scholar] [CrossRef]
- Fioretti, I.; Müller-Späth, T.; Aumann, L.; Sponchioni, M. UV-based dynamic control improves the robustness of multicolumn countercurrent solvent gradient purification of oligonucleotides. Biotechnol. J. 2024, 19, 2400170. [Google Scholar] [CrossRef] [PubMed]
- Food and Drug Administration. Guidance for Industry: PAT—A Framework for Innovative Pharmaceutical Development, Manufacturing, and Quality Assurance; Food and Drug Administration: Rockville, MD, USA, 2004.
- Food and Drug Administration. Guidance for Industry: Process Validation: General Principles and Practices; Center for Biologics Evaluation and Research, US Department of Health and Human Services: Rockville, MD, USA, 2011.
- ICH. ICH Harmonised Tripartite Guideline. Pharmaceutical Development. Q8 (2R). As Revised in August 2009; ICH: Geneva, Switzerland, 2009; p. 23. [Google Scholar]
- ICH. ICH Harmonised Tripartite Guideline. Development and Manufacture of Drug Substances (Chemical Entities and Biotechnological/Biological Entities) Q11; European Medicines Agency: London, UK, 2011. [Google Scholar]
- ICH. Guideline, ICH Harmonised. Continuous Manufacturing of Drug Substances and Drug Products Q13; ICH: Geneva, Switzerland, 2021. [Google Scholar]
- Rathore, A.S.; Winkle, H. Quality by design for biopharmaceuticals. Nat. Biotechnol. 2009, 27, 26–34. [Google Scholar] [CrossRef] [PubMed]
- Stamatis, D.H. Failure Mode and Effect Analysis; Quality Press: Milwaukee, WI, USA, 2003. [Google Scholar]
- Baur, D.; Angelo, J.; Chollangi, S.; Müller-Späth, T.; Xu, X.; Ghose, S.; Li, Z.J.; Morbidelli, M. Model-assisted process characterization and validation for a continuous two-column protein A captaure process. Biotechnol. Bioeng. 2019, 116, 87–98. [Google Scholar] [CrossRef] [PubMed]
- Mant, C.T.; Chen, Y.; Yan, Z.; Popa, T.V.; Kovacs, J.M.; Mills, J.B.; Tripet, B.P.; Hodges, R.S. HPLC analysis and purification of peptides. Methods Mol. Biol. 2007, 386, 3–55. [Google Scholar] [CrossRef] [PubMed]
- ICH. Guideline, ICH Harmonised Tripartite. Quality Risk Management; Q9, Current Step; ICH: Geneva, Switzerland, 2005; Volume 4, p. 408. [Google Scholar]


Disclaimer/Publisher’s Note: The statements, opinions and data contained in all publications are solely those of the individual author(s) and contributor(s) and not of MDPI and/or the editor(s). MDPI and/or the editor(s) disclaim responsibility for any injury to people or property resulting from any ideas, methods, instructions or products referred to in the content. |
© 2025 by the authors. Licensee MDPI, Basel, Switzerland. This article is an open access article distributed under the terms and conditions of the Creative Commons Attribution (CC BY) license (https://creativecommons.org/licenses/by/4.0/).