Abstract
A mechanical structure of a fiber Fabry–Perot interferometric vibration sensor for monitoring oil and gas pipelines has been proposed, and design analysis research on performance improvement has been carried out. By designing a serpentine beam structure, the mechanical sensitivity of the sensor is enhanced. Meanwhile, by designing a vertically symmetrical gravity-sensing structure, the cross-axis sensitivity of the sensor is reduced. The results of simulation analysis show that the mechanical sensitivity of the proposed design structure is 89.20 μm/g, which is 32.44 times that of the conventional structure. Moreover, due to the design of low cross-axis sensitivity, the optical sensitivity of the vibration sensor will not be degraded because of its installation status on the pipeline. The proposed mechanical structure provides a design reference for the application of the fiber Fabry–Perot interferometric vibration sensor on oil and gas pipelines, and offers potential for the development of a high-performance comprehensive safety risk monitoring system for oil and gas pipelines.
1. Introduction
The scale of oil and gas pipelines in China exceeds 190,000 km [1]. These pipelines are distributed across the country, spanning 31 provinces, municipalities, and special administrative regions. However, during the normal service period of the pipelines, pipeline ruptures and leakage of the transported medium occur frequently, resulting in losses of oil and gas assets and even creating potential safety hazards such as flammability and explosiveness [2,3]. In response to this, it is necessary to monitor the abnormal conditions of the pipelines. Pipeline safety risk monitoring can be divided into two methods [4,5]: the first is the internal inspection method, and the second is the external inspection method. Among them, the internal inspection method mostly relies on technologies such as acoustic waves to collect data on the fluids in the pipelines [6,7]. However, this method has obvious disadvantages, with insufficient detection continuity, and placing sensors in the pipelines is likely to cause blockages. When using the external inspection method, mainly through methods such as the negative pressure wave method, the stress wave method, and vibration identification, the detection accuracy can be ensured on the premise of ensuring the continuity of detection [8].
The vibration identification method is an efficient pipeline abnormality detection method. When there is pipeline vibration caused by human factors or external natural factors, an irregular external disturbance will be superimposed on the original regular internal disturbance [9,10]. By collecting vibration signals in real time through vibration sensors, the aliasing of internal and external disturbances can be separated through signal analysis. While monitoring the state of the pipelines, the form and source of the external disturbance can be determined to ensure the healthy use of the pipelines. For vibration identification, the distributed optical fiber-sensing method and the vibration-sensing method outperform other leakage monitoring techniques in overall performance, including sensitivity, localization accuracy, false alarm rate, and detection time [11]. However, the installation and maintenance costs of the distributed optical fiber method are considerably high [12]. In contrast, the vibration-sensing method offers greater versatility, as it is applicable to both newly constructed and existing pipelines, and requires lower maintenance costs [11]. As the core components of the vibration-sensing method, vibration sensors can be classified into electrical, optical interferometric, etc., according to the detection principle. Compared with those based on the electrical principle, optical interferometric vibration sensors such as the optical Fabry–Perot (FP) interferometric type have many advantages applicable to the monitoring of oil and gas pipelines, such as high sensitivity and strong resistance to electromagnetic interference [13]. The core structural principle of the FP interferometric vibration sensor is the FP interferometer, a simplified schematic of which is shown in Figure 1a. The FP cavity of the interferometer consists of two parallel reflective surfaces. The incident light beam enters the FP cavity and is reflected at these two surfaces, after which the two reflected beams converge and interfere with each other. The optical path difference in the FP cavity is determined by the length of the cavity. In the FP interferometric vibration sensor, the two parallel surfaces of the FP cavity are a sensitive diaphragm and a semi-transparent, semi-reflective surface, respectively. The FP interferometer typically generates multi-beam interference, meaning that the light undergoes multiple reflections and transmissions between the two surfaces, resulting in the interference of multiple beams with optical path differences forming an arithmetic progression. This produces sharper interference fringes. The simple structure of the FP interferometer facilitates high sensitivity. Based on whether the semi-transparent, semi-reflective surface in the FP interferometer structure is the end face of an optical fiber or a diffraction grating, FP interferometric vibration sensors can be classified into fiber-optic FP type and grating FP type [14]. Among them, the grating FP interferometric vibration sensor combines the FP cavity structure with a diffraction grating. It measures the displacement of a mass by modulating the phase of the diffracted light through changes in the interferometer cavity length, thereby detecting vibration signals. The grating FP type theoretically allows for a more compact design compared to the fiber optic FP type. However, due to the size constraints of high-performance, highly collimated lasers, high-performance grating FP vibration sensors have not yet achieved compactness [15]. Moreover, since the vibration measurement principle of the grating FP requires the use of a grating backplate that is difficult to reduce in size, the grating FP vibration sensors themselves will be negatively affected by squeeze film damping, which will lead to a decline in their mechanical performance [16]. In contrast, fiber FP interferometric vibration sensors are hardly affected by squeeze film damping, because the diameter of the fiber core used to form the FP interferometer is only 8 to 10 μm [17].
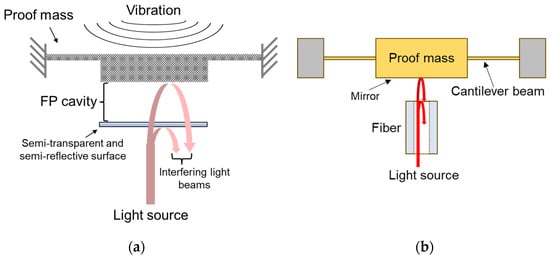
Figure 1.
(a) Simplified structural diagram of Fabry–Perot interferometric sensor; (b) Schematic diagram of the fiber Fabry–Perot interferometric vibration sensor.
Fiber-optic FP interferometers are widely used in sensor design, such as in sensors for refractive index measurement. Duan et al. developed a fiber-optic FP interferometer using a diamond film bonded to the tip of a single-mode optical fiber, enabling an ultra-wide RI measurement range of 1.0 to 2.4. This design overcomes the measurement blind spot of silica-based FPI sensors near an RI of ~1.45 (close to silica’s RI) and exhibits a sensitivity of −0.4362/RIU within the 1.33–1.40 RIU range, showing great potential for high-RI material detection in industries such as integrated chips [18]. Meanwhile, Anelli et al. proposed an S-tapered optical fiber sensor based on fluoride glass, fabricated via off-axis pulling and graphite filament heating. This sensor leverages the low attenuation and excellent mid-infrared (Mid-IR) transmission properties of fluoride glass, achieving a notable redshift of 107 nm in the transmission spectrum when the surrounding medium changes from air to propanol in the Mid-IR range. This breakthrough addresses the limitation of traditional silica fibers in Mid-IR transmission and demonstrates high sensitivity for RI sensing in environmental and biomedical scenarios [19]. The aforementioned studies on RI sensors focus on material innovation (e.g., fluoride glass, diamond) and structural optimization for RI response, which can provide valuable design references for vibration sensors based on the same principle. Fiber FP interferometric vibration sensors have not been put into large-scale practical application in the monitoring of oil and gas pipelines, and their targeted performance optimization still awaits further research. Most of the recent research on fiber FP interferometric vibration sensors has focused on the performance reliability at high temperature. Liu et al. proposed a crab-shaped mechanical structure based on single-crystal sapphire material, which can operate within the temperature range from 20 °C to 800 °C with a mechanical sensitivity of 0.876 nm/g [20]. Su et al. proposed a crab-shaped mechanical structure based on single-crystal magnesium oxide material, which can work within the temperature range from 20 °C to 1000 °C [21]. Cao et al. proposed a mechanical structure design based on sapphire material, with a working temperature up to 600 °C and a mechanical sensitivity of 38.66 nm/g [22]. These studies have achieved the reliability of operation at high temperatures by using expensive high-temperature-resistant materials. However, the ability to work at ultra-high temperatures is not essential for vibration sensors used in pipeline monitoring. Moreover, there is much room for improvement in the sensitivity of the mechanical structures in these studies. In addition, these studies did not consider the design of minimizing cross-axis sensitivity. Low cross-axis sensitivity of fiber FP interferometric vibration sensors is particularly important in the monitoring of oil and gas pipelines, because the non-parallelism of the FP cavity caused by cross-axis sensitivity may lead to a significant decline in the optical sensitivity performance [23].
Therefore, the paper proposes a mechanical structure of a fiber FP interferometric vibration sensor with both high mechanical sensitivity and low cross-axis sensitivity, and the design optimization of the core parameters is carried out through simulation analysis. The vertically symmetrical gravity-sensing structure based on the serpentine beam can reduce the mechanical stiffness and maintain the parallelism of the FP cavity end faces under different tilt states. The proposed fiber FP interferometric vibration sensor provides the possibility for the monitoring of minute abnormal vibrations in oil and gas pipelines.
2. Sensing Principle
A fiber optic FP interferometric vibration sensor consists of a single mode optical fiber, a proof mass, and a cantilever beam, as shown in Figure 1b. The lower surface of the proof mass acts like a mirror. The mirror surface, the fiber’s exit face, and the gap between them form an FP-type interferometer. When the laser exits the fiber end face, part of the emitted light is reflected by the fiber end face, forming the first beam of light. Another part of the emitted light is reflected by the mirror, creating the second beam of light. These two beams interfere with each other due to a phase difference. The displacement of the proof mass caused by inertial force alters the interference phase. The intensity of the interfering light beams can be expressed as [24]:
where R is the reflectivity of the fiber end face and the inner surface of the proof mass, given that their refractive indices are nearly the same, is the laser light intensity, is the laser wavelength, is the length of the FP cavity.
The simplified mechanical structure model with straight-beam cantilevers is shown in Figure 2, which includes three cantilever beams and a cylindrical proof mass. The stiffness , mechanical sensitivity , and resonant frequency of the three cantilever beams can be expressed as [13]:
where and are the elastic modulus and weight of the mechanical structure, respectively, , and are the width, thickness and length of the cantilever, respectively, and is the gravitational acceleration.
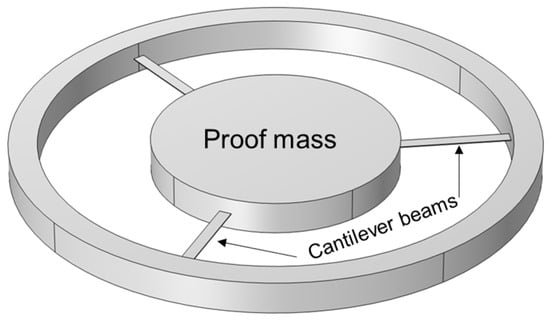
Figure 2.
Simplified mechanical structure model with straight-beam cantilevers.
Inspired by high-performance miniature speaker [25], this paper proposes a serpentine beam mechanical structure. The schematic diagram of the proposed mechanical structure is shown in Figure 3a. This structure includes a proof mass and three serpentine cantilever beams, with the serpentine cantilever beams located in the middle of the vertical direction of the proof mass. The design of the serpentine beams can enhance the mechanical sensitivity, and the structure of the beams is depicted in Figure 3b. The width of the serpentine beams is Ws, the spacing between adjacent beams is D, and the divergence angle is . The stiffness of regular cantilever beams (such as the structure shown in Figure 2) can be analyzed using mechanical theories. However, for irregular cantilever beam structures like the serpentine beams, the calculation is more complicated. Therefore, in the following sections, the finite element method will be employed to analyze and elucidate the mechanical properties of this mechanical structure.
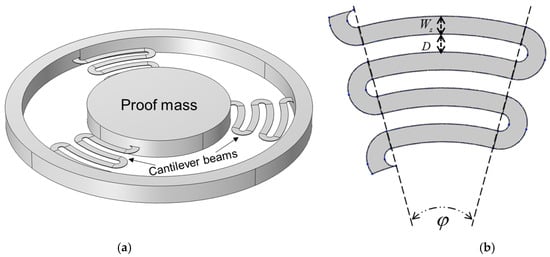
Figure 3.
(a) Schematic diagram of the proposed mechanical structure; (b) structure of the serpentine cantilever beam.
3. Mechanical Structure and Analysis
3.1. Validity of the Simulation
To verify the effectiveness of the simulation, a finite element simulation was used to establish a simulation model of the silicon-based straight-beam cantilever mechanical structure. The simulation parameters are shown in Table 1. The displacement change in the structure under a gravitational acceleration of 1 g was calculated, and the simulation results are shown in Figure 4. Figure 4a indicates that the simulated resonant frequency of the straight-beam cantilever mechanical structure is 300.36 Hz, which is consistent with the result calculated by Equation (4). Figure 4b shows that the displacement of the mass block changes by 2.75 μm under a gravitational acceleration of 1 g, resulting in a mechanical sensitivity of the cantilever beam of 2.75 μm/g, which aligns with the calculation from Equation (3). The consistency between the finite element simulation and the theoretical calculation results confirms the validity of subsequent simulations.

Table 1.
Simulation parameters of straight-beam cantilever mechanical structure.
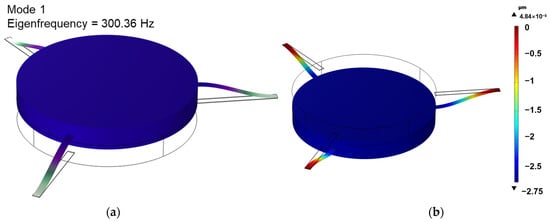
Figure 4.
(a) Natural frequency and vibration modes of the first mode; (b) displacement nephogram of the straight-beam cantilever mechanical structure under 1 g acceleration in the sensitive axis.
3.2. Structural Design Analysis
Using the finite element method, the size parameters were optimized based on the serpentine cantilever beam design to achieve the appropriate mechanical sensitivity and maximum stress. The first optimization focused on the divergence angle of the cantilever beam. The simulation results of the divergence angle ranging from 10 degrees to 90 degrees are shown in Figure 5. Figure 5 indicates that as the divergence angle increases, both the mechanical sensitivity and the maximum stress increase. Considering the design margin for the vibration sensor, the target for the maximum stress was set around 25 MPa. Therefore, a divergence angle of 60 degrees was chosen for the design.
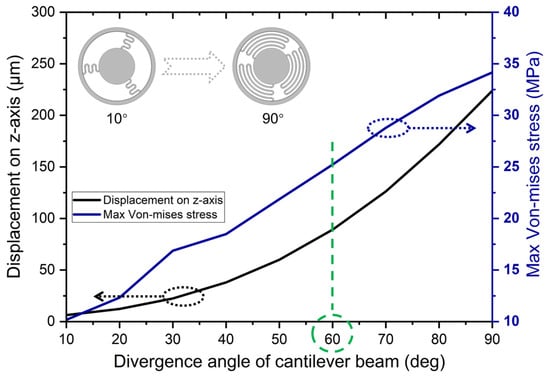
Figure 5.
Curves of the maximum displacement along the z-axis and maximum stress versus divergence angle of cantilever beam.
Then, the optimization focused on the width of the cantilever beam. The simulation results of the cantilever beam width ranging from 50 μm to 200 μm are shown in Figure 6. Figure 6 shows that as the width of the cantilever beam increases, both the mechanical sensitivity and the maximum stress decrease. Considering that the target for the maximum stress design is around 25 MPa, the width of the cantilever beam was designed to be 120 μm.
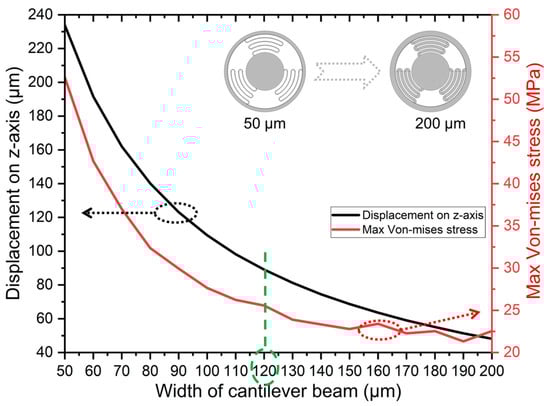
Figure 6.
Curves of the maximum displacement along the z-axis and maximum stress versus width of cantilever beam.
Based on the above-optimized design parameters, the serpentine cantilever beam mechanical structure proposed for the fiber FP interferometric vibration sensor was designed and simulated. The design parameters are shown in Table 2. The stress and displacement contour plots of the mechanical structure under a 1 g acceleration on the sensitive axis are shown in Figure 7. Figure 7 indicates that the maximum stress of the mechanical structure is 25.05 MPa, which meets the requirements of the design margin. Additionally, the mechanical sensitivity of the proposed design structure is 89.20 μm/g. Compared to Figure 4b, it can be observed that this mechanical sensitivity is 32.44 times that of the straight-beam structure. Therefore, the proposed serpentine cantilever beam design significantly enhances the mechanical sensitivity.
Table 2.
Designed parameters of the proposed mechanical structure with serpentine cantilever beams.
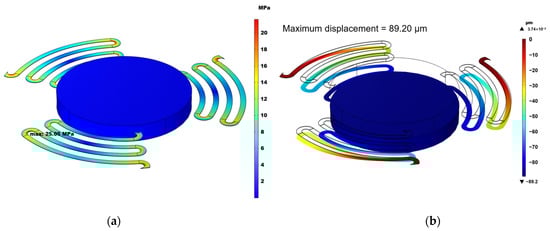
Figure 7.
(a) Stress nephogram and (b) displacement nephogram of the proposed mechanical structure under 1 g acceleration in the sensitive axis.
The proposed mechanical structure employs a three-cantilever serpentine cantilever beam design. For comparison, simulations were conducted on two-cantilever and four-cantilever serpentine cantilever beam configurations, with the results shown in Figure 8a,b, respectively. Figure 8a shows that the maximum stress of the two-cantilever serpentine cantilever beam is 37 MPa, which does not meet the requirements for a generous design margin. Figure 8b indicates that the mechanical sensitivity of the four-cantilever serpentine cantilever beam is 67.2 μm/g, approximately three-quarters of the mechanical sensitivity of the three-cantilever serpentine beams. These simulation results underscore the design rationality of the three-cantilever serpentine beams.
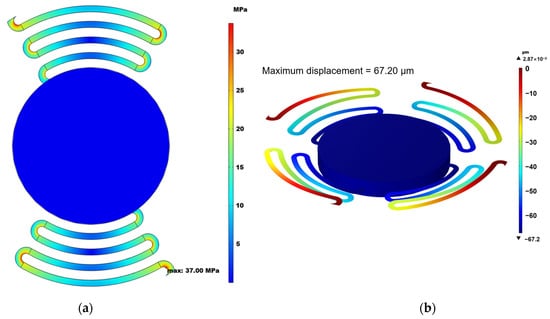
Figure 8.
(a) Stress nephogram of the two-cantilever serpentine beams mechanical structure; (b) displacement nephogram of the four-cantilever serpentine beams mechanical structure under 1 g acceleration in the sensitive axis.
3.3. Cross-Axis Sensitivity Analysis
Cross-axis sensitivity is a crucial factor affecting the performance of vibration sensors used in oil and gas pipelines. Considering the actual installation status of vibration sensors on cylindrical pipelines, as shown in Figure 9a, when the installation angles of the vibration sensors are 0°, 30°, 90°, 150°, and 180°, respectively, the corresponding values on the sensitive axis are 1 g, 0.5 g, 0 g, −0.5 g, and −1 g, respectively. In terms of structural design, the key factor influencing cross-axis sensitivity is the relative position between the geometric center of the cantilever beam and the center of the proof mass. For a proof mass with symmetrical cantilever beams, its center of mass coincides with the geometric center of the cantilever beams. In this case, if the proof mass is subjected to acceleration in the cross-axis direction, the optical interferometer can still remain parallel, as shown in Figure 9b. When the cantilever beams are asymmetrically distributed on one side in the vertical direction of the proof mass, the center of gravity of the proof mass will be separated from the geometric center of the cantilever beams. In this situation, if the proof mass is accelerated in the transverse axis direction, the inertial force will generate a torsional moment, causing the reflecting surface of the proof mass to deflect, as shown in Figure 9c. The deflection of the reflecting surface will lead to a reduction in the optical sensitivity of the interferometer, which in turn will degrade the performance of the vibration sensor [19]. Therefore, in order to achieve high-performance operation on pipelines, the fiber FP interferometric vibration sensor needs to have a low cross-axis sensitivity.
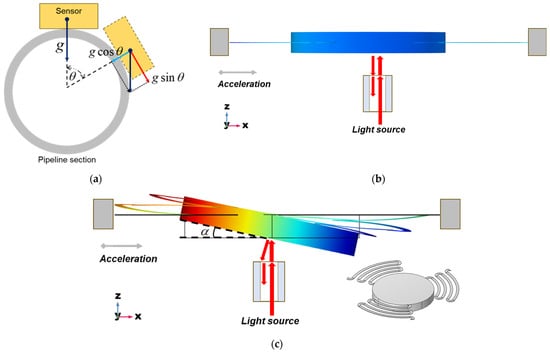
Figure 9.
(a) Working state of the vibration sensor on the outer surface of pipeline; (b) steady-state simulation results of symmetrical cantilever beam structure and (c) asymmetrical cantilever beam structure under cross-axis acceleration.
Using the proposed symmetric cantilever beam design, the vibration sensor can accurately detect the acceleration along the sensitive axis, and the results are shown in Figure 10a. However, the vibration sensor with an asymmetric cantilever beam design will have the problem of cross-axis sensitivity. Its proof mass will deflect, and the deflection angle will change with the variation in the installation angle. The results are shown in Figure 10b. When the turntable is at 0 degrees and 180 degrees, the acceleration along the non-sensitive axis is 0 g, and the proof mass of the vibration sensor does not deflect, leaving the two groups of reflected light paths unaffected. At other angles during the rotation stage, the deflection of the proof mass of the vibration sensor will cause the tilt of the reflected light paths, which will lead to a reduction in the optical sensitivity and further result in a degradation of the output performance. Therefore, the proposed symmetric cantilever beam design can reduce the cross-axis sensitivity and effectively prevent the degradation of the sensor’s performance.
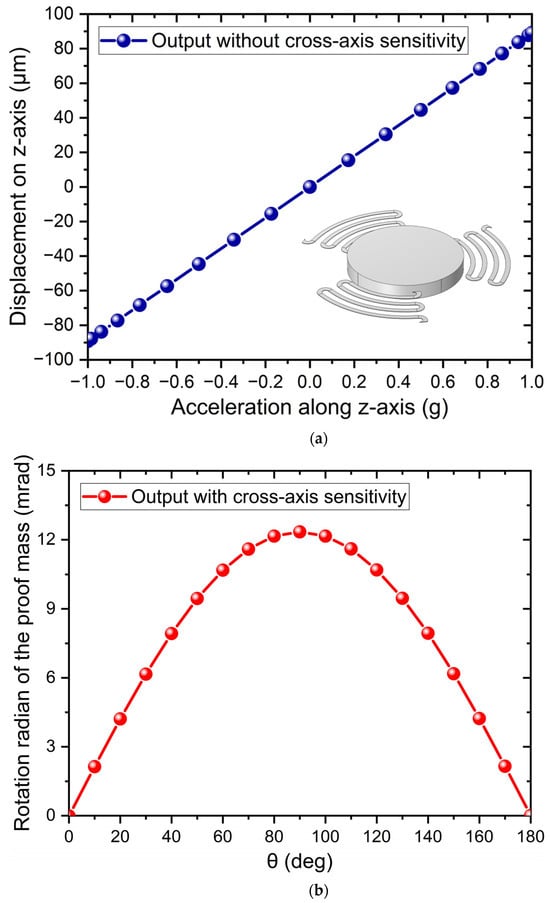
Figure 10.
(a) Output of vibration sensor without cross-axis sensitivity; (b) The curve of the proof mass deflection in radians versus the rotation table angle when using an asymmetric cantilever beam design.
It is worth noting that the double-layer cantilever beam structure, as depicted in Figure 11a, also exhibits the ability to reduce cross-axis sensitivity. For the sake of comparison, a simulation was carried out on the double-layer cantilever beam structure, with the outcomes presented in Figure 11b. Figure 11b shows that the mechanical sensitivity of the double-layer cantilever beam structure is 44.5 μm/g, roughly half that of the proposed mechanical structure. Equation (2) offers significant insights for analyzing this phenomenon. This is due to the fact that the double-layer cantilever beam structure has twice the number of cantilevers as the proposed mechanical structure, resulting in a decrease in mechanical sensitivity. This also underscores the rationality of the single-layer symmetric cantilever beam design.
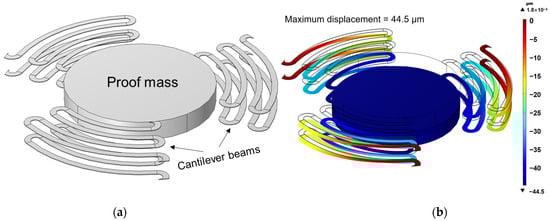
Figure 11.
(a) Schematic diagram and (b) displacement nephogram of the double-layer cantilever beam mechanical structure.
4. Discussion
The optimized mechanical sensitivity can be obtained using the design parameters in Table 2. As an optical sensor, it is also essential to correlate the mechanical performance of the sensor with its optical characteristics. Therefore, the optical sensitivity will be briefly discussed next. Optical sensitivity refers to the magnitude of the optical response of the measurement unit to displacement. Since the optical response is typically measured as optical power, the unit of optical sensitivity is W/nm. For a fiber-optic Fabry–Perot interferometric vibration sensor, the optical sensitivity can be derived by analyzing the response of the output light intensity from the FP cavity to changes in cavity length. This is achieved by taking the derivative of the output light intensity expression in Equation (1) with respect to the cavity length:
It can be observed that the relationship between optical sensitivity and the interferometer cavity length also follows a sinusoidal function. When the cavity length din Equation (5) satisfies , the optical sensitivity attains its maximum value, denoted as :
At this point, the sensor operates at its optimal working point. Equation (6) indicates that the maximum optical sensitivity depends on the input optical power, laser wavelength, and the reflectivity of the reflective surface. Given that the reflectivity of the optical fiber end face is approximately 4%, R is taken as 0.04. The laser wavelength is set to 1550 nm, a commonly used wavelength in optical fiber transmission. Using Equation (1), the curve of the interference light intensity of the fiber-optic FP cavity as a function of the cavity length can be derived, as shown in Figure 12a. Fitting the FP interference curve in Figure 12a also allows the optical sensitivity to be determined, as illustrated in Figure 12b. The slope of the fitted line in Figure 12b is 0.00065, indicating a normalized optical sensitivity of 0.065%/nm. Normalized optical sensitivity serves as an alternative theoretical expression of optical sensitivity, particularly useful when the input laser power is undetermined. Since laser power is typically on the order of milliwatts, assuming an input laser power of 1 mW, a normalized optical sensitivity of 0.065%/nm corresponds to an optical sensitivity of 0.65 μW/nm. Thus, the expression for the normalized maximum optical sensitivity, , can be derived as follows:
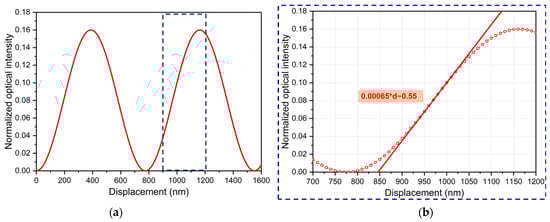
Figure 12.
(a) Fabry–Perot interference curve; (b) Optical sensitivity analysis.
Based on the above analysis, the relationship curves between the optical sensitivity at the optimal operating point and the input optical power/laser wavelength are derived, as shown in Figure 13. Figure 13a demonstrates that the optical sensitivity increases with higher input optical power. In practice, however, the input optical power is generally not set excessively high to minimize system power consumption. Figure 13b reveals that the optical sensitivity decreases as the laser wavelength increases. Typically, the output wavelength range of a single laser is relatively limited, and achieving a significant wavelength shift requires switching to lasers of different models. Therefore, to enhance optical sensitivity, Fabry–Perot interferometric acoustic sensors should be equipped with lasers featuring higher optical power and shorter wavelengths.
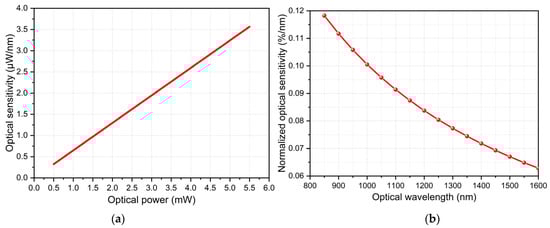
Figure 13.
Relationship curves between optical sensitivity and laser parameters: (a) Optical power; (b) Wavelength.
Based on the derived optical sensitivity of 0.65 μW/nm and the optimized mechanical sensitivity of 89.20 μm/g, the mechano-optical sensitivity of the designed structure is calculated to be 57.98 mW/g. Taking into account the electrical sensitivity of the photodetector circuit (103 v/w), the theoretical overall sensitivity of the sensor reaches 57.98 V/g. The sensitivity of the sensor can be further enhanced by selecting a laser with higher optical power and designing the photodetector circuit with a higher photoelectric conversion rate. Generally, the design of the mechanical sensitivity and optical sensitivity in Fabry–Perot interferometric sensors is independent. An increase or decrease in designed structure in one sensitivity does not affect the other, which represents an advantage of FP interferometric sensors compared to capacitive sensors [26].
5. Conclusions
In conclusion, a fiber FP interferometric vibration sensor with a vertically symmetrical gravity-sensing structure based on the serpentine beam is proposed. Firstly, various performances of the conventional structure are analyzed theoretically. Then, the parameters of the serpentine beam structure are optimized through simulation analysis. Finally, the advantages of the proposed mechanical structure are illustrated by comparing the simulation results with those of other types of structures. The results of the simulation analysis show that the sensitivity of the proposed mechanical structure is 89.20 μm/g, which is higher than the mechanical sensitivity of the conventional structure with the same footprint, and its performance in terms of cross-axis sensitivity is better than that of the vertically asymmetrical structure. In addition, the design results of the two-cantilever serpentine beam, four-cantilever serpentine beam, and double-layer cantilever beam are also analyzed. The intrinsic relationship between optical sensitivity and the cavity length, input optical power, and laser wavelength was further elucidated. A normalized optical sensitivity of 0.065%/nm was derived, and when combined with the optimized mechanical sensitivity, the theoretical sensitivity of the sensor reaches 57.98 V/g, demonstrating potential for further performance enhancement. The proposed fiber FP interferometric vibration sensor features high sensitivity and low cross-axis sensitivity, providing a reference for the development of a high-performance comprehensive safety risk monitoring system for oil and gas pipelines.
Author Contributions
Conceptualization, Y.G.; Methodology, L.X. and Y.G.; Software, B.S. and J.Z.; Resources, Y.J. and S.C.; Data curation, L.X.; Writing—original draft, L.X. and S.C.; Writing—review & editing, L.X. and J.Z.; Visualization, L.X.; Supervision, Y.J. and S.C. All authors have read and agreed to the published version of the manuscript.
Funding
This research was financially supported by the CNPC Project “Research and Application of Quality, Safety, and Environmental Risk Control Technologies for Oil and Gas Fields (2024YQX20102)” and “Evolution Mechanism of Major Risks in Complex Oil and Gas Drilling and Production and Intelligent Safety Operation and Maintenance Methods (2023DJ6508)”.
Data Availability Statement
All data generated or analyzed during this study are included in this published article.
Conflicts of Interest
Authors Linsen Xiong, Shengli Chu, Yifan Gan, Bingcai Sun, Yinghua Jing and Jinming Zhang were employed by CNPC Research Institute of Safety & Environment Technology.
References
- Wu, T.; Chen, Y.; Deng, Z.; Shen, L.; Xie, Z.; Liu, Y.; Zhu, S.; Liu, C.; Li, Y. Oil pipeline leakage monitoring developments in China. J. Pipeline Sci. Eng. 2023, 3, 100129. [Google Scholar] [CrossRef]
- Vogt, E.T.C.; Weckhuysen, B.M. The refinery of the future. Nature 2024, 629, 295–306. [Google Scholar] [CrossRef]
- Korlapati, N.V.S.; Khan, F.; Noor, Q.; Mirza, S.; Vaddiraju, S. Review and analysis of pipeline leak detection methods. J. Pipeline Sci. Eng. 2022, 2, 100074. [Google Scholar] [CrossRef]
- Lu, H.; Iseley, T.; Behbahani, S.; Fu, L. Leakage detection techniques for oil and gas pipelines: State-of-the-art. Tunn. Undergr. Space Technol. 2020, 98, 103249. [Google Scholar] [CrossRef]
- Meribout, M.; Khezzar, L.; Azzi, A.; Ghendour, N. Leak detection systems in oil and gas fields: Present trends and future prospects. Flow Meas. Instrum. 2020, 75, 101772. [Google Scholar] [CrossRef]
- Tang, C.; Du, B.; Jiang, S.; Shao, Q.; Dong, X.; Liu, X.-J.; Zhao, H. A pipeline inspection robot for navigating tubular environments in the sub-centimeter scale. Sci. Robot. 2022, 7, eabm8597. [Google Scholar] [CrossRef] [PubMed]
- Ma, Q.; Tian, G.; Zeng, Y.; Li, R.; Song, H.; Wang, Z.; Gao, B.; Zeng, K. Pipeline In-Line Inspection Method, Instrumentation and Data Management. Sensors 2021, 21, 3862. [Google Scholar] [CrossRef] [PubMed]
- El-Zahab, S.; Mohammed Abdelkader, E.; Zayed, T. An accelerometer-based leak detection system. Mech. Syst. Signal Process. 2018, 108, 276–291. [Google Scholar] [CrossRef]
- Yang, C. Design of Piezoelectric Vibration Sensor for Oil Pipeline Health Monitoring. In Proceedings of the 2022 16th Symposium on Piezoelectricity, Acoustic Waves, and Device Applications (SPAWDA), Nanjing, China, 10–14 October 2022; pp. 125–129. [Google Scholar]
- Middlemiss, R.P.; Samarelli, A.; Paul, D.J.; Hough, J.; Rowan, S.; Hammond, G.D. Measurement of the Earth tides with a MEMS gravimeter. Nature 2016, 531, 614–617. [Google Scholar] [CrossRef]
- Murvay, P.-S.; Silea, I. A survey on gas leak detection and localization techniques. J. Loss Prev. Process Ind. 2012, 25, 966–973. [Google Scholar] [CrossRef]
- Ashry, I.; Mao, Y.; Wang, B.; Hveding, F.; Bukhamsin, A.Y.; Ng, T.K.; Ooi, B.S. A Review of Distributed Fiber-Optic Sensing in the Oil and Gas Industry. J. Light. Technol. 2022, 40, 1407–1431. [Google Scholar] [CrossRef]
- Huang, Y.; Tang, F.; Ma, D.; Liu, Z.; Wang, X. Design, Fabrication, Characterization, and Application of an Ultra-High Temperature 6H-SiC Sapphire Fiber Optic Vibration Sensor. IEEE Photonics J. 2019, 11, 1–12. [Google Scholar] [CrossRef]
- Zhao, M.; Qi, Y.; Wang, H.; Xie, Z.; Li, B.; Wang, H.; Wei, X. Optical Interferometric MEMS Accelerometers. Laser Photonics Rev. 2024, 18, 2300713. [Google Scholar] [CrossRef]
- Lu, Q.; Wang, C.; Bai, J.; Wang, K.; Lian, W.; Lou, S.; Jiao, X.; Yang, G. Subnanometer resolution displacement sensor based on a grating interferometric cavity with intensity compensation and phase modulation. Appl. Opt. 2015, 54, 4188–4196. [Google Scholar] [CrossRef]
- Lu, Q.; Fang, W.; Wang, C.; Bai, J.; Yao, Y.; Chen, J.; Xu, X.; Huang, W. Investigation of a complete squeeze-film damping model for MEMS devices. Microsyst. Nanoeng. 2021, 7, 54. [Google Scholar] [CrossRef]
- Yang, W.; Lin, S.; Gong, W.; Lin, R.; Jiang, C.; Yang, X.; Hu, Y.; Wang, J.; Xiao, X.; Li, K.; et al. Single body-coupled fiber enables chipless textile electronics. Science 2024, 384, 74–81. [Google Scholar] [CrossRef]
- Duan, D.; Yang, J.; Tang, Y.; Xie, Y.-Y. Diamond-Based Fiber-Optic Fabry–Perot Interferometer with Ultrawide Refractive-Index Measurement Range. Photonics 2024, 11, 763. [Google Scholar] [CrossRef]
- Anelli, F.; Venck, S.; Cozic, S.; Prudenzano, F. S-Tapered Fluoride Optical Fiber for Refractive Index Sensing in the Mid-Infrared. J. Light. Technol. 2025, 43, 5982–5988. [Google Scholar] [CrossRef]
- Liu, H.; Jia, P.; Su, C.; Zhao, A.; Liu, J.; Ren, Q.; Xiong, J. High-Temperature Fiber-Optic Fabry–Perot Vibration Sensor Based on Single-Crystal Sapphire. Sensors 2023, 23, 4952. [Google Scholar] [CrossRef] [PubMed]
- Su, C.; Jia, P.; Zhao, A.; Tu, J.; Liu, J.; Ren, Q.; Xiong, J. Temperature-Decoupled Single-Crystal MgO Fiber-Optic Fabry–Perot Vibration Sensor Based on MEMS Technology for Harsh Environments. Micromachines 2024, 15, 616. [Google Scholar] [CrossRef]
- Cao, S.; Bai, J.; Zheng, Y.; Chai, H.; Gao, X.; Xue, C. High-Temperature Fiber-Optic Vibration Sensor Based on an Atomic Frequency Standard. ACS Photonics 2024, 11, 3713–3721. [Google Scholar] [CrossRef]
- Ghildiyal, S.; Balasubramaniam, R.; John, J. Effect of flatness and parallelism errors on fiber optic Fabry Perot Interferometer of low to moderate finesse and its experimental validation. Opt. Fiber Technol. 2020, 60, 102372. [Google Scholar] [CrossRef]
- Wang, Q.; Yu, Q. Polymer diaphragm based sensitive fiber optic Fabry-Perot acoustic sensor. Chin. Opt. Lett. 2010, 8, 266–269. [Google Scholar] [CrossRef]
- Shahosseini, I.; Lefeuvre, E.; Moulin, J.; Martincic, E.; Woytasik, M.; Lemarquand, G. Optimization and Microfabrication of High Performance Silicon-Based MEMS Microspeaker. IEEE Sens. J. 2013, 13, 273–284. [Google Scholar] [CrossRef]
- Hall, N.A.; Bicen, B.; Jeelani, M.K.; Lee, W.; Qureshi, S.; Degertekin, F.L.; Okandan, M. Micromachined microphones with diffraction-based optical displacement detection. J. Acoust. Soc. Am. 2005, 118, 3000–3009. [Google Scholar] [CrossRef]
Disclaimer/Publisher’s Note: The statements, opinions and data contained in all publications are solely those of the individual author(s) and contributor(s) and not of MDPI and/or the editor(s). MDPI and/or the editor(s) disclaim responsibility for any injury to people or property resulting from any ideas, methods, instructions or products referred to in the content. |
© 2025 by the authors. Licensee MDPI, Basel, Switzerland. This article is an open access article distributed under the terms and conditions of the Creative Commons Attribution (CC BY) license (https://creativecommons.org/licenses/by/4.0/).