Abstract
To address the challenge of low separation efficiency for fine light hydrocarbons in tight gas fields, this study establishes a mathematical model correlating the structural parameters of a cyclonic coalescer with coalesced droplet size. The model was constructed using second-order polynomial basis functions through numerical simulation and response surface methodology. An optimized cyclonic coalescer configuration with enhanced fine droplet coalescence capability was subsequently designed. The performance of the optimized and original configurations was comparatively evaluated through numerical simulations and laboratory experiments. Simulation results indicated that with inlet droplet sizes ranging from 0.1 to 10 µm, the optimized configuration achieved a coalescence efficiency of 90.66% for outlet droplets larger than 100 µm. High-speed photographic analysis revealed that 5–10 µm inlet droplets were coalesced to 50–60 µm diameters, while 50–300 µm inlet droplets formed large-scale liquid flows of 300–500 µm. The optimized configuration exhibited significantly improved coalescence efficiency and operational applicability across varying inlet droplet sizes. This research provides practical insights for enhancing the recovery efficiency of fine light hydrocarbons in gas processing operations.
1. Introduction
With the increase in natural gas demand and the continual depletion of conventional oil and gas resources, the efficient development of oil and gas resources has become crucial. The Sulige Tight Gas Field in China has abundant natural gas resources. To promote its development, reduce oil and gas losses, and minimize atmospheric pollution, further research into light hydrocarbon recovery technologies is essential. Light hydrocarbon recovery is pivotal for enhancing natural gas quality, as it lowers the dew point and prevents the condensation of liquid hydrocarbons during transportation, thereby avoiding pipeline blockages. While meeting natural gas delivery specifications, this process increases byproduct yields to achieve improved quality and efficiency. By introducing a primary cooling process into existing technologies to enable hydrocarbon condensation in natural gas streams, the condensed light hydrocarbons can undergo three-phase separation for efficient condensate oil recovery. The improved separation efficiency of three-phase separators plays a critical role in enhancing light hydrocarbon recovery yields. Presently, three-phase separators in light hydrocarbon recovery processes demonstrate suboptimal separation efficiency for fine-diameter hydrocarbons, which limits the enhancement of recovery rates. This operational limitation has prompted extensive optimization research on three-phase separator systems by academic and industrial researchers. For example, Wu [1] developed an automated control system for a three-phase separator by integrating Siemens PLC, WinCC, and MATLAB R2018a. Using a genetic algorithm to optimize the oil–water interface, this system effectively reduced the water content in crude oil. Abdullah [2] pioneered the application of a novel reinforcement learning (DDPG) controller within a CFD framework (OpenFOAM) to optimize a gas turbine-connected three-phase separator. Validated at the Basra refinery, this controller adapted to dynamic inlet conditions, maintained optimal flow, and enhanced separation efficiency by over 36%, while ensuring precise fluid level tracking. He [3] introduced an advanced deep deterministic policy gradient algorithm with adaptive learning rate weighting (ALRW-DDPG) for liquid level control in three-phase separators. Simulation results demonstrated that the proposed ALRW-DDPG algorithm achieved a 15.38% faster convergence rate and significantly smaller control errors compared to conventional PID and DDPG methods. Chilala [4] proposed a stochastic optimization approach for three-phase separator design, which was implemented via Excel VBA. This approach generated optimal designs under uncertain flow parameters, providing a practical tool for topside design teams. Liu [5] developed a Bayesian network-based fault diagnosis model for offshore three-phase separators, achieving 100% accuracy and superior noise resistance compared to deep learning methods. While the overall separation efficiency was significantly enhanced through process optimization, a notable deficiency remained in separating small-diameter light hydrocarbon droplets (typically 0.1–10 µm). To overcome this limitation, it is necessary to introduce high-efficiency coalescers for promoting droplet coalescence.
Scholars have conducted mechanistic studies on the coalescence of fine-diameter liquid-phase droplets and developed high-efficiency coalescers to improve multiphase separation performance. Xing [6] employed particle image velocimetry (PIV) and high-speed videography (HSV) to investigate the migration of discrete oil droplets with varying diameters in rotational flow fields. They established a mathematical correlation between radial migration time and droplet size under centrifugal conditions. The findings provided a theoretical foundation for optimizing flow field characteristics and structural parameters of hydrocyclones and centrifugal separation equipment. Huang [7] developed a novel droplet micromixer and fiber coalescence separator for mercaptan removal. This system reduced caustic loading by 30% and enhanced desulfurization efficiency compared to traditional scrubbers, offering a more economical and environmentally friendly solution. Zhao [8] introduced UnMixFormer, an attention-based architecture that accurately identifies and disentangles up to five overlapping gravitational-wave signals. UnMixFormer achieved 99.89% counting accuracy and superior waveform reconstruction through its dual-path design and integration of Fourier analysis networks. Fan [9] developed a novel cyclone-coalescence separator that integrates centrifugal and coalescence principles, achieving 96% separation efficiency in an industrial high-acid natural gas plant and demonstrating superior performance compared to conventional precision filters. Sun [10] demonstrated that incorporating a grid-shaped drainage layer in gas–liquid coalescence filters reduced pressure drop by 16% and improved separation efficiency by 12%, primarily by optimizing internal liquid flow channels.
Research on the integration of cyclonic-coalescence with three-phase separation to enhance coalescence and separation performance for fine-diameter droplets remains limited. Cyclonic coalescers exhibit distinct advantages, including compact structure, low operational cost, and superior coalescence efficiency [11].
This study designed a hydraulic coalescer to enhance the coalescence of fine-diameter droplets into larger droplets while facilitating the formation of helical liquid streams. Building upon the initial coalescer configuration, a predictive mathematical model correlating structural parameters with coalesced droplet size was established using response surface methodology (RSM). The coalescence efficiency of the optimized structure for fine-diameter oil droplets was systematically validated through numerical simulations and laboratory experiments. The findings may provide critical insights for advancing coalescence separation technologies for light hydrocarbons.
2. Design and Operating Principle
The process flow is illustrated in Figure 1. Incoming natural gas is first processed through a gas–liquid two-phase separator configured within the station for preliminary separation (Figure 1a). The gas subsequently enters a refrigeration unit, where it undergoes heat exchange with a cryogenic medium to complete the primary cooling process. This thermal treatment reduces the natural gas temperature to a cryogenic range of 4–5.5 °C. During this process, the light hydrocarbon components in the natural gas are cooled to undergo phase transition, condensation and separation. These components, along with condensed water, are directed into a three-phase separator. Under the gas-liquid–liquid three-phase separation mechanism, efficient separation of the gaseous phase, condensate oil phase, and aqueous phase is achieved. The separated gaseous phase is returned to the gas gathering station’s processing system, where it is pressurized by compressors and transmitted via pipelines. The aqueous phase is directed into the station’s blowdown system for the water treatment process, as shown in Figure 1b. The condensate oil phase then enters a condensate flash tank, where light components are removed through controlled pressure letdown. Then, it is then transferred to a condensate stabilization tank for storage. Current three-phase separators have demonstrated limitations in capturing light hydrocarbon components. They can only efficiently separate larger-diameter liquid-phase droplets and exhibit reduced capture efficiency for fine-diameter droplets.
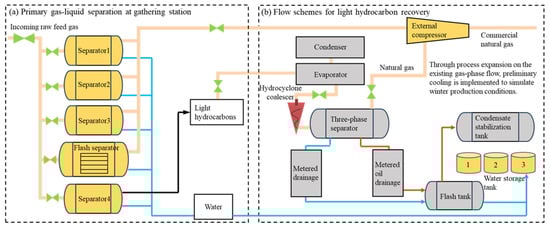
Figure 1.
Process flow diagram.
The structural configuration of the hydraulic coalescer and its operational principle are schematically illustrated in Figure 2. As seen in Figure 2b, the coalescer primarily consists of an inlet, spiral flow channel, inner tubular column, base cone, base conical column section, and outlet. During operation, natural gas and liquid phases are introduced through the inlet into the hydraulic coalescer. As the fluid traverses the spiral channel, its velocity gradually transitions from axial to tangential orientation, ultimately establishing a tangential swirling flow field at the spiral channel. Due to the density differential between the gas–liquid phases, the heavier liquid phase migrates radially outward from the central axis toward the peripheral wall under centrifugal force, and subsequently exhibits swirling motion around the separation column. During this process, dispersed droplets develop tangential, radial, and axial velocity gradients within the cyclonic field due to disparities in droplet size, spatial positioning, and migration trajectories. These velocity differentials induce inter-droplet collisions and coalescence, progressively aggregating fine droplets into larger ones. As shown in Figure 2a, centrifugal acceleration further propels the enlarged droplets toward the outer wall, where smaller droplets with diminished radial velocity undergo subsequent collisions and coalescence events. Ultimately, the coalesced liquid flow converges along the peripheral wall and discharges through the outlet [12].
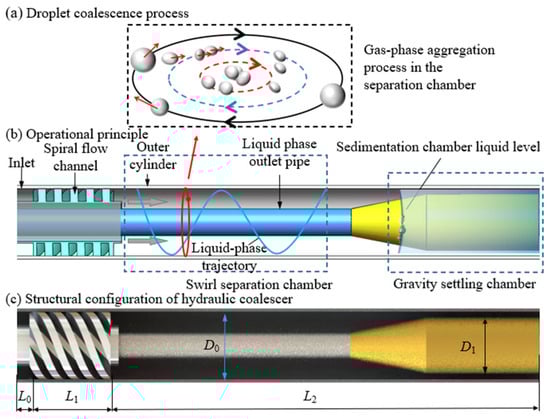
Figure 2.
Structure and working principle of hydraulic coalescer.
3. Methods
3.1. Response Surface Methodology
Response surface methodology (RSM) is an optimization design approach used to construct a mathematical model between multiple dependent and independent variables, and identify the best dependent variable values by optimizing the model [13,14,15,16,17].
Commonly employed RSM designs include Central Composite Design (CCD) and Box–Behnken Design (BBD). Compared to CCD, BBD requires fewer experimental trials, is cost-effective, and ensures that optimized structural parameters remain within prescribed factor ranges, thereby preventing engineering infeasibility. Consequently, BBD was adopted in this study for structural optimization of the coalescence-cyclonic coupled separator. A second-order polynomial model was selected to establish functional relationships between structural factors and response variables. The model’s basis function can be expressed as:
In this equation, Y represents the response factor, which is the average droplet diameter; xi and xj are independent design factors corresponding to the structural parameters being optimized; n indicates the number of design factors, here n = 3; β0 is the regression coefficient of the intercept term; βi, βii, and βij denote the linear coefficients, quadratic coefficients, and interaction coefficients of the regression model, respectively.
3.2. Numerical Simulation Method
3.2.1. Fluid Domain and Mesh Generation
The fluid domain model of the cyclone coalescer was established, which included the inlet cavity, spiral flow channel, throat section and tail pipe section. Subsequently, mesh division was carried out, and a tetrahedral mesh was selected as the mesh type. The mesh division of the fluid domain and the local zoomed-in diagram are shown in Figure 3. Since the number of meshes affects the cycle time and accuracy of simulation computation, a mesh-independent validation was performed before the systematic structural optimization, to shorten the cycle time while guaranteeing the accuracy of computation. The mesh independence verification was conducted across five distinct grid refinement levels, with the mesh numbers as follows: Level-1 = 625,402, Level-2 = 815,231, Level-3 = 1,052,155, Level-4 = 1,262,442, and Level-5 = 1,443,561. Numerical simulations with the same initial conditions were conducted across models with varying mesh densities. The tangential velocity at a designated cross-sectional line of the separator was used as the evaluation metric to determine the critical number of mesh threshold. The results of the grid independence test are shown in Figure 4. When the number of grids increased to 1,052,155, there was no significant change in the tangential velocity at the separator’s cross-section. It was finally determined that the number of all model meshes in the subsequent processing was approximately 1,052,155.
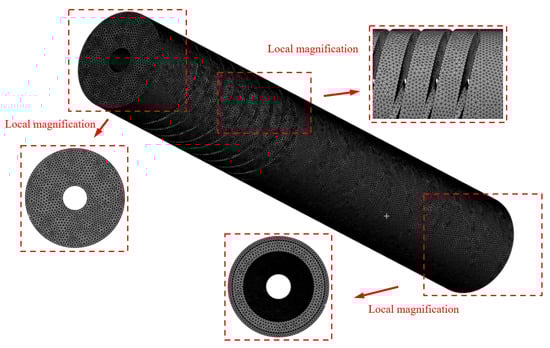
Figure 3.
Mesh division and local magnification of the fluid domain of the hydraulic coalescer.
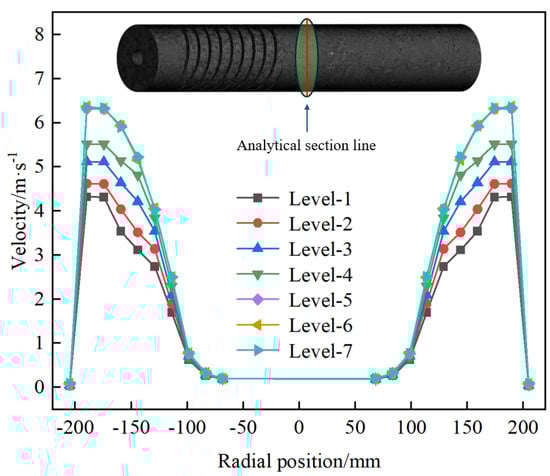
Figure 4.
Grid independence test in the fluid domain of the hydraulic coalescer.
3.2.2. Numerical Model and Boundaries
The numerical simulation of oil-water-gas three-phase flow within the hydraulic coalescer was performed using the Eulerian multiphase model, which is applicable for gas–liquid separation under high gas–liquid ratios. The mixed-phase inlet was defined as a velocity inlet with a specified speed of 14.34 m/s, while the outlet was configured as an outflow boundary. The gas phase was set as the continuous phase, with water and oil phases modeled as discrete phases. The oil droplets were assigned a polydisperse size distribution ranging from 0.1 to 10 µm. A pressure-based double-precision solver with implicit formulation was employed for steady-state calculations, utilizing the RNG k-ε turbulence model with swirl modification. The RNG k-ε model modifies the turbulent viscosity and specifically accounts for the effects of rotational and swirling flows. It is more suitable for strong swirling flow scenarios than the standard k-ε model. The coupled algorithm was adopted for pressure-velocity coupling, while momentum, turbulent kinetic energy, and dissipation rate equations were discretized using second-order upwind schemes. Convergence criteria were set to a residual tolerance of 10−6, with no-slip impermeable wall boundaries applied throughout the computational domain.
3.3. Experimental Methodology and Procedures
In order to verify the efficient separation performance of the optimized hydraulic coalescer, the optimal structure of the hydraulic coalescer was prototype processed based on the numerical simulation results. An indoor experimental test process platform was constructed to carry out the indoor separation performance test.
The experimental process flow is depicted in Figure 5. During testing, the gas phase was supplied via an air compressor to a gas storage tank. The gas flow rates were regulated by adjusting inlet valves and monitoring gas flowmeter readings. The liquid phase was pressurized by a micro-injection pump from a water storage tank into the process pipeline, ultimately entering a high-precision atomizing nozzle. By varying the orifice diameter of the atomizing nozzle, droplets with controlled size distributions were generated for experimental characterization. The gas–liquid two-phase mixture entered a static mixer for homogenization before being introduced into the hydraulic coalescer. Within the cyclonic chamber, small droplets collided and coalesced into larger droplets, which were subsequently propelled toward the outer wall by centrifugal forces. These coalesced droplets converged into continuous liquid streams along the peripheral wall and were ultimately discharged through the circumferential underflow outlet. The cyclone-coalescing area was photographed using high-speed cameras, and the coalescing performance of the hydraulic coalescer under different operating parameters was analyzed. The gas phase and liquid phase from the underflow both flowed into the recovery tank through the process pipeline, to facilitate the recovery and utilization of the experimental medium. During the experimental testing process, all data were obtained by taking the average of three measurements to reduce the experimental error.
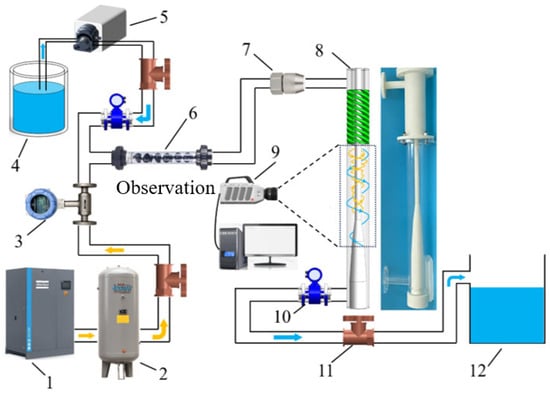
Figure 5.
Test process flow chart. 1—Air compressor; 2—Air holder; 3—Gas flowmeter; 4—Water storage tank; 5—Peristaltic pump; 6—Static mixer; 7—High precision atomizing nozzle; 8—Hydraulic coalescer; 9—High speed camera; 10—Liquid flowmeter; 11—Valve; 12—Recovery tank.
3.4. Comparison of Experimental and Simulation Results
A comparison of the outlet droplet size distribution between experimental and simulation results under identical operating conditions is shown in Figure 6. The inlet droplet size distribution consisted of 92% 5 µm droplets, 5.5% 20 µm droplets, 1% 100 µm droplets, and 0.5% 500 µm droplets. The experimental results showed that after coalescence, the outlet droplet size distribution was as follows: 5 µm droplets accounted for 1.36%, 20 µm droplets for 5.53%, 100 µm droplets for 7.25%, and 500 µm droplets for 85.86%. Furthermore, the simulation results indicated that after coalescence, the outlet droplet size distribution was as follows: 5 µm droplets accounted for 0.28%, 20 µm droplets for 5.06%, 100 µm droplets for 6.05%, and 500 µm droplets for 88.61%. The experimental test results were in good agreement with the simulation results.
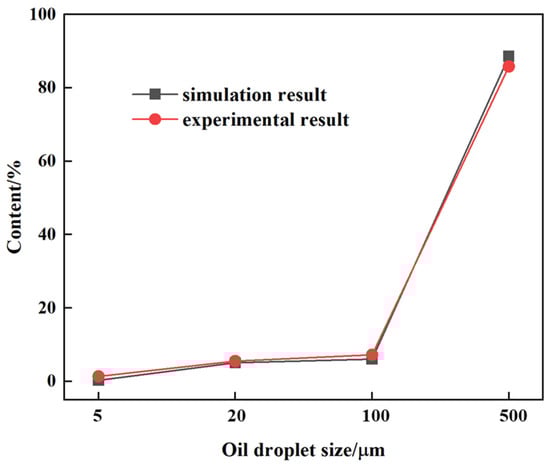
Figure 6.
Comparison of outlet droplet size distribution for experimental and simulation results.
4. Results and Discussion
4.1. Box–Behnken Experimental Design
Tangential velocity serves as a critical indicator for evaluating the intensity of cyclonic flow fields, which is mainly influenced by the spiral flow channel. Coalescence and separation of oil droplets predominantly occur within the cyclonic chamber, and its length directly governs the average droplet size distribution. Furthermore, the outer diameter of the base column significantly influences the separator’s processing capacity by controlling the migration and discharge of large-diameter droplets toward the underflow outlet. Consequently, three structural parameters—spiral flow channel length, cyclonic chamber length, and base column outer diameter—were selected for systematic optimization. A BBD response surface methodology was implemented, treating these structural parameters as independent variables and average droplet size as the response variable. The coded levels of these structural factors are detailed in Table 1.

Table 1.
Levels of response surface test factors.
4.2. Results of Surface Optimization Response
Based on the three horizontal values of the three factors shown in Table 1, a total of 17 experimental groups were formed, among which 5 were repeated center point experimental groups.
Based on the 17 groups of factors values and the average size of oil droplets shown in Table 2, a quadratic model was adopted for quadratic multiple fitting. Regression equations between spiral flow channel length L1(x1), cyclone cavity length L2(x2), outer diameter of the bottom column D1(x3) and average size of oil droplets (d) were obtained. The regression equation is shown as Equation (2).
Table 2.
Numerical simulation results of BBD test design.
Partial differentiation was applied to the constructed mathematical model relating structural parameters to average droplet diameter using the least squares method. This enables identification of an optimal parameter configuration that maximizes the average droplet diameter, representing the optimization outcome of the RSM. The calculated optimal structural parameters were as follows: spiral flow channel length L1 = 654.34 mm, cyclonic chamber length L2 = 750 mm, and base column outer diameter D1 = 280 mm. The structural parameter differences between the original and optimized cyclonic coalescer configurations are illustrated in Figure 7. The extension of the spiral flow channel increases the droplet collision duration within the cyclonic field. The optimized length of the cyclone chamber ensures adequate coalescence space while maintaining structural compactness. The enlarged outer diameter of the base column reduces the outlet flow area, which decreases the axial velocity near the wall and extends the residence time of coalesced droplets, thereby facilitating their efficient discharge.
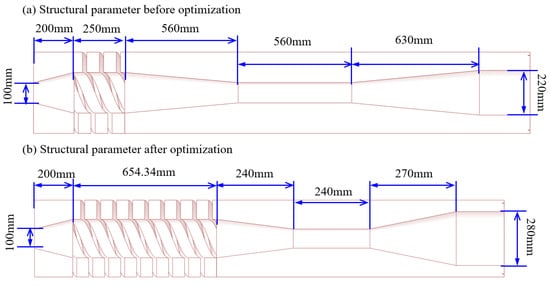
Figure 7.
Comparison of structural parameters before and after optimization.
4.3. Analysis of Variance of the Regression Model
Analysis of Variance (ANOVA) was performed to assess the significance of the mathematical model relating three structural parameters to a single response variable in the response surface framework. The ANOVA results are presented in Table 3. The F-value serves as the test statistic to determine whether each term is significantly associated with the response target, while the p-value represents the probability that observed variations arise from sampling error [18,19,20]. As shown in Table 3, the mathematical model yielded an F-value of 16.61 with a p-value of 0.0006 (<0.05). This indicates that the regression equation correlating the average droplet diameter with the spiral flow channel length, cyclonic chamber length, and base column outer diameter is statistically significant. When these structural parameters vary within their defined operational ranges, the constructed second-order polynomial model predicts the average droplet diameter of the cyclonic coalescer with high accuracy.
Table 3.
Results of variance analysis of regression equation.
4.4. Residual Analysis of the Regression Model
To validate the predictive accuracy of the regression equation, an error analysis was performed on the fitted model. The statistical error evaluation results are presented in Table 4. The correlation coefficient R2 = 0.9553 for the response target d approaches 1, demonstrating excellent correlation. The coefficient of variation (CV) of 3.78% (<10%) indicates low overall variability in the regression equation, confirming high reliability and precision in the experimental results. The signal-to-noise ratio, quantified as Adequate Precision, represents the ratio of effective signal to noise. With a value of 11.3613 > 4, this metric validates the model’s robustness and rationality. Collectively, these analyses demonstrate that the regression equation model—constructed via BBD to correlate structural parameters with average droplet diameter—exhibits strong applicability and predictive accuracy. Consequently, the formulated regression equation can be used to reliably predict the average droplet diameter of the hydraulic coalescer under defined operational conditions.
Table 4.
Statistical analysis of regression equation error.
4.5. Experimental Validation of the Optimization Results
In order to experimentally observe the coalescence characteristics of small-sized droplets inside the hydraulic coalescer, the cyclone was processed into transparent organic glass, and the coalescence of tiny droplets on the side wall was observed through a high-speed camera system. The coalescence effect of the hydraulic coalescer for small-sized inlet droplets is illustrated in Figure 8 and Figure 9. When the size of the inlet droplet was 5 µm, the small droplets in the liquid phase collided and coalesced in the rotating flow field of the gas phase, after being carried through the spiral flow channel by the gas phase. As seen from Figure 8a, after passing through the spiral flow channel, the small droplets coalesced into large droplets and liquid flow was thrown to the side wall of the gas–liquid cyclone separation chamber under the action of centrifugal force. After coalescence, most of the 5 µm droplets collided and coalesced into large droplets of different sizes. Most of the liquid droplets with a size of 5 µm coalesced into large liquid droplets with a size of 50 µm.
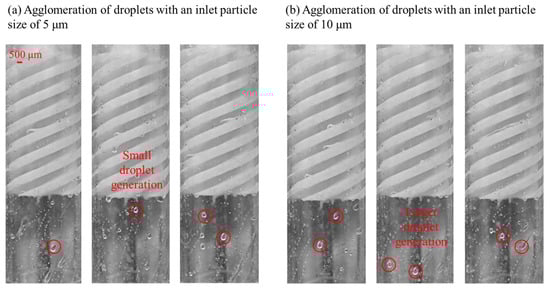
Figure 8.
Coalescence characteristics of small-sized droplets. Agglomeration of droplets with an inlet droplet size of 5 µm; Agglomeration of droplets with an inlet droplet size of 10 µm.
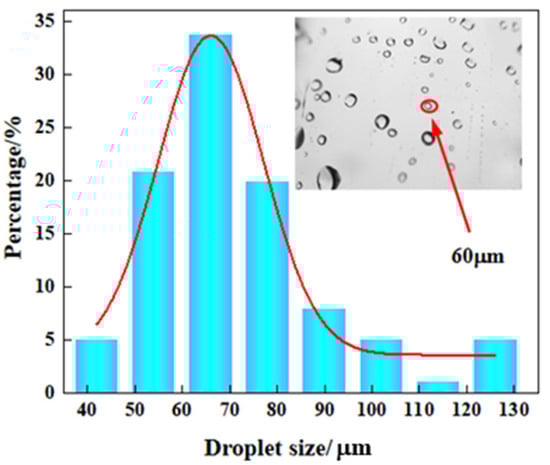
Figure 9.
Droplet size distribution of small droplets after coalescence.
As seen from the high-speed imaging system results in Figure 8b, when the inlet droplet size was 10 µm, the majority of the droplets underwent collision-induced coalescence within the spiral flow channel, forming larger droplets of varying sizes. Notably, a significant proportion of the 10 µm droplets coalesced into larger droplets with diameters of approximately 60 µm; this size range enables highly efficient separation in three-phase separators. Additionally, some coalesced droplets exhibited diameters of approximately 100 µm.
The above analysis indicates that the experimental test results are in excellent agreement with the simulation results for small-sized liquid droplets. After passing through the hydraulic-coalescing gas–liquid separator, small-sized liquid droplets form large droplets in the coalescing cyclone chamber and are eventually discharged from the outlet.
The coalescence performance of the hydraulic-coalescence gas–liquid separator when processing larger inlet droplets is illustrated in Figure 10 and Figure 11. As shown in Figure 10a, nearly all 50 µm droplets coalesced into larger aggregates, with the majority reaching approximately 100 µm in diameter. Furthermore, a significant proportion of coalesced droplets reached diameters of around 500 µm, demonstrating exceptional agglomeration capability. When the inlet droplet size was 300 µm, after coalescence within the spiral flow channel, a portion of the 300 µm droplets coalesced into larger aggregates with diameters of approximately 500 µm (Figure 10b). Moreover, a significant proportion of these coalesced droplets further aggregated into extensive liquid films, indicating highly efficient phase separation performance under such operational conditions. It was observed that large-sized liquid phase droplets formed continuous liquid streams within the cyclonic coalescence chamber of the cyclonic-coalescence gas–liquid separator, ultimately discharging through the outlet. Compared to small-sized droplets, the separator exhibited superior coalescence and flow-directing performance for large-sized droplets.
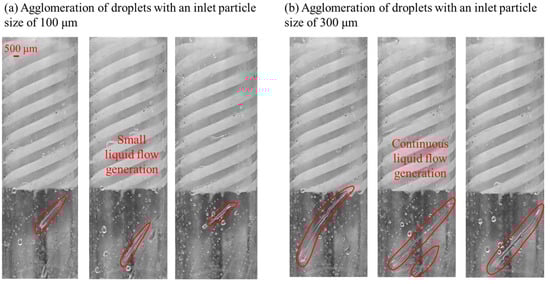
Figure 10.
Coalescence characteristics of large-sized droplets. Agglomeration of droplets with an inlet droplet size of 100 µm; Agglomeration of droplets with an inlet droplet size of 300 µm.
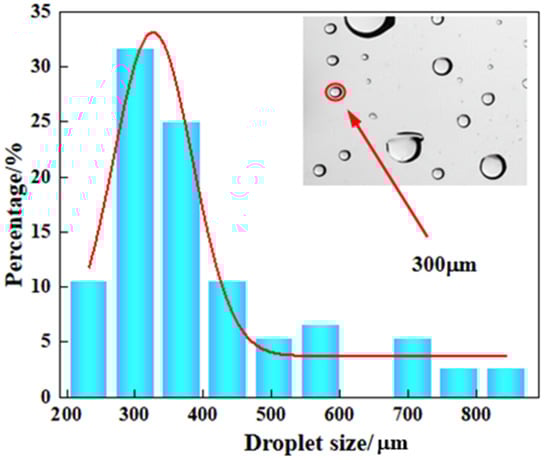
Figure 11.
Droplet size distribution of large droplets after coalescence.
4.6. Numerical Validation of the Optimization Results
To further validate the enhanced efficiency of the optimized cyclonic coalescer, a numerical simulation study was conducted to comparatively evaluate the performance of both the original and optimized configurations under varying liquid phase volume fractions and droplet size distributions. The results are illustrated in Figure 12. The liquid phase distribution (Figure 12a) revealed that the optimized structure exhibited a larger flow distribution area compared to the initial design. This enhancement is attributed to the extended spiral flow channel, which generates intensified centrifugal forces, thereby improving the radial migration capability of oil droplets and amplifying their collision and coalescence efficiency. Analysis of the oil droplet size distribution in Figure 12b revealed that the optimized configuration achieved larger droplet diameters compared to the initial design. The extended spiral flow channel prolongs the cyclonic collision duration, while the enlarged base column outer diameter reduces the flow-through area at the outlet. These synergistic modifications effectively increase droplet collision frequency and enhance coalescence efficiency.
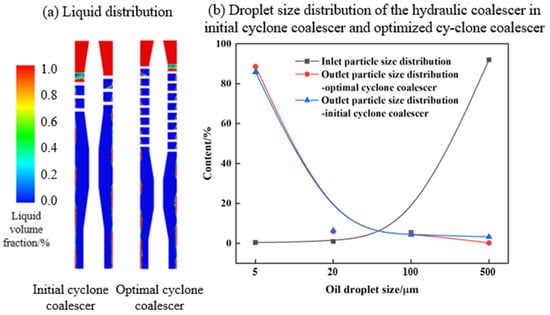
Figure 12.
Liquid distribution and droplet size distribution before and after optimization of structural parameters.
As seen from Figure 12b, the content of 5 µm small droplets at the inlet was 92%. After coalescence, the content of 5 µm droplets decreased to 3.28%, and the content of droplets larger than 500 µm at the outlet reached 85.81%. The coalescence effect of small droplets was relatively good. The central cylindrical portion of the cloud diagram represents the base conical column section. After optimized coalescence, the content of 5 µm droplets at the outlet was significantly reduced to 0.28%, and the content of droplets larger than 500 µm at the outlet reached 88.63%. The coalescence effect of small droplets was greatly improved compared to the initial structure.
As a critical metric for evaluating coalescence performance, the coalescence efficiency of the cyclonic coalescer was analyzed based on the liquid phase content distribution for outlet droplets of 100 µm. The coalescing efficiency is defined here as the percentage of the total mass flow rate of droplets with a diameter greater than 100 µm at the outlet to the total mass flow rate of droplets of all sizes at the inlet. As shown in Figure 13, significant differences in coalescence efficiency were observed across different configurations. Coalescence efficiency is predominantly governed by the magnitude of tangential velocity, flow field stability, and droplet size distribution. The optimization process markedly enhanced coalescence efficiency, from 85.05% for the initial model to 90.66% for the optimized configuration.
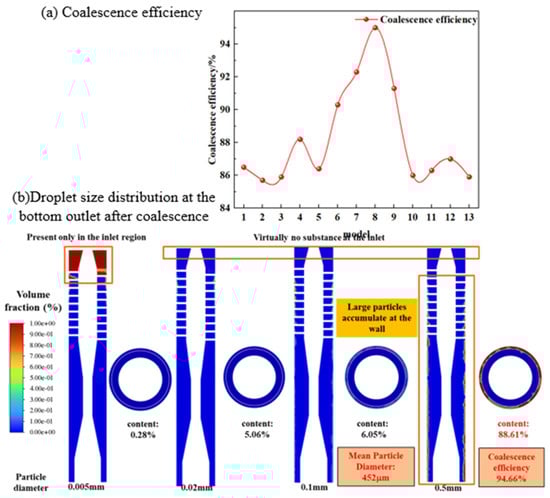
Figure 13.
Coalescence performance of the hydraulic coalescer with different structural parameters.
5. Conclusions
Based on BBD response surface design, numerical simulation and experimental verification, a hydraulic coalescer with optimal structural parameters for small droplet coalescence was developed in this work. The following conclusions are drawn:
- (1)
- Response surface methodology was adopted to optimize the structural parameters with higher significance, and a mathematical model relating structural parameters and coalescence efficiency was established. The optimal structural parameters of the hydraulic coalescer were obtained as follows: spiral flow channel length of 654.34 mm, cyclone cavity length of 750 mm, and bottom column outer diameter of 280 mm.
- (2)
- Numerical simulation comparison studies showed that the liquid phase flow area and droplet coalescence size of the optimized structure were both larger than those of the initial structure. When the inlet droplet size range was 5–10 µm, after coalescing in the initial structure, the content of 5 µm small droplets was reduced to 3.28%. The content of droplets larger than 500 µm at the outlet reached 85.81%. After structural coalescence through optimization, the content of 5 µm droplets at the outlet significantly decreased to 0.28%, and the content of droplets larger than 500 µm at the outlet reached 88.61%. The coalescence effect of small droplets was greatly improved compared with the initial structure.
- (3)
- The coalescence performance of small-sized droplets passing through the optimally structured cyclone coalescer was analyzed using a high-speed camera system. When the size of the inlet droplet was 5 µm, most of the droplets coalesced into large droplets with a size of 50 µm. When the droplet size at the inlet was 10 µm, most of the droplets coalesced into large-sized droplets with a size of 60 µm. The experimental test results were in good agreement with the simulation results. Small-sized liquid droplets formed large-sized liquid droplets in the coalescer cyclone cavity and were eventually discharged from the outlet.
- (4)
- When the size of the inlet droplet was 300 µm, some of the droplets collided and coalesced into large droplets with a size of 500 µm. Most of the large droplets formed a large surface liquid accumulation flow.
Supplementary Materials
The following supporting information can be downloaded at: https://www.mdpi.com/article/10.3390/pr13123884/s1.
Author Contributions
J.L.: Conceptualization, Methodology, Investigation, Data curation, Writing original draft, Writing review and editing. L.X.: Methodology, Writing review and editing, Funding acquisition. All authors have read and agreed to the published version of the manuscript.
Funding
The authors greatly acknowledge the financial support from the Regional Innovation and Development Joint Fund of National Natural Science Foundation of China (Grant No. U21A20104), the Projects of National Natural Science Foundation of China (Grant No. 52304064), China Postdoctoral Science Foundation (Grant No. 2023M730481), the CNPC Innovation Fund (Grant No. 2024DQ02-0102), and Heilongjiang Postdoctoral Fund (Grant No. LBH-Z23039).
Data Availability Statement
The original contributions presented in this study are included in the article/Supplementary Material. Further inquiries can be directed to the corresponding author.
Conflicts of Interest
Author Jianli Li was employed by the National Petroleum Corporation Greatwall Drilling Company. The remaining authors declare that the research was conducted in the absence of any commercial or financial relationships that could be construed as a potential conflict of interest.
References
- Wu, F.; Huang, K.; Li, H.T.; Huang, C. Analysis and research on the automatic control systems of oil–water baffles in horizontal three-phase separators. Processes 2022, 10, 1102. [Google Scholar] [CrossRef]
- Abdullah, A.Z.K.; Ranjbar, F.; Zare, V.; Homod, R.Z. Unlocking optimal performance and flow level control of three-phase separator based on reinforcement learning: A case study in Basra refinery. Therm. Sci. Eng. Prog. 2024, 55, 102885. [Google Scholar] [CrossRef]
- He, X.Y.; Pang, H.; Liu, B.Y.; Chen, Y.Q. Application of the ALRW-DDPG algorithm in offshore oil-gas-water separation control. Energies 2024, 17, 4623. [Google Scholar] [CrossRef]
- Chilala, A.J.; Stanko, M.; Mkinga, O.J. Effects of uncertainty in the design parameters during the design of horizontal gravity oil, gas and water separators. J. Pet. Explor. Prod. Technol. 2025, 15, 27. [Google Scholar] [CrossRef]
- Liu, D.Q.; Song, S.F.; Huang, T.; Shen, S.H.; Li, X.P.; Gong, J. Application of Bayesian networks based on Sequential Monte Carlo simulation and physical model in fault diagnosis of horizontal three-phase separator system. Ocean Eng. 2024, 306, 118139. [Google Scholar] [CrossRef]
- Xing, L.; Guan, S.; Gao, Y.; Jiang, M.H. Measurement of a three-dimensional rotating flow field and analysis of the internal oil droplet migration. Energies 2023, 16, 5094. [Google Scholar] [CrossRef]
- Huang, Y.H.; Zhu, H.T.; Wu, H.P.; Zhang, L.T.; Lu, H.; Yang, Q. Combined micromixing and coalescence separation for improved oil desulfurization. Chin. J. Chem. Eng. 2025, 83, 191–198. [Google Scholar] [CrossRef]
- Zhao, T.Y.; Zhou, Y.; Shi, R.J.; Xu, P.; Cao, Z.J.; Ren, Z.X. Compact binary coalescence gravitational wave signal counting and separation. Phys. Rev. D 2025, 111, 104028. [Google Scholar] [CrossRef]
- Fan, J.A.; Zhang, X.G.; Jiang, X.; Yang, Z.H.; Xie, L.L.; Wang, L.W.; Ma, L.; Wang, H.L.; Chang, Y.L. Cyclone-coalescence separation technology for enhanced droplet removal in natural gas purification process. Chin. J. Chem. Eng. 2024, 75, 191–203. [Google Scholar] [CrossRef]
- Sun, Z.Q.; Wang, T.W.; Li, Y.J.; Wang, C.L.; Zou, J.H.; Wang, Y.K.; Li, Y.; Wang, Z.B. Effect and mechanism of drainage measures on gas-liquid coalescence separation performance of a water mist filter. Chem. Eng. Process.—Process Intensif. 2025, 216, 110424. [Google Scholar] [CrossRef]
- Ryul, P.H.; Woonbong, H.; Dukhyun, C. Recent advances on oil-water separation technology. Compos. Res. 2023, 36, 69–79. [Google Scholar] [CrossRef]
- Phonphimai, P.; Ketnawa, S.; Singh, J.; Tian, J.; Ogawa, Y.; Donlao, N. Sustainable protein recovery from Sacha inchi press cake using cyclone separation: Functional and structural characterization. Future Foods 2025, 12, 100845. [Google Scholar] [CrossRef]
- Arpit, P.; Nikhil, K.S.; Arup, K.D. Wettability-driven coalescence behavior of compound droplets over a horizontal surface. Chem. Eng. Sci. 2025, 309, 121468. [Google Scholar] [CrossRef]
- Chaudhary, M.B.; Rao, K.J.; Bihola, A.; Adil, S. Standardization and characterization of Mohanthal using response surface methodology. Sci. Rep. 2025, 15, 17432. [Google Scholar] [CrossRef] [PubMed]
- Aditya, V.; Ajeet, S.Y.; Navid, K.; Nam-Trung, N. Acoustically driven vertical coalescence of liquid marbles. Colloids Surf. A Physicochem. Eng. Asp. 2025, 711, 136410. [Google Scholar] [CrossRef]
- Gürdaş, M.S.; Dilanb, L. Investigation of the rheological properties of persimmon puree by using response surface methodology. Qual. Assur. Saf. Crops Foods 2025, 17, 57–74. [Google Scholar] [CrossRef]
- Kim, J.; Kim, D.; Ryu, K.H. Piecewise response surface methodology for enhanced modeling and optimization of complex systems. Korean J. Chem. Eng. 2025, 42, 537–545. [Google Scholar] [CrossRef]
- Zhang, L.; Lu, A.J.; Ma, L.K.; Bai, Z.S. Experimental research on enhanced the microfine oil droplets separation using hydrocyclone coupled with fiber coalescence. Chin. J. Chem. Eng. 2025, 82, 15–24. [Google Scholar] [CrossRef]
- Markus, R.; Josef, G.S. Variance estimation in the change analysis of a linear regression model. Metrika 2001, 54, 139–157. [Google Scholar] [CrossRef]
- Dominique, L. On the different coalescence mechanisms in foams and in emulsions. Adv. Colloid Interface Sci. 2025, 340, 103448. [Google Scholar] [CrossRef] [PubMed]


Disclaimer/Publisher’s Note: The statements, opinions and data contained in all publications are solely those of the individual author(s) and contributor(s) and not of MDPI and/or the editor(s). MDPI and/or the editor(s) disclaim responsibility for any injury to people or property resulting from any ideas, methods, instructions or products referred to in the content. |
© 2025 by the authors. Licensee MDPI, Basel, Switzerland. This article is an open access article distributed under the terms and conditions of the Creative Commons Attribution (CC BY) license (https://creativecommons.org/licenses/by/4.0/).