Abstract
Electric aircraft powered by lithium batteries (LIBs) have seen rapid development in recent years, making research into their thermal runaway (TR) characteristics crucial for ensuring flight safety. This study focused on the individual battery cells of a specific electric aircraft power battery system, conducting TR experiments under both the aircraft’s service ceiling temperature (−8.5 ± 2 °C) and ground ambient temperature (30 ± 2 °C). The experiments analyzed changes in battery temperature, voltage, and mass during TR. Experimental results indicate that the peak TR temperatures reached 589.6 °C and 654 °C under the two environments, respectively, with maximum heating rates of 8.6 °C/s and 16.9 °C/s. At ambient ground temperatures, battery voltage drops more rapidly, with the voltage of a 100% SOC battery decreasing over just 10 s. Peak mass loss during TR reached 265.48 g and 247.52 g, respectively. Combining TR temperature data with the Semenov thermal runaway model, the minimum ambient temperature causing TR in this electric aircraft power battery under sustained external heating was determined to be approximately 39 °C. Finally, a multi-level protection strategy covering the “airframe–battery compartment–cabin” was established. The findings from this research can serve as a reference for subsequent safety design of this aircraft type and the formulation of relevant airworthiness standards.
1. Introduction
In the 21st century, the aviation industry continues to develop, accounting for 2.5% of global CO2 emissions, and if effective measures are not taken in time, carbon dioxide emissions are expected to increase by 2 to 3 times by 2050 [1]. To achieve a low-carbon transition in the aviation industry, developing electric propulsion technology has become a key direction [2]. At the 2019 Paris Air Show, the chief technology officers of seven major aerospace manufacturers, including Airbus and Boeing, jointly issued a statement establishing electric propulsion technology as the key driver for the future development of the aviation industry. They explicitly committed to collectively increasing investment in electric aircraft technology research and development [3]. The advancement of electric propulsion systems relies on efficient energy storage devices. LIBs, with their high energy density, extended cycle life, and zero emissions during operation, have become a primary focus of research for electric aircraft [4].
Currently, fixed-wing electric aircraft powered by LIBs have entered the commercial market, such as the AG60E and Ruixiang RX1E-A models. In the civil aviation sector, aircraft must obtain airworthiness certification to enter commercial operation. The primary standards include the “DO-311A” standard proposed by the U.S. Radio Technical Commission for Aeronautics (RTCA), the SCE-19 issued by the European Union Aviation Safety Agency (EASA), and the Civil Aviation Administration of China (CAAC)’s “CTSO-C179B Rechargeable Lithium Batteries and Battery Systems” (which references DO-311A). However, as an emerging power system option, lithium batteries undergo rapid technological iteration, causing existing standards to lag behind. Specifically, while DO-311A establishes Minimum Operational Performance Standards (MOPS) for permanently installed onboard rechargeable lithium battery systems [5], its earlier development raises questions about its adequacy for current electric aircraft requirements. EASA explicitly states in its standard that “the specific requirements for battery systems needed in electric and hybrid aircraft have not been considered [6].” Similarly, the CAAC standard clearly states, “This standard does not apply to rechargeable lithium batteries, battery packs, and battery systems intended to supply power to aircraft electric propulsion systems [7].” This means that when certifying new electric aircraft, authorities can only reference these incomplete standards and requirements from other relevant industries, such as electric vehicles. This situation poses significant risks to the flight safety of electric aircraft. Given the higher energy density of aircraft power batteries, TR occurring in flight would be catastrophic. Therefore, in-depth research into the TR mechanisms and safety characteristics of aircraft power batteries is of paramount importance for ensuring the safety of new energy aviation. This research is crucial not only for advancing airworthiness certification standards but also for enhancing aircraft safety design and establishing flight safety protection strategies.
In the field of LIB thermal safety research, numerous scholars have explored the factors influencing TR. Studies indicate that external heat sources, temperature conditions, and the internal state of the battery collectively determine the triggering and progression of TR. Zhou [8] conducted TR experiments on prismatic LiFePO4 batteries, revealing that heat accumulation within the battery prior to runaway cannot be overlooked in triggering the process. Liu [9] further discovered through multi-factor external heating tests that high state of charge, elevated ambient temperature, and low battery health status increase the risk of TR in LIBs. With the rise of electric aviation technology, its unique operating environment imposes heightened demands on onboard battery safety. Jiang et al. [10] combined experiments and simulations to study 26,650 NiCoMn LIBs under low-pressure and low-temperature conditions, investigating the relationship between TR performance and single-cell/coupled environmental factors, providing new insights for aviation LIB operation and safety. Yang et al. [11] summarized research progress in TR prevention and control, proposing a future development direction combining passive flame retardants with phase change materials. Harrison [12] constructed a multiphysics simulation model to predict thermal characteristics of eVTOL aircraft battery packs, analyzing the impact of different thermal management strategies on eVTOL battery pack design. Sun et al. [13] investigated TR characteristics of batteries with different packaging forms under low ambient pressure. Compared to cylindrical batteries, pouch batteries exhibit higher thermal hazard and shorter flammable toxic gas emission times. Yang et al. [14] analyzed battery TR performance under two trigger modes, calculating post-runaway temperature changes, voltage variations, and mass loss. These findings aid in optimizing battery compartment safety design.
Although researchers have conducted extensive studies on the TR characteristics of LIBs, existing research primarily focuses on common commercial LIBs with energy densities between 250–300 Wh/kg. However, certain electric aircraft models utilize high-density batteries exceeding 300 Wh/kg. Research on the TR characteristics and specialized safety protection strategies for such high-capacity aviation power batteries remains insufficient. Conducting thermal safety research on specific battery models provides more valuable reference for the optimized design and airworthiness certification of corresponding electric aircraft.
This study aims to conduct a systematic investigation into the thermal runaway characteristics of the power battery for a specific model of electric aircraft. This will be achieved through a combined approach of experiments, modeling, and strategy analysis, following the technical approach outlined in Figure 1. The structure of this study is organized as follows: Section 3 simulates the service ceiling temperature (−8.5 ± 2 °C) and ground temperature (30 ± 2 °C) conditions for a specific model of electric aircraft. It analyzes the entire TR process, including battery surface/exhaust temperatures, voltage, and mass loss data, to provide reference for the safe design of this electric aircraft model. Section 4 introduces the Semenov model to calculate the critical ambient temperature causing TR, providing a theoretical basis for setting thermal safety thresholds in the aircraft’s battery management system. Section 5 further draws on safety concepts from marine lithium batteries to establish a multi-level protection strategy, offering new insights for subsequent electric aircraft power system design and airworthiness certification. Finally, Section 6 summarizes the research findings. Through this research framework, the study aims to provide reference for the safety design and airworthiness certification of this electric aircraft model.
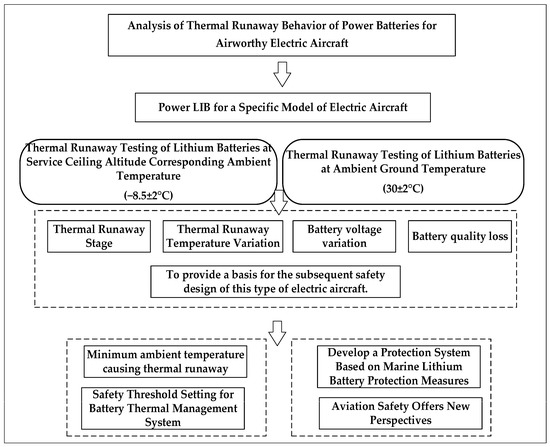
Figure 1.
Technology Roadmap.
2. Materials and Experimental Methods
2.1. Electric Aircraft Basic Information
The electric aircraft model under study in this research is a fixed-wing, four-seat light aircraft, with its publicly available specifications summarized in Table 1. This aircraft utilizes a high-energy-density lithium-ion battery pack as its sole power source, driving electric motors to provide thrust.

Table 1.
Electric Aircraft Public Information.
2.2. Battery Sample
The specific basic information of a certain type of electric aircraft single power lithium battery used in this experiment is shown in Table 2.
Table 2.
Lithium Battery Basic Information.
2.3. Construction of the Test Bench
To prevent explosions caused by gas accumulation resulting from TR, the experiment was conducted in an open environment. Jin et al. [15] argued that the method of external heating is considered the best reproducible experimental method in TR experiments. This heating method is also in line with the layout of aircraft power batteries that are closely arranged. Therefore, this study conducted external heating experiments on electric aircraft power batteries in an open environment.
The experimental platform is built in accordance with the existing literature and relevant airworthiness certification standards [16]. As shown in Figure 2, it consists of a heating plate, an electronic balance, K-type thermocouples, a temperature data collector, a voltage measurement module, a video camera and a computer. A total of 7 thermocouples were set up in the experiment. The thermocouples are Type K thin-film thermocouples with an accuracy of 0.1 °C. TC1, TC2 and TC3 were located at the top, center and bottom of the lithium battery to record the surface temperature of the battery, and TC4 and TC5 were located 5 cm and 15 cm above the lithium battery to record the flame temperature. In view of the fact that the lithium battery is not equipped with a safety valve and a pressure relief port, the gas will be sprayed out through the packaging edges on both sides of the battery in the event of TR, so thermocouples TC6 and TC7 are symmetrically set on both sides of the anodic and cathodic electrodes of the battery to record the temperature of the ejected flue gas. In subsequent sections, the notation T~n refers to the temperature recorded by the corresponding thermocouple at the locations described above. The temperature change data is acquired by the thermocouples and transmitted to the temperature data collector. The mass change data is measured by an electronic balance, and the lithium battery is placed on the balance during the experiment, and the balance measures the mass in real time and transmits the data to the computer. The voltage measurement module has a maximum range of 0–70 V with a measurement accuracy of 0.01 V. The data acquisition frequency is set to once every 0.5 s. Using the voltage measurement module, the voltage data is measured at both ends via connecting wires attached to the battery’s positive and negative terminals, capturing dynamic voltage changes. This data is then transmitted to a computer via the USB interface for processing. The heating plate located directly beneath the battery is constructed of stainless steel, offering excellent thermal conductivity and uniformity. It measures 200 mm × 150 mm and has a maximum heating power of 900 W. The heating process is controlled by the heating plate controller. The TR process was recorded with a camera throughout the experiment.
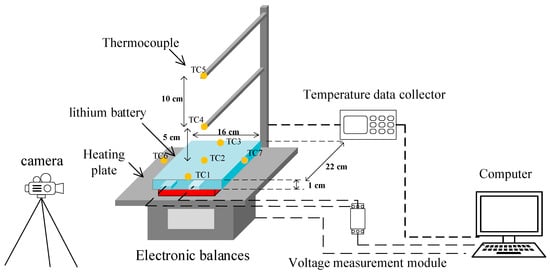
Figure 2.
Schematic diagram of the experimental platform.
2.4. Test Protocol
The ceiling for this type of electric aircraft is 3000 m [17], which is calculated based on the vertical decline of atmospheric temperature (the temperature drops by 0.65 °C for every 100 m of altitude rise) combined with the average temperature for the whole year of 2024 (about 10.9 °C), and the temperature is about −8.5 °C at an altitude of 3000 m. Considering the feasibility of experimental environment control and the actual temperature fluctuation, the ambient temperature of the electric aircraft lifting altitude was set at −8.5 ± 2 °C. In order to simulate the ambient temperature of electric aircraft in ground parking, take-off and landing and low-altitude areas, combined with the common temperature range of the daily operation of power batteries, the ground ambient temperature is set to 30 ± 2 °C.
At the above two ambient temperatures, the TR test of 0%, 50% and 100% state of charge (SOC) states of lithium battery was carried out, and the experimental scheme is shown in Table 3.
Table 3.
Experimental conditions.
3. Analysis of Experimental Results
3.1. Thermal Runaway Stage Analysis
To systematically characterize the dynamic evolution of TR in lithium batteries and provide a time window reference for safety protection, we first defined four consecutive TR stages (S1 to S4) based on key physical phenomena observed experimentally. This subsection aims to detail the characteristics of each stage, thereby establishing a process framework for understanding subsequent changes in parameters such as temperature and voltage.
Figure 3 shows the TR process of LIBs under various working conditions. As shown in the figure, with the intensification of TR, the battery undergoes the phenomena of expansion, smoke release and even flame generation. In order to refine the TR process, three key time points are selected to divide the TR process of the battery, which are: ta, tonset and tb. Table 4 records the key time points for each working condition. Based on the above three time points, the battery TR process is divided into four stages, which are the initial heating stage (S1), the rupture and exhaust stage (S2), the violent reaction stage (S3) and the recession stage (S4). The characteristics of each stage are as follows:
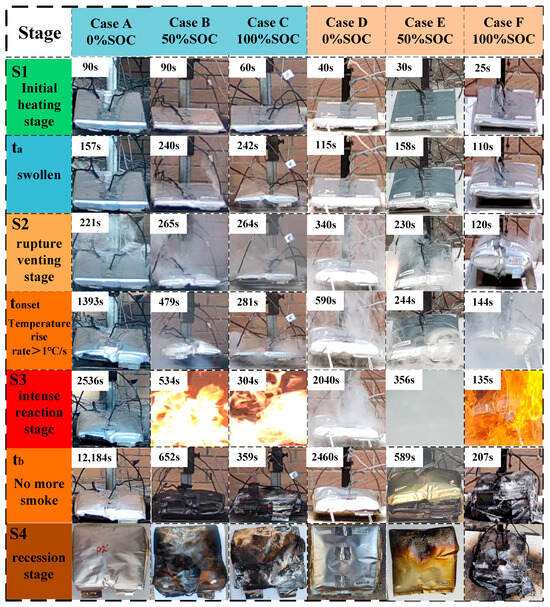
Figure 3.
TR process of battery. Note: ta is the moment when the battery undergoes obvious expansion; tonset is the moment when the surface of the battery warms up at a rate of more than 1 °C/s, which is also defined as the onset of the TR of the battery; and tb is the moment when the battery is out of control and the smoke stops being released or the flame is extinguished. or the moment of flame extinction.
Table 4.
Key Time Points in the TR Process.
- (1)
- Initial heating stage (S1: start of heating~ta):
When the battery starts to be heated continuously by the heating plate, the battery temperature gradually increases, and at the beginning of this stage, no obvious external deformation is observed in the battery for each working condition. As the heating continues, the internal Solid Electrolyte Interphase (SEI) membrane decomposes and the electrolyte undergoes side reactions, resulting in the generation of gas and an increase in internal pressure. Eventually, at ta moment, the outer package of the battery expanded significantly due to the internal gas pressure, marking the end of the S1 phase.
- (2)
- Rupture and venting stage (S2: ta~tonset):
After the battery expands, the internal reaction continues and the pressure continues to increase. When the internal pressure exceeds the limit of the outer package of the battery, the outer package ruptures. High-pressure gases are rapidly ejected through the rupture opening. The battery continues to warm up under the action of external heating and internal reaction, when the surface of the battery warms up at a rate of more than 1 °C/s, marking the TR into the S3 stage.
- (3)
- Stage of violent reaction (S3: tonset~tb):
When the surface temperature of the cell rises at a rate of more than 1 °C/s, it is demonstrated that the cell undergoes an irreversible chain exothermic reaction. During the experiment, it was observed that Conditions A, D, and E in the S3 stage mainly showed a continuous release of smoke to the outside without producing a flame. Working Conditions B, C and F, in the process of releasing smoke outward, the ejected combustible gas was ignited by the spark generated by the TR, forming a violent combustion phenomenon. When the active material in the battery is consumed, the reaction intensity gradually decreases. The flame is gradually extinguished, and the release of smoke is significantly reduced until it stops. The moment when the smoke stops being released or the flame is extinguished is defined as tb, marking the end of the S3 phase.
- (4)
- Decline phase (S4: tb~end of cooling):
From the moment of tb, TR enters into the decline phase. The main exothermic reaction in the battery basically stops, and the battery begins to cool down. In the S3 stage, the structure of the battery with intense combustion is seriously damaged, and obvious deformation, melting and even disintegration of the shell can be observed, and the electrodes, diaphragm and other hierarchical structures inside the cell are exposed to show a loose and carbonized state. In the S3 stage only released smoke battery structure is relatively intact, shell can be observed obvious expansion and deformation and smoke blackened traces, the electric core structure is not exposed.
Analysis of the thermal runaway process indicates that the power battery of this electric aircraft model exhibits four developmental stages (S1–S4) under both ambient temperatures. Among these, stage S3 features the most intense reaction, with the greatest variation in performance across different operating conditions occurring during this phase.
3.2. Battery Thermal Runaway Temperature Change
3.2.1. Battery Surface Temperature
This section focuses on analyzing temperature rise curves on battery surfaces under different operating conditions. By comparing key characteristic temperatures (Ta, Tonset, Tmax) and temperature dynamics, it reveals the severity of battery exothermic reactions.
Figure 4 systematically records the TR surface temperature characteristics for different working conditions, and TC1, TC2 and TC3 denote the temperature changes at the top, center and bottom of the cell, respectively. Table 5 summarizes the temperatures corresponding to the critical time points for each working condition.
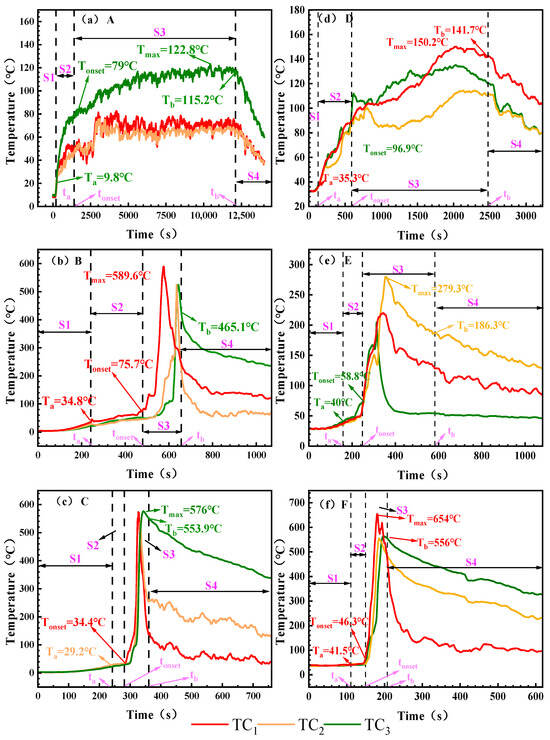
Figure 4.
The surface temperature of the battery under different working conditions. Note: Battery surface temperature measured via TC1, TC2, and TC3. (a): 0% SOC, −8.5 ± 2 °C; (b): 50% SOC, −8.5 ± 2 °C; (c): 100% SOC, −8.5 ± 2 °C; (d): 0% SOC, 30 ± 2 °C; (e): 50% SOC, 30 ± 2 °C; (f): 100% SOC, 30 ± 2 °C. The maximum surface temperatures corresponding to the critical time points ta, tonset, and tb are denoted as Ta, Tonset, and Tb, respectively, and the peak TR temperature is denoted as Tmax.
Table 5.
Temperatures corresponding to critical time points of TR process.
Figure 4 shows the battery surface temperature variation curves under different SOC and ambient temperatures. During the initial heating phase, the battery surface temperature exhibits a gradual upward trend across all operating conditions. Influenced by ambient temperature, battery temperatures in the electric aircraft’s maximum altitude low-temperature environment range from 9.8 to 34.8 °C, while surface temperatures in ground ambient conditions range from 34.3 to 41.5 °C. The figure indicates that by the end of Stage S1, except for Condition C, battery surface temperatures increase with rising SOC. At an ambient temperature of 30 ± 2 °C, the 0% SOC battery temperature is 35.3 °C. As SOC increases, the 50% SOC battery reaches 40 °C, while the 100% SOC battery rises to 41.5 °C. At −8.5 ± 2 °C, the battery temperature reached 9.8 °C. The 50% SOC battery temperature reached 34.8 °C, while the 100% SOC battery surface temperature rose slightly below that of the 50% SOC battery, reaching 29.2 °C. The overall temperature rise in the battery was limited. This indicates that the temperature increase during Stage S1 primarily resulted from heat conduction through the heating plate, with minimal internal chemical reactions occurring within the battery. In the electric aircraft’s service ceiling environment, where temperatures are lower and the temperature difference is greater, the amount of heat dissipated is relatively higher, thereby limiting the rate and magnitude of temperature rise.
In the S2 stage, the battery expands and begins to inject gas, and the surface temperature of the battery shows a slow upward trend. The temperature increase at this stage was negatively correlated with SOC. The heating range of 0% and 50% SOC was larger, with the heating ranges of A and B heating up at 69.2 °C and 40.9 °C, respectively, while the heating range of 100% SOC cells was significantly reduced, and the heating of the battery surface under working Conditions C was only 5.2 °C. Combined with the analysis of TR process in Figure 3, the reason for this phenomenon is that the side reactions of low-SOC batteries (such as SEI decomposition) are relatively mild, the gas production is slow, and the heat mainly heats the shell through heat conduction, resulting in a large temperature increase on the surface of the shell. Compared with low-SOC batteries, the initial temperature of cathode material decomposition in high-SOC batteries is lower, and unstable components such as Li0.2CoO2 will undergo a reduction reaction to generate oxygen, which is an endothermic reaction. Due to the decomposition characteristics of the cathode material and the existence of endothermic processes, the temperature of high-SOC batteries during exhaust will be lower than that of low-SOC batteries.
The most significant temperature rise occurred during the S3 phase. Severe fires erupted under both 100% SOC conditions (Condition C and Condition F). Within the S3 phase, Condition C reached a peak temperature of 576 °C, while Condition F reached 654 °C, with maximum heating rates of 8.6 °C/s and 16.9 °C/s, respectively. At 50% SOC, the peak temperature during ignition under low-temperature conditions at the electric aircraft’s service ceiling altitude (Condition B) reached 589.6 °C with a heating rate of 3.5 °C/s. No ignition occurred under normal ground conditions. Condition E exhibited a significantly reduced peak temperature of 273 °C with a heating rate of 2.0 °C/s. All 0% SOC conditions (Condition A and Condition D) did not ignite, the peak temperature was less than 150.2 °C and the heating rate was ≤0.1 °C/s. After reaching the peak, the temperature of each working condition gradually began to decrease, and the cooling rate of fire conditions such as B, C and F was relatively flat due to the slow cooling of high-temperature debris. The cooling is faster under the condition of non-fire. All battery temperatures eventually gradually approach ambient temperature.
The surface temperature analysis indicates that during Stage S1, temperature rise primarily resulted from external heating with minimal temperature variation. In Stage S2, batteries at high SOC exhibited a smaller temperature increase due to endothermic reactions. Stage S3 featured a rapid temperature surge, with maximum surface temperatures reaching 589.6 °C and 654 °C under the two test conditions, respectively. These findings provide a basis for thermal protection design of the battery compartment and parameter setting of the thermal management system.
3.2.2. Thermal Runaway Smoke and Flame Temperatures
The flames and smoke generated during TR pose high-temperature hazards to the surrounding environment. This section examines the temperatures of the flames and smoke.
As shown in Figure 5, the flue gas and combustion performance produced by the TR process show phased changes. Table 6 records the temperature corresponding to the critical moment. At the end of the S1 stage, the battery began to release a small amount of flue gas and warmed up with the heating. The final temperatures of working Conditions A, B and C reached 4.6 °C, 36.0 °C and 33.9 °C in S1 stage, and the temperatures of working Conditions B (50% SOC) and C (100% SOC) were significantly higher than those of working Conditions A (0% SOC). In the S2 stage, the battery rupture leads to an increase in flue gas emissions, and it is observed that the heating of low SOC is higher than that of high SOC batteries at the same ambient temperature. For example, in the low temperature environment of the electric aircraft, the heating amplitude of A, B and C is 70.6 °C, 35.0 °C and 32.5 °C, respectively, and the trend is the same in the normal temperature environment on the ground, and the maximum heating range of working Condition D (0% SOC) is 56.9 °C, which is much higher than that of working conditions E and F. This trend is the same as the change trend of battery surface temperature in the S2 stage. In the S3 stage, the temperature increase is most pronounced. Under the low-temperature conditions at the electric aircraft’s service ceiling, operating Condition A (0% SOC) produced only smoke, while operating Conditions B (50% SOC) and C (100% SOC) exhibited intense jet flame temperatures, rising to 678.6 °C and 805.7 °C, respectively. In the normal temperature environment on the ground, the battery under working Condition D (0%) and working Condition E (50% SOC) both produced flue gas, and only produced flame at 100% SOC, with a peak temperature of 690.5 °C.
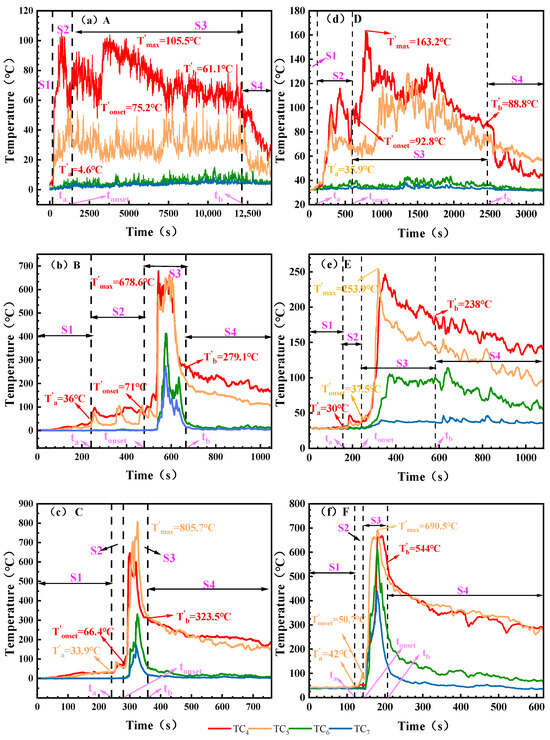
Figure 5.
The temperature of battery flue gas and flame changes under different working conditions. Note: Battery flame/exhaust gas temperature measured via TC4, TC5, TC6, and TC7. (a): 0% SOC, −8.5 ± 2 °C; (b): 50% SOC, −8.5 ± 2 °C; (c): 100% SOC, −8.5 ± 2 °C; (d): 0% SOC, 30 ± 2 °C; (e): 50% SOC, 30 ± 2 °C; (f): 100% SOC, 30 ± 2 °C. The flue gas or flame temperatures corresponding to time points ta, tonset, and tb are denoted as T′a, T′onset, and T′b, respectively. The highest flue gas or flame temperature during the thermal runaway process is denoted as T′max.
Table 6.
Flue gas or temperature corresponding to key time points of TR process.
Analysis of flue gas and flame temperatures indicates that during Stage S1, flue gas release increases with rising SOC. In Stage S2, batteries with low SOC exhibit more pronounced temperature rise. Stage S3 features intense jet flames from the batteries, with maximum temperatures reaching 805.7 °C and 690.5 °C under the two test conditions, respectively. These data provide reference for selecting thermal insulation materials for electric aircraft battery compartments.
3.3. Thermal Runaway Voltage Change
Voltage serves as a critical indicator reflecting the electrochemical state and structural integrity within a battery. This subsection analyzes the evolution of battery voltage during TR. Figure 6 demonstrates the variation in the voltage during TR. The characteristic voltages corresponding to the operating conditions are given in Table 7.
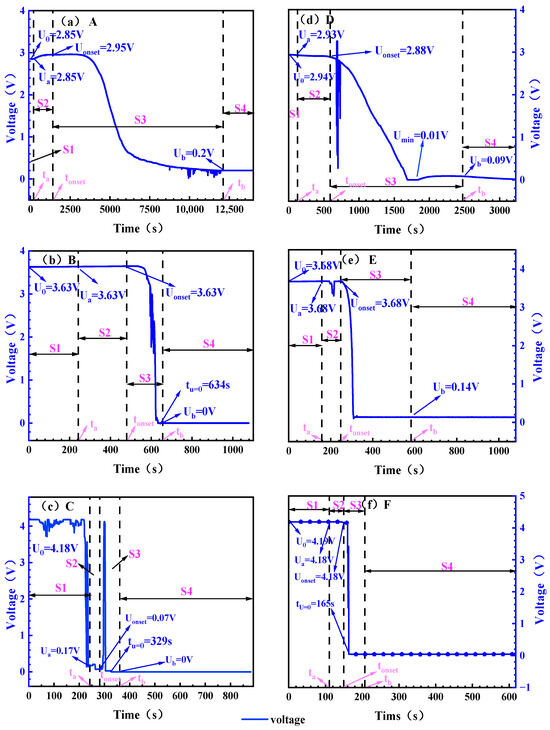
Figure 6.
Battery voltage changes under different working conditions. Note: (a): 0% SOC, −8.5 ± 2 °C; (b): 50% SOC, −8.5 ± 2 °C; (c): 100% SOC, −8.5 ± 2 °C; (d): 0% SOC, 30 ± 2 °C; (e): 50% SOC, 30 ± 2 °C; (f): 100% SOC, 30 ± 2 °C. The initial value of the voltage is set to U0, and the voltages corresponding to the three time points ta, tonset, and tb are set to Ua, Uonset, and Ub, respectively, and (b,c,f) mark the time tU = 0 for the voltage drop of 0 V due to the voltage drop of 0 V.
Table 7.
Voltages corresponding to critical time points of TR process.
At both ambient temperatures, the higher the SOC, the shorter the voltage drop time (the time it takes to drop from the beginning of the voltage to the lowest point of the voltage). In the height environment of the electric aircraft, the voltage drop time of the 0% SOC battery is as long as 4451 s, while the 100% SOC battery is shortened to 294 s. In the normal temperature environment of the ground, the voltage drop time is further shortened. 0% SOC is 1560 s, 100% SOC is 54 s. The increase in ambient temperature and high SOC accelerated the voltage drop process, which mainly stemmed from the continuous consumption of active lithium in the battery, and the increase in ambient temperature accelerated the decomposition of the SEI film.
For 0 and 50% SOC batteries, the significant inflection point of the battery in the ground normal temperature environment is significantly earlier than that of the battery in the electric aircraft lift limit environment, and the 0% SOC battery at ground normal temperature has obvious voltage fluctuations at 677 s, while the battery voltage decline trend is flat in the electric aircraft lift limit altitude environment, and there is no obvious inflection point. For 50% SOC batteries, an inflection point occurs at 194 s in the ground normal temperature environment, the voltage begins to drop rapidly at 257 s, and the voltage begins to drop rapidly at 532 s in the height limit environment of electric aircraft. For 100% SOC batteries, the voltage drop process is different, and the battery voltage begins to drop at 155 s in the ground normal temperature environment, and the process lasts for 10 s. In the environment of the lift limit of electric aircraft, the battery fluctuated in 38 s and began to decline significantly in 217 s. The voltage fluctuation is mainly related to the disturbance caused by battery gas production, and the increase in ambient temperature accelerates the gas production process such as electrolyte decomposition. The rapid gas generation leads to an increase in the pressure in the battery, causing the displacement and deformation of the electrode pieces and separators, which manifests as voltage fluctuations. The increase in temperature accelerates the gas production process, and the 0% and 50% SOC cells in the ground room temperature environment fluctuate earlier.
The results indicate that as SOC and ambient temperature increase, the duration of voltage decline shortens. This effect is most pronounced in batteries at 100% SOC under ambient conditions, where the voltage drop process lasts only 10 s. Batteries at low SOC exhibit a gradual voltage decline without significant fluctuations, while those at high SOC show noticeable fluctuations. These voltage variation characteristics provide a reference basis for early detection of TR in this model of electric aircraft.
3.4. Changes in Battery Quality
Figure 7 gives the change in battery mass during TR. In the figure the initial mass of the battery is set to 0 and the mass loss of the battery is obtained as a negative value and the mass changes corresponding to the characterized time points are recorded in Table 8.
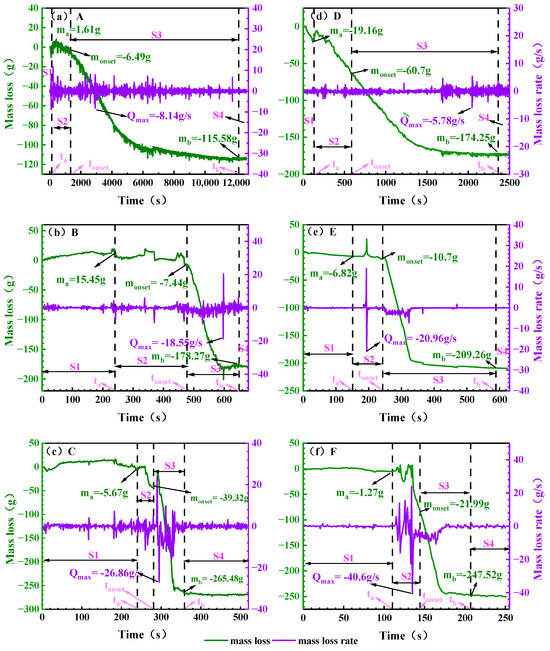
Figure 7.
The loss of battery quality under different working conditions. Note: (a): 0% SOC, −8.5 ± 2 °C; (b): 50% SOC, −8.5 ± 2 °C; (c): 100% SOC, −8.5 ± 2 °C; (d): 0% SOC, 30 ± 2 °C; (e): 50% SOC, 30 ± 2 °C; (f): 100% SOC, 30 ± 2 °C. The mass corresponding to the moments ta, tonset and tb are denoted as ma, monset and mb respectively and the maximum mass loss rate is denoted as Qmax.
Table 8.
Masses corresponding to key time points of the TR process.
During the TR process, the mass showed significant characteristics with different stages. In the S1 stage, the battery mass increased slightly, mainly due to the impact of the battery on the electronic balance reading due to thermal expansion, not the real mass increase, and the mass was basically stable around the initial value after the end of this stage. Entering the S2 stage, due to the rupture of the battery, the gas generated in the battery is released outward, and the quality is significantly reduced. In this stage, the mass loss at the two ambient temperatures is quite different. For the same SOC battery, the mass loss at ground room temperature is significantly higher than that of electric aircraft at the height limit. For example, the mass loss of 0% SOC battery in the S2 stage at room temperature is as high as 41.54 g, while it is only 4.88 g in the ceiling altitude environment of electric aircraft, indicating that after the temperature rises, the decomposition of the SEI film is accelerated, and the reaction between lithium-embedded graphite and the electrolyte is more intense, resulting in more violent gas generation and release. Finally, the battery has violent blowing and burning phenomena in the S3 stage, and the mass loss is the most concentrated in this stage, and the peak mass loss rate generally appears at the end of S2 or the beginning of S3. At both ambient temperatures, the total mass loss of the S3 stage increased with the increase in SOC. The mass loss of 100% SOC cells reached 225.53 g in the S3 stage, which was significantly higher than that of 50% SOC (198.56 g) and 0% SOC (113.55 g). This phenomenon indicates that the anode of high-SOC batteries stores more active lithium, which is more reactive and has a higher total amount of consumable substances, leading to more intense and thorough chemical reactions in the S3 stage.
Mass change analysis indicates that mass loss at ground ambient temperature exceeds that at the service ceiling altitude. Total mass loss increases with rising SOC, with peak mass loss rates occurring at the end of S2 or the beginning of S3, reaching 265.48 g and 247.52 g, respectively. This data provides a reference basis for determining the configuration of the battery compartment ventilation system in electric aircraft.
4. Calculation of the Minimum Ambient Temperature Leading to TR
According to Zhu et al. [18] the temperature of thermal expansion of 25 Ah LFP soft pack batteries under 50% SOC was 75.1 °C, while in the experiments of Liu et al. [19], it was found that the average trigger temperatures of TR for 22 Ah batteries with 50% and 100% SOC were 198.6 and 184.8 °C, respectively. In the study of 243 Ah high-capacity batteries it was shown [20] that the TR of 50% and 100% SOC batteries occurred at starting temperatures of 227.5 and 194.4 °C. From the experimental conclusions of these different scholars, it can be seen that the TR temperatures of batteries with different capacities differ; at the same time, the TR triggering temperature of the same battery in different SOC states also changes, which fully indicates that the SOC have impact on the TR triggering temperature of the battery.
In the field of aviation, the safety of batteries is crucial. The high-density 50 Ah Li-ion battery, which is the focus of this experiment, requires a higher degree of attention to the TR triggering temperature in aircraft application scenarios due to the complexity and specificity of its working environment. In the evaluation of thermal hazards of chemical materials, Semenov TR model is a typical model for analyzing the TR criticality, this model believes that when the ambient temperature is warmed up to a certain temperature, there is only one tangent point in the heat generation curve and heat dissipation curve, and the temperature corresponding to this point is the non-reduction temperature TNR, at this time the ambient temperature is the lowest ambient temperature SADT for the self-accelerated decomposition of the reactants, and when the different working conditions of the battery temperature reaches TNR, the battery will be in danger of TR.
According to the Semenov TR model, the thermal balance equation for a system consisting of a battery and its external packaging materials can be expressed by Equation (1):
where U is the surface heat transfer coefficient, S is the surface area of the battery, T0 is the ambient temperature, M0 is the initial mass, A is the pre-reaction factor, and N is the reaction series assumed to be 1 [21]. From the Sememov TR model, at the non-return temperature TNR point, the conditions dT/dt = 0 and d(dT/dt)/dt = 0 are satisfied, as expressed by Equations (2) and (3):
where and are constants, dividing Equations (2) and (3) yields
According to the above equation, the non-return temperature TNR can be calculated. according to the Semenov model, the ambient temperature corresponding to the system is the lowest ambient temperature (SADT) of the system.
The battery activation energy was not accurately measured in this study, so the activation energy data measured by related scholars in their studies are quoted in the calculations. Richard [22] investigated the thermal stability of Li-ion batteries by Differential Scanning Calorimetry (DSC), and the activation energy was measured to be 1.344 × 10⁵ J/mol. Macneil and Dahn [23] evaluated the reaction kinetics of the battery using DSC and ARC and measured an activation energy of 1.19 × 10⁵ J/mol, and Wang et al. [24] reported an activation energy of 1.321 × 10⁵ J/mol for a battery with LixMn2O4 cathode material. The temperature Tonset corresponding to the experiment was considered to be the critical temperature for TR, the battery Tonset in high temperature environment was brought into the above equation and the corresponding SADT was calculated as shown in Table 9.
Table 9.
Minimum ambient temperatures for TR.
By substituting the activation energies calculated by various scholars through relevant studies, along with the TR data obtained from TR experiments conducted at ambient ground-level temperatures (corresponding to operating Conditions D, E, and F), into the Semenov model, it is found that the increase in SOC will reduce the critical ambient temperature threshold of the battery triggering TR in the thermal abuse scenario. When the SOC is 0%, the model calculation shows that the thresholds of TR critical temperature are 88.43 °C, 87.33 °C and 88.29 °C, while at 100% SOC, the thresholds are reduced to 39.99 °C, 39.17 °C and 39.88 °C. It is worth noting that this temperature threshold only characterizes the minimum ambient temperature that triggers the battery’s self-sustaining exothermic reaction under the condition of continuous heating of the external heat source, and is a necessary but not sufficient condition for the occurrence of TR. Wang et al. [25] mentioned in his study that the minimum ambient temperature for lithium iron phosphate batteries to trigger TR is 103.8 °C. Compared to Wang’s research, the batteries selected for this experiment require greater attention to environmental temperature control. Therefore, corresponding safety functions should be formulated in the battery management system of electric aircraft, such as electric propulsion system cooling device and alarm device, to prevent the battery working environment from reaching the minimum temperature causing TR and avoid battery TR caused by the external high temperature environment.
5. Safety Analysis and Protection Strategies for Electric Aircraft
During the experiment, it was observed that the TR process of electric aircraft power batteries was accompanied by significant temperature rise, rapid voltage drop, and the release of flammable gases, even triggering visible flames. Under the service ceiling conditions of electric aircraft, batteries at 100% SOC enter the TR process at 34.4 °C. Under these conditions, the temperature rise is small and the distinguishability is reduced, making it easy to exceed the expected thresholds or sensitivity ranges of conventional monitoring systems, leading to delayed risk identification and warning failure. TR in ground ambient conditions typically involves higher peak temperatures, with more direct and severe thermal hazards. The maximum surface temperature (Tmax) reached 654 °C, and voltage collapse occurred earlier, with the shortest time to collapse (tU=0) being 165 s. In both environments, TR causes significant mass loss accompanied by intense exothermic reactions, releasing large quantities of toxic and hazardous gases. At the service ceiling of electric aircraft and at ground ambient temperatures, mass loss reached 265.48 g and 247.52 g, respectively. This mass loss stems from electrolyte decomposition within the battery and a series of electrode material reactions, with the released toxic gases posing poisoning hazards to crew and passengers. Furthermore, aircraft power batteries are typically installed as battery packs within battery compartments. Once TR occurs in a single cell, its intense thermal radiation and conduction severely affect adjacent cells, significantly increasing the risk of thermal propagation.
Based on the lithium battery protection strategy framework proposed by Huang [26] in the field of marine vessels, a safety control strategy for electric aircraft has been developed, as shown in Figure 8. This strategy employs a layered protection approach. The first layer relies on real-time monitoring and regulation to eliminate TR risks during abnormal battery temperature conditions. If an out-of-control battery cannot be effectively managed, the second layer activates, utilizing the battery compartment’s inherent containment design to confine TR within the compartment. If the TR battery does not cause other batteries to fail, active regulation continues. Should TR spread, the fire suppression system within the battery compartment activates. Should smoke and heat from the TR spread into the cabin, temperature and smoke detectors trigger early warnings while simultaneously activating the cabin fire suppression system. This implements temperature control and smoke exhaust to ensure crew safety.
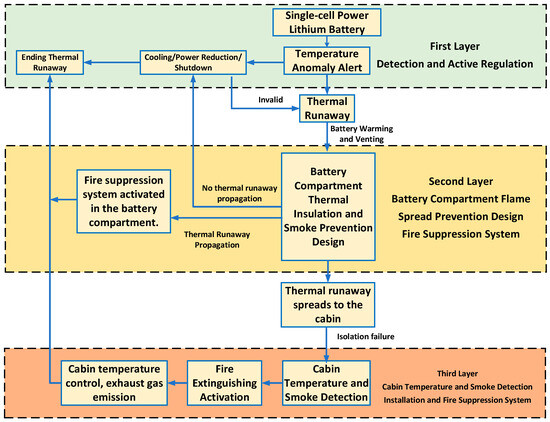
Figure 8.
Flowchart of the safety protection strategy for electric aircraft.
The aforementioned research findings indicate that TR in electric aircraft power batteries can trigger a chain reaction of safety threats from the battery interior to the aircraft cabin, encompassing multiple hazards such as high temperatures, open flames, and toxic gas dispersion. To ensure the flight safety of electric aircraft, this study references the lithium battery safety concepts and protective measures applied in the marine sector by Huang et al. [26], adapting them for electric aircraft to establish a multi-layered protection strategy (as shown in Table 10). This strategy aims to provide a basis for the safety protection design of electric aircraft power systems and can offer detailed recommendations for certification requirements concerning TR propagation and cabin safety within their airworthiness regulations.
Table 10.
Safety Strategies for Electric Aircraft.
6. Conclusions
This study systematically investigated the TR characteristics of a specific electric aircraft power battery under typical operating temperatures. Through a combination of experimental and theoretical analysis, the variations in TR parameters—including temperature, voltage, and mass—were systematically obtained for the battery under both service ceiling ambient temperature (−8.5 ± 2 °C) and ground ambient temperature (30 ± 2 °C). Based on experimental data and the Semenov model, the critical TR temperature was determined, and a multi-level protection system was established. Key conclusions are as follows:
- (1)
- Under both the altitude-limited ambient temperature and ground ambient temperature conditions, the temperature differences between the S1 and S2 stages of the battery are minimal. The peak temperature of battery TR occurs during the S3 stage, with surface temperatures reaching 589.6 °C and 654 °C, respectively, and maximum heating rates of 8.6 °C/s and 16.9 °C/s. The maximum flame temperatures under the two conditions reached 805.7 °C and 690.5 °C, respectively. Batteries with low SOC exhibited a gradual voltage decline without significant fluctuations, while those with high SOC showed pronounced fluctuations. At identical SOC levels, batteries in ambient ground temperature conditions experienced a more rapid voltage drop, with the voltage decline process for a 100% SOC battery lasting only 10 s. During TR, the peak mass loss in both temperature environments generally occurred at the end of Stage S2 or the beginning of Stage S3, with peak mass loss rates reaching 265.48 g and 247.52 g, respectively.
- (2)
- Based on the Semenov TR model and prior research, the minimum ambient temperature required to trigger a self-sustaining exothermic reaction in batteries under continuous external heating was calculated. The minimum ambient temperature for triggering TR in the LIBs used in this electric aircraft experiment was approximately 39 °C.
- (3)
- Conducting safety analyses on electric aircraft, we established a multi-level protection strategy comprising “monocoque–battery compartment–cabin.” By optimizing batteries, improving battery compartments, and enhancing cabin safety features, this approach provides a pathway for TR protection in electric aircraft and offers reference for airworthiness certification.
In summary, the experimental data, computational results, and multi-level protection strategy obtained in this research provide a basis for the safe design and airworthiness certification of this model of electric aircraft.
Author Contributions
Conceptualization, P.H. and X.C.; methodology, X.C.; software, C.H. and C.G.; validation, X.C. and C.H.; formal analysis, X.C.; investigation, X.C., C.H. and C.G.; resources, P.H.; data curation, X.C.; writing—original draft preparation, X.C.; writing—review and editing, P.H. and X.C.; visualization, X.C.; supervision, P.H. and X.C.; project administration, P.H. All authors have read and agreed to the published version of the manuscript.
Funding
This research received no external funding.
Data Availability Statement
The original contributions presented in this study are included in the article. Further inquiries can be directed to the corresponding author.
Conflicts of Interest
The authors declare no conflicts of interest.
Abbreviations
The following abbreviations are used in this manuscript:
| TR | Thermal runaway |
| SOC | State of Charge |
| LIBs | lithium-ion batteries |
References
- Gnadt, A.R.; Speth, R.L.; Sabnis, J.S.; Barrett, S.R. Technical and environmental assessment of all-electric 180-passenger commercial aircraft. Prog. Aerosp. Sci. 2019, 105, 1–30. [Google Scholar] [CrossRef]
- Wang, Y.; Guo, C.H.; Chen, X.J.; Jia, L.Q.; Guo, X.N.; Chen, R.S.; Zhang, M.S.; Chen, Z.Y.; Wang, H.D. Carbon peak and carbon neutrality in China: Goals, implementation path and prospects. Chin. Geol. 2021, 4, 720–746. [Google Scholar] [CrossRef]
- Sun, X.; Cheng, W.; Mu, Z. White Paper on the Development of Electric Aircraft. Aviat. Sci. Technol. 2019, 30, 1–7. [Google Scholar] [CrossRef]
- Cao, W.; Mecrow, B.C.; Atkinson, G.J.; Bennett, J.W.; Atkinson, D.J. Overview of electric motor technologies used for more electric aircraft (MEA). IEEE Trans. Ind. Electron. 2011, 59, 3523–3531. [Google Scholar] [CrossRef]
- DO-311A; Minimum Operational Performance Standards for Rechargeable Lithium Batteries and Battery Systems. RTCA: Washington, DC, USA, 2017.
- DOC.NO:SC E-19; CRI Consultation Paper Special Condition. EASA: Switzerland, Norway, 2021.
- CTSO-C179b; Rechargeable Lithium Batteries and Battery Systems. CAAC: Beijing, China, 2024.
- Zhou, Z.; Li, M.; Zhou, X.; Li, L.; Ju, X.; Yang, L. Investigating thermal runaway triggering mechanism of the prismatic lithium iron phosphate battery under thermal abuse. Renew. Energy 2024, 220, 119674. [Google Scholar] [CrossRef]
- Liu, J.; Zhang, Y.; Zhou, L.; Han, C.; He, T.; Wang, Z. Influencing factors of lithium-ion battery thermal runaway in confined space. J. Energy Storage 2023, 73, 109125. [Google Scholar] [CrossRef]
- Jiang, W.; Li, C.; Li, X.; Wu, Y.; Luo, Y.; Zhou, D.; Lin, Z.; Xiong, K.; Liu, J. Enhancing safety of electric aircraft Batteries: Degradation and thermal runaway behavior at extreme altitudes. eTransp 2025, 25, 100448. [Google Scholar] [CrossRef]
- Yang, L.; Liu, F.; Li, F.; Chen, Z.; Wang, J.; Gao, L.; Xiao, F.; Sun, J.; Romagnoli, A. Thermal runaway prevention and mitigation for lithium-ion battery-powered electric aircraft: Challenges and perspectives. Aerosp. Traffic Saf. 2024, 1, 103–118. [Google Scholar] [CrossRef]
- Harrison, J.; Charles, D.; Zenker, J.; Frank, E. Using multi-physics system simulation to predict battery pack thermal performance and risk of thermal runaway during eVTOL aircraft operations. In Proceedings of the 2019 EATS, Indianapolis, IN, USA, 22–24 August 2019; pp. 1–13. [Google Scholar] [CrossRef]
- Sun, Q.; Liu, H.; Wang, Z.; Meng, Y.; Xu, C.; Wen, Y.; Wu, Q. Investigation on thermal runaway hazards of cylindrical and pouch lithium-ion batteries under low pressure of cruise altitude for civil aircraft. Batteries 2024, 10, 298. [Google Scholar] [CrossRef]
- Yang, J.; Liu, W.; Zhao, H.; Zhang, Q. Experimental investigation of lithium-ion batteries thermal runaway propagation consequences under different triggering modes. Aerospace 2024, 11, 438. [Google Scholar] [CrossRef]
- Jin, C.Y.; Sun, Y.D.; Wang, H.B.; Zheng, Y.J.; Wang, S.Y.; Rui, X.Y.; Xu, C.S.; Feng, X.N.; Wang, H.W.; Ouyang, M.G. Heating power and heating energy effect on the thermal runaway propagation characteristics of lithium-ion battery module: Experiments and modeling. Appl. Energy 2022, 312, 118760. [Google Scholar] [CrossRef]
- Hou, C.; Hu, P.; Chai, X.; Guan, C. Study on the effect of active heating duration on thermal runaway in aviation power lithium-ion batteries. Case Stud. Therm. Eng. 2025, 73, 106569. [Google Scholar] [CrossRef]
- Basic Parameters. Available online: http://rxgac.com/c/RX4E.html (accessed on 29 October 2025).
- Zhu, X.; Sun, Z.; Wang, Z.; Wang, H.; Lin, N.; Shan, C. Thermal runaway in commercial lithium-ion cells under overheating condition and the safety assessment method: Effects of SoCs, cathode materials and packaging forms. J. Energy Storage 2023, 68, 107768. [Google Scholar] [CrossRef]
- Liu, P.J.; Liu, C.Q.; Yang, K.; Zhang, M.J.; Gao, F.; Mao, B.B.; Li, H.; Duan, Q.L.; Wang, Q.S. Thermal runaway and fire behaviors of lithium iron phosphate battery induced by over heating. J. Energy Storage 2020, 31, 101714. [Google Scholar] [CrossRef]
- Liu, P.J.; Li, Y.Q.; Mao, B.B.; Chen, M.; Huang, Z.H.; Wang, Q.S. Experimental study on thermal runaway and fire behaviors of large format lithium iron phosphate battery. Appl. Therm. Eng. 2021, 192, 116949. [Google Scholar] [CrossRef]
- Huang, P.; Ping, P.; Li, K.; Chen, H.; Wang, Q.; Wen, J.; Sun, J. Experimental and modeling analysis of thermal runaway propagation over the large format energy storage battery module with Li4Ti5O12 anode. Appl. Energy 2016, 183, 659–673. [Google Scholar] [CrossRef]
- Richard, M.; Dahn, J. Accelerating rate calorimetry study on the thermal stability of lithium intercalated graphite in electrolyte. I. Experimental. J. Electrochem. Soc. 1999, 146, 2068. [Google Scholar] [CrossRef]
- MacNeil, D.; Dahn, J. Test of reaction kinetics using both differential scanning and accelerating rate calorimetries as applied to the reaction of Li x CoO2 in non-aqueous electrolyte. J. Phys. Chem. A 2001, 105, 4430–4439. [Google Scholar] [CrossRef]
- Wang, Q.; Sun, J.; Chen, C. Thermal stability of delithiated LiMn2O4 with electrolyte for lithium-ion batteries. J. Electrochem. Soc. 2007, 154, A263. [Google Scholar] [CrossRef]
- Wang, Q.S.; Ping, P.; Sun, J.H. Thermal Hazards and Safety Countermeasures for Lithium-Ion Batteries; Science Press: Beijing, China, 2017. (In Chinese) [Google Scholar]
- Huang, Z.X.; Luo, X.F.; Huang, K.S. Safety Risk Analysis and Prevention Strategies for Lithium Batteries in Marine Applications. Mar. Power Technol. 2021, 41, 7–11. (In Chinese) [Google Scholar] [CrossRef]


Disclaimer/Publisher’s Note: The statements, opinions and data contained in all publications are solely those of the individual author(s) and contributor(s) and not of MDPI and/or the editor(s). MDPI and/or the editor(s) disclaim responsibility for any injury to people or property resulting from any ideas, methods, instructions or products referred to in the content. |
© 2025 by the authors. Licensee MDPI, Basel, Switzerland. This article is an open access article distributed under the terms and conditions of the Creative Commons Attribution (CC BY) license (https://creativecommons.org/licenses/by/4.0/).