Abstract
In CO2 flooding technology, the injection tubing string is prone to intense fluid–structure interaction (FSI) vibrations and water hammer effects during transient start-up and shutdown processes, which seriously threaten injection safety. This study is based on a four-equation FSI model and employs the method of characteristics (MOC) and numerical simulations to analyze the dynamic responses of fluid velocity, pressure, axial vibration velocity, and additional stress in the tubing string during start-up and shutdown processes. The results indicate that the most severe vibrations occur within 12 s after pump start-up, with a significant increase in the amplitude of axial additional stress. Increasing the injection rate leads to a notable rise in the peak water hammer pressure. Extending the shutdown time effectively reduces impact loads. This research provides an important theoretical basis for the safe design and operational control of the CO2 injection wells. It is recommended to adopt operational strategies such as low rate, slow start-up, and reasonably extended shutdown times to mitigate vibration hazards.
1. Introduction
As an effective method for significantly improving oil recovery efficiency and achieving geological sequestration of greenhouse gases [1], CO2 enhanced oil recovery (CO2–EOR) technology holds great significance for safeguarding national energy security and realizing the strategic goals of “carbon peaking and carbon neutrality” [2]. Injector strings, serving as the critical channels for transporting CO2 to the bottom of wells, have structural integrity that directly dictates the safety and efficiency of the injection-production process. During the CO2 injection, variations in fluid flow rate and pressure can induce vibration of the strings; in turn, this string vibration affects fluid movement, leading to complex fluid–structure interaction (FSI) phenomena. Particularly under transient operating conditions such as pump startup and shutdown, the abrupt change in internal pressure within the strings triggers an intense water hammer effect, generating enormous transient impact loads. These loads substantially increase in the risk of forced vibration, resonance, and even plastic deformation of the strings—Ding Jiandong [3] conducted vibration simulation tests on injection-production strings in gas storage facilities, revealing that the transient impact load during pump startup/shutdown can reach five to fifteen times the static load—an issue that once caused seal failure at the joint of injection-production well strings in a gas field. Additionally, Wang Jipeng [4]’s laboratory experiments found that under well opening/closing conditions, the amplitude of the simulated strings increased by more than 30% compared to steady-state operating conditions, while the local wear rate of the string body rose by a factor of two. These cases collectively indicate that vibration under transient conditions has posed an actual threat to on-site injection-production safety, making it a key challenge for the safe downhole operation [5].
With the large-scale application of CO2-EOR and sequestration technology, the issue of FSI–induced vibration of downhole strings under transient operating conditions has attracted increasing attention. Correspondingly, research methods have gradually expanded from single-mechanics analysis to multi-physics coupling and high-performance numerical simulation. In the early stages, Jin Zhui [1] first revealed the complex pipeline system of pump stations, proposed basic theories, solutions, and practices for protecting against shutdown hazards, and conducted dynamic simulations using computers. Protective measures such as gas injection (buffer) valves, accumulator-controlled slow-closing butterfly valves, and slow-closing check valves were proposed. Xu Zhigang et al. [2] conducted research on shutdown numerical simulation and visualization technology. Using the method of characteristics and Microsoft Visual C++ 6.0, he developed a source program for water hammer calculation. Based on Excel’s data management and chart processing capabilities, he performed transient process numerical simulation and data visualization analysis, opening a new approach for shutdown calculation. Dou Yihua et al. [5] analyzed the safety of completion tubing string vibration during well opening and closing operations. Using ABAQUS 2022 software, a finite element model of the tubing string was established. Based on experimental data, the acceleration and frequency of tubing string vibration under fluid drainage and well-opening conditions were compared. The results showed that under transient conditions of well opening and closing, vibrations are more intense and can lead to destructive resonance, causing plastic deformation of the completion tubing string. Forced vibration of the tubing string poses safety risks and must be taken seriously. Ding Jiandong et al. [3] conducted vibration simulation tests on injection-production tubing strings in gas storage. Vibration data of the tubing string under different gas flow rates, different tubing string positions, pipe diameters, axial forces, and valve opening and closing conditions were measured and analyzed. When the valve is opened or closed, the transient vibration of the tubing string is more intense, and the transient impact load can reach five to fifteen times the static load. Wang Jipeng et al. [4] carried out laboratory experiments to study the FSI vibration characteristics of gas production tubing strings. The effects of variable flow rate, variable tension, liquid and sand content, and well opening/closing conditions on tubing string vibration were analyzed. The experimental results showed that instantaneously opening or closing the gas valve leads to an increase in the amplitude of the simulated tubing string. Under the same gas flow rate, the amplitude of the tubing string decreases with an increase in the axial tension at both ends. The presence of sand or liquid in the gas flow increases the vibration amplitude of the tubing string. Zhu Fu et al. [6] studied shutdown protection measures for long-distance water conveyance projects based on engineering examples. Using ANSYS 2022 software for water hammer and transient analysis, the shutdown process of the pipeline was simulated and calculated. The advantages of different protection measures were analyzed, and economical, efficient, and scientific pipeline shutdown protection measures were proposed, providing a reference for similar projects. Xu Zhixin et al. [7] conducted a three-dimensional nonlinear FSI vibration analysis of the plugging tubing string in abandoned coalbed methane wells, revealing the vibration response mechanism of complex structures under multi-field coupling. Yang Wenwu et al. [8] studied the vibration mechanical behavior of the perforated section tubing string under the influence of multiple factors, pointing out the significant effects of geometric nonlinearity and boundary conditions on vibration modes. Dou Yihua et al. [9] analyzed the mechanical performance of the downhole safety valve in completion tubing strings under typical working conditions, providing a basis for downhole safety control. Zhang Chaoyue et al. [10] conducted a systematic mechanical analysis of segmented fracturing tubing strings, emphasizing the risk of structural vibration induced by transient flow. Gao Deli and Huang Wenjun et al. [11] reviewed research progress in downhole tubing string mechanics and control methods, indicating that intelligent monitoring and dynamic control are key future directions. Qin Ao et al. [12] studied the FSI vibration mechanism of tandem double wavy taper cylinders, discovering the coupling law between vortex-induced vibration and structural response. Yang Boke et al. [13] and Ai Pengxian et al. [14] studied the FSI characteristics of fracturing tubing strings from the perspectives of multi-dimensional vibration and friction effects, respectively, enriching the theoretical system of oil and gas well tubing string dynamics. Cao Yinping et al. [15,16] systematically analyzed the influence of FSI on the vibration characteristics of tubing strings and conducted natural frequency simulations using ANSYS 2022 Workbench, providing a practical basis for numerical simulation. Wang Yu, Fan Honghai et al. [17,18] established an FSI vibration model for completion tubing strings in high-pressure gas wells, finding that axial vibration under high-speed injection conditions is prone to cause resonance.
In international research, A. Beune et al. [19] established a multi-grid numerical model to analyze the opening characteristics of high-pressure safety valves. Using computational fluid dynamics (CFD) numerical methods, the influence on steady-state flow performance was studied, and oscillation phenomena were observed during the valve closing process. This tool can be used to evaluate the working characteristics of safety valves and optimize valve design. Ruben Nerella et al. [20] analyzed fluid transients and pressure wave propagation in pressure pipelines caused by valve closure. The governing equations for unsteady flow in closed pipelines are hyperbolic partial differential equations. Taking the MOC model as an example, the changes in fluid pressure and flow rate in the pipeline after valve closure over time were given. Slipchuk et al. [21] used the KBM asymptotic method to study the vibration characteristics of moving wires, providing an effective asymptotic analytical tool for vibration response analysis. Archut et al. [22] studied the mechanical response of nonwoven materials under plate vibration excitation, revealing the coupling behavior of complex materials under dynamic loads. Giagopoulos et al. [23] established an optimization model for elevator chassis under crash scenarios based on the characterization of hyperelastic materials, improving the prediction accuracy of structural response under impact loads. Prem et al. [24] proposed a method for identifying fractional damping parameters in structural dynamics based on polynomial chaos expansion, enhancing the reliability of damping modeling. Sozinando et al. [25] conducted a fluid interaction analysis of rotor-stator contact in response to fluid motion and viscosity effects, providing a new perspective for FSI research in rotating machinery. Ayoub Mohammed Abdalla et al. [26] studied the combined effects of minimum miscibility pressure and injection rate changes on the recovery of CO2 flooding in sandstone reservoirs, emphasizing the importance of injection parameters on system dynamic behavior. Zhang et al. [27] systematically analyzed the water hammer effect and tubing string vibration in high-pressure and high-production gas wells, pointing out that transient pressure waves are the main factor inducing vibration. Guo et al. [28] and Mao et al. [29] studied the nonlinear flow-induced vibration response of tubing strings in high-temperature high-pressure oil and gas wells and gas storage injection-production tubing strings, respectively, emphasizing the influence of material nonlinearity and environmental parameters. Liu et al. [30,31] studied the response and failure mechanism of leaching tubing strings in salt cavern gas storage under flow-induced vibration through experiments and numerical methods, providing a basis for long-term safe operation.
To clearly present the research progress, Table 1 summarizes the key research timeline in the field of fluid–structure interaction (FSI) for CO2 flooding wellbore strings.

Table 1.
Key research timeline of fluid–structure interaction (FSI) for CO2 flooding wellbore strings.
Existing studies have achieved significant breakthroughs in the theory, numerical methods, and experimental techniques of wellbore string fluid–structure interaction (FSI). Theoretically, a comprehensive framework ranging from water hammer protection to FSI has been established; numerically, a leap from single mechanical analysis to multi-physics field coupling has been realized; experimentally, vibration data under conventional fluid conditions (e.g., water, natural gas) have been accumulated. However, most studies remain focused on conventional fluid media, and research on the transient FSI behavior of strongly nonlinear fluids like CO2 in wellbore strings is still limited. The strong nonlinearity of CO2 is mainly reflected in its tendency to undergo phase transitions (e.g., from supercritical state to liquid state) under injection pressure (20–40 MPa) and downhole temperature conditions. Moreover, phase transitions significantly alter fluid physical parameters such as density (with a variation range of 20–50%) and viscosity (with a variation range of 1–2 orders of magnitude), which in turn affect the frictional characteristics and pressure propagation laws inside the pipe. This property is essentially different from that of conventional fluids (e.g., water, natural gas) with stable physical properties, making it difficult for conventional FSI models to accurately describe the transient response of CO2 flooding wellbore strings. Particularly during severe transient processes such as pump startup and shutdown, the coupling mechanism among CO2 phase transitions, frictional characteristics, and structural dynamic response remains unclear, and systematic modeling and comprehensive analysis are lacking.
The innovation of this study is not limited to the specific scenario of the CO2 injection; its core differences [from previous studies] lie in three aspects: First, targeting the strong nonlinear characteristics of CO2 under injection conditions (20–40 MPa, 30–120 °C)—including phase transitions between supercritical/liquid/gaseous states and significant changes in density/viscosity with pressure and temperature—a dedicated four-equation model for FSI was established, breaking the limitations of previous constant-parameter models for conventional fluids (water, natural gas). Second, the coupled dynamic response between the fluid and wellbore string during the full transient cycle of pump startup (0–20 s) and pump shutdown (5–15 s) was systematically analyzed, and key laws such as the 12 s critical stabilization time for pump startup were quantified, making up for the deficiency of previous studies that only focused on a single transient process. Third, a practical operation strategy of “low displacement + slow pump startup + extended pump shutdown time” was proposed. Verification results show that this strategy can reduce the peak water hammer pressure by 18–25%, providing targeted technical support for the safety control of the CO2 injection wells, rather than being a simple application of general transient flow theory.
Therefore, this study focuses on the FSI vibration problem of the CO2 flooding injection wellbore strings under pump startup and shutdown conditions. By integrating multi-equation coupling models, the Method of Characteristics (MOC), and modern numerical simulation methods, it systematically analyzes the dynamic evolution laws of fluid and structural parameters, aiming to deepen the understanding of the transient vibration mechanism of the CO2 injection systems and provide theoretical support for downhole safety control.
2. Definition of Vibration Boundary Conditions for Tubing String During Start-Up and Shutdown Processes
This chapter is based on a four-equation FSI vibration model for CO2 flooding injection tubing strings. MATLAB 2023 software is used to program theoretical formulas to analyze the variation laws of fluid velocity, pressure, axial vibration velocity, and axial additional stress in the tubing under different flow rates and pressures during the start-up and shutdown processes. Based on the actual working conditions of start-up and shutdown, the following boundary conditions are mainly considered. During the start-up process, a time-varying flow rate inlet condition is defined, and an approximately linear flow rate growth model is used to reflect the flow rate change. During the shutdown process, the pressure–velocity coupling relationship at the pump station and wellhead is defined based on elastic water hammer theory, and reverse flow and pressure accumulation effects are introduced. Meanwhile, fixed constraints at the wellhead and free boundaries at the bottom of the well are applied to the structural domain of the tubing string. The fluid domain considers pipe wall friction and wellbore pressure propagation conditions, thus constructing a closed system reflecting fluid–structure interaction.
To accurately describe the coupling mechanism between fluid transient excitation and tubing string structural vibration during CO2 flooding injection, it is necessary to establish a system of governing equations that can simultaneously reflect fluid pressure–velocity dynamics and tubing string stress-vibration behavior. Based on fluid continuity, momentum conservation, and tubing string dynamics, this paper adopts the four-equation model for FSI vibration of CO2 flooding tubing strings [32] as the theoretical basis for analysis. The governing equations are as follows:
here is the fluid velocity in the tube; is the fluid pressure in the tube; is the axial vibration velocity of the tubing string; is the axial additional stress of the tubing string; f is the friction coefficient of the tubing string; uz is the axial vibration velocity of the tubing string.
2.1. Definition of Vibration Boundary Conditions During Start-Up Process
Taking the CO2 flooding injection well in an oilfield as an example, the parameters are set as shown in Table 2. Here, is the fluid velocity in the tube; is the fluid pressure in the tube; is the axial vibration velocity of the tubing string; is the axial additional stress of the tubing string.

Table 2.
Vibration parameters of CO2 flooding injection tubing string.
The start-up and shutdown processes can cause water hammer effects. Based on hydraulic characteristics, water hammer can be divided into rigid theory and elastic theory [1,33,34,35]. Rigid theory assumes the pipe wall is absolutely rigid and the fluid in the pipe is incompressible. Elastic theory considers the elasticity of the pipe material and the compressibility of the fluid. This theory is consistent with the actual production of the CO2 flooding injection tubing strings.
The motion equation of elastic theory is:
the continuous equation of elasticity theory is:
where is the head in the tubing string, m; is the coefficient of friction of the tubing string; is the flow rate in the tubing, m/s; is the angle between the tubing string and the horizontal plane; is the position coordinates, and the positive direction points to the bottom of the well.
The CO2 injection pump is a multi-cylinder piston pump, and the instantaneous flow rate of each cylinder in the single-pump state is:
then the total flow rate of the multi-cylinder piston pump , phase angle interval , ; , . In order to reduce the instantaneous displacement in the tube during the process of starting the pump displacement increase, the approximate linear displacement method is often applied, that is, the process of starting the pump displacement increase is approximately in line with the characteristics of the quadratic function:
where Q0 is the initial flow rate, m3/min; a is the slope of the flow–rate curve; t is the time to start the pump, s.
Qs = ±Asrω(sinφ + λsin2φ/2)
The internationally recognized Span–Wagner equation of state is adopted for CO2, which is applicable to CO2 in the range of 216–1100 K and 0–80 MPa and exhibits the highest accuracy. Its expression is given as follows:
where: (molar volume, m3/mol); R = 8.314 J/(mol·K) (gas constant of CO2);
T is the absolute temperature (K, set to 353 K); (reduced density; kg/m3 is the critical density of CO2); (reduced temperature; K is the critical temperature of CO2); are empirical constants (e.g., n1 = 0.3240248, d1 = 1).
This equation is incorporated into the model to enable real-time calculation of key physical properties of CO2, such as density and bulk modulus.
2.2. Definition of Vibration Boundary Conditions of Tubing String During Pump Stopping Process
Take the position coordinates of pumping station, the positive direction is pointing to the bottom of the well from the pumping station, the positive direction of flow rate is consistent with the positive direction of position coordinates, and the initial steady state flow rate is the initial steady state flow rate, so we can obtain the relation between head and flow rate in the transient process of stopping pumping and the change of flow rate with the position and time, i.e., the basic equations of stopping pumping and the effect of water hammer are as follows:
in the formula, is the total pressure drop wave value from the pump station to the well bottom; is the total pressure rise wave value from the well bottom to the pump.
H0 is the initial head when the pump stops; t is the pump stop time, s; a is the wave velocity, m/s; g is the gravitational acceleration, m/s2. When the pump stops running, the fluid in the tubing string will generate backflow [36,37], resulting in fluid pressure accumulation. Therefore, the physical boundary conditions of the tubing string are defined as follows:
comparison of pressure, flow rate, and before pump shutdown , among them .
In the equation: is the initial pressure of the pump; is the maximum flow rate at the initial shutdown; is the shutdown coefficient; is the total shutdown time. Then, the relationship between the pressure at the wellhead of the tubing string and time during the shutdown process is given by [13,38,39]:
the original form of Equation (11) (wellhead pressure during pump shutdown) is derived based on the elastic water hammer theory and pump characteristic curve, with its explicit expression given as follows:
where:
- p0 is the initial pressure at pump shutdown (Pa);
- is the maximum pressure increment due to water hammer (Pa);
- T is the total pump shutdown time (s);
- is the pump shutdown coefficient (dimensionless);
- is the pressure relaxation time (s);
- a is the CO2 pressure wave velocity (m/s);
- v0 is the steady-state flow velocity before pump shutdown (m/s).
3. Analysis of Parameter Influence Inside the Tubing String During Start-Up Process
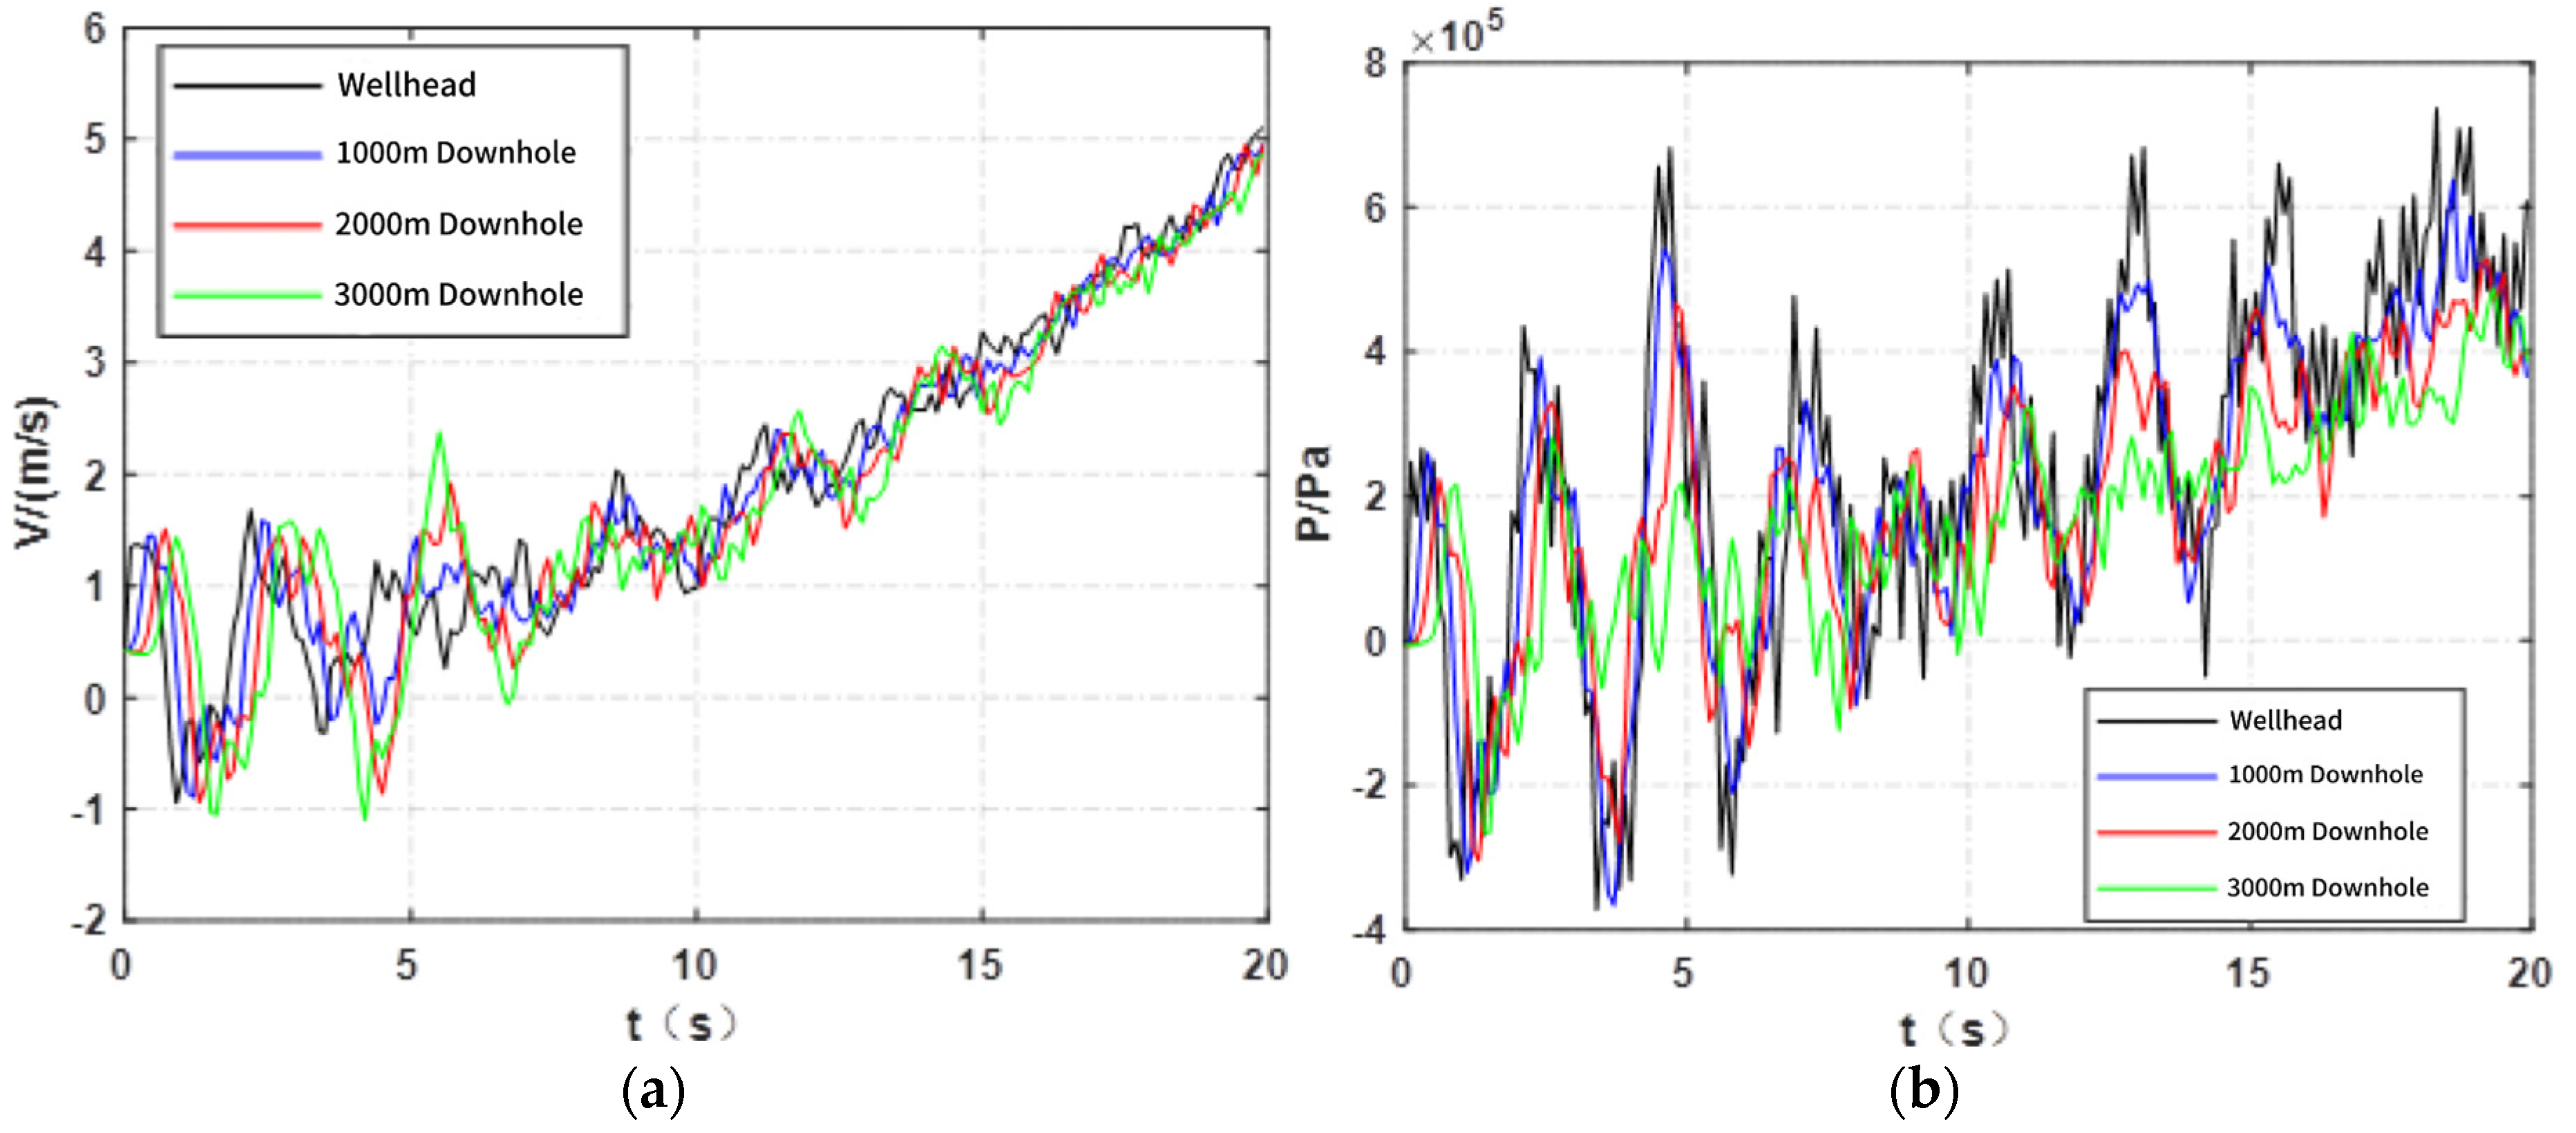
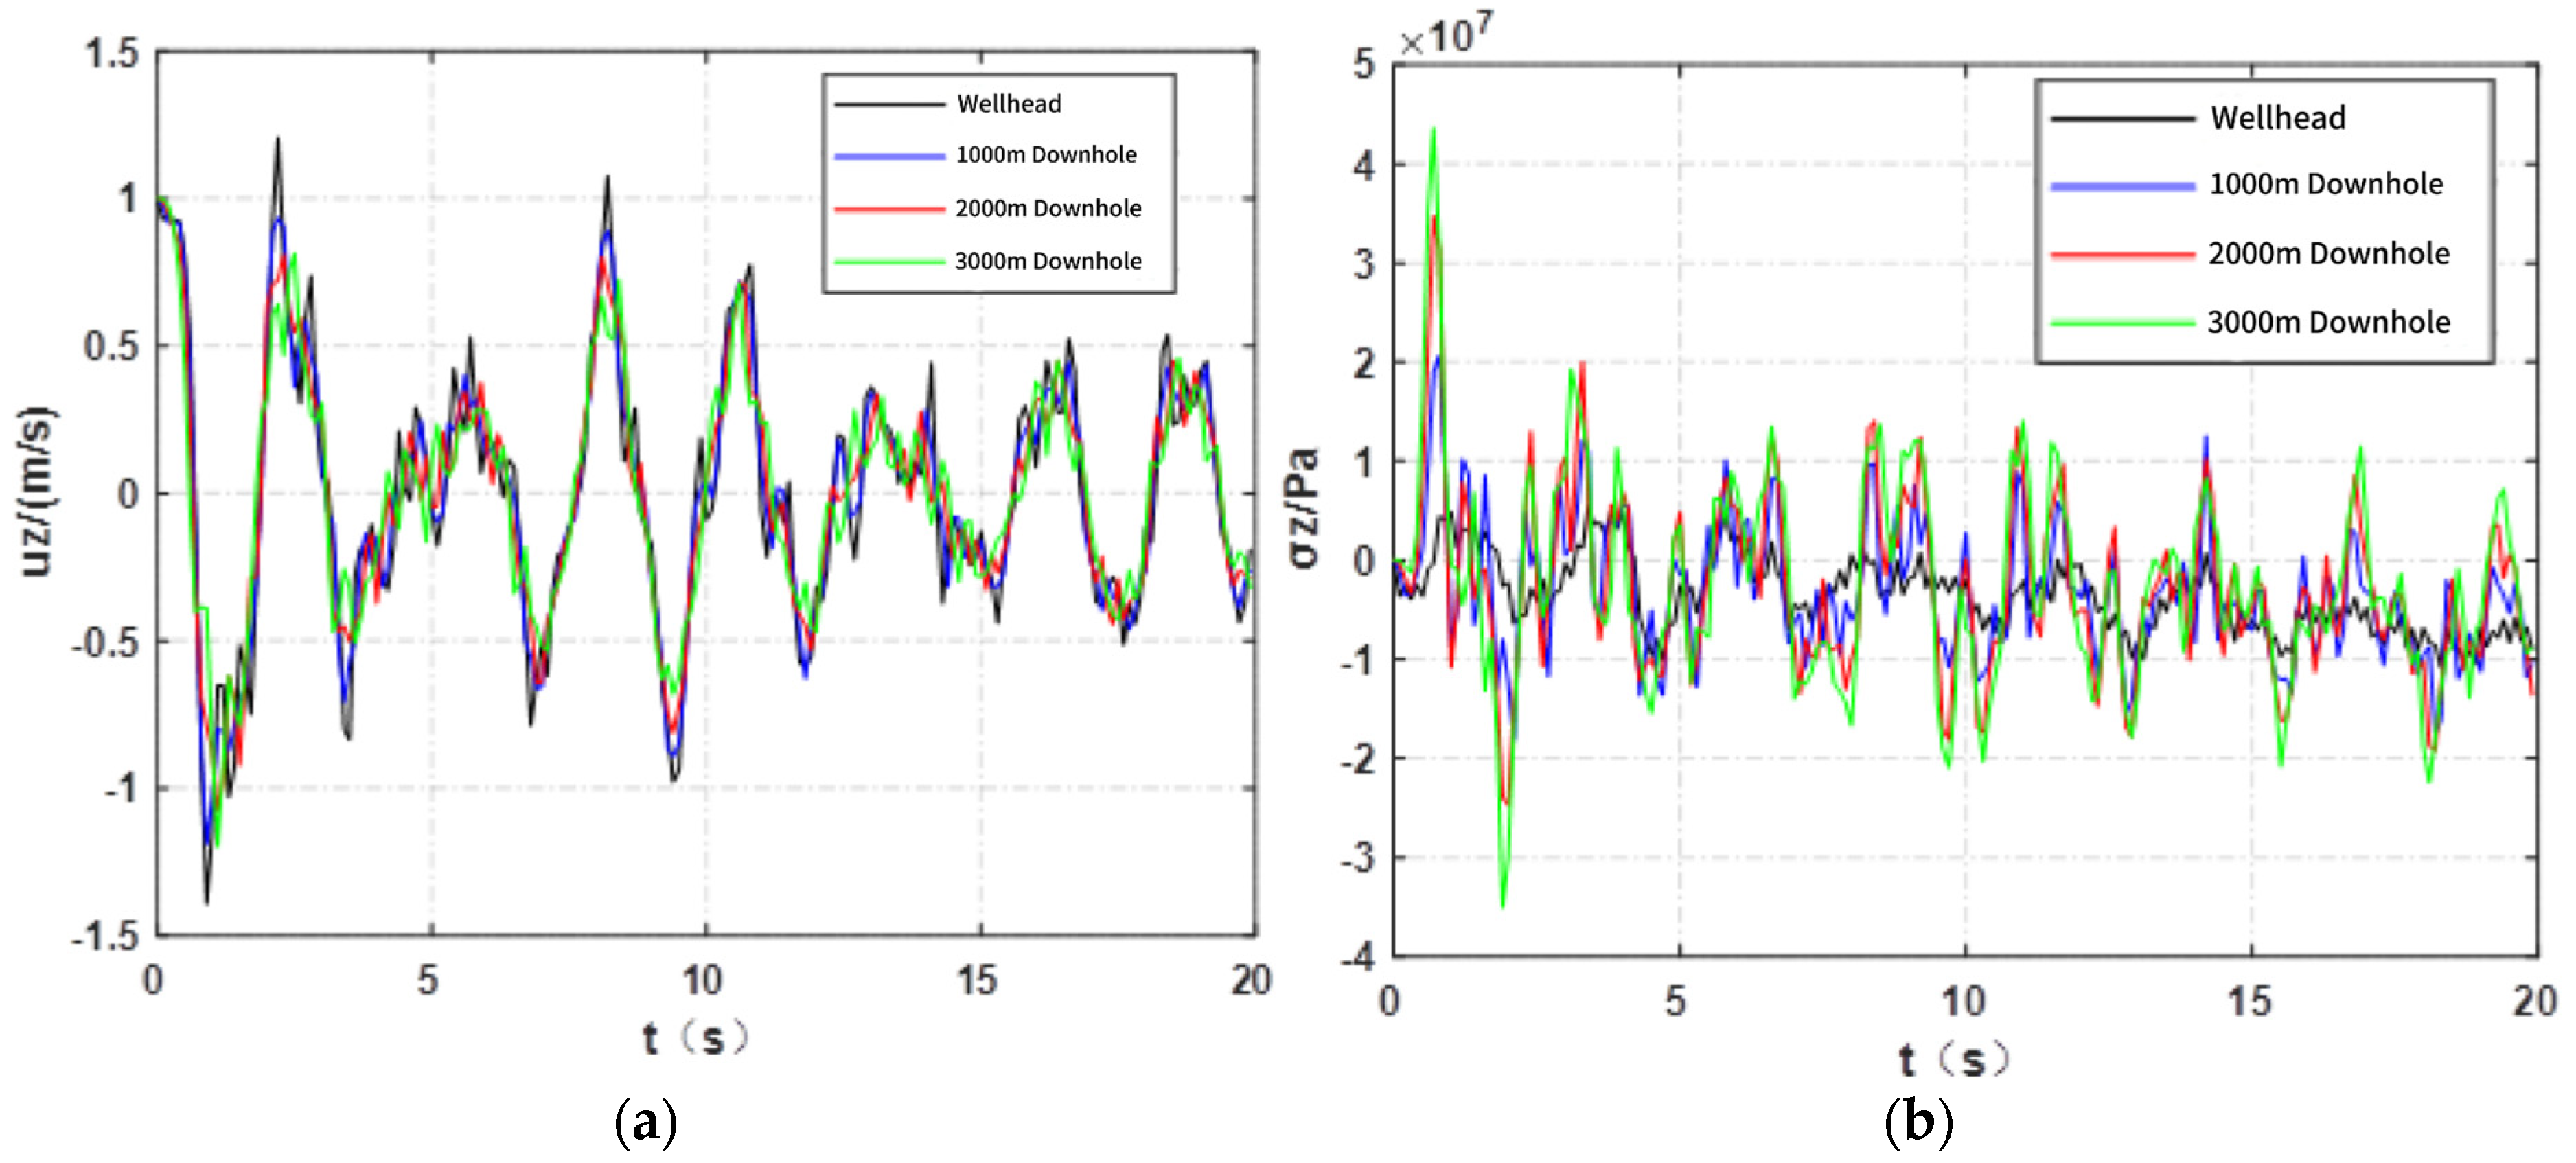
The CO2 flooding injection tubing string system mainly includes two parts: the fluid domain and the solid domain. Taking a start-up time of 20 s and a flow rate of 7 m3/h as an example, with other parameters shown in Table 1, based on the FSI vibration governing equations established by Equations (1) to (4), the software numerical solution method is used. Comparing the following four positions: the wellhead, downhole 1000 m, 2000 m, and 3000 m, the variation laws of fluid velocity and pressure in the tube over time during the start-up process are obtained, as shown in Figure 1. The variation curves of axial vibration velocity and axial additional stress of the tubing string over time are shown in Figure 2.
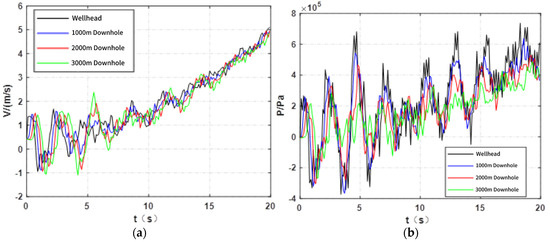
Figure 1.
Graph of fluid parameter variations in the tubing string during pump start-up. (a) Fluid velocity variation over time; (b) fluid pressure variation over time.
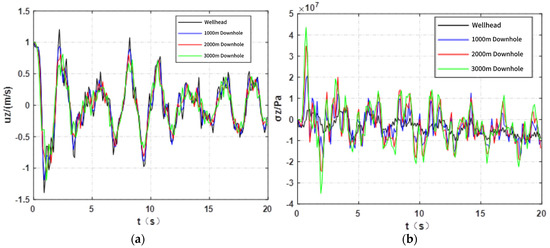
Figure 2.
Graph of variations in tubing string parameters during pump start-up. (a) Tubing string axial vibration velocity variation with time; (b) tubing string axial additional stress variation with time.
As shown in Figure 1a, during the start-up process, the flow velocity fluctuates approximately periodically with time, and the period strengthens with increasing time. The greater the flow velocity, the larger the fluctuation amplitude within 12 s after start-up, and the growth is relatively slow. After 12 s, the flow velocity fluctuation in amplitude decreases, the growth rate accelerates, and periodic changes become obvious. Figure 1b, shows the fluid pressure form during the start-up process fluctuates approximately periodically with time and shows an overall increasing trend. The fluid pressure fluctuation at the wellhead is large. As the well depth increases, the flow pressure fluctuation gradually weakens due to the friction effect of fluid flow. If the influence of static fluid column pressure is ignored, the fluid pressure in the tubing string can be expressed by.
Figure 2a shows the axial vibration velocity of the tubing string during the start-up process alternates between positive and negative, showing periodic fluctuations. The amplitude is large in the initial stage and gradually stabilizes as the pumping rate stabilizes. At the same time, the fluctuation of axial vibration velocity at the wellhead is severe, while it relatively decreases with an increase in well depth due to the fluid damping effect. Figure 2b shows the axial additional stress of the tubing string oscillates in a form that alternates between positive and negative over time, and the fluctuation form approximates a sine function. Due to the self-weight of the tubing string, the axial additional stress increases with well depth at the same time.
4. Analysis of the Influence of Injection Rate on Parameters Inside the Tubing String
During the CO2 flooding injection, factors such as changes in fluid velocity can cause structural displacement, i.e., tubing string vibration, leading to changes and damage in the mechanical properties of the tubing string [40,41,42]. Therefore, studying the dynamic characteristics of the CO2 flooding injection tubing strings involves comparing the changes in various parameters inside the tube under different injection rates. To study the influence of injection rate on the changes of various parameters inside the tubing string, the parameter changes at four sections of the tubing string—wellhead, downhole 1000 m, 2000 m, and 3000 m—are analyzed. The variation characteristics of fluid velocity and fluid pressure, axial vibration velocity of the tubing string, and axial additional stress of the tubing string are compared and investigated when the CO2 injection rate increases from 0 to 7 m3/h and 20 m3/h within 20 s of start-up.
4.1. Influence of Injection Rate on Fluid Velocity in the Tube
The influence of injection rates increasing from zero to 7 m3/h and 20 m3/h on the fluid velocity in the tube is shown in Figure 3. It shows that the fluid velocity form at the four sections fluctuates approximately periodically with the start-up time, and the period strengthens with increasing time. The greater the flow velocity, the larger the fluctuation. A small fluctuation occurs in the flow velocity within the first 2 s because the pump unit has not fully started, which has a greater impact on the flow rate. It should be noted that this proportional relationship is not purely linear. Affected by the periodic displacement output of the multi-cylinder plunger pump (Equation (7)), the flow velocity exhibits slight periodic fluctuations against the overall increasing trend (such as the fluctuations before 12 s as shown in Figure 4a,b). Additionally, as the well depth increases, the combined effect of fluid friction and gravitational component force causes a slight decrease in the slope of the flow velocity increase. Therefore, the relationship between flow velocity and displacement is closer to “quasi–linear”—that is, it shows proportionality macroscopically, while microscopically, nonlinear fluctuations exist due to the influence of transient operating conditions and spatial position. Figure 3a shows that as the well depth increases, the times for the flow velocity at each section to first reach the peak are as follows: 0.1 s, 0.4 s, 0.7 s, 0.9 s, and the corresponding fluid velocities are as follows: 1.347 m/s, 1.443 m/s, 1.51 m/s, 1.435 m/s. At 20 s after start-up, the flow velocity at the wellhead reaches 5.097 m/s, and at downhole 3000 m, it reaches 4.855 m/s. Figure 3b shows that the times for the flow velocity at each position in the tubing string to first reach the peak are as follows: 0.1 s, 0.4 s, 0.7 s, 0.9 s, and the corresponding fluid velocities are as follows: 2.15 m/s, 2.191 m/s, 2.217 m/s, 2.091 m/s. At 20 s after start-up, the flow velocity at the wellhead reaches 5.897 m/s, and at downhole 3000 m, it reaches 5.65 m/s.

Figure 3.
Effect of injection displacement on fluid velocity inside the tubing string. (a) Injection volume 7 m3/h; (b) injection volume 20 m3/h.

Figure 4.
The effect of injection displacement on the pressure of fluid inside the tubing string. (a) Injection volume 7 m3/h; (b) injection volume 20 m3/h.
Analysis of the data shows that as the well depth increases, the time for the first peak of fluid velocity in the tubing string is delayed, meaning the time for the fluid velocity to increase becomes longer. Under the same time, the flow velocity in the tube is proportional to the flow rate [43]. At the same position, the flow velocity is also proportional to the flow rate. That is, the greater the injection rate, the greater the flow velocity and the faster the growth rate. Within 12 s after start-up, because the multi-cylinder pump unit has not fully started, the flow velocity fluctuation amplitude is large and the growth is relatively slow. After 12 s, the multi-cylinder pump unit is fully started, the flow rate is stable, the fluid velocity fluctuation amplitude decreases, the growth rate accelerates, and periodic changes become obvious.
4.2. Influence of Injection Rate on Fluid Pressure in the Tube
The influence of injection rates increasing from zero to 7 m3/h and 20 m3/h on the fluid pressure in the tube is shown in Figure 4. Affected by downhole pressure fluctuations, the flow pressure in the tube will superimpose, resulting in peaks and maximum values. As shown in Figure 4a, the flow pressure reaches a peak of 0.682 MPa at 4.7 s, a peak of 0.682 MPa at 13.1 s, and a maximum value of 0.736 MPa at 18.3 s. As shown in Figure 4b, the flow pressure reaches a peak of 0.775 MPa at 4.7 s, a peak of 0.748 MPa at 13.1 s, and a maximum value of 0.813 MPa at 18.3 s. That is, as the flow rate increases, the time for the fluid pressure to reach the extreme value remains unchanged, but the value increases.
Analysis of the graphs and data shows that the flow pressure from the four sections fluctuates approximately periodically with the start-up time, showing an increasing trend. The flow pressure fluctuation at the wellhead is large. As the well depth increases, the flow pressure fluctuation gradually weakens due to the friction effect of fluid flow. The periodic patterns under different flow rates are similar. The large fluctuation period is 2.2 s, and due to the coordination between pump units, the flow pressure produces small fluctuations within 0.2 s. If the influence of static fluid column pressure is ignored, the fluid pressure in the tubing string can be expressed by.
4.3. Influence of Injection Rate on Axial Vibration Velocity of Tubing String
The influence of injection rates increasing from zero to 7 m3/h and 20 m3/h on the axial vibration velocity of the tubing string is shown in Figure 5. Figure 5a shows the positive and negative maximum values of axial vibration velocity of the tubing string appear at 2.2 s, 1.194 m/s, and 0.9 s, −1.382 m/s. Figure 5b shows that the positive and negative maximum values appear at 2.2 s, 1.206 m/s, and 0.9 s, −1.394 m/s. This indicates that the flow rate has little effect on the value and oscillation period of the axial vibration velocity.

Figure 5.
Effect of injection displacement on the axial vibration velocity of the tubing string. (a) Injection volume 7 m3/h; (b) injection volume 20 m3/h.
As shown in Figure 5, the axial vibration velocity of the tubing string during the start-up process shows periodic fluctuations alternating between positive and negative with increasing time. The large period is 2 s, and due to the coordination between pump units, there is a small period fluctuation of 0.6 s. In the initial stage of start-up, due to the instability of the pumping rate, the vibration amplitude of the axial vibration velocity of the tubing string is large. As time increases, the pumping rate tends to stabilize and then gradually stabilize after 12 s. At the same time, the axial vibration velocity at the wellhead fluctuates violently. However, due to the fluid damping effect and the fact that energy has not been transmitted to the bottom of the well in a short time, the fluctuation relatively decreases with an increase in well depth.
4.4. Influence of Injection Rate on Axial Additional Stress of Tubing String
The influence of injection rates increasing from zero to 7 m3/h and 20 m3/h on the additional axial stress of the tubing string is shown in Figure 6. When starting the pump for 0.7 s, the values of reaching the first positive peak are as follows: 4.45 MPa, 19.12 MPa, 34.76 MPa, and 43.6 MPa. When starting the pump for 1.9 s, the values of reaching the first negative peak are as follows: −2.5 MPa, −7.87 MPa, −23.85 MPa, and 34.89 MPa. According to the figure, the oscillation form of the axial vibration, additional stress of the tubing string, alternates between positive and negative with increasing start-up time and approximates a sine wave. The first period fluctuation is the most severe, and then it gradually stabilizes. Based on the self-weight of the tubing string, at the same start-up time, it increases in well depth, and at the same well depth, it increases in flow rate.

Figure 6.
Effect of injection displacement on axial additional stress on the tubing string. (a) Injection volume 7 m3/h; (b) Injection volume 20 m3/h.
5. Analysis of Parameter Influence Inside the Tubing String During Shutdown Process
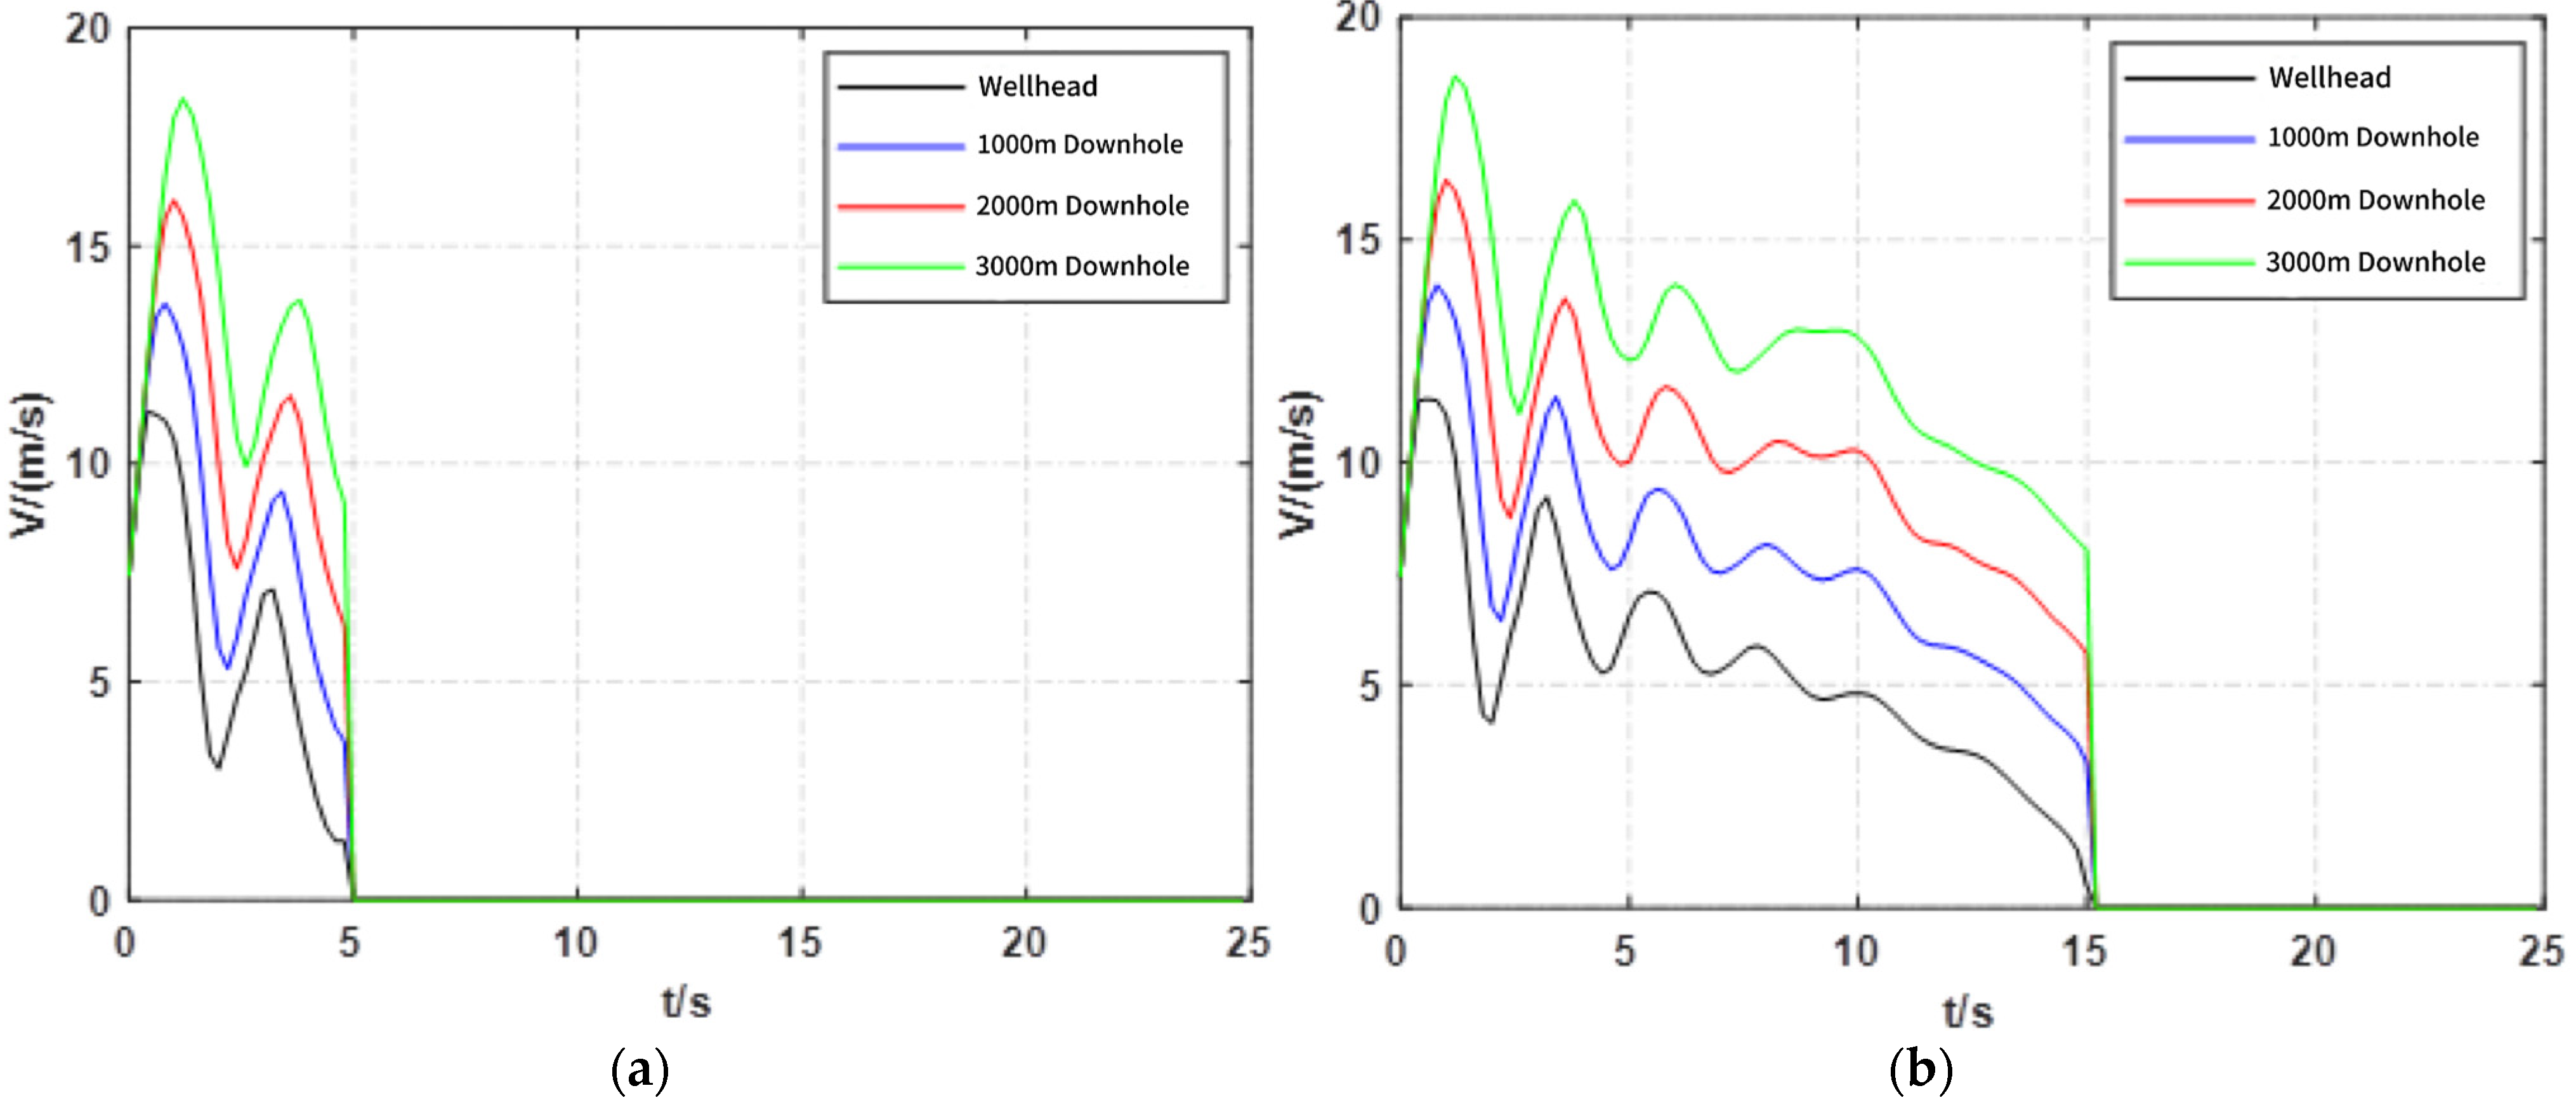
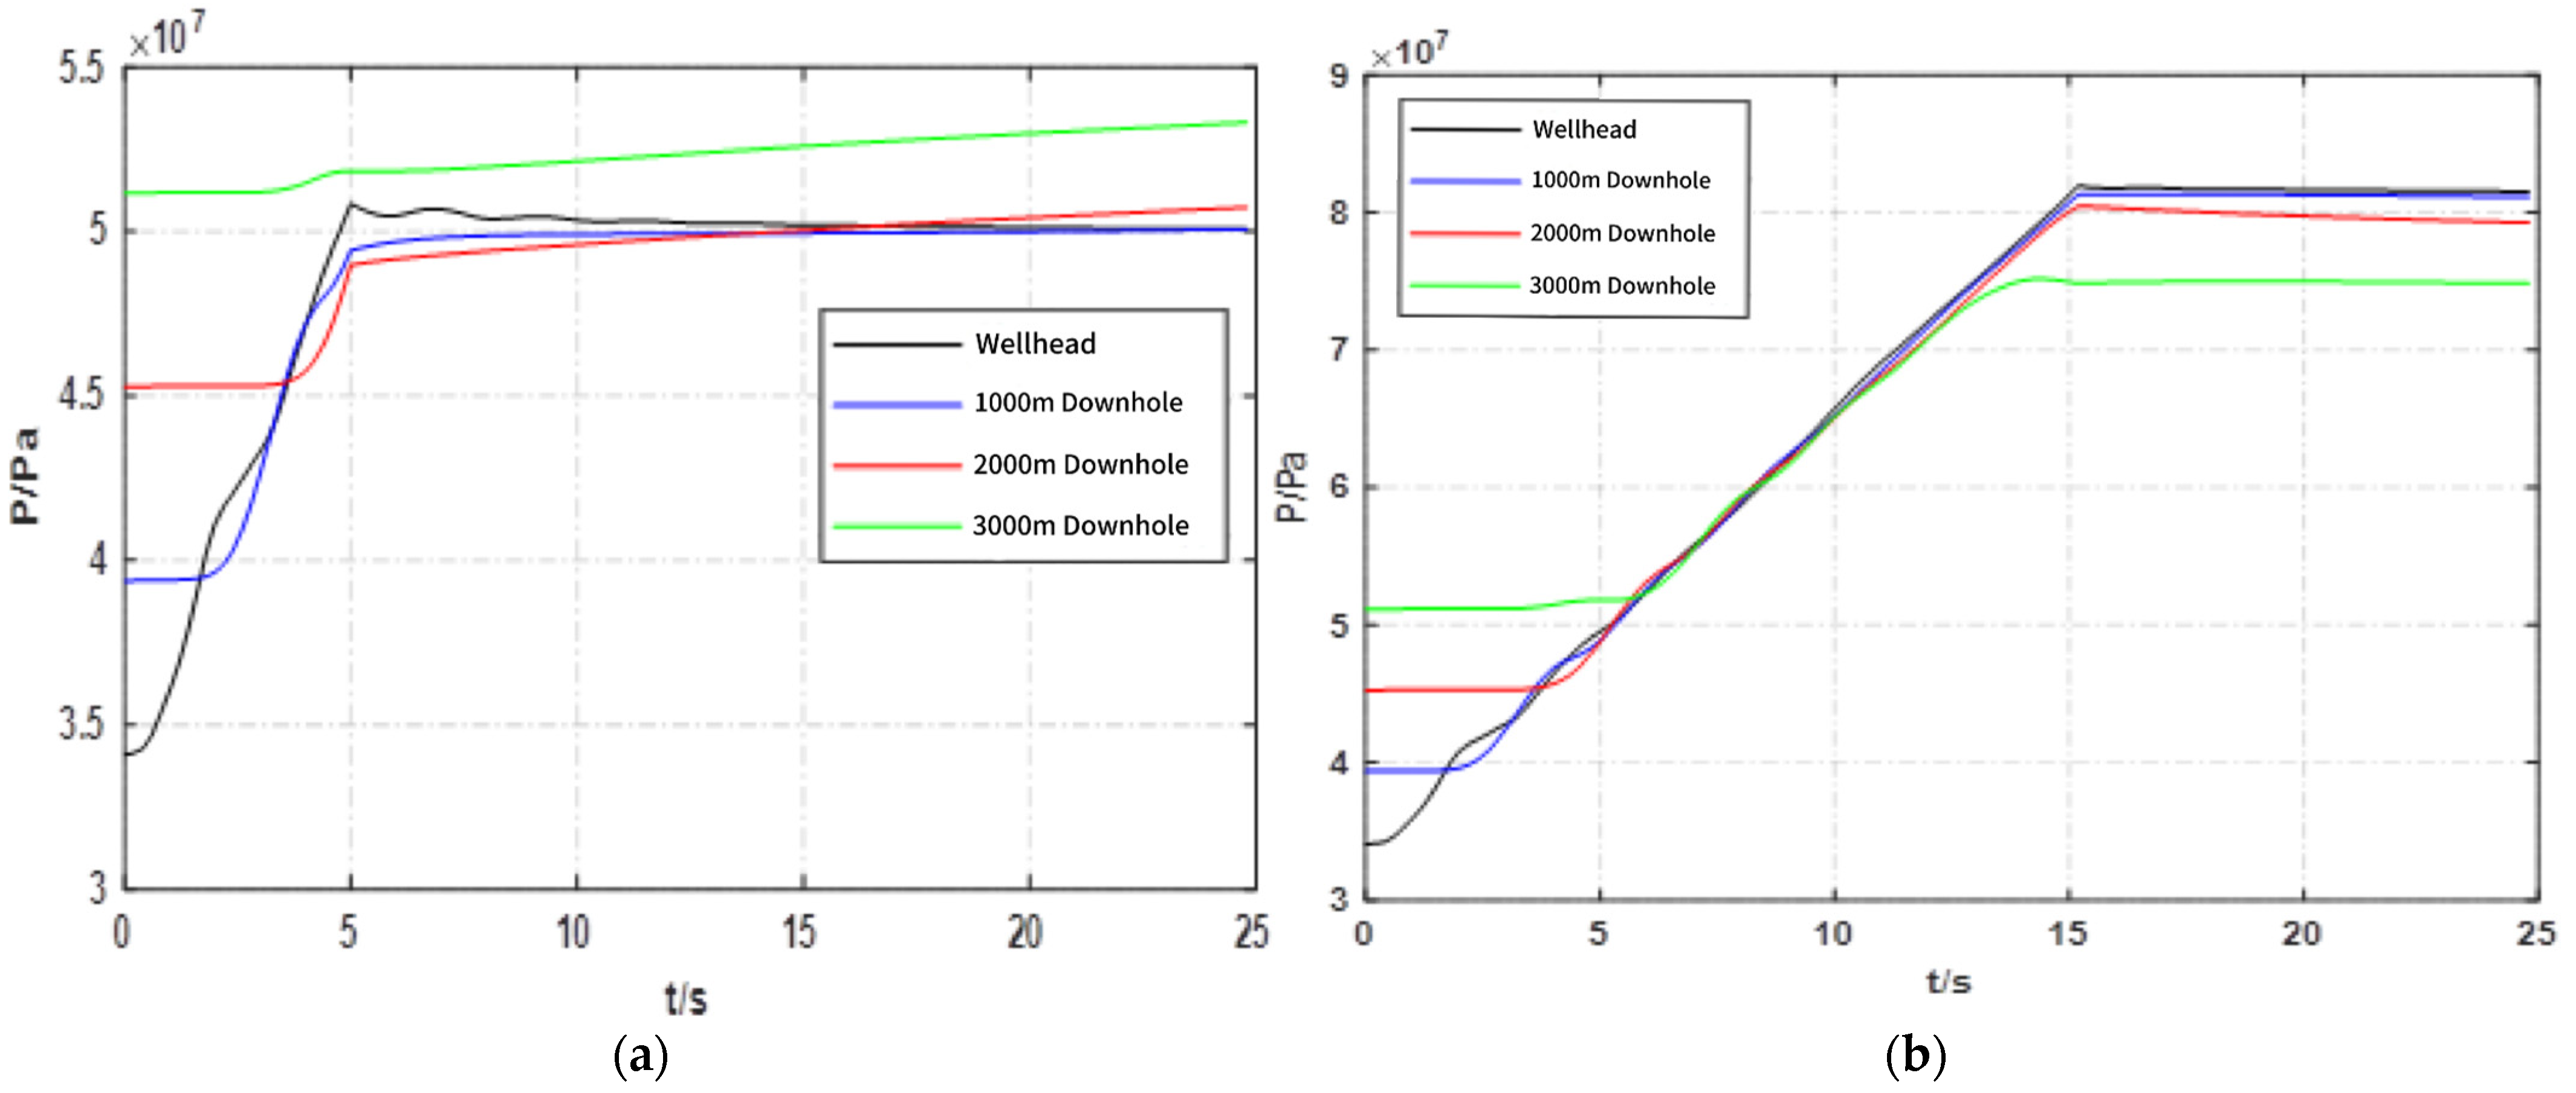
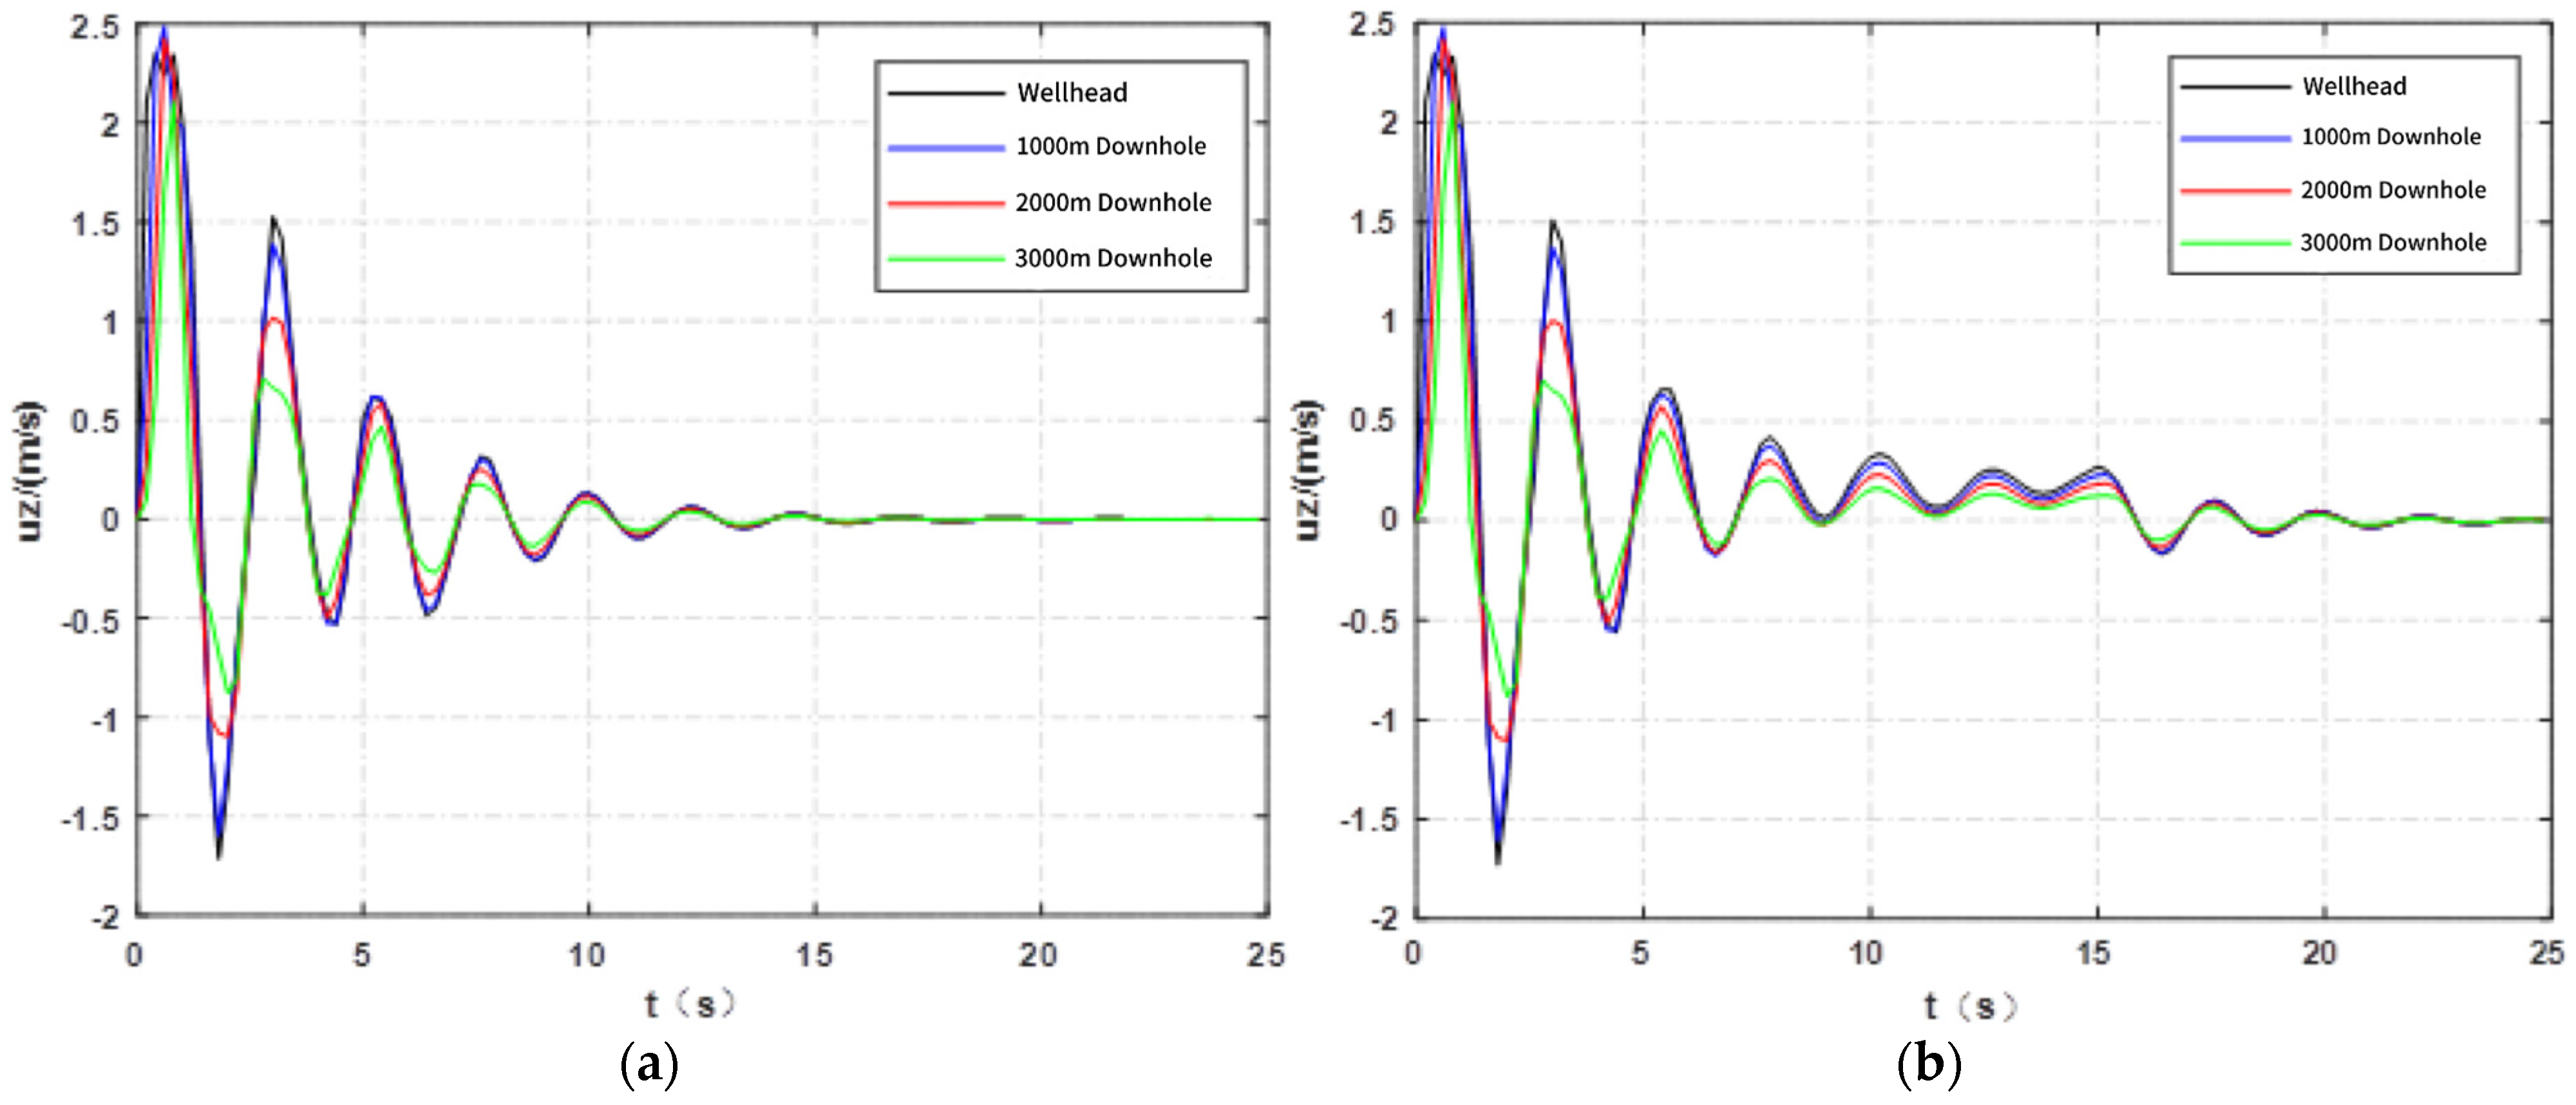
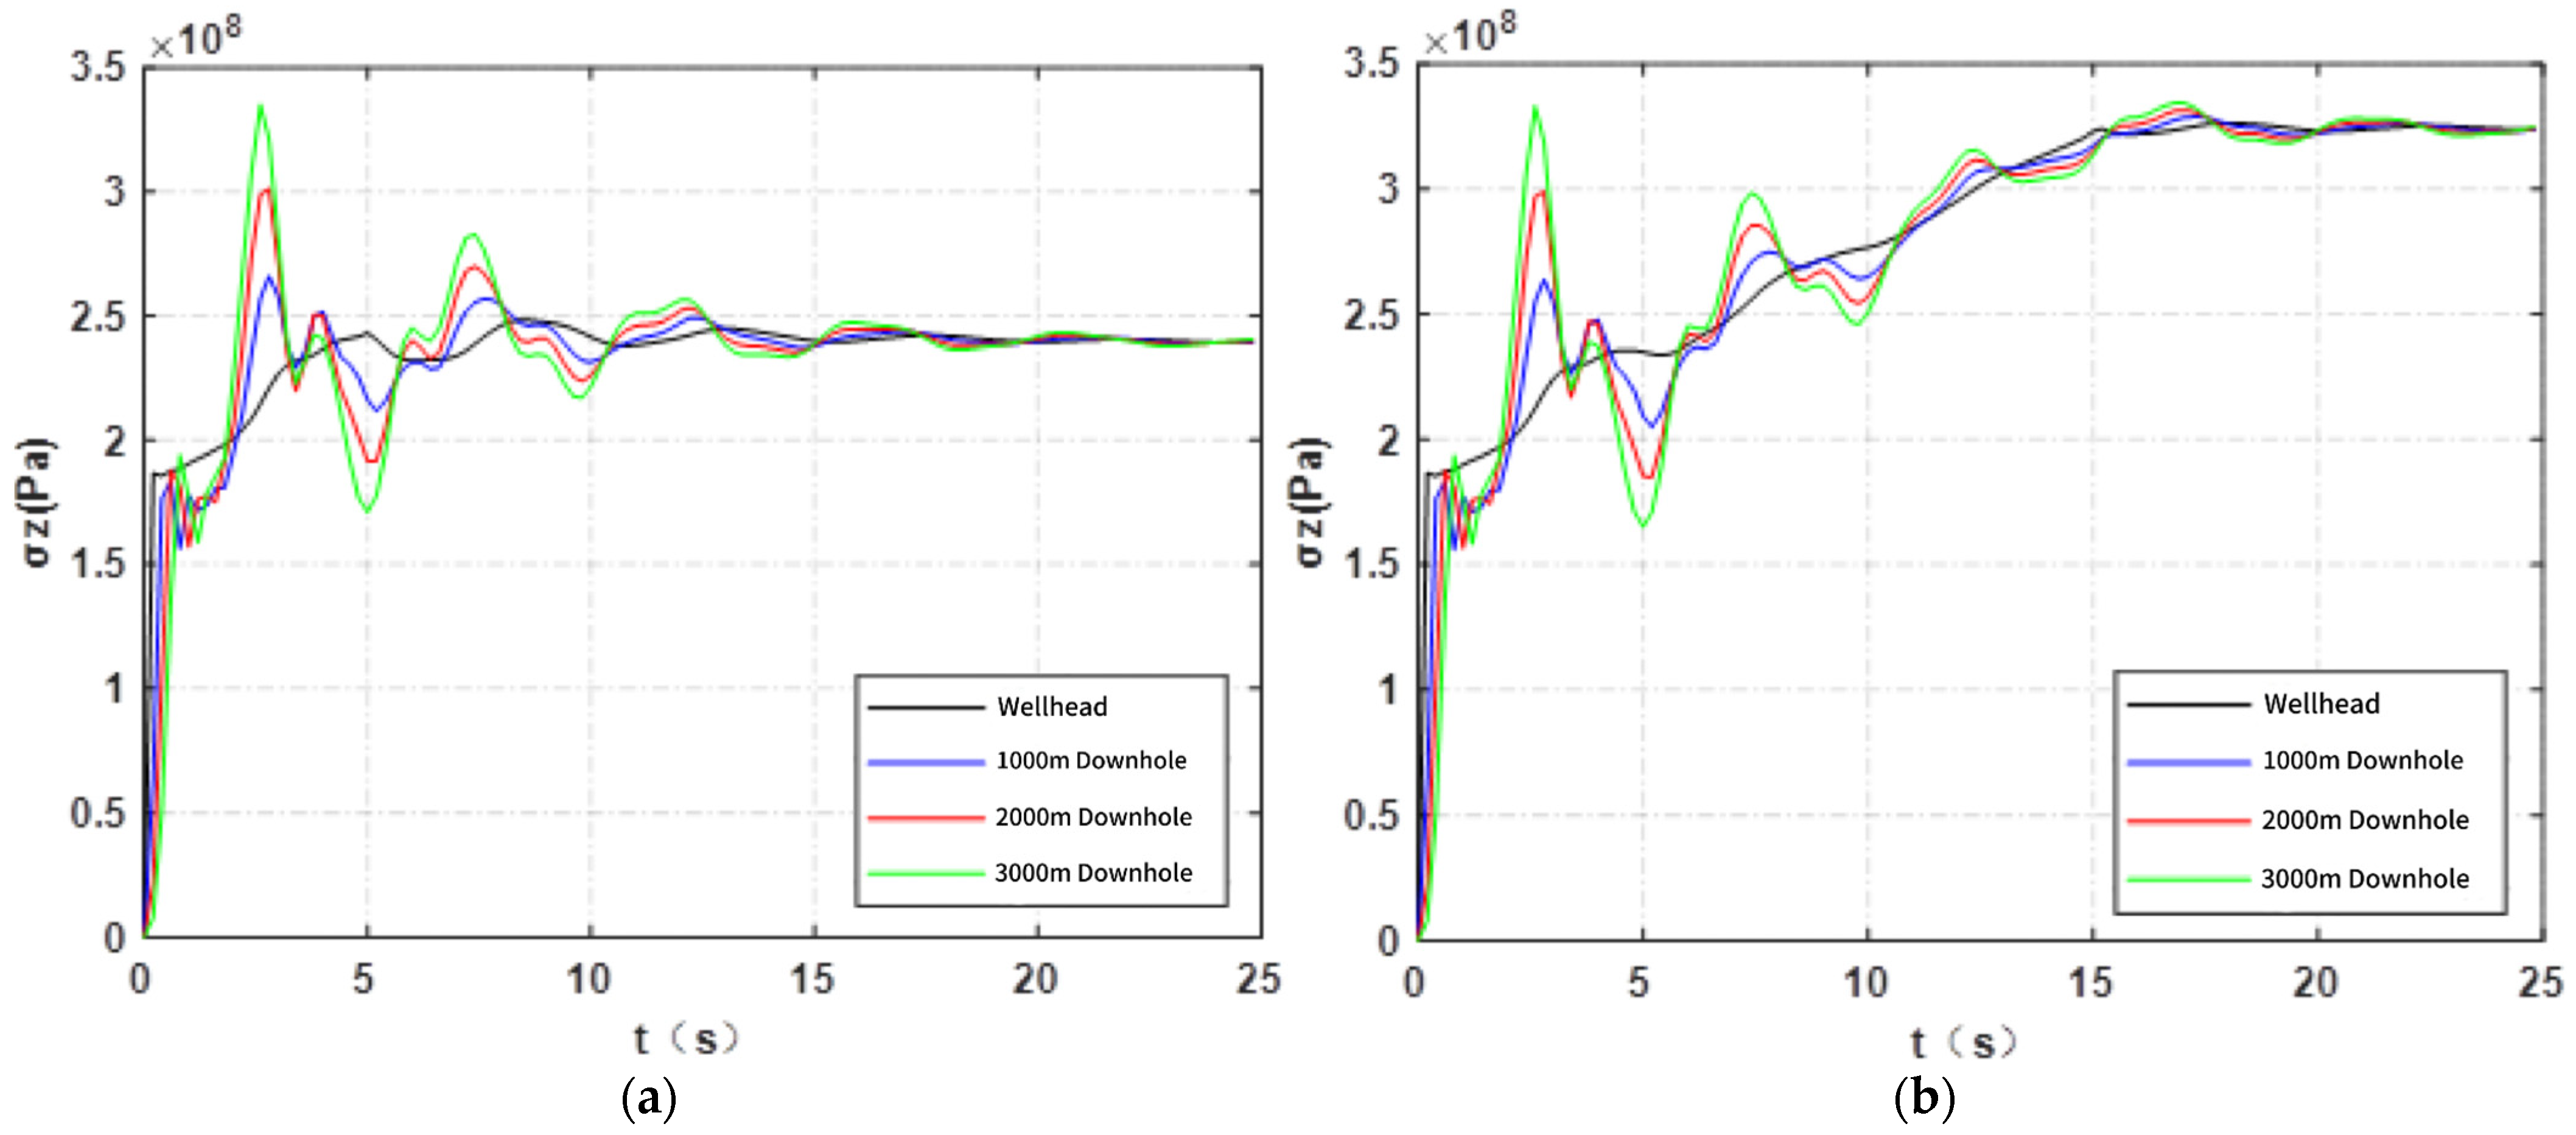
The CO2 flooding injection tubing string system mainly includes the following two parts: the fluid domain and the solid domain. Taking shutdown times of 5 s and 15 s and a flow rate of 7 m3/h as examples, with other parameters shown in Table 1, based on the FSI vibration model and shutdown boundary conditions established by Equations (9) to (11), the numerical method is used for solutions. Comparing the following four positions: the wellhead, downhole 1000 m, 2000 m, and 3000 m, the variation curves of fluid velocity in the tube over time under different shutdown times are obtained, as shown in Figure 7. The variation law of fluid pressure is shown in Figure 8. The axial vibration velocity of the tubing string is shown in Figure 9. The relationship between axial additional stress and time is shown in Figure 10.
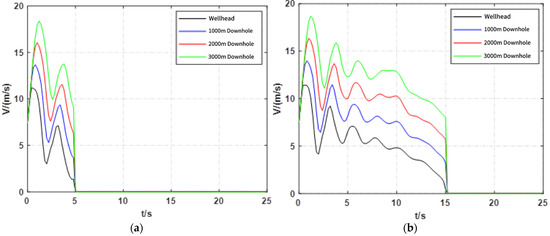
Figure 7.
Effect of pump shutdown time on fluid flow rate. (a) Fluid flow rate change after stopping the pump for 5 s; (b) fluid flow rate changes when the pump is stopped for 15 s.
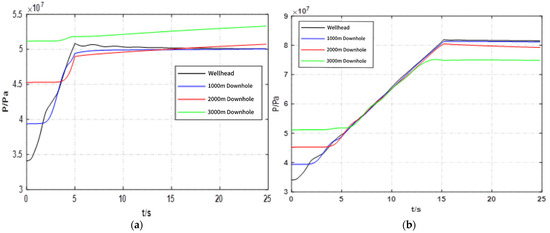
Figure 8.
Effect of pump shutdown time on fluid pressure. (a) Fluid pressure change after stopping the pump for 5 s; (b) fluid pressure change after stopping the pump for 15 s.
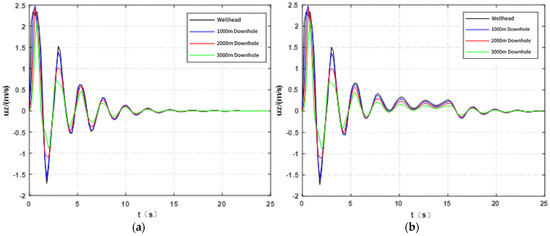
Figure 9.
Effect of pump shutdown time on axial vibration velocity of tubing string. (a) Axial vibration velocity variation of tubing string at 5 s after pump shut-down; (b) axial vibration velocity variation of tubing string at 15 s after pump shut-down.
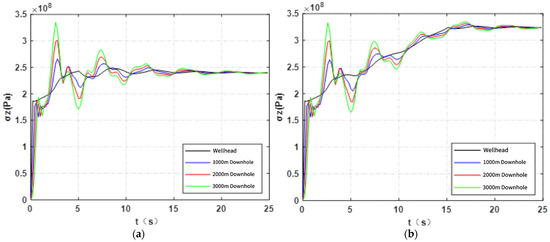
Figure 10.
Effect of pump shutdown time on additional stress caused by axial vibration of the tubing string. (a) Axial additional stress variation of tubing string at 5 s after pump shut-down; (b) axial additional stress variation of tubing string at 15 s after pump shut-down.
5.1. Influence of Shutdown Time on Fluid Velocity
The influence of shutdown times of 5 s and 15 s on the fluid velocity in the tube is shown in Figure 7. Figure 7a shows the graph shows an overall oscillating downward trend, with a large oscillation amplitude. The direction is all within the positive range, and at 5 s and thereafter, the flow velocity at all positions in the tube is zero. Figure 7b shows the graph declines overall, with severe oscillations in the early stage and then gradually smooths out. At 15 s and thereafter, the flow velocity at all positions in the tube is zero.
Because the shutdown process is carried out alternately between pump units, the flow velocity oscillates and decreases until it completely stops. At the shutdown moment and thereafter, the flow velocity at all positions in the tube is zero, meaning there is no fluid flow in the tube. The graph of fluid velocity in the tube changes approximately periodically with time, and the oscillation trends at various positions are the same. Due to the initial velocity of the flow velocity and the influence of gravity, at the same time, the flow velocity in the tube increases with well depth. Because the fluid flow process carries certain pressure, the transient condition of shutdown will generate a reverse impact in the tube, thereby triggering the water hammer effect and exacerbating damage to the tubing string [14,44,45,46,47]. The physical process of the water hammer effect can be briefly described as follows: at the moment of pump shutdown, the fluid inside the pipeline continues to flow toward the wellbore bottom due to inertia, causing a sudden drop in the fluid pressure at the pump outlet and forming a low-pressure zone. Driven by the pressure difference, the subsequent fluid flows back in the reverse direction and collides with the fluid flowing in the forward direction inside the pipeline, generating pressure waves. These pressure waves propagate back and forth along the wellbore string (e.g., from the wellhead to the wellbore bottom and then reflecting back to the wellhead), triggering violent fluctuations in the internal pressure of the pipeline and oscillations in fluid flow velocity. Such periodic pressure impacts and flow velocity changes act on the inner wall of the wellbore string, forcing the string to produce axial vibration. If the amplitude of the pressure wave is excessively large or the vibration frequency is close to the natural frequency of the wellbore string, it may easily lead to fatigue damage or local plastic deformation of the string.
5.2. Influence of Shutdown Time on Fluid Pressure
The influence of shutdown times of 5 s and 15 s on the fluid pressure in the tube is shown in Figure 8. Figure 8a shows that the difference between the initial and final fluid pressure at the wellhead is the largest, and it weakens sequentially with increasing well depth. However, due to the short shutdown time, the pressure wave has not been transmitted to downhole 3000 m, so the pressure fluctuation there shows no obvious change. Figure 8b shows that the fluid pressure at all sections of the tubing string is affected by the shutdown. The longer the shutdown time, the smaller the slope of the pressure increase. As the well depth increases, the difference between the initial and final fluid pressure becomes smaller, and the stable flow pressure value is lower.
Figure 8 shows that the initial value of fluid pressure in the tubing string increases with well depth. The flow pressure value shows an upward trend with shutdown time and gradually stabilizes after reaching the set shutdown time. Shutdown has a greater impact on the wellhead, and it weakens sequentially with increasing well depth. Increasing the shutdown time can reduce the pressure change rate and protect the tubing string.
5.3. Influence of Shutdown Time on Axial Vibration Velocity of Tubing String
The influence of shutdown times of 5 s and 15 s on the axial vibration velocity of the tubing string is shown in Figure 9. Figure 9a shows that after 5 s of shutdown, due to the inertia of the tubing string itself, the vibration form still fluctuates, and it completely stabilizes at 16.4 s, taking 11.4 s. Figure 9b, shows that at 15 s shutdown, the vibration form graph drops sharply and gradually stabilizes, completely stabilizing at 22.8 s, taking 7.8 s. That is, as the shutdown time increases, the graph fluctuation becomes smoother, and the time from shutdown to complete stabilization is shorter.
As shown in Figure 9, under the same shutdown time, the axial vibration velocity value at the wellhead is the largest. Due to the influence of fluid damping, the vibration velocity decreases sequentially with an increase in well depth. The axial vibration velocity form of the tubing string shows positive and negative fluctuations with a period of about 2.3 s over time. The longer the shutdown time, the more periods there are, and the slower the fluctuation value decreases.
5.4. Influence of Shutdown Time on Axial Additional Stress of Tubing String
The influence of shutdown times of 5 s and 15 s on the additional axial stress of the tubing string is shown in Figure 10. Figure 10a shows that the value of axial additional stress of the tubing string in the graph finally stabilizes near 240 MPa. As shown in Figure 10b, the value in the graph finally stabilizes near 325 MPa.
Figure 10 shows that the axial additional stress of the tubing string fluctuates periodically with time, with a period of about 4.8 s. The oscillation is severe in the early stage and then gradually smooths out. At the same time, the additional stress fluctuation at the wellhead is small. Due to factors such as the self-weight of the tubing string, the additional stress fluctuation intensifies with increasing well depth. At the same well depth, the longer the shutdown time, the longer the fluid acts, and the larger the value at stability. When analyzing the influence of internal parameters of the tubing string during the shutdown process, the following multi-faceted insights and methods can be integrated: the FSI analysis framework for rotor-stator contact under flow field motion and viscous effects, optimization modeling methods based on material performance characterization, fractional order damping parameter identification technology in structural dynamics, research paradigms for mechanical response of structures under dynamic excitation, and asymptotic analysis methods for vibration characteristics. Through this integration, the mechanism of shutdown time on fluid velocity, pressure, axial vibration velocity, and axial additional stress can be further clarified, thereby enhancing the depth and reliability of the analysis of tubing string dynamic behavior during the shutdown process.
This study focuses on the core safety issue of fluid–structure interaction (FSI) vibration and water hammer in the CO2 flooding injection strings under transient pump startup/shutdown. Aiming to ensure injection-production safety and support large-scale CO2 flooding, it uses the FSI four-equation model, Method of Characteristics (MOC), and numerical simulations to analyze dynamic responses of fluid velocity, pressure in the string, and the string’s axial vibration velocity/additional stress during pump startup/shutdown.
First, it clarifies the background: the CO2 flooding offers dual benefits of enhanced oil recovery and greenhouse gas sequestration, but the injection string—key for fluid transport—risks structural failure from severe vibration and water hammer during transient pump operations. Previous studies mostly focused on conventional fluids, with insufficient attention to strongly non-linear CO2. Next, it establishes the analysis basis by defining boundary conditions for startup/shutdown (e.g., time-varying inlet flow for startup, pressure–velocity coupling, and reverse flow for shutdown), then explores parameter changes during startup, effects of different injection displacements, and impacts of various shutdown durations. Key findings: vibration is most intense within 12 s post-startup; higher injection displacement increases in peak water hammer pressure; longer shutdown duration reduces impact load. Operational strategies—low-displacement slow startup and properly extended shutdown—are proposed.
In terms of research focus: domestic studies prioritize field conditions, practical engineering solutions, and actionable safety controls; international studies focus on vibration mechanism analysis under extreme conditions (e.g., high temp/pressure) and refined numerical models. This study integrates mechanism analysis and engineering application, with a focus on the coupling mechanism of CO2 phase transition, friction characteristics, and string dynamic response. It addresses gaps in conventional fluid research and provides targeted theoretical support for the safety design and operation control of the CO2 injection wells.
6. Conclusions
This study established a fluid–structure interaction (FSI) vibration model for the CO2 flooding injection tubing string system. Combining the method of characteristics (MOC) with numerical simulation methods, it systematically analyzed the dynamic response behaviors of fluid parameters inside the tubing and the tubing string structure during transient start-up and shutdown processes. The spatiotemporal evolution laws of flow velocity, pressure, axial vibration velocity, and additional stress of the tubing string under two typical unsteady conditions (start-up and shutdown) were clarified, and the influences of different injection rates and shutdown times on the system’s dynamic characteristics were investigated. The main conclusions are as follows:
1. During the start-up process, the velocity and pressure of the fluid inside the tubing exhibit periodic oscillation, with the oscillation amplitude increasing gradually over time. The axial vibration velocity and axial additional stress of the tubing string show strong instability in the initial stage of start-up, and gradually stabilize after the multi-cylinder pump is fully activated. This regularity indicates that adopting a “low flow rate—long cycle” start-up strategy can effectively suppress transient impact and thereby reduce the risk of fatigue damage to the tubing string.
2. The injection rate has a significant impact on the dynamic response of the fluid domain; as the injection rate increases, the oscillation amplitudes of fluid velocity and pressure increase accordingly, while their oscillation periods do not change significantly. In contrast, structural response parameters such as the axial vibration velocity and axial additional stress of the tubing string are more affected by the combined action of the tubing string’s own weight and fluid damping, and the influence of changes in injection rate on these parameters is relatively weak. This implies that in high-speed injection scenarios, focus should be placed on the effects of the tubing string’s structural inertia and boundary constraint conditions.
3. During the shutdown process, the fluid velocity inside the tubing gradually decreases in a non-flow state in an oscillating manner. After experiencing a short period of transient impact, the fluid pressure and parameters related to the tubing string’s structural vibration gradually attenuate and reach a stable state. A short shutdown time tends to trigger a more intense water hammer effect, leading to increased stress fluctuations in the tubing string and thus raising the possibility of local plastic deformation or connection failure of the tubing string. In contrast, appropriately extending the shutdown time helps to mitigate pressure wave propagation and structural vibration, thereby improving overall operational safety.
In summary, this study clarifies the FSI vibration mechanism of the CO2 flooding injection tubing strings under transient start-up and shutdown conditions. The established model and derived conclusions provide a theoretical basis for optimal design, safety control, and vibration suppression measures in high-pressure injection systems. Future research can further conduct experimental verification of multi-physical field coupling and explore methods for fatigue life prediction and intelligent control of tubing string systems under complex working conditions.
Author Contributions
Conceptualization, X.W. and J.L.; methodology, X.W.; software, D.C.; validation, X.W., J.L., and D.C.; formal analysis, D.C.; investigation, D.C.; resources, X.W.; data curation, J.L.; writing—original draft preparation, Y.C.; writing—review and editing, X.L.; supervision, X.W.; project administration, Y.D.; funding acquisition, Y.C. All authors have read and agreed to the published version of the manuscript.
Funding
This research was funded by the National Natural Science Foundation of China project. Project Number:52274006.
Data Availability Statement
The original contributions presented in this study are included in the article. Further inquiries can be directed at the corresponding author.
Conflicts of Interest
Authors Xiangyang Wu, Jianxun Li, Dong Chen were employed by the company Yanchang Oilfield Co., Ltd. The remaining authors declare that the research was conducted in the absence of any commercial or financial relationships that could be construed as a potential conflict of interest.
References
- Jin, Z.; Jiang, N.C.; Wang, X.H.; Guan, X.W. Water Hammer and Its Prevention During Pump Shutdown, 2nd ed.; China Architecture & Building Press: Beijing, China, 2004. [Google Scholar]
- Xu, Z.G. Numerical Simulation and Visualization Technology of Pump Shutdown Water Hammer; Hunan University: Changsha, China, 2009. [Google Scholar] [CrossRef]
- Ding, J.D.; Lian, Z.H.; Ding, Y.R.; Zhang, Q.; Liu, J.W. Simulation Tests and Vibration Pattern Analysis of Injection and Production Tubing in Gas Storage Reservoirs. Pet. Tubing Instrum. 2019, 5, 30–34. [Google Scholar] [CrossRef]
- Wang, J.P. Analysis and Experimental Research on Fluid-Solid Coupling Vibration Characteristics of Gas Production Tubular; Xi’an Shiyou University: Xi’an, China, 2021. [Google Scholar] [CrossRef]
- Dou, Y.H.; Wang, L.Q.; Liu, J.C. Safety Analysis of Completion Tubing Vibration under Switching Well Conditions. Pet. Field Mach. 2015, 44, 11–15. [Google Scholar] [CrossRef]
- Zhu, F.; Ye, Y. Research on Water Hammer Protection Measures for Pump-Stopping in Long-Distance Water Transmission Projects. Water Conserv. Sci. Technol. Econ. 2021, 27, 1–6. [Google Scholar] [CrossRef]
- Xu, Z.X.; Wan, J.F.; Hong, Y.; Liu, H.M.; Yi, X.Z.; Diao, B.B.; Wang, Y.B. Analysis of three-dimensional nonlinear fluid-solid coupling vibration characteristics of coalbed methane abandoned well plugging string. Coal Geol. Explor. 2024, 52, 174–186. [Google Scholar] [CrossRef]
- Yang, W.W.; Li, H.; Lin, Y.; Ren, S.W.; Zhang, Z.L.; Xu, S.J.; Li, F.Q. Vibration mechanics analysis of a perforating string under the influence of multiple factors. J. Vib. Shock 2024, 43, 223–229. [Google Scholar] [CrossRef]
- Dou, Y.H.; Zhao, X.B.; Mi, H.X.; He, J.L.; Niu, Z.S.; Li, M.F. Mechanical performance analysis of downhole safety valve of completion string under typical working conditions. Oil Drill. Prod. Technol. 2023, 45, 184–189. [Google Scholar] [CrossRef]
- Zhang, C.Y. Staged Fracturing String Mechanics Analysis in Oil and Gas Development; Yanshan University: Qinhuangdao, China, 2021. [Google Scholar] [CrossRef]
- Gao, D.L.; Huang, W.J. Some research advances in downhole tubular mechanics and control methods. Adv. Mech. 2021, 51, 620–647. [Google Scholar] [CrossRef]
- Qin, A. Study on the Vibration Mechanism of Fluid-Solid Coupling of Tandem Double Wave Cone Cylinder; Wuhan University of Technology: Wuhan, China, 2021. [Google Scholar] [CrossRef]
- Yang, B.K. Characteristics Analysis of Multi-Dimensional Fluid-Structure Interactional Vibration in Completion String; Xi’an Shiyou University: Xi’an, China, 2020. [Google Scholar] [CrossRef]
- Ai, P.X. Fluid-Solid Coupling Vibration Characteristics and Experimental Study of Fracturing String Considering Friction Effect; Xi’an Shiyou University: Xi’an, China, 2020. [Google Scholar] [CrossRef]
- Cao, Y.P.; Guo, L.; Dou, Y.H. Influence of Fluid-Solid Interaction on the Vibration Characteristics of Tubing in Oil and Gas Well. Mach. Des. Manuf. 2019, 6, 84–87+91. [Google Scholar] [CrossRef]
- Cao, Y.P.; Huang, Y.X.; Yu, K.Q.; Dou, Y.H. Natural frequency analysis for fluid-solid coupling vibration of completion string based on ANSYS workbench. Well Test. 2018, 27, 1–7. [Google Scholar] [CrossRef]
- Wang, Y.; Fan, H.H.; Zhang, L.P.; Yang, X.; Feng, G.Q. Analysis of fluid-structure interaction of completion string system in high pressure gas well. J. Vib. Shock 2011, 30, 202–207. [Google Scholar] [CrossRef]
- Fan, H.H.; Wang, Y.; Zhang, L.P.; Yang, X.; Yang, X.T.; Wei, F. A fluid-solid coupled oscillation model for completion string and its application in high pressure gas well. Acta Pet. Sin. 2011, 32, 547–550. [Google Scholar] [CrossRef]
- Beune, A.; Kuerten, J.; Heumen, M. CFD Analysis with Fluid-Structure Interaction of Opening High-Pressure Safety Valves. Comput. Fluids 2012, 64, 108–116. [Google Scholar] [CrossRef]
- Nerella, R.; Rathnam, E.V. Fluid Transients and Wave Propagation in Pressurized Conduits Due to Valve Closure. Procedia Eng. 2015, 127, 1158–1164. [Google Scholar] [CrossRef]
- Slipchuk, A.; Pukach, P.; Vovk, M.; Kunynets, A. On the Vibrational Characteristics of a Moving Wire via the KBM Asymptotic Method. Appl. Mech. 2025, 6, 31. [Google Scholar] [CrossRef]
- Archut, J.-L.; Kins, R.; Heider, Y.; Cloppenburg, F.; Markert, B.; Gries, T.; Corves, B. A Study of the Mechanical Response of Nonwovens Excited by Plate Vibration. Appl. Mech. 2022, 3, 496–516. [Google Scholar] [CrossRef]
- Giagopoulos, D.; Arailopoulos, A.; Chatziparasidis, I. Optimal Modeling of an Elevator Chassis under Crash Scenario Based on Characterization and Validation of the Hyperelastic Material of Its Shock Absorber System. Appl. Mech. 2022, 3, 227–243. [Google Scholar] [CrossRef]
- Prem, M.S.; Klanner, M.; Ellermann, K. Identification of Fractional Damping Parameters in Structural Dynamics Using Polynomial Chaos Expansion. Appl. Mech. 2021, 2, 956–975. [Google Scholar] [CrossRef]
- Sozinando, D.F.; Tchomeni, B.X.; Alugongo, A.A. Fluid Interaction Analysis for Rotor-Stator Contact in Response to Fluid Motion and Viscosity Effect. Appl. Mech. 2024, 5, 964–977. [Google Scholar] [CrossRef]
- Abdalla, M.A. The Combined Effects of the Minimum Miscibility Pressureand Injection Rate Variations on Recovery of CO2 Flooding in Sandstone Reservoir. J. Pet. Explor. Prod. Technol. 2022, 12, 108–116. [Google Scholar] [CrossRef]
- Zhang, Q.; Liao, T.; Lian, Z.H. Study on water hammer effect and tubing string vibration in high-pressure high-production gas wells. Geoenergy Sci. Eng. 2023, 229, 212147. [Google Scholar] [CrossRef]
- Guo, X.Q.; Liu, J.; He, Y.F. Nonlinear flow-induced vibration response characteristics of a tubing string in HPHT oil & gas well. Appl. Ocean Res. 2021, 102, 102468. [Google Scholar] [CrossRef]
- Mao, L.J.; Chen, X.W.; Fu, Q. Vibration characteristics and safety analysis of production string in high temperature, high pressure gas wells. Geoenergy Sci. Eng. 2024, 239, 212959. [Google Scholar] [CrossRef]
- Liu, J.; Zeng, L.L.; Cai, L. Experimental study on flow-induced vibration response characteristics of leaching tubing in salt cavern gas storage. Eng. Fail. Anal. 2022, 139, 106302. [Google Scholar] [CrossRef]
- Liu, J.; Zeng, L.L.; Guo, X.Q.; Dai, L.M.; Huang, X.; Cai, L. Nonlinear flow-induced vibration response characteristics of leaching tubing in salt cavern underground gas storage. J. Energy Storage 2021, 41, 102909. [Google Scholar] [CrossRef]
- Cao, Y.P.; Wang, J.P.; Dou, Y.H.; Hang, X.Y. Study on the Vibration Response Characteristics of Fracturing Tubing Under Water Hammer Excitation (English). Mach. Tools Hydraul. 2019, 47, 1–7. [Google Scholar] [CrossRef]
- Li, B. Research and Analysis on the Mechanism of Crack Propagation and Damage in Pile Heads Caused by High-Pressure Water Jet. Hunan Transp. Sci. Technol. 2025. Available online: https://link.cnki.net/urlid/43.1193.U.20250630.1147.002 (accessed on 10 September 2025).
- Wu, F.T. Technical Analysis of Water Hammer Protection Calculations in Water Supply Pipeline Construction Projects. Heilongjiang Water Conserv. Sci. Technol. 2025, 53, 119–122. [Google Scholar] [CrossRef]
- He, C.S.; Zeng, P.J.; Zeng, Y.; Wang, H.; Wan, X.B.; Han, D.D.; Feng, L.J.; He, J.Y. Testing and Adaptive Optimization of Key Parameters for Frequency Regulation of High-Ratio Hydropower Units. J. Irrig. Drain. Mach. Eng. 2025, 6, 716–723. [Google Scholar] [CrossRef]
- Xu, Q.; Du, G.Q.; Dong, M.Y. Discussion on the Impact of Water Hammer Phenomena on Pipelines Based on the Enping Block Case Study. Liaoning Chem. Ind. 2021, 50, 862–864. [Google Scholar] [CrossRef]
- Zhang, A.L. Hydraulic Design and Water Hammer Protection Calculations for the Water Supply Pipeline of a Medium-Sized Irrigation District in the Jingtai Mountainous Area of Gansu Province. Gansu Water Conserv. Hydropower Technol. 2019, 55, 28–32. [Google Scholar] [CrossRef]
- Huang, Y.X. Analysis of Fluid-Structure Interaction Vibration Characteristics of Tubing in Fracturing Conditions; Xi’an ShiYou University: Xi’an, China, 2018. [Google Scholar]
- Zhu, L. Research on Fluid-Structure Coupling Vibration Analysis and Fatigue Life Assessment Technology of Liquid-Filled Pipelines; National University of Defense Technology: Changsha, China, 2018. [Google Scholar] [CrossRef]
- Gaponenko, S. Mathematical Modeling of the Effect of Various Defects on the Parameters of Natural Vibrations of the Pipeline Under Operating Conditions. In Advances in Automation IV, RusAutoCon 2022, Lecture Notes in Electrical Engineering; Springer: Cham, Switzerland, 2023; pp. 136–146. [Google Scholar] [CrossRef]
- Samara, H.; Jaeger, P. Driving Mechanisms in CO2-Assisted Oil Recovery from Organic-Rich Shales. Energy Fuels 2021, 35, 710–720. [Google Scholar] [CrossRef]
- Lameh, M.; Al-Mohannadi, D.M.; Linke, P. Graphical Analysis of CO2 Emissions Reduction Strategies. Clean. Eng. Technol. 2020, 1, 100023. [Google Scholar] [CrossRef]
- Fu, Q.; Zhang, L.; Mao, L.J.; Hang, S.M. Study on the Temperature Field Distribution of Cold Water Pipes in Ocean Thermal Energy Conversion Power Generation. Mar. Eng. Equip. Technol. 2022, 9, 7–13. [Google Scholar] [CrossRef]
- Zhou, J. Research on the Protection of Offshore Oil Well Variable Frequency Drives Against External Power Supply Fluctuations. China Pet. Chem. Stand. Qual. 2023, 43, 134–135. [Google Scholar] [CrossRef]
- Zhu, Z.X.; Yu, K.; Jiao, G.; Hu, X.; Cao, D.H. Performance Analysis of a Reciprocating Throttling Positive Pulse Generator. Navig. Position. Timing 2022, 9, 156–162. [Google Scholar] [CrossRef]
- Mo, L.; Jia, D.P.; Mao, L.J.; Wang, G.R. Experimental Study on the Vibration Mechanism of Horizontal Well Completion Tubing under Different Gas Production Rates. J. Eng. Des. 2020, 27, 690–697. [Google Scholar] [CrossRef]
- Tang, Z.Q. Research on the Control of Wellbore Integrity in Horizontal Wells with Segmented Fracturing in Tight Oil Reservoirs; Southwest Petroleum University: Chengdu, China, 2018. [Google Scholar] [CrossRef]
Disclaimer/Publisher’s Note: The statements, opinions and data contained in all publications are solely those of the individual author(s) and contributor(s) and not of MDPI and/or the editor(s). MDPI and/or the editor(s) disclaim responsibility for any injury to people or property resulting from any ideas, methods, instructions or products referred to in the content. |
© 2025 by the authors. Licensee MDPI, Basel, Switzerland. This article is an open access article distributed under the terms and conditions of the Creative Commons Attribution (CC BY) license (https://creativecommons.org/licenses/by/4.0/).

