Abstract
Development of oxidative and reductive flavors in wine can be influenced by the concentration and form of Cu within the wine. Electrochemical techniques have been devised to quantitate electrochemically active Cu (labile) in wine, as opposed to inactive Cu (non-labile). However, the electrochemical methods to measure labile Cu may be biased by the wine matrix, require lengthy calibration processes and/or unduly perturb the wine matrix during measurement. In this study, medium exchange stripping potentiometry was utilized with a thin mercury film on a screen-printed carbon electrode to provide a quantitation method that could largely overcome these limitations. The best average recoveries for 0.040 mg/L of labile Cu of 101 ± 15% (n = 12) were observed using composite calibration graphs prepared in oxidized wines and on multiple electrodes and using Pb as an internal standard. Composite calibration curves performed on different electrodes to the sample analysis were as effective in quantifying labile Cu as calibration curves performed on the same electrode as the sample. The results allow selection of a quantitation procedure that will suit the required speed and accuracy of labile Cu determination.
1. Introduction
The presence of copper (Cu) in wine can have important implications for flavor development during aging of the wine. The Cu can stem from Cu-containing sprays in the vineyard, contamination, or additions during wine production [1]. The Cu can act as a mediator of reactions between dissolved molecular oxygen and wine components, such as phenolic compounds and ascorbic acid [1,2]. With access to excessive amounts of oxygen, the resulting reactions can allow detrimental changes in wine color (i.e., a browning of wines) and/or accumulation of volatile carbonyl compounds capable of imparting off-flavor aromas (e.g., rotten potato, honey) [1]. Once oxygen-induced faults in a wine are detected, the wine is generally termed “oxidized” during sensory assessment. Alternatively, Cu can also impact the accumulation of hydrogen sulfide and other thiol compounds in wine. A wine with significant concentrations of hydrogen sulfide and methanethiol is sensorially labeled as “reduced”, and this is more likely to occur in conditions of low oxygen, as found during bottle aging in screw capped bottles. The role of Cu in this process is complex as it can decrease the volatile component of hydrogen sulfide and thiol compounds when added to wine during wine production but can also lead to an increase in the total concentrations of these thiol compounds when the wine is stored in low oxygen conditions [3,4,5].
A range of techniques are available for the measurement of total Cu in wine, and various methodologies exist for the determination of different forms of Cu in wine [1]. The latter—often termed speciation measures for Cu—includes solid phase extraction, liquid extraction, and electrochemical techniques [6,7,8,9]. The speciation measures have the possibility to provide an improved link between Cu activity in wine and the development of the oxidized or reduced characters. Ideally, when performing the speciation measure, the pretreatment of the sample is minimized to limit methodologically induced changes in Cu forms. The degree to which the pretreatment of the wine is minimized is dependent upon the technique, with some requiring extensive dilution of the wine, digestion, pH changes and/or the application of extraction techniques [1,7,8,9]. Such operations are often necessary prior to instrumental analysis to achieve isolation of Cu forms, removal of interferents and/or to sufficiently optimize sensitivity. For example, flame or plasma-based techniques (FAAS, ICP-OES, etc.) induce severe perturbation of the sample matrix during atomization of Cu and require application of solid-phase extraction procedures for separation of Cu species prior to analysis [1,8,9].
In comparing different methodologies for Cu speciation in wine, one technique had a clear advantage over others as it had no sample pretreatment besides filtration. It utilized medium exchange constant current stripping potentiometry (ME CCSP) in batch mode, with a 3-in-1 electrode system and a thin-film mercury working electrode [10]. It allowed enrichment of Cu from wine into the thin mercury film and then stripped into an optimized 4.0 M ammonium acetate solution that provided well-defined Cu peaks. The approach was later modified to a mercury thin film on a carbon screen-printed electrode within a flow cell [11]. During this electrochemical procedure, the wine did encounter the −900 mV enrichment potential and this may have caused some perturbation Cu speciation during the measurement. However, as the wine encountered the electrode within a 1–2 s period for a single pass through the flow cell, the impact was less than expected for batch analysis by the same technique. The Cu deposited onto the mercury film was termed “labile Cu”, and the remaining electrochemically inactive Cu was termed “non-labile”. Quantitation was performed with an external calibration graph generated on the same electrode as the sample.
The technique has been validated [11], but the impacts of the wine matrix on the Cu stripping signal were not able to be assessed due to a lack of understanding of the binding agents for Cu in wine and the ability to account for these in recovery experiments. Since then, based on a range of surveyed compounds, it would appear that sulfide is the predominant binder of Cu in wine capable of converting labile Cu to non-labile Cu [12]. Thiol compounds found at relatively high concentrations in wine, such as glutathione and cysteine, could not induce non-labile Cu formation. Other wine components with a likely ability to interact with Cu are polysulfides and polysulfones [13], but their ability to impact the electrochemical speciation of Cu is not currently known.
Importantly, it has been shown that exposure of wine and model wine systems to oxygen and/or storage in open containers induces conversion of non-labile Cu to labile Cu [10,11]. Speciation studies using alternate techniques have also shown the ability of oxidation to alter Cu speciation in wine [14]. Such conditions most likely cause oxidative and/or volatile losses of sulfide and other thiol compounds in wine to lower the sulfur-containing compound concentration in wine or form products with an inability to bind Cu. Consequently, this provides a means of using oxidized wines—where the binders of Cu have been largely exhausted—and non-bound Cu already in excess to perform recovery experiments and establish the matrix effects of wine on the quantitation of labile Cu.
Another limitation for the measurement of labile Cu in wine by ME CCSP is the time of analysis. Concentrations in the range of 0.015–0.040 mg/L are routinely measured in freshly opened bottled wine and enrichment times of 500 s are required based on sample flows over the electrode of 2.0 mL/min [11]. Such conditions typically provide linear calibration graphs down to 0.015 mg/L. For each analysis cycle, a time of around 14–15 min is required, meaning that for the determination of three standards of Cu and one wine sample, with three to four replicate measures for each solution, an analysis time of around 4–5 h is typical (including electrode stabilization). The analysis time limits the amount of samples that can be measured per day and, furthermore, electrode variations that occur over time mean that further inaccuracy may be imparted by such long analysis times.
This work was conducted to provide a more rapid measure of labile Cu in wine and to gauge the accuracy of the measure in terms of recovery experiments. The ability to increase the sensitivity of the methods by altering the flow of sample over the electrode was investigated, and a variety of different electrode calibration procedures were assessed.
2. Materials and Methods
2.1. Reagents, Wines, and Instrumentation
All glassware were soaked overnight in 10% (v/v) nitric acid and then rinsed with copious amounts of 18.2 MΩ water prior to usage. Working standard solutions were prepared by dilution of 1000 mg/L ICP standard solutions for both Cu (Sigma-Aldrich, St. Louis, MO, USA) and Pb (Choice Analytical, Thornleigh, Australia). Dilution of standards was performed with model wine consisting of 12% (v/v) aqueous ethanol, 0.011 M potassium hydrogen tartrate, and 0.007 M tartaric acid and pH of 3.2 unless indicated otherwise.
Wines were commercially available bottled wines and upon opening, were poured into a 2.0 L reagent bottle with ullage of ≈1.5 L of air. The wines were shaken to saturate the wine with air and stirred at room temperature for at least 1 week.
All electrochemical experiments were performed on a 797 VA Computrace (Metrohm, Herisau, Switzerland) and managed with the VA Computrace 797 PC Software (v1.3). Stripping potentiograms were plotted as dt/dU vs. U by the VA Computrace software, where U represents potential (V) and t represents time (s).
A DropSens 110 screen-printed carbon electrode (DropSens, Llanera, Spain) was used, which consisted of a 4 mm carbon working electrode, carbon counter electrode, and silver reference electrode; the electrode was connected to the 797 VA Computrace system via a CAC connector cable (DropSens). To enable flow analysis, a methacrylate (transparent) wall-jet flow cell (DropSens) was used. General sample and analysis flows into the cell was controlled with a Varian 9012 Gradient Piston HPLC pump with stand-alone gradient programming, and all solutions were passed through an on-line Alltech Elite Degasser prior to entering the HPLC. Flow of the mercury plating solution into the flow cell was controlled by an Ismatic peristaltic pump (Zurich, Switzerland). A six channel Rheodyne TPMV valve was used to switch between HPLC flow and mercury plating solutions.
2.2. Generation of the Thin Mercury Film on the Screen-Printed Carbon Electrode
The procedure adopted was a modified version of that reported previously [11]. Several drops of 1.0 M ammonium acetate was placed on the electrode and checked for bubbles. If no bubbles were evident, the electrode was placed in the flow cell, the flow cell closed, and the electrode re-checked for bubbles. With no bubbles evident, the mercury plating process was conducted. The electrode potential was set to −300 mV and the plating solution pumped through the flow cell at a flow rate of 2.0 mL/min for 2 min. The potential was then set to −500 mV for 1 min, −700 mV for 1 min, and then −1000 mV for 4 min (all with pumping at 2.0 mL/min). The electrode was then set to −300 mV and 1.0 M ammonium acetate pumped through the flow cell (2.0 mL/min) for 2 min.
2.3. Medium Exchange Constant Current Stripping Potentiometry (ME CCSP)
The analysis procedure was based on a modified electrochemical flow analysis method of Clark et al. [11]. A filtered (0.45 mm) wine sample was pumped (2.0 mL/min) through the flow cell, and an enrichment potential of −900 mV was applied. The enrichment time was 500 s. After the enrichment time, an automated HPLC gradient procedure ceased sample entry to the flow cell and enabled flow (2.0 mL/min) of 60%(v/v) aqueous ethanol with 0.25 M acetic acid, 0.25 M ammonium acetate, and 2.0 mg/L Pb through the cell for 25 s. Afterwards, the flow was changed to 4.0 M ammonium acetate at 2.0 mL/min for 60 s and then the flow stopped for the remaining 25 s of the equilibration time. In the quiescent 4.0 M ammonium acetate solution, the control of the potentiostat was released and the potential monitored from −900 mV to −250 mV. Copper was stripped from the working electrode using a constant oxidative current (1.0 μA). A cleaning step consisted of −250 mV being applied with the next sample flowing through the cell (2.0 mL/min) for 25 s prior to the next analysis cycle. The formal limit of detection and limit of quantification remained unchanged from Clark et al. [11], with concentrations of 0.0001 and 0.0005 mg/L, respectively, and a higher working limit of quantification—of 0.015 mg/L due to nonlinearity observed in calibration graphs at concentrations below 0.015 mg/L.
2.4. Quantitation Procedures and Recovery Analysis
The quantitation procedures used to convert Cu stripping times to labile Cu concentrations were as follows:
- Method 1 (MW)—external model wine calibration (same electrode as sample)
- Method 2 (MW_IS)—internal standard model wine calibration (same electrode as sample)
- Method 3 (CompMW)—composite external model wine calibration (different electrodes to sample)
- Method 4 (CompMW_IS)—composite internal standard model wine calibration (different electrodes to sample)
- Method 5 (CompWine)—composite external oxidized wine calibration (different electrodes to sample)
- Method 6 (CompWine_IS)—composite internal standard oxidized wine calibration (different electrodes to sample)
The calibration graph in the model wine was obtained from the analysis of 0.02, 0.04, and 0.08 mg/L Cu in model wine, while calibration standards in oxidized wines were obtained from analysis of 0, 0.040, and 0.080 mg/L of added Cu to the wines. All standards were analyzed in triplicate.
For method 1 and 2, the calibration standards were analyzed on the same electrode as for the analysis sample, whilst for methods 3 and 4, a total of five calibration graphs in model wine were determined on multiple electrodes separate to that used for the sample analysis. The data from the five calibration graphs was then combined to generate a composite calibration graph to be applied to the quantitation of Cu stripping signals obtained for wines on separate electrodes. Methods 2 and 4 utilized the Pb internal standard in the generation of the calibrations graphs. Methods 5 and 6 required the generation of 12 calibration graphs determined in oxidized red (×7) and white wines (×5), and the data for all 12 calibration graphs combined to generate a composite calibration graph to be applied to the quantitation of Cu stripping signals obtained for wines on separate electrodes. The oxidized wine calibration curves were generated from raw data by subtracting the Cu stripping signal of the 0 mg/L added Cu standard from each of the calibration standards. To avoid bias, if a constituent wine of the composite calibration curve was to be quantitated by the composite calibration curve, its calibration curve was removed from the composite curve and the composite curve recalculated before quantitation of the wine.
For labile Cu determination and recovery experiments, the oxidized wines were analyzed with 0, 0.040, and 0.080 mg/L added Cu. The sample without added Cu was used for determination of the labile Cu in the oxidized wine with the quantitation methods 1–6 (outlined above). The difference in Cu stripping signals for the 0.040 and 0.080 mg/L samples were quantitated with the methods 1–6 outlined above used to determine the percentage recovery against 0.040 mg/L Cu.
2.5. Total Copper Concentrations in Wines
The total concentration of copper in wines was determined by inductively coupled plasma optical emission spectroscopy (ICP-OES) by the method reported previously [15].
3. Results and Discussion
3.1. Sample Flow Rate
With the aim of allowing shorter analysis times for labile Cu by the ME CCSP technique, the sample flow rate during the enrichment step was assessed to determine if significant sensitivity increase could be gained. The Cu stripping peak was compared when using a flow rate of 2.0 or 4.0 mL/min, with the former flow rate being previously adopted [11]. The results showed that such an increase in flow resulted in a 23% increase in the Cu stripping peak (from 11.55 ± 0.04 s to 14 ± 1 s), although this appeared to be at the cost of the signal repeatability (RSD increasing from 0.4 to 9.0%). Moreover, it was noticed that, with extended usage of the 4.0 mL/min flow rate, bubbles tended to develop in the flow cell, and these invariably resulted in noisy potentiograms. The occurrence of the bubbles at the high flow rate was most likely a consequence of less efficient degassing of the sample at the higher flow rates by the HPLC vacuum degasser. As a consequence of the modest sensitivity increases, lowered signal repeatability, and the increased likelihood of bubbles, the 2.0 mL/min flow rate was maintained.
3.2. Lead as an Internal Standards for the Determination of Labile Cu
The possibility of using Pb as an internal standard in the analysis of labile Cu in wine was assessed. The advantage of utilizing an internal standard would be shortening of analysis times due to decreased need to calibrate individual electrodes during analysis. Importantly, Pb is not commonly found in wines at concentrations likely to provide a peak above the limit of detection in the ME CCSP analysis. However, the internal standard Pb could not be added to wine prior to analysis as it would disturb the Cu speciation within the wine. Pb, like Cu, is known to have a strong binding constant for sulfide and sulfur-containing compounds [16], which are most likely the main binders of Cu in wine. For this reason, the internal standard was placed in the ethanol-based washing solution that passed over the electrode during the enrichment step but after the exposure of the electrode to the sample.
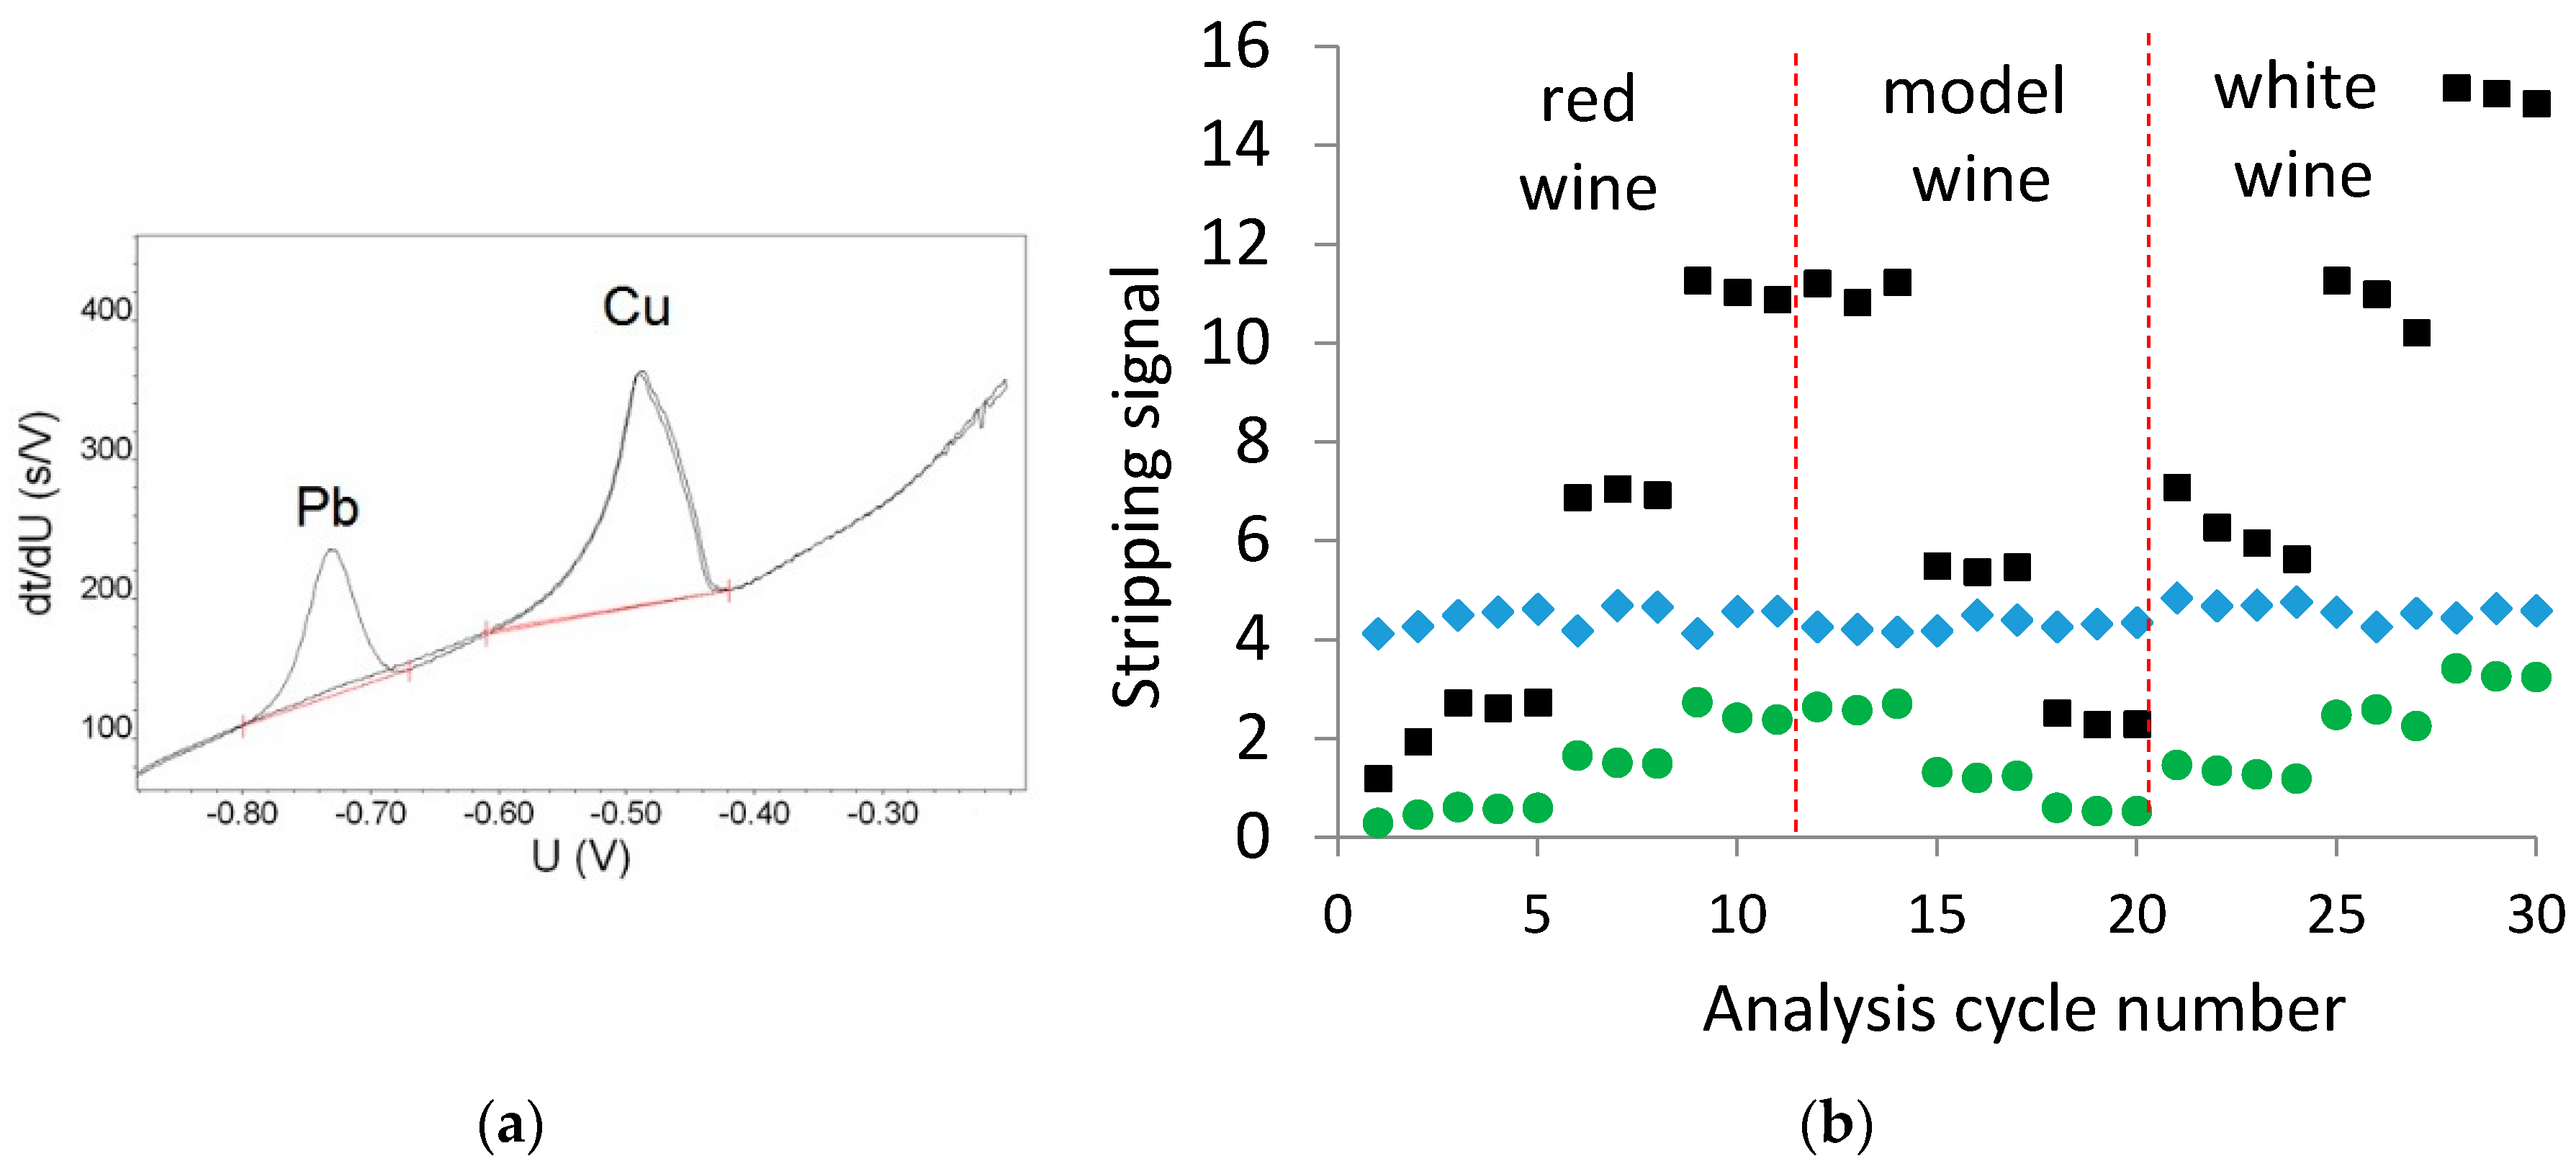
Figure 1a shows the potentiogram of 0.080 mg/L Cu in model wine, both with and without the internal standard Pb present at 2.0 mg/L in the ethanol-based washing solution. The concentration of 2.0 mg/L Pb was required to ensure an appropriate peak size for Pb during the passage of the ethanol-based wash solution over the electrode for the required 25 s duration of the wash solution. It is evident that the presence of the Pb did not impact the size or shape of the Cu stripping peak. Figure 1b shows the Cu and Pb stripping areas during the analysis of a red, white, and model wines, each at three different Cu concentrations, via ME CCSP on a single electrode. From Figure 1b, it is evident that the Pb stripping peak was relatively stable throughout the analysis, providing an RSD of 4.6% over the analysis period. The magnitude of the Cu stripping time was divided by the Pb stripping time to provide the normalized Cu signal (green circles in Figure 1b).
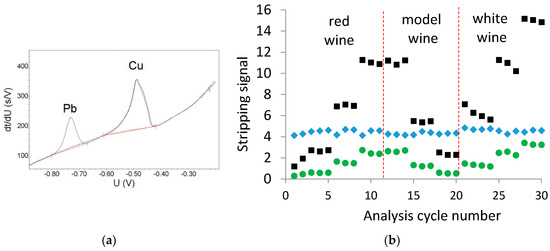
Figure 1.
Pb as an internal standard: (a) potentiogram of 0.080 mg/L Cu in model wine with and without 2.0 mg/L Pb in the ethanol-based washing solution; (b) Cu (■), Pb (♦) and the normalized Cu (●) stripping signals obtained during the analysis of red, white, and model wines on a single electrode. The order of analysis is red wine with additions of 0, 0.040 and 0.080 mg/L Cu; model wine with additions of 0.080, 0.040, and 0.020 mg/L Cu; and the white wine with additions of 0, 0.040 and 0.080 mg/L Cu.
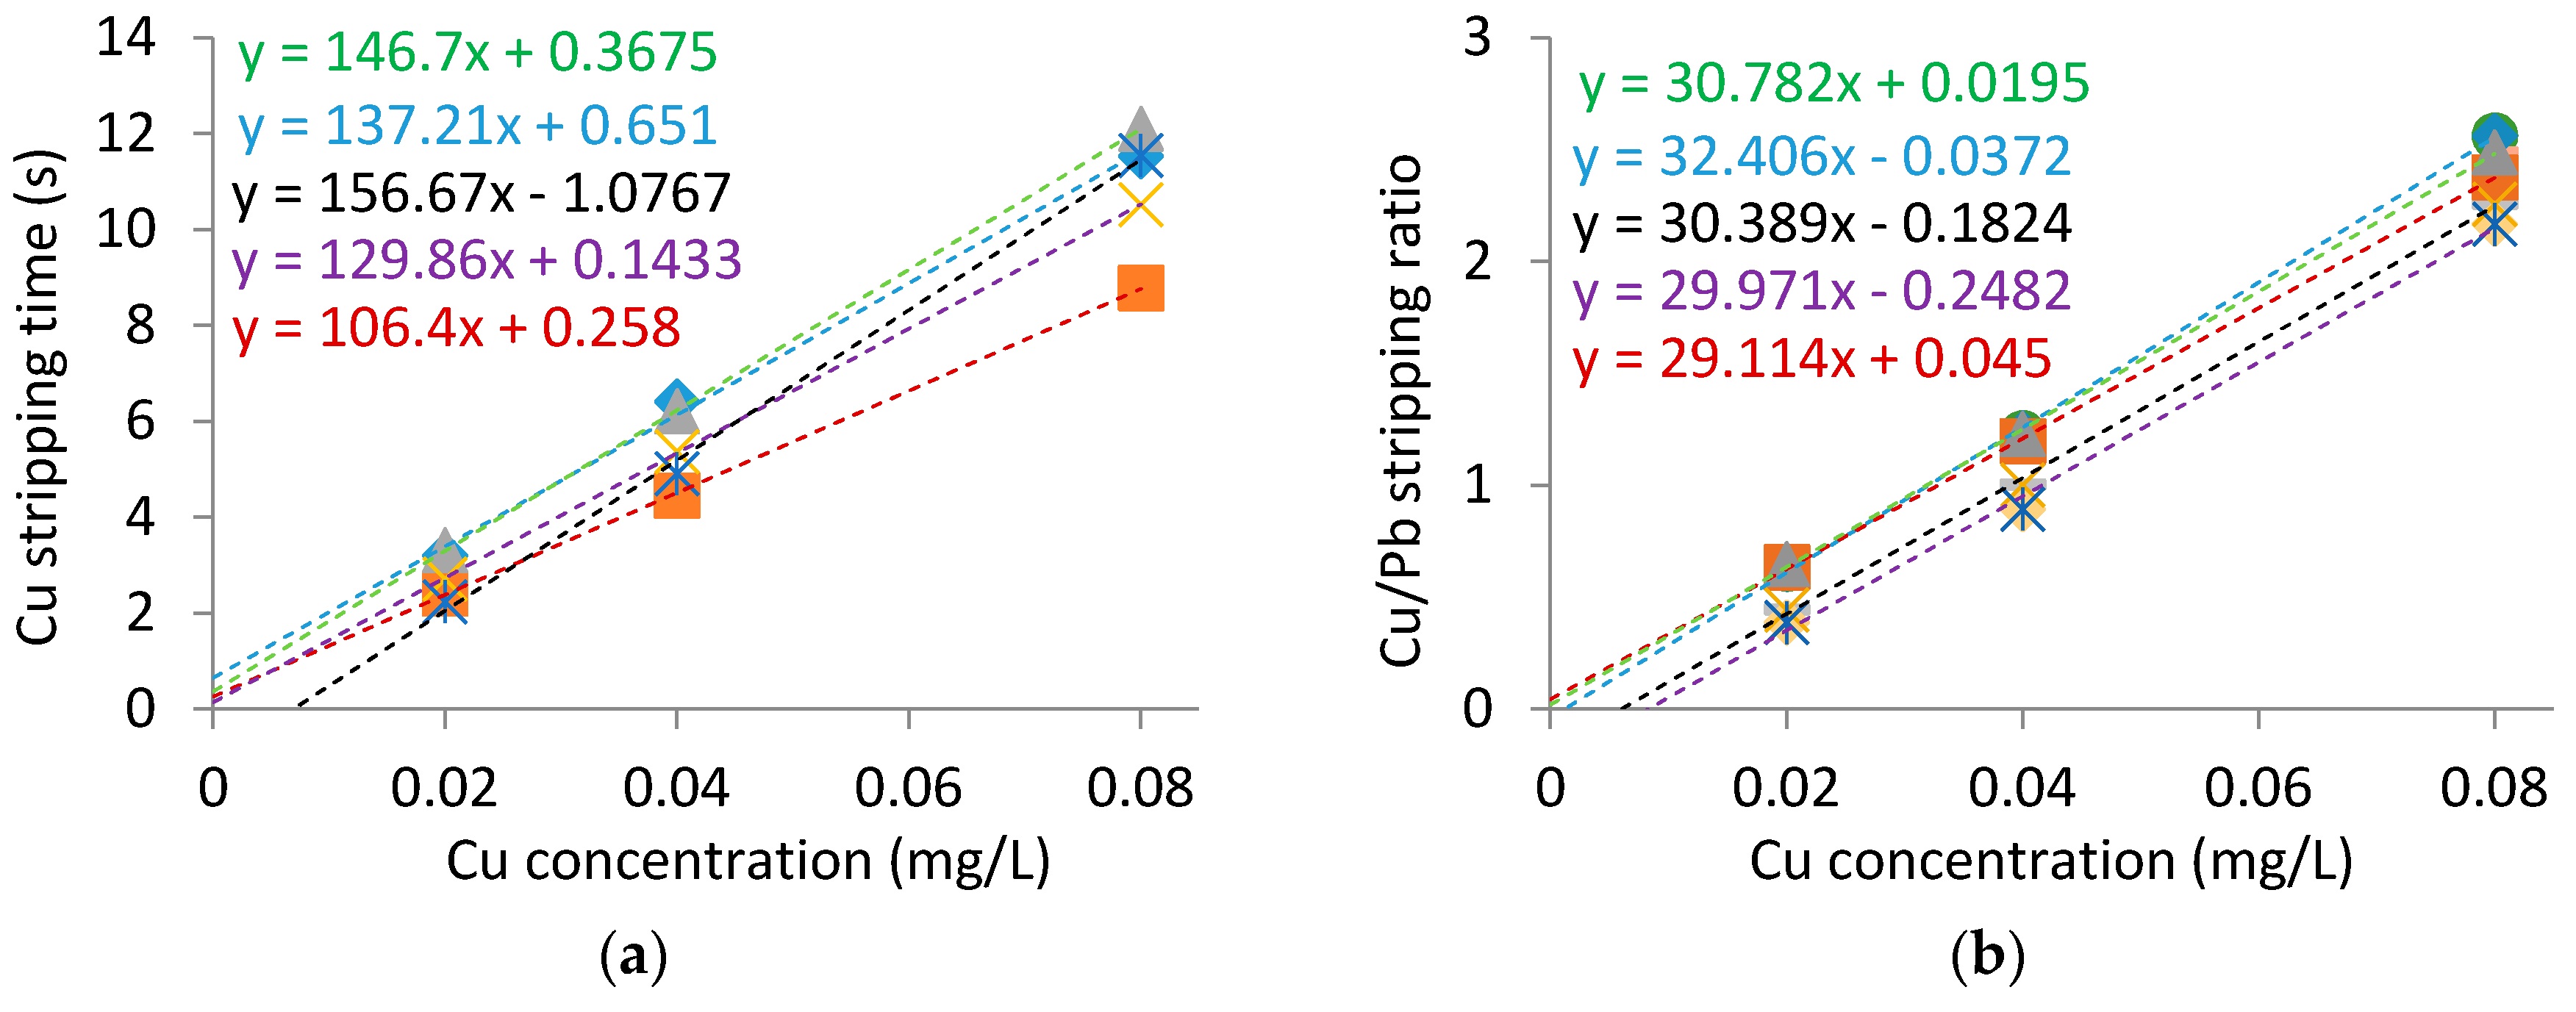
Calibration curves were generated in the model wine, both with and without the internal standard, to allow a comparison of the relative electrode to electrode variability. Figure 2 shows that the slope in the calibration curves was more consistent when the internal standard is utilized, however there was appreciable variation in the x-intercept (i.e., Cu concentration axis) regardless of the use of an internal standard. The x-intercept of the calibrations was mainly a consequence of nonlinearity of copper stripping observed at low concentrations, as reported previously [11,17], and would appear to be dependent on the individual electrodes prepared. The necessity of having a Pb stripping peak of reasonable size, and hence respective concentration, means that it cannot account for the nonlinearity at low Cu concentrations. The electrode to electrode variation in the intercept for the Cu calibration curves may be a limitation in the use of calibration curves generated on different electrodes for quantitation. However, the internal standard does provide the benefit of consistent calibration slopes between electrodes that may contribute to its effectiveness of quantitation between different electrodes.
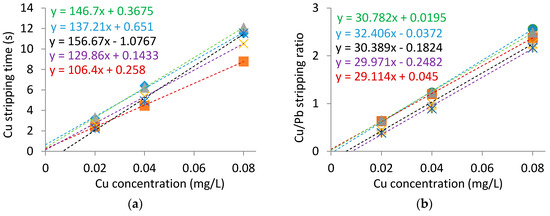
Figure 2.
Cu calibration graphs in model wine: (a) utilizing copper stripping time; (b) utilizing the Cu stripping time normalized to the Pb stripping time.
One observed benefit of the Pb internal standard was that it improved Cu signal stability upon the ingress of small bubbles in the electrode flow cell. Such bubbles generally alter the sensitivity of the electrode due to changes of oxygen concentration or sample flow patterns within the cell and can also irreversibly damage the thin mercury film. The occurrence of bubbles is generally avoided with the use of an inline degasser, but some wines saturated with carbon dioxide can still cause problems if not manually degassed. Supplementary Figure S1 shows data collected during the incidence of a bubble event that did not permanently destroy the thin mercury film but that altered the sensitivity of the electrode to Cu concentration. However, when the Pb internal standard was used, the changes in electrode sensitivity towards Cu due to the occurrence of the bubble were compensated by similar changes in electrode sensitivity towards Pb. Therefore, the calibration data collected during the occurrence of the bubble was largely unaffected if the internal standard was used, but it was irregular if only the Cu stripping signal was used (Supplementary Figure S1).
3.3. Pretreatment of Wine to Provide a Nonbinding Medium
To provide an assessment of wine matrix effect on the measurement of labile Cu in wine, it was necessary to pretreat the wine in a manner that would largely maintain its composition but negate the formation of non-labile Cu upon addition of Cu to the wine. This would enable recovery experiments to be conducted that have not been assessed for the ME CCSP technique in the past. As described in the Introduction, oxidized wine could potentially provide an adequate nonbinding wine matrix in which to perform recovery experiments.
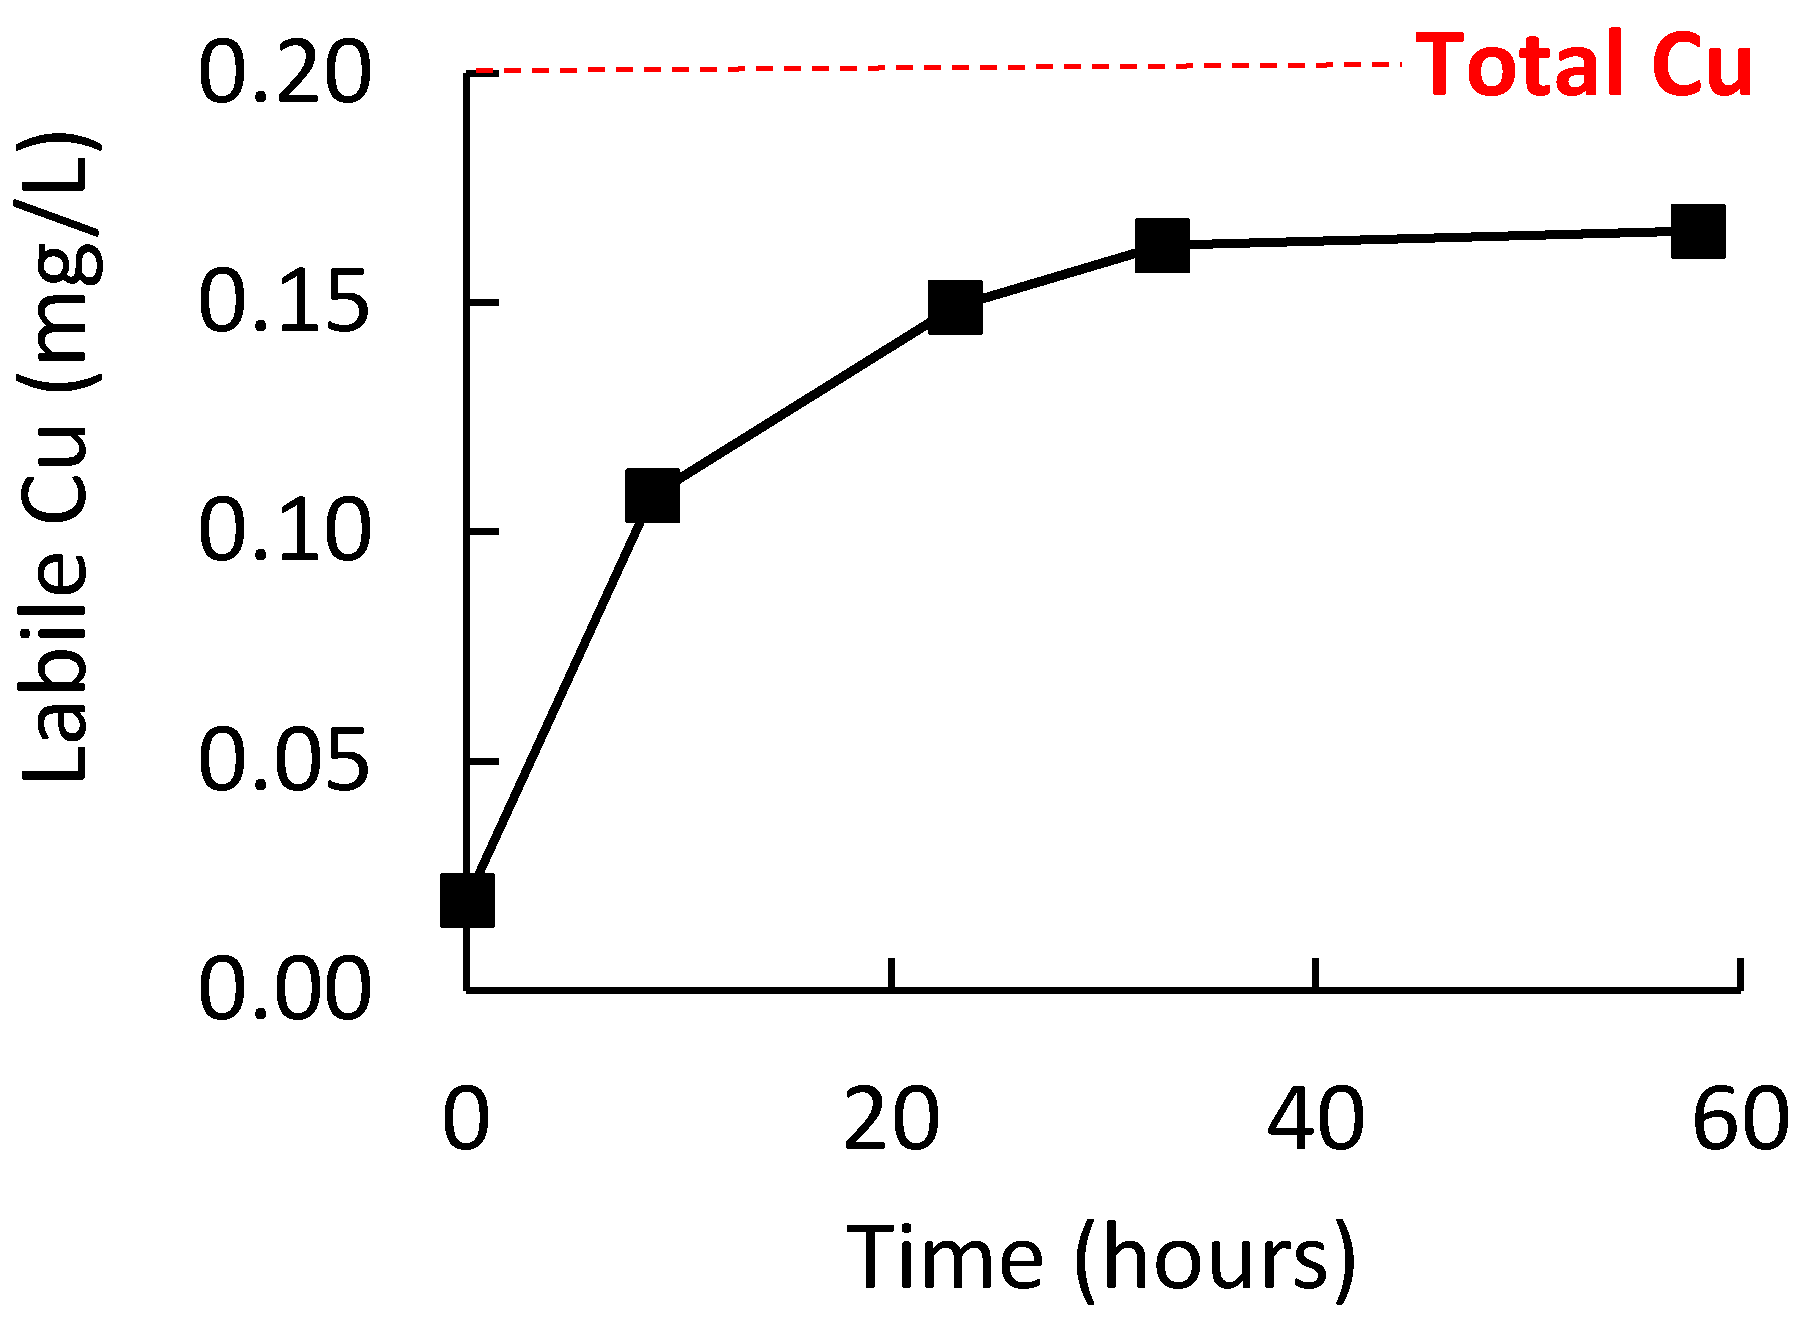
An initial study was conducted to ensure that the wine oxidation procedure was sufficient to allow labile Cu to be the dominating form of Cu in the wine. To achieve this, 750 mL of wine in a 2 L reagent bottle with ullage of ≈1.5 L of air was stirred at room temperature for at least one week. Figure 3 shows the increase in labile Cu for a white wine during 60 h of this pretreatment, with quantitation via external calibration in a model wine on the same electrode (i.e., method 1); in this wine, a plateau in labile Cu concentration was reached after around 35 h. Additional wines were analyzed by ICP-OES and ME CCSP after the one-week oxidative pretreatment procedure. Quantitation by ME CCSP was performed using standard additions of Cu to the oxidized wine. Provided that no binding of added Cu was occurring, this mode of quantitation would enable matrix effects in samples to be neutralized as the quantification was performed in the identical medium to the sample. If significant binding of added Cu during the standard additions did occur, it would provide nonlinear addition curves and/or overestimation of the labile Cu. The results (Table 1) showed that the labile Cu concentrations in four white and four red wines was an average of 98 ± 9% of the total Cu. Also, the correlation of the standard addition curves (>0.98) suggested good linearity. Therefore, these results suggested that the oxidized wines were not binding the added Cu and that predominantly all the Cu in the wines was in a labile form after the pretreatment of the wine. Consequently, this pretreatment of wines was deemed appropriate for the next section determining the recovery measurements of labile Cu in wine by the various quantitation procedures.
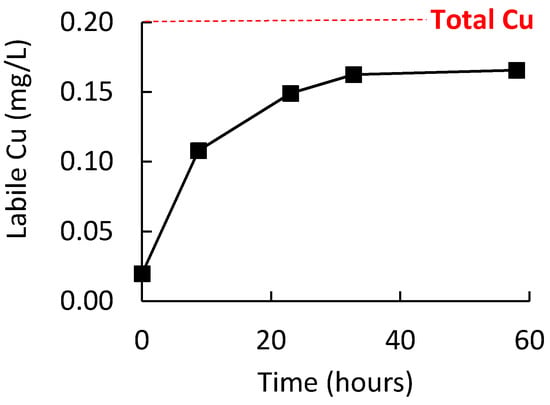
Figure 3.
Labile Cu concentration during the stirring white wine (750 mL) at room temperature and under ≈1.5 L of air ullage. Error bars are the standard deviation but are smaller than the data symbols.

Table 1.
Total and labile Cu concentrations in pretreated wines and the correlation of the standard additions curve.
3.4. Comparison of Modes of Labile Cu Quantiation for Recovery of Added Cu in Oxidized Wine
For wines that are analyzed directly after opening of a wine bottle, standard addition quantitation cannot be performed as the added Cu can be bound by the wine. Instead, quantitation is typically performed on the same electrode with the use of an external calibration graph generated in model wine where Cu is exclusively in the labile form [11]. As mentioned in the Introduction, a limitation of this approach is the time of analysis. For example, the analysis conducted in Figure 1b required 7 h, not including electrode plating time. Moreover, the impacts of compositional differences between model wine and real wines on the copper stripping signal is not certain.
To enhance the speed of analysis and to ensure optimum accuracy, a range of different quantitation methods were compared for the determination of labile Cu in red and white wines. The quantitation methods included the following for the determination of labile Cu stripping signals in wines:
- Method 1 (MW)—external calibration in model wine (same electrode)
- Method 2 (MW_IS)—internal standard calibration in model wine (same electrode)
- Method 3 (CompMW)—composite external calibration in model wine (alternate electrode)
- Method 4 (CompMW_IS)—composite internal standard calibration in model wine (alternate electrode)
- Method 5 (CompWine)—composite external calibration in oxidized wine (alternate electrode)
- Method 6 (CompWine_IS)—composite internal standard calibration in oxidized wine (alternate electrode)
The “composite” calibrations were performed on multiple electrodes and with multiple different wines or batches of model wine as described in the Material and Methods section. Table 2 shows the overall slope, intercept, and variations in each of them. The advantage of utilizing a composite calibration graph, once prepared, would be the quantitation of wine with a single Cu standard as a quality check rather than a set of Cu calibration standards. No further re-calibration would be required until the check standard failed.
Table 2.
The slope and intercept of composite labile Cu calibration graphs generated in oxidized wines and model wine. The quoted uncertainty is the standard deviation.
The recovery of 0.040 mg/L Cu added to the pretreated wines was conducted in order to establish any matrix effects encountered by the different modes of quantitation. This concentration was preferred, given that it is relevant to concentrations of labile Cu observed in freshly opened bottled wines [11]. The recovery results shown in Figure 4 are based on the analysis of five white wines and seven red wines.
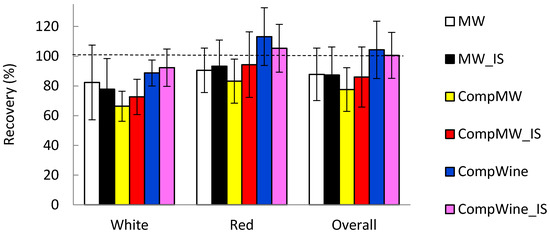
Figure 4.
The recovery of 0.04 mg/L Cu in wines by the different quantitation methods. The error bars represent the standard deviation (n = 5 for white wines, n = 7 for red wines and n = 12 for overall wines).
From the results, it is apparent that quantitation of labile Cu in the wines utilizing calibration graphs from a composite of oxidized wines consisting of both white and red wines showed the best results for recovery. There was a trend to lower recoveries when utilizing the model wine for calibrations compared to the composite calibrations with oxidized wine, particularly more so for white wine. This was the case regardless of the internal standard, the use of the model wine calibration generated on the same electrode, or as a composite on different electrodes. The differences for the recoveries by the different quantitation procedures were not significant due to the appreciable variations in recoveries for a given quantitation method, but the differences were consistent across the different wine types.
Of importance is the fact that a composite calibration generated in the model wine provided similar recoveries to that of the calibration generated in the model wine but on the same electrode as the wine. This suggests that individual electrode calibration may not be critical but may be substituted by a single standard analyzed with the wine in conjunction with the use of a composite model wine calibration generated on multiple electrodes.
The inability of the internal standard to eliminate the recovery underestimation of the model wine compared to the composite oxidized wine calibration suggested that the matrix effect was occurring during the wine enrichment step. The deposition of Pb from the ethanol-wash solution into the mercury film could not completely account for the wine matrix factors as encountered by deposition of Cu from the wine. The underestimation of the recovery appeared larger in white wines than red wines. In terms of general composition, white wines compared to red wines are more acidic, have higher malic acid concentrations, lower lactic acid, higher non-bound sulfur dioxide concentrations, and have around fivefold lower phenolic compound concentrations. Any of these parameters may have contributed to the differences observed for the recovery experiments in Figure 4 between white and red wines.
3.5. Comparison of Modes of Quantitation for Labile Cu Measurement in Oxidized Wines
As the recovery experiments were utilizing the linear portion of the composite calibration graphs in the oxidized wines, they did not account for the variability in nonlinearity at the lower Cu concentrations on the impact of labile Cu quantitation. For this reason, the quantitation procedures were applied to the determination of labile Cu in the oxidized wines (without any Cu addition) and compared to quantitation by standard additions and also to the total Cu concentrations in the wines. The results showed (as for Section 3.3) the similarity between the determination of labile Cu by standard addition and total Cu concentrations in the oxidized wines (Figure 5, see the orange and green bars). On first inspection, it is evident that all the quantitation procedures provided good general agreement with each other but some general trends are evident.
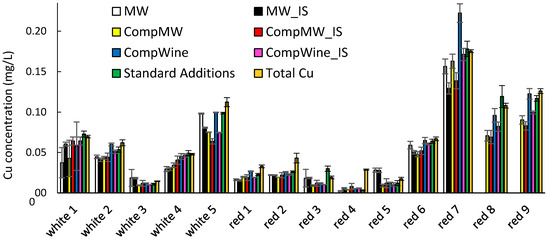
Figure 5.
The labile Cu concentration in five white and nine red wines as determined by quantitation methods 1–6. The error bars indicate the standard deviation of the determination. Red wines 8 and 9 were not quantitated by methods 1 and 2.
The model wine calibrations generated on the same electrode as the sample (MW and MW_IS) provided reasonable agreement with the total Cu and labile Cu by standard additions, but underestimation for two wines was significant (wine 4 for both quantitation modes and wine 7 for MW_IS). In comparison, all other quantitation methods utilizing calibration on the composite calibration graphs provided better consistency in agreement with the total Cu and labile Cu by standard additions. The composite calibrations generated in the oxidized wines, rather than composite model wines, appeared to have improved agreement at the higher Cu concentrations, apart from significant overestimation of red wine 7 by the CompWine method. The internal standard did not provide any gross benefits when compared to the same quantitation method without the internal standard, but it did prevent overestimation of the red wine 7 sample for quantitation by the composite oxidized wine procedure.
4. Conclusions
Overall, the differences in the quantitation methods were relatively minor and provide justification for the selection of a quantitation procedure that enables efficient analysis and is suited to the equipment on hand for the procedure. The benefit of the composite calibration graphs is the ability to devote dedicated days to generate the composite calibration graphs that can then be applied to large sample numbers on later analysis days. Hence, although time investment is required in the generation of the composite calibrations, it provides greater potential for efficient sample analysis and allows experimental design with larger sample numbers. In terms of accuracy, the composite calibrations generated in oxidized wines provided the most consistent results, and the use of the internal standard prevented the occurrence of an outlier labile Cu reading that was observed for the non-internal standard quantitation. The internal standard was shown to provide increased robustness of the technique to the occurrence of bubbles in the flow cell.
Supplementary Materials
The following are available online at http://www.mdpi.com/2227-9040/6/3/35/s1, Figure S1: The impact of bubbles on the Cu stripping signal and Cu/Pb stripping ratio during analysis.
Author Contributions
Conceptualization; Methodology; Data Curation; Writing—Original Draft Preparation; Writing—Review & Editing; Project Administration; Funding Acquisition; were all conducted by A.C.C. and N.K.
Funding
This research was funded by Wine Australia (CSU 1702-4).
Acknowledgments
The National Wine and Grape Industry Centre (NWGIC) is a research centre within Charles Sturt University in alliance with the Department of Primary Industries NSW and the NSW Wine Industry Association.
Conflicts of Interest
The authors declare no conflict of interest.
References
- Clark, A.C.; Wilkes, E.N.; Scollary, G.R. Chemistry of copper in white wine: A review. Aust. J. Grape Wine Res. 2015, 21, 339–350. [Google Scholar] [CrossRef]
- Danilewicz, J.C. Interaction of sulfur dioxide, polyphenols, and oxygen in a wine-model system: Central role of iron and copper. Am. J. Enol. Vitic. 2007, 58, 53–60. [Google Scholar]
- Ferreira, V.; Franco-Luesma, E.; Vela, E.; López, R. Elusive chemistry of hydrogen sulfide and mercaptans in wine. J. Agric. Food Chem. 2017, 66, 2237–2246. [Google Scholar] [CrossRef] [PubMed]
- Ugliano, M.; Kwiatkowski, M.; Vidal, S.; Capone, D.; Siebert, T.; Dieval, J.-B.; Aagaard, O.; Waters, E.J. Evolution of 3-mercaptohexanol, hydrogen sulfide, and methyl mercaptan during bottle storage of Sauvignon blanc wines. Effect of glutathione, copper, oxygen exposure, and closure-derived oxygen. J. Agric. Food Chem. 2011, 59, 2564–2572. [Google Scholar] [CrossRef] [PubMed]
- Viviers, M.Z.; Smith, M.; Wilkes, E.; Smith, P.A. Effects of five metals on the evolution of hydrogen sulfide, methanethiol and dimethyl sulfide during anaerobic storage of Chardonnay and Shiraz wine. J. Agric. Food Chem. 2013, 61, 12385–12396. [Google Scholar] [CrossRef] [PubMed]
- Karadjova, I.; Izgi, B.; Gucer, S. Fractionation and speciation of Cu, Zn and Fe in wine samples by atomic absorption spectrometry. Spectrochim. Acta B 2002, 57, 581–590. [Google Scholar] [CrossRef]
- Misiego, A.S.; Carra, R.M.G.-M.; Carracedo, M.P.A.; Sánchez-Simón, M.T.G. Electroanalytical determination and fractionation of copper in wine. J. Agric. Food Chem. 2004, 52, 5316–5321. [Google Scholar] [CrossRef] [PubMed]
- Pohl, P.; Sergiel, I. Evaluation of the total content and the operationally defined species of copper in beers and wines. J. Agric. Food Chem. 2009, 57, 9378–9384. [Google Scholar] [CrossRef] [PubMed]
- Tašev, K.; Karadjova, I.; Arpadjan, S.; Cvetković, J.; Stafilov, T. Liquid/liquid extraction and column solid phase extraction procedures for iron species determination in wines. Food Control 2006, 17, 484–488. [Google Scholar] [CrossRef]
- Clark, A.C.; Scollary, G.R. Medium exchange stripping potentiometry for the measurement of labile copper in white wine. Electroanalysis 2006, 18, 1793–1799. [Google Scholar] [CrossRef]
- Clark, A.C.; Kontoudakis, N.; Barril, C.; Schmidtke, L.; Scollary, G.R. Measurement of labile copper in wine by medium exchange stripping potentiometry utilising screen printed electrodes. Talanta 2016, 154, 431–437. [Google Scholar] [CrossRef] [PubMed]
- Kontoudakis, N.; Smith, M.; Guo, A.; Smith, P.A.; Scollary, G.R.; Wilkes, E.; Clark, A.C. The impact of wine components on fractionation of Cu and Fe in model wine systems: Macromolecules, phenolic and sulfur compounds. Food Res. Int. 2017, 98, 95–102. [Google Scholar] [CrossRef] [PubMed]
- Kreitman, G.Y.; Danilewicz, J.C.; Jeffery, D.W.; Elias, R.J. Copper(II)-mediated hydrogen sulfide and thiol oxidation to disulfides and organic polysulfanes and their reductive cleavage in wine: Mechanistic elucidation and potential applications. J. Agric. Food Chem. 2017, 65, 2564–2571. [Google Scholar] [CrossRef] [PubMed]
- Kontoudakis, N.; Guo, A.; Scollary, G.R.; Clark, A.C. The impact of aging wine in high and low oxygen conditions on the fractionation of Cu and Fe in Chardonnay wine. Food Chem. 2017, 229, 319–328. [Google Scholar] [CrossRef] [PubMed]
- Rousseva, M.; Kontoudakis, N.; Schmidtke, L.; Scollary, G.R.; Clark, A.C. Impact of wine production on the fractionation of copper and iron in Chardonnay wine: Implications for oxygen consumption. Food Chem. 2016, 203, 440–447. [Google Scholar] [CrossRef] [PubMed]
- Smith, D.S.; Bell, R.A.; Kramer, J.R. Metal speciation in natural waters with emphasis on reduced sulfur groups as strong binding sites. Comp. Biochem. Physiol. C 2002, 133, 65–74. [Google Scholar] [CrossRef]
- Palchetti, I.; Cagnini, A.; Mascini, M.; Turner, A.P.F. Characterisation of screen-printed electrodes for detection of heavy metals. Mikrochim. Acta 1999, 131, 65–73. [Google Scholar] [CrossRef]


© 2018 by the authors. Licensee MDPI, Basel, Switzerland. This article is an open access article distributed under the terms and conditions of the Creative Commons Attribution (CC BY) license (http://creativecommons.org/licenses/by/4.0/).