Abstract
Accidental and deliberate poisoning by Ricinus communis, a wild plant cultivated for castor oil, has been known for centuries. Seeds contain one of the deadliest known plant toxins, ricin, along with its dimer RCA120. Due to its toxicity and ease of extraction, ricin poses a potential threat as a chemical weapon, highlighting the need for reliable laboratory detection. In this work, ricin and RCA120 (Ricinus communis agglutinin) were extracted from castor beans and purified by solid-phase extraction (SPE) and Gel Permeation Chromatography (GPC). Purity was confirmed through Sodium Dodecyl Sulphate-PolyAcrylamide Gel Electrophoresis (SDS-PAGE). Then, lab-made standards were used to validate an Enzyme Linked ImmunoSorbent Assay (ELISA) kit to identify ricin in biological matrices after SPE extraction. Parallelly, SDS-PAGE was used to qualitatively confirm the presence of toxins. The developed method demonstrated a detection limit (LOD) of 2.74 ng/mL and was used to analyse biological specimens of seven human intoxication cases managed by Pavia Poison Control Centre (PCC). This study provides a quiet, inexpensive protocol that within 5 h allows the screening of potential ricin-exposure victims. Its implementation in clinical laboratories could support the management of intoxicated patients, ensuring faster and more accurate clinical response.
1. Introduction
Ricinus communis (L.), a member of the Euphorbiaceae family, is a plant native to Africa and Asia that is now widely cultivated worldwide due to its broad economic and medicinal value [1]. In particular, Ricinus communis seeds (castor beans) are the source of ricin toxin, Ricinus communis agglutinin (RCA120), the alkaloid ricinine, and the allergenic chlorogenic acid [1,2].
Ricin toxalbumin is a disulphide-linked heterodimeric glycoprotein with a molecular weight of 60 to 65 kDa belonging to the family of the AB toxins, i.e., two-component protein complexes, in which the A component is the biologically active portion, while the B component is the binding portion [3]. The A chain, Ricin Toxin A (RTA), is the catalytically active, toxic subunit. The Ricin Toxin Binding subunit B (RTB) is a lectin that binds galactose residues on the cell surface, thus facilitating RTA translocation into the cytosol [3,4]. RTA is a ribosome-inactivating protein-II (RIP) that disrupts ribosomal integrity and protein synthesis, resulting in cell death [3]. RCA120 is a disulphide-linked ricin-like dimer with a disulphide bond between the two A-chains of ricin, resulting in a molecular weight that is doubled compared to ricin, i.e., around 120 kDa. RCA120 is a lectin that exhibits 93% sequence similarity to the RTA chain and 84% to the RTB chain and is significantly less toxic than ricin (50–2000-fold) [3].
The amount of ricin and RCA in the seed varies according to the specific cultivar and cultivation conditions [5,6]; slight variations in the MW are seen in different cultivars. On average, the ricin content is approximately 9.3 mg/g of seeds (3–5% w/w of their dry weight), while the RCA120 content is around 9.9 mg/g [6]. The most hazardous routes of exposure to purified ricin toxin are inhalation and injection, while oral absorption of the toxin is poor, and absorption through intact skin is unlikely [3,7]. The toxicity and clinical signs vary depending on the route of exposure to ricin (oral, respiratory or parenteral). The estimated 50% lethal dose (LD50) for inhalation and injection is 1–25 µg/kg in mice, while the estimated LD50 for oral ingestion is 1.78–30 mg/kg [8]. Given the widespread use of castor plants, the high toxicity of ricin, the ease of extraction, and the lack of specific medical countermeasures, ricin is considered a potential chemical threat. The CDC classifies it as a category B biological agent, defined as a moderately easy-to-disseminate toxin causing moderate illness and low mortality. Several criminal cases have involved ricin possession or attempted use, including the assassination of Bulgarian dissident Georgi Markov in 1978 and more recent incidents involving contaminated letters sent to U.S. presidents Obama in 2014 and Trump in 2020 [9]. Although castor oil production represents the main industrial relevance of Ricinus communis, ricin is irreversibly denatured by the high temperatures (>80 °C) used during processing. Thus, purified castor oil poses negligible risk. Nevertheless, workers involved in seed crushing may be exposed to residual dust containing the toxin.
Accidental ingestion of castor beans is the most common cause of ricin poisoning, particularly in regions where the plant is widespread, such as the Mediterranean basin. The degree of mastication is crucial in determining the released ricin and the severity of symptoms [3,7,10]. Gastrointestinal manifestations include oropharyngeal irritation, abdominal pain, vomiting, and diarrhoea [7,10,11,12,13,14], followed by systemic signs such as flu-like illness, confusion, lethargy, and, in severe cases, multiple organ failure. Symptoms may appear within 15 min to 36 h after ingestion, while non-lethal cases generally recover within 3–4 days [15]. Death occurs in up to 10% of cases.
Despite extensive literature, determining the minimum lethal number of castor beans for humans remains impossible due to multiple variables, including bean size, ricin content, and patient-specific factors. Reported cases describe ingestion from 0.5 to 200 seeds with widely variable outcomes [15]. It has been suggested [7] that ingestion of three beans may be fatal for children and four to eight may be lethal for adults.
Although several therapeutic approaches have been investigated—including monoclonal antibodies and toxin inhibitors—and a vaccine candidate (RiVax™) is in development, no antidote is commercially available [16,17].
Recent studies in preclinical models underlined the potential of passive immunotherapy (mAbs), demonstrating the neutralising and protective efficacy of a new generation of high-affinity anti-ricin monoclonal antibodies (mAbs). These findings offer promising support for the clinical development of a therapeutic candidate against ricin intoxication, also opening the way for healing vaccination strategies against ricin or other RIP toxins [16,17].
Hence, since any antidote is available and specific practice guidelines have still to be developed for ricin-intoxicated patients, supportive care and symptom management still remain the mainstay of the treatment, including activated charcoal administration, gastroprotection and hydration.
It clearly emerges that an urgent need exists for reliable laboratory methods to determine ricin in different matrices and support diagnosis and management of poisoned patients in emergency settings [18].
Detection is challenging due to low expected toxin concentrations and matrix interference. Most existing assays rely on antibody–antigen binding or electrochemiluminescence [19,20,21,22,23,24,25,26,27,28,29,30,31,32], though applications to real clinical cases are limited. These assays are simple to perform, but their ability to detect low concentrations of ricin in body specimens is limited by potential cross-reactivity with interfering substances, such as proteins and other lectins found in biological samples. Several approaches using mass spectrometry have been developed [6,33,34]. Matrix-assisted laser desorption ionisation-time of flight mass spectrometry (MALDI TOF) is valuable but unsuitable for clinical samples as it lacks sensitivity and is not definitive for identification due to molecular weight similarity between ricin and other proteins [35,36]. HPLC-MS/MS (high-performance liquid chromatography coupled with triple quadrupole mass spectroscopy detector) analysis of ricin peptides resulting from trypsinisation enhances both sensitivity and specificity [33,34,37]. However, these last techniques require expensive instrumentation and trained personnel to interpret the results. Moreover, the primary structure of ricin is cultivar-dependent [6,18,38], so the tryptic fragments obtained strictly depend on the cultivar. Other approaches combine HPLC-MS/MS with prior affinity capture of the toxin [18,34,37]. All these approaches are time-consuming, not user-friendly and very expensive, so that in 2025, a typical HPLC-MS/MS or MALDI TOF analysis can cost 4 to 100 times as much as an ELISA analysis, making them difficult to implement in standard care situations and for in situ applications.
To address these challenges, in the current study, we developed a novel, rapid (<5 h), cost-effective method combining lectin affinity capture of ricin using lactose–agarose (LA) beads with quantitative detection by ELISA (Enzyme Linked ImmunoSorbent Assay). The protocol includes (a) ricin capture and matrix clean-up using LA beads based on lectin-carbohydrate affinity, (b) ELISA quantification of ricin and RCA120, and (c) sodium dodecyl sulphate polyacrylamide gel electrophoresis (SDS-PAGE) confirmation when required to assess the presence of both ricin and RCA120. This method was applied to real biological samples from intoxicated patients. Ricin and RCA120 concentrations in blood and urine from seven subjects were successfully determined, representing the first quantitative report in real clinical scenarios.
2. Materials and Methods
2.1. Instrumentation
A JOUAN CR4i Centrifuge from Thermo Electron Corporation (Waltham, MA, USA) was used for centrifugation, and a centrifuge 5415 R from Eppendorf (Milan, Italy) was used for ultracentrifugation. Gel permeation chromatography with UV and conductivity detector (GPC-UV/conductivity) analyses were performed on the NGC Chromatography Systems interfaced with the BioFrac™ Fraction Collector from Bio-Rad (Milan, Italy). ENrichTM SEC 650 (10 × 300 mm) Column (BioRad, Milan, Italy) and HiLoad 16/600 Superdex 200 (Cytiva, Björkgatan, Sweden, 16 mm × 60 cm) columns were used for gel filtration separations. Centrifugal Filter Units (Amicon ® Ultra–15–10K) from Millipore (Merck, Milan, Italy) were used to concentrate protein extracts. SDS-PAGE was performed with PowerPac Basic Power Supply and Mini-PROTEAN® Tetra System from Bio-Rad (Milan, Italy). The ELISA plate was read on Winooski, VT 05404-0998 by BioTek Instruments Inc. (Highland Park, IL, USA) at a wavelength of 405 nm. Supelco Visiprep SPE (Solid-Phase Extraction) DL vacuum manifold was used as a vacuum system for solid-phase extraction. FinePCR TW3 Twist Shaker from Finemould Precision Ind. Co. (Seoul, Korea) was used to shake samples.
2.2. Chemicals and Reagents
Water HPLC Plus, Phosphate-buffered saline tablet (PBS, pH 7.4), and lectin-binding resin α-Lactose-Agarose-50% saline suspension with a nominal binding capacity of 30 mg lectin/g resin were purchased from Merck (Milan, Italy). 99% sodium azide was purchased from Farmitalia Carlo Erba (Milan, Italy).
10% Mini-PROTEAN® TGX™ Precast Protein Gels, 10× Tris/glycine/SDS Running Buffer, 2× Laemmli Sample Buffer, Coomassie Brilliant Blue R-250 Staining Solution, Coomassie Brilliant Blue R-250 Destaining Solution, Precision Plus Protein™ All Blue Prestained Protein Standards (10 proteins mix, MW 10 kDa to 250 kDa, code 1610373) and Gel Filtration Standard (lyophilized mix of thyroglobulin, bovine γ-globulin, chicken ovalbumin, equine myoglobin, and vit B12, MW 1350–670,000 Da; pI 4.5–6.9, code 1511901) were purchased from Bio-Rad (Milan, Italy).
Ricin-specific ELISA kits with pre-coated (+/−) plates were purchased from Tetracore Inc. (Rockville, FL, USA).
Ricin solutions were inactivated before discharging by diluting with commercial bleach [39].
2.3. Purification of Ricin and RCA120 from Seeds
Ricin and RCA120 were extracted from seeds of R. communis according to a published method [5,40]. Briefly, seeds were decorticated and extracted with an acetic acid solution under shaking. The mixture was then filtered, the solid residue was washed with acetic acid solution and hexane was used to separate the oily component. The aqueous phase was saturated with ammonium sulphate to promote protein precipitation. To isolate ricin and RCA120 from the other protein constituents in the crude extract of R. communis, SPE with an α-Lactose-Agarose (LA) commercial resin [41] was used. The eluates from SPE treatment were concentrated using Centrifugal Filter Units (Amicon® Ultra–15 mL–10K) by spinning at 1700 RCF for 20 min. Ricin and RCA120 were purified from this last solution by preparative GPC-UV/conductivity using a HiLoad 16/600 Superdex 200 column with PBS as the eluent, resulting in two distinct, pure fractions. These fractions were analysed for purity through 10× Tris/Glycine SDS-PAGE, followed by staining with Coomassie Brilliant Blue. The protocol is illustrated in Figure 1.
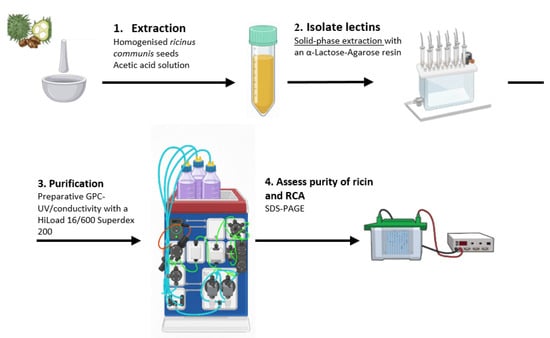
Figure 1.
A visual representation of the protocol used for the purification of ricin and RCA120 from R. communis seeds.
The protein content of the purified ricin and RCA120 solutions was quantitatively assessed by measuring the absorbance at 280 nm, subtracting the absorbance at 320 nm and applying the Lambert-Beer law, using an extinction coefficient of 1.1615 mL/(mg·cm) for ricin and 1.17 mL/(mg·cm) for RCA120 [4].
The solutions were stored at 4 °C with 0.02% w/v sodium azide. No attempt was made to isolate the toxin in dry form, and diluted solutions (concentration <600 mg/L) were handled to reduce the hazard associated with their manipulation. Moreover, very concentrated ricin and RCA120 solutions easily form aggregates [42], while, in diluted solutions, they are stable over a wide pH and temperature range [43].
For the preparation of the ELISA calibration curve, diluted solutions were prepared from the concentrated ones in PBS containing 0.10 M lactose to ensure matrix matching with the biological samples, as these were recovered and eluted from the SPE cartridge using the same eluent (see below).
2.4. ELISA
Ricin and RCA120 levels in clinical samples (i.e., plasma or urine) were quantified using a commercial ricin-specific ELISA, namely, the pre-coated (+/−) Ricin BioThreat Alert ELISA Kit (Tetracore, Inc., Rockville, FL, USA). The assay was conducted following the manufacturer’s recommended protocol after SPE treatment of the samples.
Necessary buffers were prepared in advance: PBS, PBS with Tween-20 (870 µM, PBST), and ELISA Dilution/Blocking Buffer (5% w/v dry skim milk in PBST, provided with the kit). The assay procedure included the following steps:
- 150 µL of ELISA dilution/blocking buffer was added to each well, followed by incubation at 37 °C for 1 h.
- Each well was washed four times with 250 µL of PBST.
- 100 µL of toxin standards, prepared in serial dilutions ranging from 0.488 ng/mL to 500 ng/mL, was added to one positive and one negative row of the plate.
- 100 µL of an unknown sample was added to each pair of positive and negative wells (in triplicate), followed by incubation at 37 °C for 1 h.
- Each well was washed four times with 250 µL of PBST.
- 100 µL of detector antibody (Monoclonal Antibody 58-5F4, provided with the kit) was added to each well and incubated at 37 °C for 1 h.
- Each well was washed four times with 250 µL of PBST.
- 100 µL of conjugate antibody (Goat anti-Mouse IgG (H + L) − HRP, provided with the kit) was added to each well and incubated at 37 °C for 1 h.
- Each well was washed four times with 250 µL of PBST.
- 100 µL of ABTS peroxidase substrate (provided with the kit) was added to each well and incubated at 37 °C for 30 min.
- Absorbance was measured at 405 nm using a microplate reader.
Ricin and RCA120 concentrations were determined by subtracting the absorbance of negative-coated wells from that of positive-coated wells [18,44,45]. As the ELISA was performed on samples after SPE, the analysed solutions consisted of the proteins of interest dissolved in PBS + 0.1 M lactose. Accordingly, both samples and standards were diluted in this buffer for the evaluation of dilution integrity.
2.5. Method Validation
Method validation was conducted in accordance with the guidelines established by the European Medicines Agency (EMA) and the International Council for Harmonisation (ICH) [46]. The validation workflow was adapted from a previously published article [47].
The analytical parameters were evaluated using a comprehensive data set of nine replicates at seven concentration levels. The assessed parameters included specificity and selectivity, calibration curve, limit of detection (LOD), limit of quantification (LOQ), precision (expressed as Coefficient of Variation, CV%), accuracy (expressed as Bias, BIAS%), and dilution integrity. Additional experiments were employed to evaluate supplementary parameters, specifically recovery (ER%), matrix effect (ME%), and stability metrics. Robustness was assessed as batch-to-batch consistency. This was achieved by analysing two independently prepared ricin standards on different days and utilising distinct plate lots.
The selected validation parameters were deemed appropriate for the intended analytical application of this method, where experimental conditions were controlled by design. Consequently, supplementary parameters (such as robustness), typically required only for full clinical diagnostic validation, were not considered necessary within this context.
2.5.1. Specificity and Selectivity
Three plant extracts containing lectins other than ricin were analysed to evaluate the commercial ELISA selectivity, namely, Viscum album, lentil (Lens culinaria), and Phytolacca americana. Viscum album and Phytolacca Americana, which spontaneously grew plants, were collected in September 2024 in Varzo (Piedmont, Italy). Lens culinaria was purchased from a local supermarket in September 2024 (Pavia, Italy). Lectins were extracted by treating the pulverised vegetable material with PBS (plant:PBS weight ratio 1:20) for 12 h on a tilting laboratory mixer (37 rpm) at 20 °C [5,40]. Filtered (0.45 µm) raw extracts were analysed following the protocol used for ricin analysis (Section 2.3 and Section 2.4).
The cross-reactivity of ricin and RCA120 was evaluated using pure standard interpolated against a ricin standard calibration curve. According to the literature [24], the antibodies of the ELISA kit interact preferentially with the B chain of ricin and have significant cross-reactivity with the agglutinin RCA120.
2.5.2. Calibration
The best calibration model was calculated using ten calibration levels (0.488 ng/mL–1.95 ng/mL–3.9 ng/mL–7.8 ng/mL–15.6 ng/mL–31.3 ng/mL–62.5 ng/mL–125 ng/mL–250 ng/mL–500 ng/mL). Initially, the 4-parameter logistic (4-PL) model, a non-linear regression model, was employed to fit the curve. However, the 4-PL model requires specialised software tools that are not easily accessible in routine screening scenarios; thus, the calibration range was reduced to capture the linear trend. The calibration curve was then modelled using six calibration levels (from 3.9 ng/mL to 125 ng/mL). The curve was obtained by plotting the corrected absorbances at 405 nm (see Section 2.4) against the concentrations. First, the heteroscedasticity of the data points was tested twice using an F-test and the Levene equation [48], which was chosen as the reference test. Since the variance increased with concentration, a weighted model was adopted, using either a 1/x or a 1/x2 weighting factor, by calculating which option generated the smallest spread of weighted normalised variances [49]. The order of the weighted least squares calibration model (linear vs. quadratic) was selected using Mandel’s test [47]. Finally, a Shapiro-Wilk test was used to assess the normality of model residuals.
2.5.3. Limit of Detection (LOD) and Limit of Quantification (LOQ)
The limit of detection (LOD) was defined as the concentration corresponding to the mean absorbance of five readings of blank plasma samples (pooled samples from the Clinical Laboratory of IRCCS Maugeri, Pavia) plus 3.3 times their standard deviation (σ). The limit of quantification (LOQ) was determined using the lowest concentration point on the calibration curve at which the criteria for precision and accuracy were found to be acceptable, as detailed in the relevant guidelines [46].
2.5.4. Accuracy and Precision
Accuracy and precision were calculated from the data derived from nine calibration curves acquired over three distinct days of analysis. The method’s accuracy was quantified as bias% for each concentration level. Intra-day accuracy was determined by iteratively employing a back-calculation procedure: three calibration curves collected on the same day were considered, where two curves were used to construct a calibration model, and this model subsequently performed the back-calculation of the concentration values for the data points of the third curve; this process was repeated for all possible combinations of model construction and back-calculation across all three days, and the calculated concentration values were used to determine the overall Bias%. Inter-day accuracy was evaluated similarly by using two calibration curve sequences collected over two separate days to compute the calibration model, which was then used to back-calculate the data points of the third sequence, and all resulting back-calculated concentration values were averaged to determine the overall inter-day Bias% [50]. Intra- and Inter-day Precision were expressed as the Coefficient of Variation (CV%) for each concentration level, calculated by following the identical back-calculation procedure utilised for the accuracy assessment.
2.5.5. Dilution Integrity
Dilution integrity was determined by spiking human blank plasma with ricin at a concentration above the high-concentration standard (125 ng/mL). Then, spiked samples were processed by SPE and diluted with PBS buffer containing 0.1 M lactose to a concentration within the working range. Specifically, the plasma blank was spiked at 500 ng/mL and diluted at 1:10 and 1:100. For each dilution factor, five replicates were analysed, and the calculation of CV% and bias% evaluated the integrity of dilution.
2.5.6. Recovery
Extraction Recovery (ER%) was assessed by spiking blank human plasma samples with ricin at three distinct concentration levels: 5 ng/mL, 10 ng/mL, and 20 ng/mL, prior to the extraction procedure. Each concentration level was tested in triplicate (n = 3). The ER% for each concentration was calculated by first determining the net absorbance corresponding to the extracted analyte by subtracting the absorbance measured in the blank matrix from the absorbance measured in the spiked matrix. This net absorbance value was then converted to the respective concentration using the established calibration curve. The resulting concentration was subsequently divided by the nominal concentration of the spike in the diluent and multiplied by 100 to yield the ER%. Recovery values were considered acceptable if they fell within the 85–115% range.
2.5.7. Matrix Effect
Matrix effect (ME%) was estimated at three distinct concentration levels: 5 ng/mL, 10 ng/mL, and 20 ng/mL. This assessment was performed by comparing the analytical signal obtained from three plasma blank eluates spiked post-extraction with the signal obtained from the standard solution prepared in Phosphate-Buffered Saline (PBS) supplemented with 0.1 M lactose. Additionally, results from samples containing the analytes in PBS alone and PBS + 0.1 M lactose were analysed to exclude any possible interference attributable to the diluent. The ME% for each concentration was calculated as the ratio between the mean absorbance at 405 nm of the standard solution and the mean absorbance at 405 nm of the post-extraction spiked sample. The ME% values were considered acceptable in the 85–115% range.
2.5.8. Stability
Sample stability was investigated using human blank plasma spiked with ricin at two concentration levels (10 ng/mL and 20 ng/mL), with three replicates (n = 3) per concentration. On day 0, spiked samples were treated with the Solid-Phase Extraction (SPE), and the absorbance at 405 nm was immediately evaluated.
To reflect realistic conditions for sample collection, transportation, and delayed processing, a separate set of spiked samples was stored at 4 °C for 24 h before re-analysis. Stability was statistically assessed by comparing the Day 0 and 24 h results using a t-test, following confirmation of data normality via the Shapiro-Wilk test, utilising a significance level (α) of 0.05.
2.6. SDS-PAGE
SDS-PAGE was used to confirm the presence/absence of ricin in blood and urine samples, with a detection limit of <2 ng protein per band [51,52]. SDS-PAGE was performed after SPE treatment, as described below.
SDS-PAGE was performed in all cases under non-reducing conditions. Samples were diluted (1:2) with 2× Laemmli sample buffer (Bio-Rad, 65.8 mM Tris-HCl, pH 6.8 sample buffer, 26.3% (w/v) glycerol, 2.1% SDS, 0.01% bromophenol blue), heated to 70 °C for 10 min, and 20 µL were loaded in a gel well. Separation was done using Bio-Rad Mini-PROTEAN Tetra System, and staining was performed with ready-to-use Coomassie Brilliant Blue R-250, shaking the gel for 1 h at room temperature (35 rpm), while destaining was performed by shaking the gel multiple times (4 washes for 30 min) with Coomassie Brilliant Blue R-250 Destaining Solution (35 rpm).
Images were acquired with a Galaxy S24 smartphone model SM-S921B/DS equipped with a 50 megapixel camera and collaged with the app Paint (Microsoft Windows 10).
2.7. Human Poisoning: A Case Series
The current investigation reports on seven non-fatal ricin-related intoxications that occurred within the Italian territory over a 12-month period during the last year. These cases involved human patients admitted to Emergency Departments (EDs) following castor bean ingestion, for which the Poison Control Centre (PCC) at IRCSS Maugeri, Pavia (PV), Italy, was contacted.
2.7.1. Case Details
Seven cases were recorded: one attributed to incorrect self-medication (Female, 60 y.o., 4 seeds), two due to accidental intake (Female, 11 y.o., 4 seeds; Male, 4 y.o., 3 seeds), two resulting from intentional self-harm (Female, 25 y.o., 1 seed; Male, 34 y.o., unknown seed quantity), and the final two involving voluntary intake for unspecified reasons (Female, 20 y.o., unknown seed quantity and Male, 28 y.o., unknown seed quantity). Five of the seven poisoned subjects admitted to the EDs experienced severe gastrointestinal symptoms and were managed with supportive and symptomatic treatment, including activated charcoal administration. The remaining two subjects were asymptomatic. All patients fully recovered and were discharged without sequelae after hospitalisation (see Table 3).
2.7.2. Biological Sample Collection and Storage
Upon hospital admission, biological specimens (i.e., blood and urine) were collected for research purposes. Blood samples, collected in lithium-heparin tubes (Becton Dickinson; Plymouth, UK), were centrifuged at 1650 RCF for 10 min at 4 °C to separate plasma from red blood cells. Plasma was subsequently stored in 2 mL aliquots at −80 °C until analysis. Urine samples were also stored at −80 °C until analysis.
2.7.3. Data Recording and Ethical Compliance
When available, data concerning patient medical history, castor bean quantity ingested, time elapsed since ingestion, and clinical course were recorded by the PCC. Subsequently, a copy of the medical record detailing symptoms and treatment was requested. All clinical and laboratory data were anonymised by assigning an identification number for scientific evaluation. The study was reviewed and approved by the Ethics Committee of Istituti Clinici Scientifici Maugeri Hospital (Protocol No. 2615 CE/2022).
2.7.4. Plasma Samples-SPE
Ricin and RCA120 were separated from the other components of plasma samples, exploiting the lactose-binding properties of the ricin B subunit toward a commercial resin [36]. A 40 µL volume of α-lactose-agarose 50% w/v saline suspension was transferred to a 1 mL Eppendorf tube, followed by an ultra-centrifugation at 16,100 RCF for 2 min to remove the preservation liquid. The resin was washed twice with 1 mL phosphate-buffered saline (PBS) using two resuspension/centrifugation cycles at 16,100 RCF for 2 min. 1 mL of the specimen (plasma) was added to the α-lactose-agarose resin (LA), vortexed vigorously, followed by a 5 min agitation on a basculation plate (35 rpm). After removing the supernatant by centrifugation, the resin was washed twice by resuspending it in 1 mL PBS buffer and centrifuging it at 16,100 RCF for 2 min. Finally, ricin and RCA120 were eluted by resuspending the resin in 1 mL of 0.1 M lactose in PBS buffer [45], followed by 2 min centrifugation (16,100 RCF). The resulting supernatant was analysed as described below.
Blank samples and spiked samples were treated in the same manner.
Figure 2 represents a schematic diagram illustrating the protocol adopted for plasma samples.
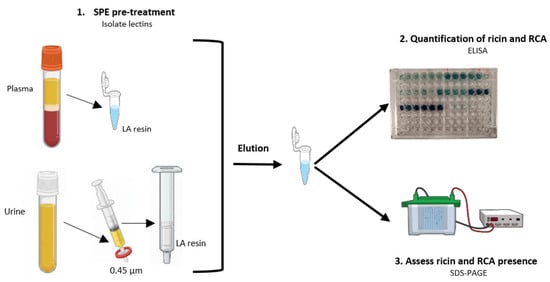
Figure 2.
A visual representation of the protocol used for plasma and urine samples analysis of the intoxicated patients.
2.7.5. Urine Samples-SPE
Urine samples were filtered with a 0.45 µm nylon syringe filter (⌀ 25 mm), followed by SPE using a Supelco Visiprep SPE DL vacuum manifold equipped with integral flow-control valves. The SPE cartridge (1 mL) was loaded with 100 µL α-lactose-agarose commercial resin. SPE steps were (1) cartridge conditioning with 5 mL of PBS buffer, (2) 10 mL sample loading, (3) washing with 5 mL of PBS buffer, and (4) elution of proteins using 1 mL of lactose 0.1M in PBS buffer. The eluent from the cartridges was filtered with a 0.45 µm nylon syringe filter (⌀ 33 mm) and analysed. The flow rate was set at 1 mL/min in all steps. Figure 2 represents a schematic diagram illustrating the protocol adopted for urine samples.
3. Results and Discussion
3.1. Ricin and RCA120 Purification
Pure ricin and RCA120 solutions were obtained as described in paragraph 2.3 and used to create calibration curves by preparing matrix-matched standards and to prepare quality control specimens (QCs).
The chromatogram of the crude protein extract (Supplementary Figure S1A) revealed the presence of ricin and RCA120 along with various co-eluting components. To isolate the two target proteins, it was necessary to separate them by SPE on α-lactose-agarose resin from the matrix before the preparative gel permeation chromatography GPC. The chromatogram of the SPE purified sample (Supplementary Figure S1B) shows three well-distinct peaks corresponding to RCA120, ricin and lactose [4,18]. The SPE purified proteins were subjected to preparative GPC to obtain ricin and RCA120 as separate, pure fractions.
As shown in Supplementary Figure S2, SDS-PAGE demonstrated that the preparative GPC yielded pure fractions (purity >95%) for both ricin and RCA120. Ricin from the specific cultivar used showed a molecular weight (MW) of 60 kDa, while RCA120 had a MW of 152 kDa by interpolating with the following calibration curve: migration (cm) = (−4.91 ± 0.2)log(MW) + (11.3 ± 0.4), obtained on the SDS-PAGE with molecular weight standards.
3.2. Validation of ELISA Assay
3.2.1. Calibration Model and Working Range
A standard curve was initially constructed across a broad range of ricin concentrations, from 0.488 ng/mL to 500 ng/mL. The data were initially modelled using a 4-parameter logistic (4-PL) non-linear regression model (Figure 3A) [53,54]. To simplify the routine screening procedure and overcome the dependency on specialised software and expertise required for non-linear fitting, a linear least-squares approach was subsequently adopted. The working range was optimised by selecting only the data points within the steep, linear portion of the logistic curve. The final calibration curve was then modelled using a linear weighted least squares approach with 1/x weighting (Figure 3B). The validated linear range, spanning from 3.9 ng/mL to 125 ng/mL, was employed for all subsequent parameter validations. The suitability of this linear model is further supported by the normal distribution of residuals (Figure 4).
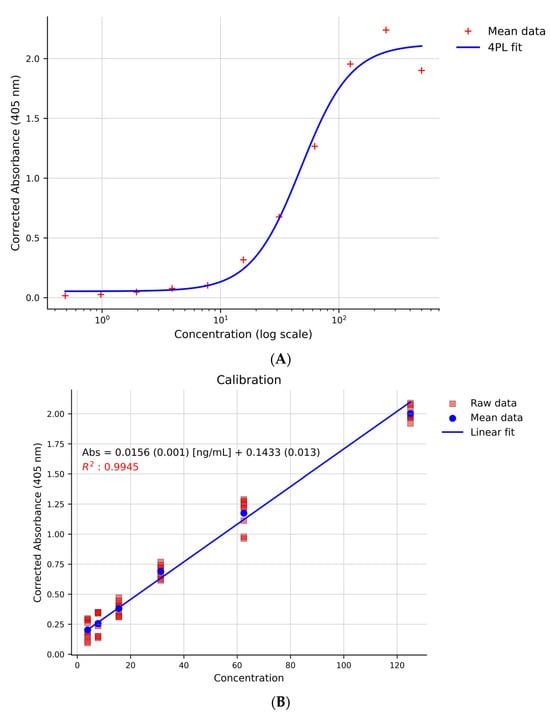
Figure 3.
(A): Non-regression model (4-PL) for the standard curve (ricin from 0.488 ng/mL to 500 ng/mL). (B): Calibration curve (ricin from 3.9 ng/mL to 125 ng/mL) modelled using a linear weighted least squares approach with a 1/x weighting scheme. Corrected absorbance: absorbance obtained as described in paragraph 2.4. In the calibration curve equation, between parentheses the standard deviation is reported.
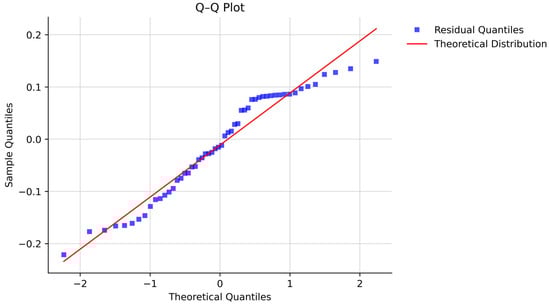
Figure 4.
Q-Q plot of the linear regression residuals of the nine replicated on the calibration curves (data used for Figure 3), showing approximate normality.
The Effective Concentration 50 (EC50), calculated using the 4-PL regression, was determined to be 47.9 ng/mL. The Limit of Detection (LOD) and Limit of Quantification (LOQ) were established at 2.74 ng/mL and 3.9 ng/mL, respectively. As defined in Section 2.5.3, the LOQ was set at 3.9 ng/mL as it corresponded to the lowest calibration point meeting the intra-day precision and accuracy criteria, providing reliable quantification over the short analytical intervals typical of real-case scenarios, despite falling short of the inter-day precision threshold.
3.2.2. Accuracy and Precision Performance
Intra- and inter-day accuracy and precision were assessed as described in paragraph 2.5.4. The analytical method validation criteria required the mean Bias% to be within 20% (with an extended acceptable range up to 25%) and the mean Coefficient of Variation (CV%) to be below 20% for all calibration levels.
The intra-day performance successfully met these criteria. However, inter-day precision exceeded the 20% threshold for the lowest calibrators. This finding is consistent with the known behaviour of the Enzyme-Linked ImmunoSorbent Assay (ELISA) at low concentrations, where a lower signal-to-noise ratio amplifies small, cumulative fluctuations in environmental conditions, operator technique, and ELISA kit stability [24]. Crucially, all calibration levels met the bias criterion. Therefore, the method is considered suitable for quantitative applications within the validated range, particularly when low-end measurements are performed within the same analytical day. This conclusion was reinforced by the analysis of two independent batches of nine replicates at the highest calibration point (125 ng/mL), where no significant difference was found (p > 0.05). The full results are presented in Table 1.

Table 1.
Precision and accuracy results obtained with standards with different ricin concentrations (ELISA analysis).
3.2.3. Dilution Integrity and Stability
Dilution integrity was evaluated at 1: 10 and 1:100 dilution factors in both standard solutions and plasma spiked samples. The 1:10 dilution yielded optimal results for both precision and accuracy. Conversely, the 1:100 dilution showed reduced reliability, consistent with validation data that indicated high variability and reduced accuracy near the LOQ.
The stability of plasma samples spiked with ricin at 10 ng/mL and 20 ng/mL was assessed by comparing ELISA measurements at time 0 and after 24 h of storage at 4 °C. A marked and statistically significant decrease in signal was observed at both concentration levels, confirmed by a t-test (Figure 5A,B). At 10 ng/mL, absorbance decreased from 0.357 (95% CI: 0.285–0.425) to 0.132 (95% CI: 0.067–0.198). At 20 ng/mL, absorbance decreased from 0.699 (95% CI: 0.652–0.764) to 0.444 (95% CI: 0.353–0.536). The calculated effect sizes (Cohen’s d of 8.10 and 8.67, respectively) indicate a highly consistent loss of the detectable ricin signal during sample storage at 4 °C.
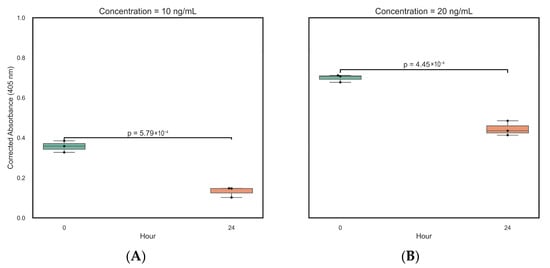
Figure 5.
Boxplots of the T-test relative to ELISA measurements at time 0 and after 24 h of storage of the plasma sample at 4 °C (n = 6). (A). Plasma sample spiked with ricin at 10 ng/mL. (B). Plasma sample spiked with ricin at 20 ng/mL.
This instability aligns with expectations, as plasma contains various proteases (e.g., serine-, cysteine-, or aminopeptidases) responsible for the proteolytic degradation of proteins like ricin. Based on these results and existing literature, samples containing ricin and its components should be stored at −20 °C to −80 °C for improved stability, especially during transport and long-term storage [55]. Therefore, rapid sample processing and analysis or immediate freezing are required to ensure analyte integrity and reliable data.
During the ELISA test, we observed no issues related to protein degradation, as indicated by recovery tests on spiked samples.
3.2.4. Extraction Recovery, Selectivity, and Robustness
Extraction Recovery (ER%) was consistently high across all tested concentration levels (Table 2), confirming the efficiency and reliability of the extraction procedure. Furthermore, recovery studies comparing standards prepared in neat PBS versus PBS + 0.1 M lactose showed no significant difference (t-test, p-value > 0.5), and a spiking study in PBS + 0.1 M lactose yielded a recovery of 110%. This supports the robustness of the method, particularly since the kit vendor’s protocol recommends a lactose-containing solution for lectin extraction.
Table 2.
Recovery results obtained with ricin in spiked serum after SPE treatment and ELISA analysis.
Regarding selectivity, the commercial kit is known to bind both ricin and Ricinus communis agglutinin (RCA120) [24]. Analysis of RCA120 with the same kit suggested that ricin and RCA120 respond similarly on a molar basis, indicating that the kit cannot effectively differentiate between the two proteins. Consequently, the kit’s response in patient samples reflects the combined concentration of both components. When differentiation is required, the combined use of SDS-PAGE provides complementary information for separating and detecting the two proteins.
To confirm the kit’s selectivity against unrelated lectins, three crude plant extracts (Viscum album, Lens culinaria, and Phytolacca americana) were analysed. The resulting absorbance values were not significantly different from the blank sample, confirming the kit’s selectivity toward ricin and RCA120.
Finally, the robustness of the analytical protocol was tested by comparing two independent batches of standards (prepared from different ricin/RCA sources) analysed on different days and using different ELISA plate lots. The comparison of the corrected absorbance values using the Mann-Whitney U test showed no statistically significant difference between batches (p = 0.216, Effect Size r = 0.302) (Figure 6). While Batch B exhibited greater absorbance deviation compared to Batch A, the median absorbance values—Batch A at 1.988 (95% CI: 1.967–2.076) and Batch B at 1.907 (95% CI: 0.877–2.096)—indicated no meaningful batch-to-batch variability. The minor observed deviation in Batch B may be attributed to matrix effects or minor variations in operator technique and instrumentation. Recovery, Table 2, was consistently high across all concentration levels, showing the efficiency and reliability of the extraction procedure.
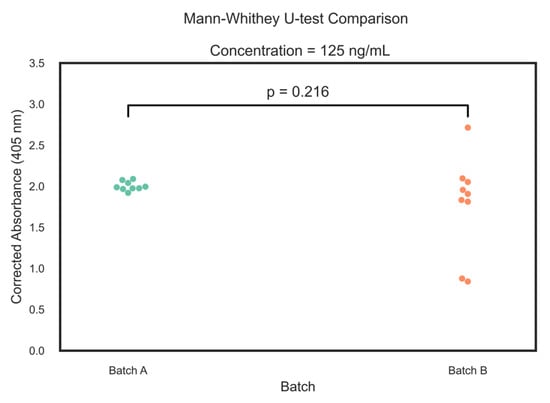
Figure 6.
Swarm plots of Mann-Whitney U-test relative of two ELISA measurements of different batches of ricin (n = 9).
3.3. Case Series
The analytical method developed was then applied for the analysis of biological samples (blood and urine) relative to seven non-fatal ricin-intoxication cases managed by the PCC. For all seven patients, blood samples were collected, while urine was available for six of them (all but patient 2).
Blank human plasma spiked at concentrations of 5 ng/mL, 10 ng/mL, and 20 ng/mL was also analysed.
The analytical method consisted of the three stages already outlined: (a) ricin and RCA120 separation from the matrix by using α-LA commercial resin, (b) quantitative determination of ricin and RCA120 by means of ricin-specific ELISA kit, and (c) qualitative SDS-PAGE analysis to confirm the presence of both ricin and RCA120.
3.3.1. ELISA Assay of Biological Samples
The validation study confirmed that the kit lacked selectivity toward ricin relative to RCA120; consequently, the concentration value derived corresponded to the sum of both toxins (ricin and RCA120). The established Limit of Detection (LOD) for this assay is 2.74 ng/mL. Despite the absence of published methods for determining ricin in human plasma and a resulting lack of comparable data, the determined LOD concentration is considered reasonably within the relevant range for cases of ricin intoxication. The only available literature data, reported by Feldber et al. [36], indicated a ricin concentration of approximately 3 ng/mL in an abdominal fluid sample 72 h following self-injection of a castor bean extract.
The results obtained for each patient are summarised in Table 3. The assay successfully identified toxins in all plasma samples, except for Patient 1, where the toxins concentration was below the Limit of Quantification (<LOQ). In the case of urine samples, the concentrations detected were below the Limit of Detection (<LOD) across all subjects. To the best of our knowledge, this report represents the first determination of plasma ricin concentration in human intoxication cases.
Table 3.
Ricin human poisoning cases (Pavia Poison Centre—National Toxicology Information Centre data) over 12-month period during 2024–2025. All cases were non-fatal intoxications. Table summarising main data. Result (ng/mL) for all patients’ specimens. * Results account for the pre-concentration obtained by the SPE step (×5).
3.3.2. SDS-PAGE of Biological Samples
SDS-PAGE was performed under non-reducing conditions to identify ricin and RCA120 in biological samples (plasma and urine) after solid-phase extraction (SPE) and to confirm the results obtained by ELISA. In the sample of intoxicated subjects and in spiked blood, two distinct bands (Figure 7) were observed: one at about 60 kDa, which corresponded to ricin, and another running above 120 kDa, marked as RCA120. Weak bands of lower and higher molecular weight than the target proteins were also observed in ricin-positive plasma samples. These bands could not be related to the lectins present in the blood of non-intoxicated subjects, as they had no significant affinity for the lactose residues of the resins and were not present in blank samples [56]. The bands may represent shorter fragments of ricin or RCA120, adducts between castor bean lectin fractions and plasma proteins, or be related to non-specific adsorption, although not much literature data are available to further support this hypothesis [56].
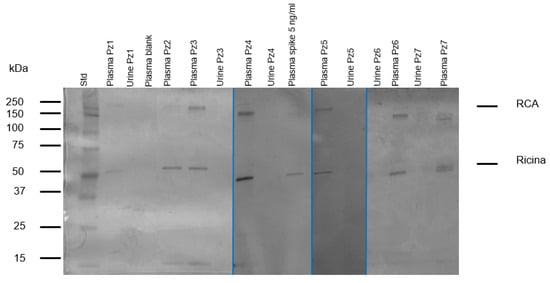
Figure 7.
Analysis of biological samples. SDS-PAGE separation under non-reducing conditions, followed by staining with Coomassie Brilliant Blue. Well 1: Standard markers; well 10: plasma blank spike with ricin at 5 ng/mL.; well 2-5-6-8-11-14-16: patients’ plasma; well 3-7-9-12-13-15: patients’ urine; well: plasma blank. Patient’s 2 urine was not available. The image is a collage of 4 gels obtained at different times, when the specimens become available to the laboratory.
Human blank plasma (pooled sample) was used as a control to determine whether false positives caused by other plasma proteins were of concern. Human toxin-free plasma spiked with 5 ng/mL of ricin and RCA120 were also analysed using the same procedure described. Summing up, no interferences from plasma protein or matrix effect were observed (Figure 7).
All ricin-intoxicated patients’ plasma resulted positive, including patient 1, whose concentration was below the ELISA’s LOQ. It was observed that patients who had eaten the same number of seeds displayed varying band intensities in the SDS-PAGE analysis. This difference may be attributed to the different patients’ body weights (highlighted in Table 3) and physio-pathological factors that can influence the toxin pharmacokinetic [10]. Furthermore, ricin absorption may also be affected by the degree of mastication and the specific cultivar of seed consumed. Research has shown that seeds from different cultivars can contain varying levels of ricin, RCA120, and other isoforms of the toxins [18]. Finally, the concentration in the plasma sample may have been influenced by the time elapsed between ingesting the seeds and sampling biological fluids.
In addition, urine samples were analysed by SDS-PAGE. Figure 7 illustrates that the resulting gel does not show detectable bands within the wells containing the samples analysed. This result is consistent with our expectations and supports the hypothesis that ricin and RCA, both high-molecular-weight proteins, are not detectable in urine due to their specific pharmacokinetics (i.e., metabolism and absence of renal excretion).
Moreover, the above finding clearly shows that from a pharmacokinetic point of view ricin and RCA120 are at least partially absorbed and circulate in the bloodstream without undergoing proteolytic cleavage.
4. Conclusions
The current challenge in managing ricin intoxication lies in the poorly defined fatal dose resulting from the ingestion of castor seeds. The severity and lethality of poisoning remain difficult to predict, as quantities considered potentially fatal have, in several reported cases, produced only mild symptoms [7,10,11,12,13,14,15,57,58]. This unpredictability underscores the urgent need for robust analytical methods capable of enabling early differential diagnosis and supporting emergency physicians and clinical toxicologists in patient management.
In this study, we report the validation and application of a simple, cost-effective, and selective protocol for the identification of ricin in biological and non-biological matrices. The workflow comprises three steps: (1) Solid-Phase Extraction (SPE) using a commercial LA resin for the simultaneous capture of ricin and RCA120; (2) quantification using a commercial ELISA; and, when needed, (3) qualitative confirmation by SDS-PAGE, which provides unequivocal detection of both proteins. Potential ELISA cross-reactivity with matrix components in biological fluids was assessed and mitigated through the SPE step, enabling a limit of detection of 2.7 ng/mL.
A review of the available literature (Table 4) highlights substantial limitations in the clinical applicability of previously published ELISA-based ricin detection methods (summarised in Table 4). Most studies focus on food matrices, which often yield lower LODs than those observed in complex biological specimens. Reports involving non-food matrices primarily rely on samples from experimentally intoxicated animal models, and, critically, no prior studies have applied ELISA assays to samples from human intoxication cases. This lack of clinical validation severely restricts the real-world utility of earlier approaches. Furthermore, many published methods do not adhere to international validation guidelines (e.g., EMA, ICH), raising concerns about their diagnostic reliability. Additional issues arise from the protein standards used, which are frequently prepared via SDS-PAGE purification and thus do not preserve the native tertiary structure of ricin, potentially compromising quantification accuracy. In contrast, the commercial availability of the kit used in this work, together with the standardised protocol, facilitates rapid adoption by a broad range of laboratories.
Table 4.
Comparison of different ELISA tests described in literature.
The validated method described here provides a rapid (~5 h) and straightforward procedure for screening plasma samples from suspected intoxicated patients, without the need for sophisticated instrumentation or specialised personnel. It can be readily integrated into the routine workflow of hospital analytical laboratories and used in emergency settings. Moreover, combining ELISA with SDS-PAGE enables diagnostic confirmation and qualitative differentiation between ricin and RCA120, which can help distinguish exposure to purified ricin from ingestion of crude castor bean material.
Importantly, this is the first published study to apply an EMA/ICH-validated ricin ELISA to biological samples from clinically intoxicated human patients, thereby addressing a critical reliability gap in routine diagnostic toxicology. Methodological robustness was further demonstrated by comparing two independently prepared toxin standards analysed across different days and ELISA plate lots. Additionally, we provide essential stability data showing a significant loss of detectable ricin in plasma stored at 4 °C for 24 h, offering immediate, evidence-based guidance for laboratories to ensure prompt freezing and/or immediate processing of samples.
Overall, this work presents the first clinically validated method for the identification and quantification of ricin and RCA120 in real biological samples from human cases of Ricinus communis seed ingestion, delivering a valuable tool to support emergency physicians in the diagnosis and management of ricin intoxication.
Supplementary Materials
The following supporting information can be downloaded at https://www.mdpi.com/article/10.3390/chemosensors13120414/s1: Figure S1: Chromatogram of crude and purified protein extract. Figure S2: SDS PAGE of purified ricin and RCA120 from Castor bean seeds.
Author Contributions
Conceptualization and methodology D.M., E.R., C.A.L.; validation, A.R., M.P., and G.S.; formal analysis, A.R. and M.P.; investigation: M.P., A.R., G.S.; resources: F.U.; data curation, A.R., M.P., G.S.; writing-original draft preparation, A.R., M.P., G.S., E.R., A.S., D.L., D.M.; writing-review and editing: A.R., M.P., G.S., E.R., A.S., D.L., C.A.L., and D.M. All authors have read and agreed to the published version of the manuscript.
Funding
This research received no external funding.
Institutional Review Board Statement
The Ethics Committee of Istituti Clinici Scientifici Maugeri Hospital also reviewed and approved this study (2615 CE/2022).
Informed Consent Statement
Patient consent was waived due to patient anonymity.
Data Availability Statement
All data are made available in this paper and its Supplementary Material.
Conflicts of Interest
The authors declare no conflicts of interest, including specific financial interests, relationships and affiliations.
Abbreviations
The following abbreviations are used in this manuscript:
| RCA120 | Ricinus communis agglutinin |
| SPE | Solid-phase extraction |
| GPC | Gel Permeation Chromatography |
| SDS-PAGE | Sodium Dodecyl Sulphate—PolyAcrylamide Gel Electrophoresis |
| kDa | kilo Dalton |
| ELISA | Enzyme-Linked ImmunoSorbent Assay |
| PCC | Pavia Poison Control Centre |
| IRCCS | Istituti di Ricovero e Cura a Carattere Scientifico |
| RTA | Ricin Toxin A |
| RTB | Ricin Toxin Binding subunit B |
| RIP | Ribosome-inactivating protein |
| LD50 | Median lethal dose |
| CDC | Centres for Disease Control and Prevention |
| MALDI | matrix-assisted laser desorption ionization-time of flight mass spectrometry |
| HPLC-MS/MS | High-performance liquid chromatography coupled with triple quadrupole mass spectroscopy detector |
| LA | α-Lactose–agarose |
| Rpm | Rotation per minutes |
| RCF | Relative Centifugal Force |
| EDs | Emergency Departments |
| PBS | Phosphate-buffered saline |
| EMA | European Medicines Agency |
| LOD | limit of detection |
| LOQ | limit of quantification |
| CV% | Coefficient of variation |
| ER% | Extraction recovery |
| ME% | Matrix effect |
| QCs | control specimens |
| MW | Molecular weight |
| EC50 | Effective Concentration 50 |
References
- Akande, T.O.; Odunsi, A.A.; Akinfala, E.O. A Review of Nutritional and Toxicological Implications of Castor Bean (Ricinus communis L.) Meal in Animal Feeding Systems. Anim. Physiol. Nutr. 2016, 100, 201–210. [Google Scholar] [CrossRef]
- Siddiqi, A.I.; Freedman, S.O. Identification of Chlorogenic Acid in Castor Bean and Oranges. Can. J. Biochem. Physiol. 1963, 41, 947–952. [Google Scholar] [CrossRef] [PubMed]
- Rasetti-Escargueil, C.; Avril, A. Medical Countermeasures against Ricin Intoxication. Toxins 2023, 15, 100. [Google Scholar] [CrossRef]
- Falach, R.; Sapoznikov, A.; Alcalay, R.; Aftalion, M.; Ehrlich, S.; Makovitzki, A.; Agami, A.; Mimran, A.; Rosner, A.; Sabo, T.; et al. Generation of Highly Efficient Equine-Derived Antibodies for Post-Exposure Treatment of Ricin Intoxications by Vaccination with Monomerized Ricin. Toxins 2018, 10, 466. [Google Scholar] [CrossRef]
- Hegde, R.; Podder, S.K. Studies on the Variants of the Protein Toxins Ricin and Abrin. Eur. J. Biochem. 1992, 204, 155–164. [Google Scholar] [CrossRef]
- Schieltz, D.M.; McWilliams, L.G.; Kuklenyik, Z.; Prezioso, S.M.; Carter, A.J.; Williamson, Y.M.; McGrath, S.C.; Morse, S.A.; Barr, J.R. Quantification of Ricin, RCA and Comparison of Enzymatic Activity in 18 Ricinus communis Cultivars by Isotope Dilution Mass Spectrometry. Toxicon 2015, 95, 72–83. [Google Scholar] [CrossRef]
- Wedin, G.P.; Neal, J.S.; Everson, G.W.; Krenzelok, E.P. Castor Bean Poisoning. Am. J. Emerg. Med. 1986, 4, 259–261. [Google Scholar] [CrossRef]
- Franke, H.; Scholl, R.; Aigner, A. Ricin and Ricinus communis in Pharmacology and Toxicology-from Ancient Use and “Papyrus Ebers” to Modern Perspectives and “Poisonous Plant of the Year 2018”. Naunyn Schmiedeberg’s Arch. Pharmacol. 2019, 392, 1181–1208. [Google Scholar] [CrossRef] [PubMed]
- Roxas-Duncan, V.I.; Smith, L.A. Ricin Perspective in Bioterrorism; IntechOpen: London, UK, 2012. [Google Scholar] [CrossRef]
- Bradberry, S.M.; Dickers, K.J.; Rice, P.; Griffiths, G.D.; Vale, J.A. Ricin Poisoning. Toxicol. Rev. 2003, 22, 65–70. [Google Scholar] [CrossRef] [PubMed]
- Challoner, K.R.; McCarron, M.M. Castor Bean Intoxication. Ann. Emerg. Med. 1990, 19, 1177–1183. [Google Scholar] [CrossRef]
- Kopferschmitt, J.; Flesch, F.; Lugnier, A.; Sauder, P.; Jaeger, A.; Mantz, J.M. Acute Voluntary Intoxication by Ricin. Hum. Toxicol. 1983, 2, 239–242. [Google Scholar] [CrossRef]
- Malizia, E.; Sarcinelli, L.; Andreucci, G. Ricinus Poisoning: A Familiar Epidemy. Acta Pharmacol. Toxicol. 1977, 41 (Suppl. S2), 351–361. [Google Scholar]
- Hutchinson, L.T.R. Poisoning by Castor-Oil Seeds. Ind. Med. Gaz. 1900, 35, 196–197. [Google Scholar]
- Abbes, M.; Montana, M.; Curti, C.; Vanelle, P. Ricin Poisoning: A Review on Contamination Source, Diagnosis, Treatment, Prevention and Reporting of Ricin Poisoning. Toxicon 2021, 195, 86–92. [Google Scholar] [CrossRef]
- Orsini Delgado, M.L.; Avril, A.; Prigent, J.; Dano, J.; Rouaix, A.; Worbs, S.; Dorner, B.G.; Rougeaux, C.; Becher, F.; Fenaille, F.; et al. Ricin Antibodies’ Neutralizing Capacity against Different Ricin Isoforms and Cultivars. Toxins 2021, 13, 100. [Google Scholar] [CrossRef] [PubMed]
- Lequesne, L.; Dano, J.; Rouaix, A.; Kropp, C.; Plaisance, M.; Gelhaye, S.; Lequesne, M.-L.; Piquet, P.; Avril, A.; Becher, F.; et al. A Monoclonal Antibody with a High Affinity for Ricin Isoforms D and E Provides Strong Protection against Ricin Poisoning. Toxins 2024, 16, 412. [Google Scholar] [CrossRef] [PubMed]
- Worbs, S.; Skiba, M.; Söderström, M.; Rapinoja, M.-L.; Zeleny, R.; Russmann, H.; Schimmel, H.; Vanninen, P.; Fredriksson, S.-Å.; Dorner, B. Characterization of Ricin and R. Communis Agglutinin Reference Materials. Toxins 2015, 7, 4906–4934. [Google Scholar] [CrossRef]
- Chen, H.Y.; Tran, H.; Foo, L.Y.; Sew, T.W.; Loke, W.K. Development and Validation of an ELISA Kit for the Detection of Ricin Toxins from Biological Specimens and Environmental Samples. Anal. Bioanal. Chem. 2014, 406, 5157–5169. [Google Scholar] [CrossRef]
- Shyu, H.-F.; Chiao, D.-J.; Liu, H.-W.; Tang, S.-S. Monoclonal Antibody-Based Enzyme Immunoassay for Detection of Ricin. Hybrid. Hybridomics 2002, 21, 69–73. [Google Scholar] [CrossRef] [PubMed]
- Brandon, D.L. Detection of Ricin Contamination in Ground Beef by Electrochemiluminescence Immunosorbent Assay. Toxins 2011, 3, 398–408. [Google Scholar] [CrossRef]
- Brandon, D.L.; Korn, A.M. Immunosorbent Analysis of Toxin Contamination in Milk and Ground Beef Using IgY-Based ELISA. Food Agric. Immunol. 2016, 27, 496–508. [Google Scholar] [CrossRef]
- Dixit, S.; Parashar, J.; Dhaked, R.K.; Kumar, A.; Saxena, N. Development and Validation of Streptavidin-Biotin-Based Double Antibody Sandwich ELISA for Ricin Diagnosis. Int. Immunopharmacol. 2024, 132, 111986. [Google Scholar] [CrossRef]
- Garber, E.A.E.; Eppley, R.M.; Stack, M.E.; Mclaughlin, M.A.; Park, D.L. Feasibility of Immunodiagnostic Devices for the Detection of Ricin, Amanitin, and T-2 Toxin in Food. J. Food Prot. 2005, 68, 1294–1301. [Google Scholar] [CrossRef]
- Garber, E.A.E. Toxicity and Detection of Ricin and Abrin in Beverages. J. Food Prot. 2008, 71, 1875–1883. [Google Scholar] [CrossRef]
- Garber, E.A.E.; Thole, J. Application of Microwave Irradiation and Heat to Improve Gliadin Detection and Ricin ELISA Throughput with Food Samples. Toxins 2015, 7, 2135–2144. [Google Scholar] [CrossRef]
- Griffiths, G.D. Evaluation by ELISA of Ricin Concentration in Fluids and Tissues after Exposure to Aerosolised Ricin, and Evaluation of an Immunochromatographic Test for Field Diagnosis. J. Clin. Toxicol. 2013, 3, 21610495. [Google Scholar] [CrossRef]
- Guo, J.; Shen, B.; Feng, J.; Sun, Y.; Yu, M.; Hu, M. A Novel Neutralizing Monoclonal Antibody Against Both Ricin Toxin A and Ricin Toxin B, and Application of a Rapid Sandwich Enzyme-Linked Immunosorbent Assay. Hybridoma 2006, 25, 225–229. [Google Scholar] [CrossRef]
- Jackson, L.S.; Zhang, Z.; Tolleson, W.H. Thermal Stability of Ricin in Orange and Apple Juices. J. Food Sci. 2010, 75, T65–T71. [Google Scholar] [CrossRef]
- Lindsey, C.Y.; Pace-Templeton, J.G.; Millard, C.B.; Wannemacher, R.W.; Hewetson, J.F. Validation of ELISA for the Determination of Anti-Ricin Immunoglobulin G Concentration in Mouse Sera. Biologicals 2006, 34, 33–41. [Google Scholar] [CrossRef]
- He, X.; McMahon, S.; Rasooly, R. Evaluation and Comparison of Three Enzyme-Linked Immunosorbent Assay Formats for the Detection of Ricin in Milk and Serum. Biocatal. Agric. Biotechnol. 2012, 1, 105–109. [Google Scholar] [CrossRef]
- Simon, S.; Worbs, S.; Avondet, M.-A.; Tracz, D.; Dano, J.; Schmidt, L.; Volland, H.; Dorner, B.; Corbett, C. Recommended Immunological Assays to Screen for Ricin-Containing Samples. Toxins 2015, 7, 4967–4986. [Google Scholar] [CrossRef]
- Kalb, S.R.; Schieltz, D.M.; Becher, F.; Astot, C.; Fredriksson, S.-Å.; Barr, J.R. Recommended Mass Spectrometry-Based Strategies to Identify Ricin-Containing Samples. Toxins 2015, 7, 4881–4894. [Google Scholar] [CrossRef]
- Kalb, S.R.; Barr, J.R. Mass Spectrometric Detection of Ricin and Its Activity in Food and Clinical Samples. Anal. Chem. 2009, 81, 2037–2042. [Google Scholar] [CrossRef] [PubMed]
- Brinkworth, C.S.; Pigott, E.J.; Bourne, D.J. Detection of Intact Ricin in Crude and Purified Extracts from Castor Beans Using Matrix-Assisted Laser Desorption Ionization Mass Spectrometry. Anal. Chem. 2009, 81, 1529–1535. [Google Scholar] [CrossRef]
- Feldberg, L.; Elhanany, E.; Laskar, O.; Schuster, O. Rapid, Sensitive and Reliable Ricin Identification in Serum Samples Using LC–MS/MS. Toxins 2021, 13, 79. [Google Scholar] [CrossRef] [PubMed]
- Brinkworth, C.S. Identification of Ricin in Crude and Purified Extracts from Castor Beans Using On-Target Tryptic Digestion and MALDI Mass Spectrometry. Anal. Chem. 2010, 82, 5246–5252. [Google Scholar] [CrossRef]
- Despeyroux, D.; Walker, N.; Pearce, M.; Fisher, M.; McDonnell, M.; Bailey, S.C.; Griffiths, G.D.; Watts, P. Characterization of Ricin Heterogeneity by Electrospray Mass Spectrometry, Capillary Electrophoresis, and Resonant Mirror. Anal. Biochem. 2000, 279, 23–36. [Google Scholar] [CrossRef]
- Cole, K.D.; Gaigalas, A.; Almeida, J.L. Process Monitoring the Inactivation of Ricin and Model Proteins by Disinfectants Using Fluorescence and Biological Activity. Biotechnol. Prog. 2008, 24, 784–791. [Google Scholar] [CrossRef]
- Olsnes, S.; Pihl, A. Different Biological Properties of the Two Constituent Peptide Chains of Ricin a Toxic Protein Inhibiting Protein Synthesis. Biochemistry 1973, 12, 3121–3126. [Google Scholar] [CrossRef] [PubMed]
- Roberts, L.M.; Lamb, F.I.; Pappin, D.J.; Lord, J.M. The Primary Sequence of Ricinus communis Agglutinin. Comparison with Ricin. J. Biol. Chem. 1985, 260, 15682–15686. [Google Scholar] [CrossRef]
- Simmons, B.M.; Russell, J.H. A Single Affinity Column Step Method for the Purification of Ricin Toxin from Castor Beans (Ricinus communis). Anal. Biochem. 1985, 146, 206–210. [Google Scholar] [CrossRef] [PubMed]
- Audi, J.; Belson, M.; Patel, M.; Schier, J.; Osterloh, J. Ricin PoisoningA Comprehensive Review. JAMA 2005, 294, 2342–2351. [Google Scholar] [CrossRef] [PubMed]
- Lumor, S.E.; Hutt, A.; Ronningen, I.; Diez-Gonzalez, F.; Labuza, T.P. Validation of Immunodetection (ELISA) of Ricin Using a Biological Activity Assay. J. Food Sci. 2011, 76, C112–C116. [Google Scholar] [CrossRef] [PubMed]
- Zentz, C.; Frénoy, J.-P.; Bourrillon, R. Binding of Galactose and Lactose to Ricin. Equilibrium Studies. Biochim. Et. Biophys. Acta (BBA) Protein Struct. 1978, 536, 18–26. [Google Scholar] [CrossRef]
- EMEA ICH Topic. Q2(R1) Validation of Analytical Procedures: Text and Methodology; European Medicines Agency: Amsterdam, The Netherlands, 2006. [Google Scholar]
- Alladio, E.; Amante, E.; Bozzolino, C.; Seganti, F.; Salomone, A.; Vincenti, M.; Desharnais, B. Experimental and Statistical Protocol for the Effective Validation of Chromatographic Analytical Methods. MethodsX 2020, 7, 100919. [Google Scholar] [CrossRef] [PubMed]
- Levene, H. Robust Tests for Equality of Variances. Robust. Tests Equal. Var. 1960, 278–292. [Google Scholar]
- Gu, H.; Liu, G.; Wang, J.; Aubry, A.-F.; Arnold, M.E. Selecting the Correct Weighting Factors for Linear and Quadratic Calibration Curves with Least-Squares Regression Algorithm in Bioanalytical LC-MS/MS Assays and Impacts of Using Incorrect Weighting Factors on Curve Stability, Data Quality, and Assay Performance. Anal. Chem. 2014, 86, 8959–8966. [Google Scholar] [CrossRef]
- Alladio, E.; Amante, E.; Bozzolino, C.; Seganti, F.; Salomone, A.; Vincenti, M.; Desharnais, B. Effective Validation of Chromatographic Analytical Methods: The Illustrative Case of Androgenic Steroids. Talanta 2020, 215, 120867. [Google Scholar] [CrossRef] [PubMed]
- Gallagher, S.; Sasse, J. Protein Analysis by SDS-PAGE and Detection by Coomassie Blue or Silver Staining. Curr. Protoc. Pharmacol. 2001, Appendix 3, 3B. [Google Scholar] [CrossRef]
- Májek, P.; Riedelová-Reicheltová, Z.; Suttnar, J.; Dyr, J.E. Staining of Proteins for 2D SDS-PAGE Using Coomassie Blue—Speed versus Sensitivity? Electrophoresis 2013, 34, 1972–1975. [Google Scholar] [CrossRef]
- Findlay, J.W.A.; Dillard, R.F. Appropriate Calibration Curve Fitting in Ligand Binding Assays. AAPS J. 2007, 9, E260–E267. [Google Scholar] [CrossRef] [PubMed]
- Dunn, J.; Wild, D. Calibration Curve Fitting. In The Immunoassay Handbook; Elsevier: Amsterdam, The Netherlands, 2013; pp. 323–336. [Google Scholar] [CrossRef]
- Vollmer, A.C.; Fecher-Trost, C.; Jung, M.; Cole, M.; Arnst, T.F.; Flockerzi, V.; Wagmann, L.; Meyer, M.R. Polyclonal Antibodies towards Abrin and Ricin—Design and Potential Application for Mass Spectrometry-Based Analysis of Human Biosamples. Arch. Toxicol. 2025, 99, 4399–4410. [Google Scholar] [CrossRef]
- Beulaja Manikandan, S.; Manikandan, R.; Arumugam, M.; Mullainadhan, P. An Overview on Human Serum Lectins. Heliyon 2020, 6, e04623. [Google Scholar] [CrossRef]
- Lopez Nunez, O.F.; Pizon, A.F.; Tamama, K. Ricin Poisoning after Oral Ingestion of Castor Beans: A Case Report and Review of the Literature and Laboratory Testing. J. Emerg. Med. 2017, 53, e67–e71. [Google Scholar] [CrossRef] [PubMed]
- El koraichi, A.; Armel, B.; Machkour, Y.; Benjelloun, M.Y.; El Kettani, S.E. Castor Bean Poisoning in Children. Réanimation 2012, 21, 555–556. [Google Scholar] [CrossRef]


Disclaimer/Publisher’s Note: The statements, opinions and data contained in all publications are solely those of the individual author(s) and contributor(s) and not of MDPI and/or the editor(s). MDPI and/or the editor(s) disclaim responsibility for any injury to people or property resulting from any ideas, methods, instructions or products referred to in the content. |
© 2025 by the authors. Licensee MDPI, Basel, Switzerland. This article is an open access article distributed under the terms and conditions of the Creative Commons Attribution (CC BY) license (https://creativecommons.org/licenses/by/4.0/).