Abstract
This work demonstrates the use of SUS316L stainless steel as a new material for the fabrication of quasi-reference electrodes (QREs) intended to replace conventional reference electrodes (REs) in electrochemical sensors. The present study examined the potentials generated by SUS316L specimens annealed in air at 400 °C and above for 1 h or more. Annealing above 500 °C increased the proportion of Cr in surface oxide films, hence reducing the stability of the potential. Samples annealed at 400 °C for 5 h produced the most stable electrode potential, which was attributed to a higher concentration of Fe in the oxide layer. The potential of such specimens increased by only 28.3 mV between test durations of 24 and 168 h, and potential data acquired at 30 s intervals had a standard deviation of less than 2 µV. Applying a surface treatment prior to immersion in the simulated tap water evidently stabilized the electrode potential, as a consequence of the formation of an inner oxide layer together with an outer layer consisting primarily of iron oxides.
1. Introduction
Electrochemical sensors are easily fabricated and inexpensive while providing rapid responses, and so have numerous applications [1,2,3,4]. Among the various electrochemical techniques, potential measurement is one of the simplest and can be used to estimate the corrosion state of a metal and to identify various substances. Hence, this method has been widely applied in many fields, such as chemical monitoring in industrial processes, basic research concerning metallic materials, lead-acid battery applications and medical technology [5,6,7,8,9,10,11,12,13]. It is expected that electrochemical sensors will become increasingly of interest in environmental monitoring and quality control based on recent advances in the Internet of Things and artificial intelligence.
The reference electrode (RE), which provides a stable reference potential, is an essential component of an electrochemical sensor. At present, Ag/AgCl electrodes are widely used but typically require an internal solution to maintain a stable potential. This solution can introduce contaminants into the system being assessed and can also cause the potential to become unstable as the concentration of the solution changes over time [14]. Moreover, these electrodes involve structural and operational limitations, such as instability under high-temperature and high-pressure conditions, are difficult to miniaturize, and require frequent maintenance [14,15]. As such, these devices are not well suited to in situ applications. Several innovative approaches have been reported in recent years with the aim of addressing the limitations noted above. These include the fabrication of small disposable electrodes using screen printing or thermal evaporation technology [16,17,18,19]. REs have also been studied in conjunction with research into corrosion and materials science [20,21] and on a theoretical basis [22].
Quasi-reference electrodes (QREs) have also been investigated as an alternative to traditional REs. Although QREs do not provide an equilibrium potential, these devices can maintain a constant potential in a stable environment and so can function as REs when used in systems that do not undergo variations. On this basis, there has been growing interest in QREs [11,23,24,25,26]. Even so, to date, there has been little research concerning the development of QREs capable of exhibiting stable performance in environments that have low concentrations of redox species, such as tap water. The authors previously investigated the feasibility of using stainless steel (SS) to produce a QRE. SS is known to react with water and with dissolved oxygen to form a stable oxide film, and so was expected to exhibit a stable potential in aqueous solutions. Because environmental factors greatly affect the formation and composition of this passivation film, the associated film growth mechanisms have been studied in detail [27,28,29,30]. However, few studies have examined the stability of the potential generated by SS under such conditions. In previous work by the authors [31], the stability of the potentials generated by various SS specimens was investigated, using SUS304, SUS316, SUS316L and SUS430 samples. A method for the quantitative evaluation and comparison of potential stability was established in this previous research and austenitic SS materials, particularly those in the SUS316 family, were found to show stable potentials even in aqueous environments.
The present study examined the effect of the oxide film characteristics on potential stability by applying different surface treatments to SUS316L specimens. These samples were subsequently evaluated by carrying out open circuit potential (OCP) measurements and surface analyses using electrochemical impedance spectroscopy (EIS), scanning electron microscopy (SEM) and X-ray photoelectron spectroscopy (XPS). These evaluations clarified the relationships between the physical and chemical characteristics of the oxide films and the resulting potential stability. The redox behavior of SS in simulated tap water under conditions that produced a stable potential was also observed. This work demonstrates that SUS316L could potentially be used as a practical QRE in aqueous environments.
2. Materials and Methods
2.1. Materials
SUS316L rod supplied by Aichi Tokei Denki Co., Ltd. (Nagoya City, Aichi, Japan) each having a diameter of 6 mm and the composition provided in Table 1 were used as the electrodes in all trials. Each rod was polished sequentially with a series of emery papers up to #1200. After polishing, the surface was rinsed with pure water and ethanol, followed by drying with a blower. These samples are referred to herein as the polished specimens. In preparation for the experiments, rods were fixed to glass tubes using epoxy resin (Specific Cold Mounting Resin, Struers) so that only the end surface of each rod was in contact with the test solution.

Table 1.
Chemical composition of stainless steels investigated in the present study.
Annealing of the rods was performed in an electric furnace (mini-BS I, Nitto Kagaku) at 400 °C for 1 h, 400 °C for 5 h, 500 °C for 1 h or 800 °C for 1 h. In all cases, the sample was allowed to slowly cool to room temperature in the furnace after heating.
2.2. Analysis of Surface Properties
The surface condition of each annealed SUS316L sample was assessed by SEM (FlexSEM 1000 II, Hitachi, Minato-ku Tokyo) whereas the elemental distributions and surface compositions of these materials were analyzed using energy-dispersive X-ray spectroscopy (EDS, AZtecOne, Oxford Instruments, Shinagawa-ku, Tokyo). The chemical states of the major elements present on the SUS316L surfaces were evaluated by XPS (Quantera SXM, ULVAC-PHI, Chigasaki City, Kanagawa) with an Al Kα radiation source.
2.3. Stability Testing of Corrosion Potential
The stability of the potentials generated by the various specimens was evaluated by acquiring OCP data using a high-input impedance voltmeter integrated with an HZ-7000 potentiostat (Meiden Hokuto) at room temperature (25 °C). In these trials, the steel rod served as the working electrode while a Ag/AgCl electrode (3.33 M KCl solution, +0.206 V vs. SHE) was used as the RE. During each experiment, the potential was measured continuously at 1 s step for a duration of 2 h. These measurements were carried out in aqueous solutions each containing 0.9 mM NaHCO3 and 0.5 mM CaCl2 (we refer to this solution as simulated tap water). This simulated tap water was prepared by adding analytical reagent grade chemicals of NaHCO3 and CaCl2 (Junsei Chemical Co., Ltd., Chuo-ku, Tokyo) to distilled water to the concentrations mentioned above. pH of the solution was 7.3 ± 0.3. These solutions were meant to simulate typical tap water in Japan. The solution was held in a container covered with a lid having a small hole so as to prevent evaporation of the water while allowing some degree of air exchange. The dissolved oxygen concentrations in these solutions were ascertained using a dissolved oxygen meter (DO-5509, Mother Tool) and were found to be in the range of 6.1 ± 0.5 mg/L.
2.4. Electrochemical Analysis
The relationship between the surface condition of the steel and the potential stability of the specimen was investigated by performing EIS and polarization tests using a three-electrode cell connected to an HZ-7000 instrument. Data were obtained in simulated tap water at room temperature (25 ± 3 °C) under ambient conditions, using a SUS316L specimen as the working electrode, a Ag/AgCl electrode as the RE and a Au electrode as the counter electrode (CE). The EIS data were acquired by first recording the OCP for 30 s, after which an AC voltage with an amplitude of 10 mV was applied over the frequency range from 10 kHz to 0.1 Hz. The results were analyzed based on equivalent circuit modeling in conjunction with the Levenberg–Marquardt method, employing the dedicated EIS software (Meiden Hokuto) provided with the potentiostat. The polarization trials were performed by sweeping the potential from the OCP to either +1.5 or −1.5 V to cover potential window of water in low conductive media at a scan rate of 20 mV/min referring to the corrosion test (JIS G 0579). These tests were also conducted under ambient conditions.
3. Results and Discussion
3.1. Surface Observation Result
Figure 1 presents SEM images of the surfaces of various specimens prior to immersion in the simulated tap water. It is apparent that polishing marks generated prior to the annealing remained visible even after heat treatment. Samples annealed at temperatures up to 500 °C exhibited similar surface morphologies regardless of the annealing duration, suggesting that the physical effects of heat treatment at these temperatures were minimal. In contrast, the sample annealed at 800 °C had a distinctly different surface texture comprising granular structures. Hence, annealing at 800 °C significantly altered the surface structure of the SUS316L.
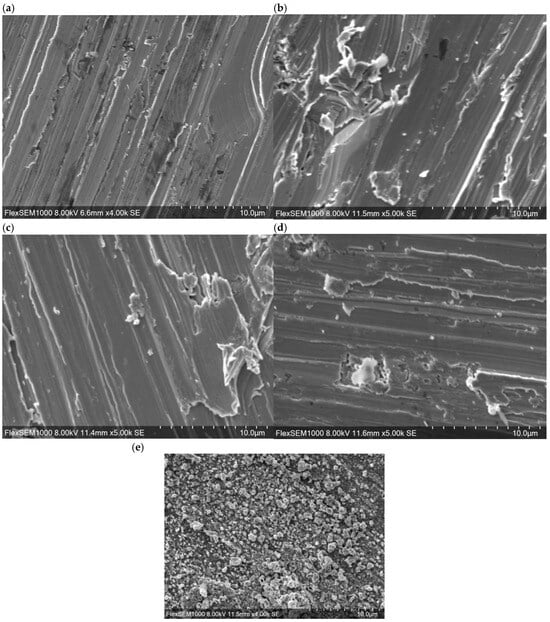
Figure 1.
SEM images of the surfaces of SUS316L specimens (a) after polishing and following annealing at (b) 400 °C for 1 h, (c) 400 °C for 5 h, (d) 500 °C for 1 h or (e) 800 °C for 1 h.
Elemental mapping results (Figure S1) demonstrated that Fe and Cr were uniformly distributed across the surfaces of all samples. Additionally, the distributions of Ni and O in these specimens were found to be aligned with the polishing marks, while C and/or Si were segregated at surface irregularities. However, no significant differences in elemental distribution attributable to annealing conditions were identified. Table 2 summarizes the elemental compositions of the sample surfaces before and after immersion in the simulated tap water, as determined using EDS. Prior to immersion, the annealed materials each exhibited a higher degree of oxidation compared with the polished specimen. This finding indicates that high-temperature annealing promoted surface oxidation of the SUS316L. In particular, the sample annealed at 800 °C had an O content exceeding 40%. The extent to which the proportion of O in the steel was increased following immersion was found to vary depending on the annealing conditions. From these results, it appears that annealing had an effect even after immersion in the simulated tap water. Specifically, the sample annealed at 800 °C showed a decrease in O content after immersion whereas the material annealed at 400 °C for 1 h showed almost no change. Additionally, the polished sample annealed at 400 °C for 5 h showed only an approximate 1% increase in O content whereas the specimen heated at 500 °C showed an increase of approximately 4%.
Table 2.
Elemental compositions of SUS316L specimens before and after immersion in simulated tap water.
The polished sample annealed at 400 °C for 1 h exhibited only a slight increase in its surface Fe/(Fe+Cr) atomic ratio of 0.3–0.5%. Similarly, the sample annealed at 400 °C for 5 h showed almost no change in this value, with an increase of just 0.05%. In contrast, the sample annealed at 500 °C showed a 1.6% decrease in this ratio following immersion. The largest change was observed in the sample annealed at 800 °C, with a 12.1% increase in the ratio after 2 d of immersion. This result suggests a substantial change in the composition of the passivation film in the dilute aqueous solution.
The surface Ni content of the material annealed at 800 °C was also found to be significantly lower than those of the other samples. Ni is known to play a key role in suppressing active dissolution in SS and maintaining the integrity of the oxide film [32,33]. Therefore, the decreased proportion of Ni in the material heated at 800 °C likely rendered the passivation film more susceptible to dissolution. As a result, the Cr-based oxide film on this specimen is thought to have been depleted more rapidly. As shown in Table 2, a significant increase in the Fe content was observed after 2 d of immersion.
3.2. XPS Analysis
The Fe 2p, Cr 2p3/2 and O 1s spectra acquired from the various materials prior to immersion in the simulated tap water are provided in Figure 2, Figure 3 and Figure 4. The polished sample generated a peak at approximately 707 eV that was attributed to metallic Fe0 but this peak was not present in the spectra of the annealed sample [34,35]. These data suggest that the outermost surface of each annealed sample was almost entirely oxidized, whereas the surface of the polished sample retained some unoxidized substrate. It should be noted that the 800 °C sample could not be analyzed because a sufficiently intense Fe peak was not obtained. The polished sample generated an Fe2+ peak at approximately 709.6 eV whereas the annealed samples each produced Fe2+ (709.5 eV) and Fe3+ (711 eV) peaks [34,35]. The corresponding Fe 2p1/2 peaks were also observed [36]. FeO (at 709.6 eV) was evidently present in the polished sample, while both FeO (at 709.2 and 709.8 eV) and Fe3O4 (at 711.0 and 710.7 eV) were found in the materials annealed at 400 °C and FeO (at 709.6 eV) and Fe2O3 (at 711.7 eV) were present in the specimen heated at 500 °C [35,37]. However, as shown in Figure 4, the polished sample also generated a strong OH− peak. This peak appeared at approximately 532.0 eV, and in addition, the Fe(OH)2 peak (709.6 ± 0.2 eV) is close to the position of the FeO peak [35]. Therefore, it appears that a hydroxide film was also present on the surface. These results indicate that higher annealing temperatures produced higher oxidation states in the Fe on the SS surface. Additionally, for a given annealing temperature and annealing durations up to 5 h, the type of iron oxide formed did not change. Peak area analyses of the spectra in Figure 4b,c, respectively, determined that 39% and 50% of the Fe was present as Fe2+, establishing that oxidation occurred to a greater extent in the sample heated for a shorter duration. However, it should be noted that FeCr2O4 has been reported to occur in oxide films generated under high-temperature and high-pressure conditions [38]. Thus, the increased proportion of Fe2+ may not have been due to reduction but rather due to a reaction with Cr to form FeCr2O4 during the annealing process.
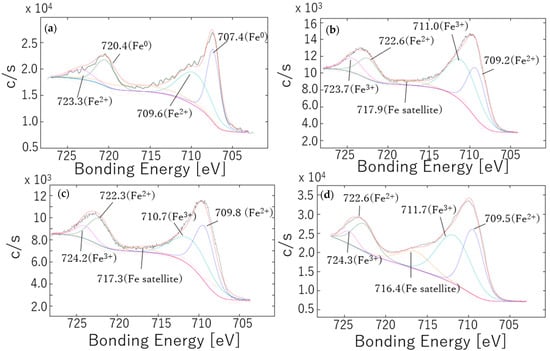
Figure 2.
Fe 2p XPS spectra obtained from passivation films formed on SUS316L specimens after (a) polishing and following annealing at (b) 400 °C for 1 h, (c) 400 °C for 5 h or (d) 500 °C for 1 h. The red and black spectra are the fitted data and the original experimental data.
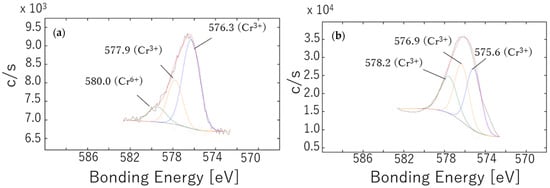
Figure 3.
Cr 2p3/2 XPS spectra obtained from passivation films formed on SUS316L specimens after annealing at (a) 500 °C for 1 h or (b) 800 °C for 1 h. The red and black spectra are the fitted data and the original experimental data.
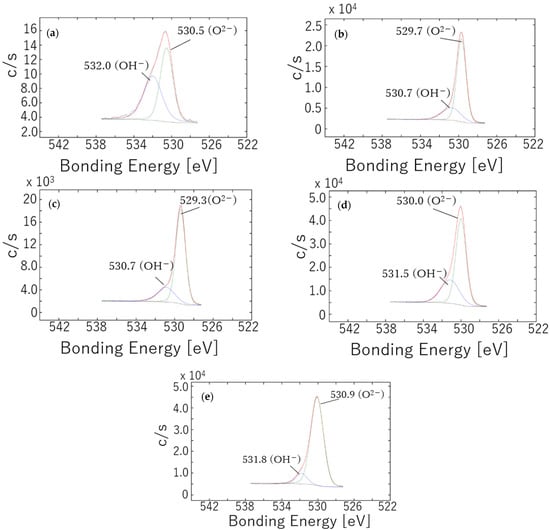
Figure 4.
O 1 s XPS spectra obtained from passivation films formed on SUS316L specimens after (a) polishing and following annealing at (b) 400 °C for 1 h, (c) 400 °C for 5 h, (d) 500 °C for 1 h or (e) 800 °C for 1 h. The red and black spectra are the fitted data and the original experimental data.
Only the specimens annealed at 500 and 800 °C provided Cr peaks that were sufficiently intense for analysis. In both cases, the Cr on the specimen surface was almost completely oxidized because no peak corresponding to metallic Cr0 (at approximately 574 eV) was detected (Figure 3) [39,40]. The oxidized Cr species were identified as Cr2O3 (at 576 and 578 eV), CrOOH (at 577 eV) and CrO3 (at 580 eV) [34,35,37]. Calculations based on peak areas showed that 32% of the Cr was present as CrO3 in the sample annealed at 500 °C, suggesting the formation of a highly oxidized passivation film. In contrast, the sample annealed at 800 °C did not produce a clear peak near 580 eV but instead provided a peak at approximately 577 eV that was attributed to chromium hydroxide. Given the annealing conditions, it is unlikely that this compound was formed during the annealing process. However, considering the surface characteristics of the sample annealed at 800 °C (Figure 1), it is possible that annealing facilitated the reaction of the metal with moisture such that chromium hydroxide was produced during the slow cooling step.
The O 1 s spectra in Figure 4 contain peaks at approximately 530.0 and 531.5 eV corresponding to O2− and OH− but no detectable peak associated with H2O at 533.0 eV [34,37]. The O2−/OH− ratio calculated from peak areas was 1.08 for the polished sample, indicating that approximately half of the passivation film consisted of hydroxides. In contrast, the specimens annealed at 400 and 500 °C exhibited ratios ranging from 2.06 to 3.23 while the 800 °C sample had a ratio of 9.40. Evidently, annealing reduced the hydroxide content in the passivation film, with this effect becoming more pronounced at higher annealing temperatures. Nevertheless, the OH− peak intensity observed in Figure 4e was comparable to or even higher than those provided by the other materials, suggesting that hydroxide could not be completely removed. It is also apparent that hydroxide formation during the post-annealing cooling process was unavoidable.
3.3. Potential Stability Analysis
The stability of the potentials generated by the SUS316L specimens was assessed by monitoring the OCP data for 2 h immediately after immersion in simulated tap water, with the results shown in Figure 5. Figure 5a shows the potential difference, E − E0, where E is the OCP value at a specific point in time and the E0 is the OCP at the point of immersion. Note that each measurement was repeated three times for each condition to assess reproducibility. The data for the sample annealed at 500 °C are shown in Figure 5b as an example of the reproducibility of data between replicate trials. Similar trends were observed for the other samples. The E0 for each sample shown in Figure 5a are also provided in Table 3. The data in Figure 5a confirm that the OCP increased over the first 2 h of each trial for all samples, although the extent of this increase varied significantly depending on the annealing temperature. The sample annealed at 400 °C for 1 h exhibited especially poor potential stability compared with the polished specimen, based on the larger increase in potential for the former. Samples annealed under other conditions showed comparable or smaller increases in OCP relative to the polished sample. However, while the sample annealed at 800 °C exhibited a relatively modest increase of approximately 40 mV over 2 h, the potential values did not increase monotonically over time but rather fluctuated erratically. Therefore, it is difficult to draw firm conclusions based solely on these 2 h OCP profiles.
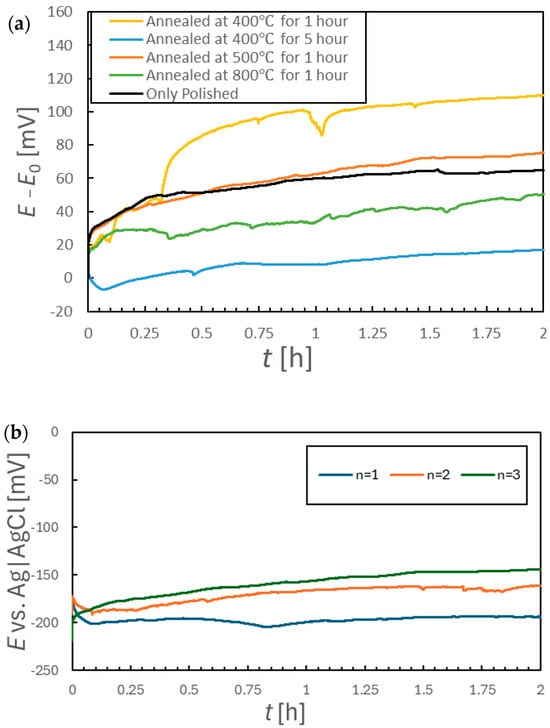
Figure 5.
(a) Variations in corrosion potential for various specimens during 2 h immersions in aqueous solutions and (b) corrosion potentials for sample annealed at 500 °C for 1 h during three replicate trials involving 2 h immersions.
Table 3.
Initial corrosion potential of each sample.
To assess short-term potential stability more quantitatively, the OCP data acquired over 2 h durations were divided into 30 s intervals and the standard deviation (σ) was calculated for each such interval. The results are shown in Figure 6. This analysis revealed that the sample annealed at 800 °C produced consistently high σ values throughout the 2 h period, indicating unstable short-term potential behavior (Figure 6b, green curve). In contrast, the samples annealed at 400 °C for 5 h and at 500 °C for 1 h showed smaller standard deviations than the other specimens. Thus, this analysis established that these particular electrodes provided more stable OCP values. The OCP data acquired following immersion for 24 h are presented in Figure 7a, while the standard deviation values calculated using the same 30 s interval method are shown in Figure 7b,c. Comparing Figure 5a and Figure 7a, it can be seen that the polished sample and the sample annealed at 800 °C both exhibited OCP increases exceeding 100 mV over 26 h. In contrast, the samples annealed at 400 °C for 5 h and at 500 °C for 1 h showed smaller increases of approximately 70 mV. Notably, the 500 °C specimen produced an increase of only approximately 10 mV between the 2 and 26 h marks, indicating that the major potential change had occurred within the first 2 h of immersion. The potential drift calculated between 24 and 26 h was less than 1 mV/h for the polished sample and the samples annealed at 400 °C, whereas values of 2.7 and 1.3 mV/h were obtained for the materials processed at 500 and 800 °C, respectively. As shown in Figure 7b, the standard deviations for the samples annealed at 400 °C were lower than those of the polished sample, regardless of the annealing duration. However, the specimens heated at or above 500 °C exhibited larger standard deviations than the polished sample, demonstrating increased short-term potential fluctuations as a result of annealing.
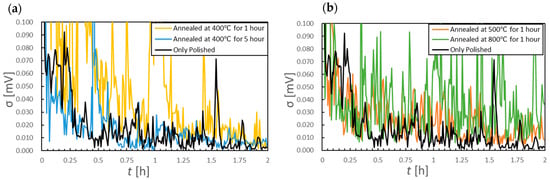
Figure 6.
Standard deviations of corrosion potential data over 30 s intervals. Data were acquired from specimens annealed at (a) 400 °C or (b) 500 °C and above. Data for a polished sample not subjected to annealing are also included for comparison.
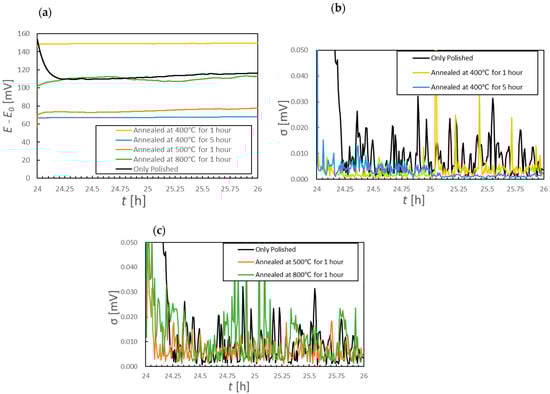
Figure 7.
(a) Corrosion potential changes after 24 h of immersion for various specimens and (b,c) standard deviations of the corrosion potential data over 30 s intervals after 24 h of immersion.
Following 168 to 170 h of immersion, all samples exhibited potential drifts of less than 1 mV/h (Figure 8a). This outcome suggests that the SS specimens had each reached a steady-state condition in which the passivation film was maintained in a stable manner. The polished sample and the samples annealed at 400 and 800 °C for 1 h all showed significant increases in potential after one week of immersion. However, the increase for the sample annealed at 400 °C for 1 h was 24 mV relative to that at the 26 h mark, whereas the increase for the 800 °C specimen exceeded 71 mV over the same period. The samples annealed at 400 °C for 5 h and at 500 °C for 1 h showed particularly small total potential increases from the start of immersion, with increases of 28.3 and 36.9 mV, respectively, after the 26 h mark. All materials except that heated at 500 °C provided standard deviations above 5 μV for 49% of a 2 h time span, whereas the specimen annealed at 400 °C for 5 h maintained standard deviations at or below 5 μV for 99% of this duration.
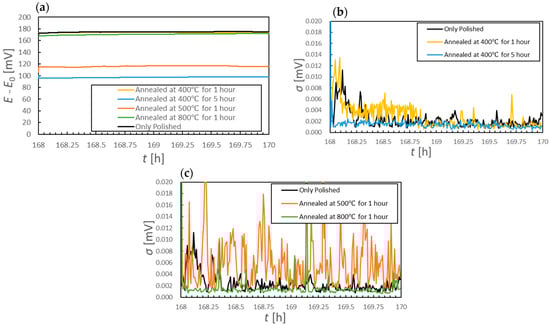
Figure 8.
(a) Corrosion potential changes after 168 h of immersion for various specimens and (b,c) standard deviations of corrosion potential data over 30 s intervals after 168 h of immersion.
These results demonstrate that long-term annealing at a relatively low temperature of 400 °C reduced the OCP drift to less than 1 mV/h and gave a 30 s standard deviation of less than 5 μV over 24 h. It is evident that this pretreatment enhanced the early-stage potential stability in simulated tap water compared with the stability shown by untreated SS. In contrast, annealing at 500 °C or above resulted in larger short-term potential fluctuations and greater long-term OCP changes, confirming prolonged instability. Additionally, annealing at 400 °C for only 1 h did not lead to improved potential stability over a 7 d period, but rather provided characteristics similar to those exhibited by the unannealed sample. Therefore, short-term annealing at low temperatures would not be expected to have a significant effect on potential stability.
3.4. Voltammetric Analysis
Figure 9 presents polarization curves acquired from SUS316L specimens in simulated tap water. The results clearly indicate that the electrochemical behaviors in these dilute solutions varied significantly depending on the annealing conditions. In particular, the extent of the passive region was affected, such that this region became smaller with increases in the annealing temperature and annealing time. The passivation film on the polished sample was evidently stable because a low current density of approximately 10 µA/cm2 was maintained up to +1.0 V (vs. Ag|AgCl). In contrast, the sample annealed at 400 °C for 1 h provided a passivation region only up to +0.5 V and no distinct passive region was produced by the sample annealed at 800 °C. The specimens annealed at or above 500 °C showed a marked increase in current density starting at approximately +0.3 V (vs. Ag|AgCl). The oxidation of Cr from Cr3+ to Cr6+ is known to occur at the potential (around 0.3 V) [41]. Given that both the EDS and XPS analyses confirmed the presence of Cr on the surfaces of these samples, it is reasonable to conclude that some residual Cr underwent further oxidation during the polarization tests. It is also notable that the anodic polarization curve produced by the sample annealed at 400 °C for 1 h contained numerous current spikes between the open-circuit potential and +550 mV. This behavior suggests that the sample was particularly susceptible to pitting corrosion in the early stages of immersion, which may account for the unstable potential behavior observed in Figure 5a. The presence of pitting is also evident in the SEM images in Figure S2b, which show numerous dark spots on the surface of the same sample. From these findings it is apparent that the surface condition resulting from short-term annealing at 400 °C rendered the SUS316L more vulnerable to localized corrosion, which in turn contributed to the unstable early-stage electrochemical behavior.
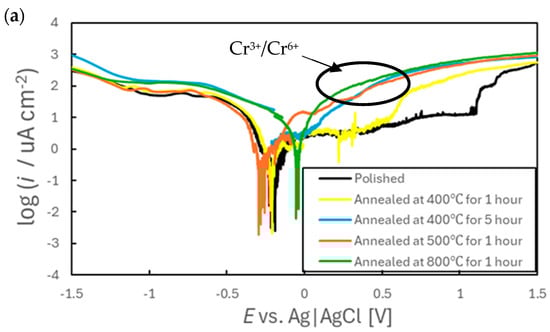
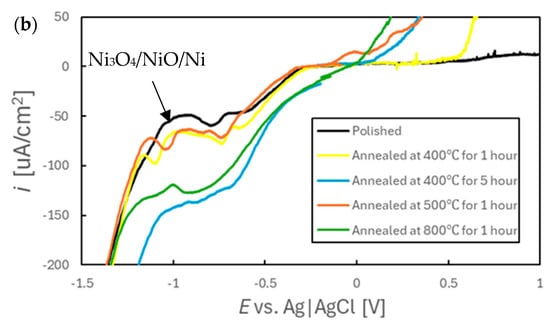
Figure 9.
(a) Voltammograms obtained from various SS specimens in simulated tap water at a scan rate of 20 mV/min and (b) an expanded view of the cathode diagram.
Cathodic polarization curves confirmed that the peak potential and current density both increased at approximately the same points for all samples, meaning that there were no significant differences in the reactions for these materials. Because EDS analyses indicated the presence of Ni in these specimens, the cathodic peaks observed between −0.8 and −1.0 V are likely attributable to the reduction in this metal [41]. However, the sample annealed at 800 °C exhibited current densities approximately two to three times higher than those for the other specimens (excluding that annealed at 400 °C for 5 h), despite having a lower surface Ni content. This result suggests that other electrochemical processes were taking place in addition to Ni reduction on that particular specimen, possibly involving the reduction in Cr. Based on the theoretical potential values (Cr3+ + e−→Cr2+: E = −0.63 vs. Ag|AgCl, Cr2+ + 2e−→Cr: E = −1.13 vs. Ag|AgCl) together with mechanisms previously proposed for the reduction in Cr in Sargent’s solution [42,43], it is assumed that Cr could also be reduced under the present experimental conditions. According to the potential–pH diagram for the Cr–H2O system [44], Cr reduction reactions are thermodynamically less favorable than the hydrogen evolution reaction. However, it has been reported that, once Cr2+ is formed, it can act as a reducing agent to facilitate the reduction in H+ to hydrogen gas [45]. Therefore, the cathodic peak produced by the 800 °C sample likely reflects the reduction of a Cr-rich oxide film formed during the high-temperature annealing. This reduction was presumably followed by secondary reactions in which reduced Cr species promoted the evolution of hydrogen gas. It should be noted that some studies have found a decrease in the hydrogen overpotential on Cr steels [46], raising the possibility that the observed cathodic behavior may be attributed not to Cr2+/Cr3+ mediation but rather to a reduction in the hydrogen overpotential. While it is not currently possible to determine definitively which mechanism was predominant, it appears that the enhanced reducibility of Cr in dilute aqueous environments contributed to the potential fluctuations observed during both the early immersion stage (Figure 6) and at 24 h (Figure 7c).
The sample annealed at 400 °C for 5 h exhibited a cathodic current density equivalent to that for the specimen heated at 800 °C (Figure 9b). However, in contrast to the latter specimen, the observed increase in the cathodic current density in the case of the former sample is not attributed to the reduction in metals. Specifically, the EDS analysis showed that the surface Cr concentration for the 400 °C sample was significantly lower than that for the 800 °C sample. Furthermore, the concentrations of Cr and Ni on the surface of the former material were not changed significantly by immersion, so it is unlikely that Ni reduction occurred. In addition, the EIS results described below established that the surface area of the 400 °C specimen was not greater than those of the other samples. These findings suggest that the surface of this sample was in a state that promoted the reduction of water. This increased reactivity likely contributed to the stability of the potential for this material.
3.5. EIS Analysis
Nyquist plots obtained from EIS trials with specimens after immersion in simulated tap water for 7 d are shown in Figure 10 while the associated Bode plots are presented in Figure 11. In addition, the Nyquist plot and Bode plot are shown together in Figure S3. The data in Figure 10 demonstrates a clear difference in the impedance characteristics of the samples annealed at temperatures above and below 500 °C. The impedance at 0.1 Hz remained below 10 kΩ cm2 even after 7 d immersion in the former case while the latter samples exhibited impedance values exceeding 10 kΩ cm2 after 1 d. These findings suggest that annealing prior to immersion significantly affected the oxide film formed on the SUS316L surface in the simulated tap water. Variations in the Nyquist plots over time also indicated that the effect of the initial surface state induced by annealing persisted for at least 7 d after immersion. This finding provides evidence that annealing had a long-lasting effect on the electrochemical characteristics of the SS when immersed in the aqueous solutions.
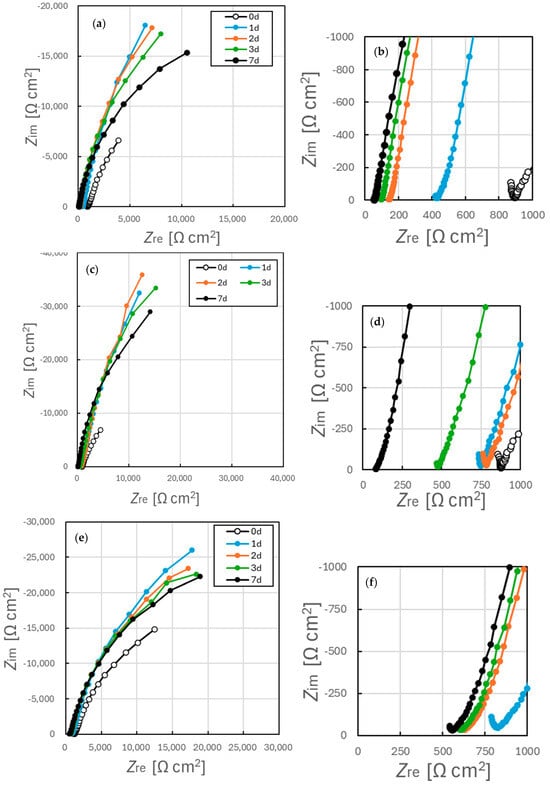
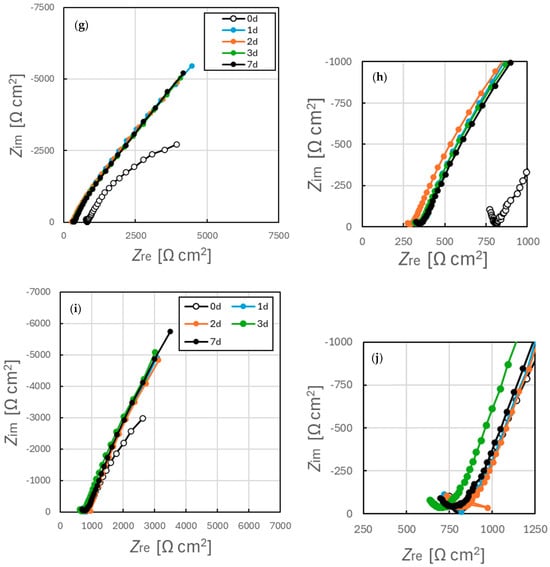
Figure 10.
Nyquist plots acquired from EIS data for SUS316L specimens (a,b) prior to annealing and after annealing for (c,d) 400 °C for 1 h, (e,f) 400 °C for 5 h, (g,h) 500 °C for 1 h or (i,j) 800 °C for 1 h. (a,c,e,g,i) are the Nyquist diagram obtained full frequency range, and (b,d,f,h,j) are the diagrams enlarged in the high frequency region.
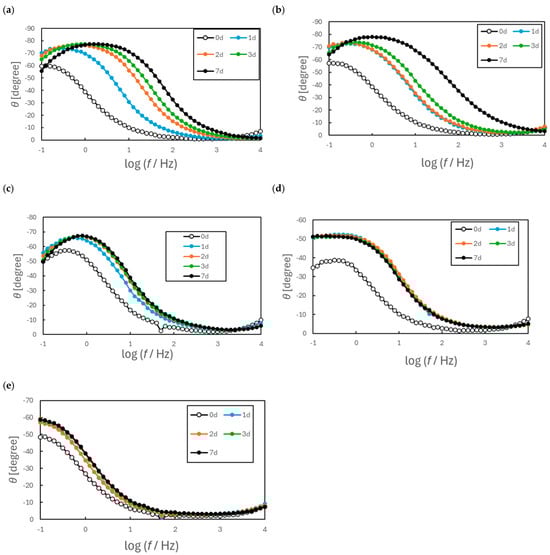
Figure 11.
Bode diagrams of EIS spectra for annealed SUS316L. (a)Not annealed, (b) annealed at 400 °C for 1 h, (c) annealed at 400 °C for 5 h, (d) annealed at 500 °C for 1 h, (e) annealed at 800 °C for 1 h.
Figure 10 shows a marked decrease in impedance within the high-frequency region for samples (a) and (b), with little to no change for the other samples over time. The electrical conductivity of the test solution was found to increase from 14 mS/m (σ = 6 mS/m) immediately after preparation to 101 mS/m (σ = 17 mS/m) after 7 d. Although this change indicates a measurable variation in solution conductivity, the corresponding change in resistance was approximately 30 Ω cm2 and so was insufficient to explain the observed impedance decrease of greater than 500 Ω cm2. Therefore, the changes in the real part of the impedance, Z_re, observed in the high-frequency region can be interpreted as reflecting changes in the surface film formed on the SS specimens. It has been reported that the passivation film on SS possesses a bilayer structure [38,47,48,49], in which the outer layer is relatively loose and makes a minimal contribution to corrosion resistance [38,49]. This outer layer can interact with the ohmic resistance and strongly affects the high-frequency response during impedance measurements. Consequently, the present results can also be attributed to modification of the outer layer of the passivation film. Such modifications could explain the time-dependent changes observed in the high-frequency region of the Nyquist plots.
As shown in Figure 11, the Bode plots revealed distinct time-dependent changes and differences in phase angle behavior among the samples. The specimens annealed at 500 °C or above each showed a steady phase decrease from approximately 100 to 0.1–1 Hz followed by a plateau. In contrast, the other samples exhibited a phase decrease followed by a secondary increase at lower frequencies. These differences indicate that the annealing temperature at least partly determined the surface condition of the SS and that this effect persisted even after a 7 d immersion. These same plots demonstrate that samples (a), (b) and (c) exhibit a phase maximum below 0.1 Hz. Hence, the impedance characteristics of these specimens can be modeled using an equivalent circuit in conjunction with two time-based constants. In contrast, samples (d) and (e) provided Bode plots resembling those of simple RC series circuits. However, because a small loop appeared in the high-frequency region of the Nyquist diagrams and the low-frequency curves were not vertical, it was considered that these specimens could also be modeled using the same equivalent circuit as employed to assess samples (a)–(c).
Based on the above results, an equivalent circuit analysis of the EIS data was performed using the circuit shown in Figure 12. The fitting results are summarized in Table 4. This equivalent circuit is commonly applied to metals with oxide-based passivation films, such as SS, that contain localized defects [49,50,51,52]. Since the capacitance of the SS surface was not uniform, capacitance was modeled using the constant phase elements (CPE) method to account for deviations from ideal capacitive behavior. Although it seemed that an almost single semicircle was obtained in Figure 10, it has been reported that the same order of magnitude of CPE’s exist on the SS surface and therefore it is considered that the semicircles would overlap in the plot [51]. Thus, we adopted the model in Figure 12 which would be applicable to the present case. The CPE concept is defined as in Equation (1), where C is the capacitance [F], ω is the angular frequency [s−1], α is the CPE exponent and CPE is the CPE constant. In this model, Rs represents the solution resistance, R1 and CPE1 correspond to the resistance and capacitance associated with redox reactions occurring at the film surface, and R2 and CPE2 are the charge transfer resistance and capacitance associated with processes at the metal surface [51].
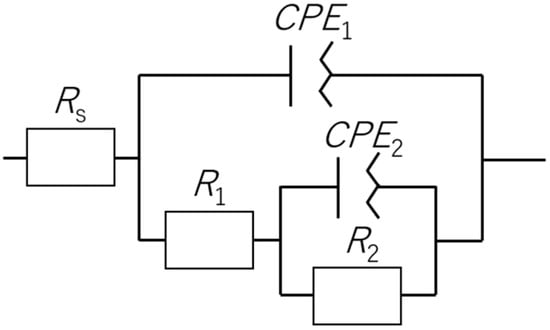
Figure 12.
Equivalent circuit used to model the electrochemical behavior of SS.
Table 4.
Parameters calculated from EIS data obtained from annealed SUS316L specimens.
Comparing the numerical values generated by this process, the samples annealed at 400 or 500 °C showed minimal changes in the parameters related to redox reactions (that is, α1, CPE1 and R2). These specimens also showed smaller potential fluctuations after 24 h of immersion. Furthermore, the two 400 °C samples, which demonstrated low standard deviations within the first 24 h, had relatively small CPE1 and R1 values. The SEM images demonstrate minimal changes in the effective surface areas after annealing. Therefore, it can be inferred that the primary factor affecting the pseudo capacitance was the thickness of the oxide film. It should be noted that the information derived from the EIS and equivalent circuit analyses generally reflected the inner oxide layer [49]. Therefore, it is believed that the presence of a thicker internal oxide layer resulted in more stable short and long term potentials.
The corrosion resistance of the sample annealed at 400 °C for 5 h exceeded 200 kΩ cm2. The charge transfer resistance of a typical Ag/AgCl RE polarized in an aqueous 3.33 M KCl solution is on the order of 70 Ω cm2, such that the polarization resistance of the stabilized SUS316L sample was approximately 3000 times higher. Despite this high resistance, the potential remained stable, confirming that a low corrosion (charge transfer) resistance value was not necessarily required for the SS to maintain a stable potential. Furthermore, since the parameter α is often considered to be an index of surface roughness [49], those specimens showing large variations in α likely underwent significant changes in the surface area of the oxide film during immersion. Because the samples exhibiting large variations in α (see Table 4) also showed pronounced changes in potential, changes in the surface area of the oxide film during immersion appear to have reduced the potential stability. Therefore, the dissolution of Mn inclusions or the physical adsorption/desorption of impurities could also affect potential stability. These results suggest that removing such surface impurities prior to immersion could further enhance the electrode’s potential stability.
3.6. Reactions Related to Potential Stability
Various reactions are known to occur on SS surfaces and within the films on such surfaces in aqueous environments. The primary electrochemical reactions are thought to involve the outermost portion of the oxide layer on the metal [53]. Specifically, redox reactions between the metal and its oxides within this outer layer, which are associated with maintaining the passivation film, are thought to be the primary processes determining the OCP. The basis for these redox reactions is presented below as Equation (2). According to the Nernst equation, the associated potential can be expressed as shown in Equation (3).
Here, E* is the redox potential of the metal oxide, R is the gas constant, T is the temperature, and F is the Faraday constant. According to Equation (3), the potential generated by a SS sample in an aqueous solution will be partly determined by the pH of the medium and by the value of E*. Therefore, the potential can be expected to stabilize in the case that both the pH and the composition of the metal oxide film remain constant. However, the present experimental results demonstrate that samples exhibiting large changes in CPE1 also showed significant fluctuations in potential. From this finding it is evident that the growth characteristics of the inner oxide layer played an important role in stabilizing the potential. Initially, this inner layer was composed of Cr2O3 but, once disrupted, could not be fully reconstituted as pure Cr2O3. Instead, mixed oxides of Fe and Cr, such as FeCr2O4, were generated [54]. Up to the point that the inner layer of the film was sufficiently developed and was replaced by FeCr2O4, the anodic reaction shown in Equation (4) occurred intermittently. Evidence for this phenomenon is provided by the short-term potential fluctuations observed in trials with samples annealed above 500 °C.
Since this reaction occurred within the inner layer, the corresponding cathodic reaction presumably involved the reduction of metal oxides within the passivation film. Fe atoms inside a spinel lattice are known to diffuse more rapidly than Cr atoms and so dissolve more easily [49]. Consequently, Fe ions would have gradually migrated toward the outer layer to form FeCr2O4. Once the Fe ions reached the outer surface of the metal, they participated in anodic reactions such as those described in Equations (6) and (7). These reactions, in conjunction with the cathodic reaction involving water shown in Equation (5), promoted the formation of an outer oxide film.
As shown in Table 2, the proportion of Fe in the samples was increased following immersion. This outcome implies that the anodic reactions described in Equations (6) and (7) progressed during immersion, resulting in an increased Fe concentration within the outermost layer of each surface film and a simultaneous enrichment in the Cr concentration in the inner layer. Furthermore, the presence of Fe0 as observed in Figure 2a implies that the significant increase in potential obtained from the unannealed sample can be attributed to the oxidation of metallic Fe in the material, via the process summarized in Equation (8).
Based on the above, it is evident that the potential generated by SS in a dilute aqueous solution becomes stable when the growth of the inner FeCr2O4 surface layers reaches a steady state. At this stage, a reversible maintenance reaction (Equation (9)) occurs in the inner layer while a reversible reaction involving iron oxides that maintains the surface film (Equation (10)) proceeds in the outer layer. The cathodic reaction described by Equation (5) is thought to simultaneously proceed at a rate corresponding to the anodic processes in Equations (8) and (9).
4. Conclusions
Assessments of OCP and surface analyses were conducted in trials using SUS316L specimens subjected to annealing treatments. The compositions and physical states of the oxide films on these materials, the stability of the potential generated by each sample and the interrelationships between these factors were evaluated. Prolonged annealing at lower temperatures was found to improve the potential stability more effectively than short-duration annealing at high temperatures. Samples that showed stable potentials tended to also have higher proportions of Fe compared with those of Cr in the oxide films according to EDS and XPS analyses. The potential could be further stabilized by applying a pre-treatment forming an oxide film similar to the film that develops after immersion in an aqueous solution. Following stabilization of the potential in simulated tap water, the outer oxide layer of each specimen was determined to have a higher proportion of Fe while the inner layer comprised an Fe-Cr oxide. Hence, the presence of an Fe-rich surface oxide appears to provide greater potential stability. In addition, it was also found that when a thicker oxide film was maintained, the potential became stable. Future studies should focus on quantitative assessments of the effects of the pH and hardness of the aqueous solution as a further step towards finding practical applications for QREs based on SS.
Supplementary Materials
The following supporting information can be downloaded at: https://www.mdpi.com/article/10.3390/chemosensors13100356/s1, Figure S1: EDS maps of Fe, Cr, Ni, Mo, Mn, C, O and Si of the surfaces of SUS316L specimens (a) after polishing and following annealing at (b) 400 °C for 1 h, (c) 400 °C for 5 h, (d) 500 °C for 1 h or (e) 800 °C for 1 h.; Figure S2: SEM images of the surfaces of SUS316L specimens after 24 h of immersion (a) after polishing and following annealing at (b) 400 °C for 1 h, (c) 400 °C for 5 h, (d) 500 °C for 1 h or (e) 800 °C for 1 h.; Figure S3: Nyquist plots and bode diagrams acquired from EIS data for SUS316L specimens. (a) Not annealed, (b) annealed at 400 °C for 1 h, (c) annealed at 400 °C for 5 hours, (d) annealed at 500 °C for 1 hour, (e) annealed at 800 °C for 1 h.
Author Contributions
Conceptualization, K.S., S.O. and T.I.; methodology, S.O.; validation, T.I. and M.S.; formal analysis, K.S.; investigation, K.S.; resources, T.I. and M.S.; data curation, K.S. and T.I.; writing—original draft preparation, K.S.; writing—review and editing, S.O., T.I. and M.S.; visualization, K.S.; supervision, S.O. and T.I.; funding acquisition, K.S. and S.O. All authors have read and agreed to the published version of the manuscript.
Funding
This research was funded by Japan Science and Technology Agency grant number JPMJSP2178 and JSPS KAKENHI grant Number JP24K21657.
Institutional Review Board Statement
Not applicable.
Informed Consent Statement
Not applicable.
Data Availability Statement
The original contributions presented in this study are included in the article/Supplementary Materials. Further inquiries can be directed to the corresponding author.
Conflicts of Interest
Author Tatsuki Inaba and Motohiro Sakuma were employed by the company Aichi Tokei Denki. Co. The remaining authors declare that the research was conducted in the absence of any commercial or financial relationships that could be construed as a potential conflict of interest.
References
- Bilbao, E.; Garate, O.; Campos, T.R.; Roberti, M.; Mass, M.; Lozano, A.; Longinotti, G.; Monsalve, L.; Ybarra, G. Electrochemical Sweat Sensors. Chemosensors 2023, 11, 244. [Google Scholar] [CrossRef]
- Gross, P.-A.; Larsen, T.; Loizeau, F.; Jaramillo, T.; Spitzer, D.; Pruitt, B. Microfabricated electrochemical gas sensor. Micro Nano Lett. 2017, 11, 798–802. [Google Scholar]
- Wang, C.; Yang, J.; Li, J.; Luo, C.; Xu, X.; Qian, F. Solid-state electrochemical hydrogen sensors: A review. Int. J. Hydrogen Energy 2023, 48, 31377–31391. [Google Scholar]
- Xia, D.-H.; Wang, H.-H.; Wang, K.; Fu, C.-W.; Wang, J.-H. A novel electrochemical noise sensor applied to detect food safety. Russ. J. Electrochem. 2014, 50, 599–602. [Google Scholar] [CrossRef]
- Wei, Y.; Hsueh, K.F.; Jang, G.-W. Monitoring the chemical polymerization of aniline by open-circuit-potential measurements. Polymer 1997, 35, 3572–3575. [Google Scholar] [CrossRef]
- Jegdić, B.; Dražić, D.M.; Popić, J.P. Open circuit potentials of metallic chromium and austenitic 304 stainless steel in aqueous sulphuric acid solution and the influence of chloride ions on them. Corros. Sci. 2008, 50, 1235–1244. [Google Scholar] [CrossRef]
- Araneda, A.A.B.; Kappes, M.A.; Rodríguez, M.A.; Carranza, R.M. Pitting corrosion of Ni-Cr-Fe alloys at open circuit potential in chloride plus thiosulfate solutions. Corros. Sci. 2022, 198, 110121. [Google Scholar]
- Wilburn, J.P.; Ciobanu, M.; Lowy, D.A. Characterization of Acrylic Hydrogels by Open Circuit Potential Monitoring. J. Appl. Electrochem. 2004, 39, 729–734. [Google Scholar] [CrossRef]
- Doménech-Carbó, A.; Ronda, M.A.P.; Vives-Ferrándiz, J.; Duffó, G.S.; Farina, S.; Doménech-Carbó, M.T. Modeling ‘dry’ OCP measurements to characterize archaeological iron corrosion I: Long-time transients. J. Electroanal. Chem. 2022, 913, 116210. [Google Scholar] [CrossRef]
- Probst, D.; Lee, I.; Sode, K. The development of micro–sized enzyme sensor based on direct electron transfer type open circuit potential sensing principle. Electrochem. Acta 2022, 426, 140798. [Google Scholar]
- Smart, M.C.; Ratnakumar, B.V.; RyanMowrey, V.S.; Surampudi, S.; Prakash, G.K.S.; Hub, J.; Cheung, I. Improved performance of lithium-ion cells with the use of fluorinated carbonate-based electrolytes. J. Power Sources 2003, 119, 359–367. [Google Scholar] [CrossRef]
- Schmidt, C.; Tam, G.; Scott, E.; Norton, J.; Chen, K. Mass transport limitation in implantable defibrillator batteries. J. Power Sources 2003, 119, 979–985. [Google Scholar] [CrossRef]
- Smart, M.C.; Ratnakumar, B.V.; Whitcanack, L.; Chin, K.; Rodriguez, M.; Surampudi, S. Performance characteristics of lithium ion cells at low temperatures. IEEE Aerosp. Electron. Syst. Mag. 2002, 17, 16–20. [Google Scholar] [CrossRef]
- Ghilane, J.; Hapiot, P.; Bard, A.J. Metal/Polypyrrole Quasi-Reference Electrode for Voltammetry in Nonaqueous and Aqueous Solutions. Anal. Chem. 2006, 78, 6868–6872. [Google Scholar] [CrossRef] [PubMed]
- Wang, J. Real-time electrochemical monitoring: Toward green analytical chemistry. Acc. Chem. Res. 2002, 35, 811–816. [Google Scholar] [CrossRef] [PubMed]
- Dawkins, R.C.; Wen, D.; Hart, J.N.; Vepsäläinen, M. A screen-printed Ag/AgCl reference electrode with long-term stability for electroanalytical applications. Electrochem. Acta 2021, 393, 139043. [Google Scholar]
- Andriukonis, E.; Butkevicius, M.; Simonis, P.; Ramanavicius, A. Development of a Disposable Polyacrylamide Hydrogel-Based Semipermeable Membrane for Micro Ag/AgCl Reference Electrode. Sensors 2023, 25, 2510. [Google Scholar] [CrossRef]
- Torres-González, V.; Ávila-Niño, J.A.; Araujo, E. Facile fabrication of tailorable Ag/AgCl reference electrodes for planar devices. Thin Solid Film. 2022, 757, 139413. [Google Scholar] [CrossRef]
- Manjakkal, L.; Vilouras, A.; Dahiya, R. Screen Printed Thick Film Reference Electrodes for Electrochemical Sensing. IEEE Sens. J. 2018, 18, 7779–7785. [Google Scholar] [CrossRef]
- Dolli, H.; Muralidharan, V.S.; Rengaswamy, N.S. Reliability evaluation of embeddable reference electrodes for use in reinforced cement concrete. Bull. Electrochem. 2003, 19, 1–8. [Google Scholar]
- Beggs, J.; Fitzgerald III, J.H. Preparing gas distribution piping for the construction of a light rail transit system. Mater. Perform. 2003, 42, 22–26. [Google Scholar]
- Bakker, E. Hydrophobic membranes as liquid junction-free reference electrodes. Electroanalysis 1999, 11, 788–792. [Google Scholar] [CrossRef]
- Auer, A.; Kunze-Liebhäuser, J. A universal quasi-reference electrode for in situ EC-STM. Electrochem. Commun. 2019, 98, 15–18. [Google Scholar] [CrossRef]
- Truong, T.N.P.; Randriamahazaka, H.; Ghilane, J. Platinum/poly(N-ferrocenylmethyl-N-allylimidazolium bromide) quasi-reference electrode for electrochemistry in non-aqueous and ionic liquid solutions. Electrochem. Commun. 2016, 73, 5–9. [Google Scholar] [CrossRef]
- Keeble, L.; Jaccottet, A.; Ma, D.; Rodriguez-Manzano, J.; Georgiou, P. An electroplated Ag/AgCl quasi-reference electrode based on CMOS top-metal for electrochemical sensing. Electrochem. Acta 2024, 477, 143780. [Google Scholar] [CrossRef]
- Lee, J.; Jäckel, N.; Kim, D.; Widmaier, M.; Sathyamoorthi, S.; Srimuk, P.; Kim, C.; Fleischmann, S.; Zeiger, M.; Presser, V. Porous carbon as a quasi-reference electrode in aqueous electrolytes. Electrochim. Acta 2016, 222, 1800–1805. [Google Scholar] [CrossRef]
- Narivskyi, O.E.; Subbotin, S.A.; Pulina, T.V.; Khoma, M.S. Assessment and Prediction of the Pitting Resistance of Plate-Like Heat Exchangers Made of AISI304 Steel and Operating in Circulating Waters. Mater. Sci. 2022, 58, 41–46. [Google Scholar] [CrossRef]
- Olefjord, I.; Clayton, C.R. Surface Composition of Stainless Steel during Active Dissolution and Passivation. ISIJ Int. 1991, 31, 134–141. [Google Scholar] [CrossRef]
- Mori, Y.; Hashimoto, M.; Liao, J. Effect of Surface Composition on Contact Resistivity and Corrosion Resistance of 316L Stainless Steel. ISIJ Int. 2013, 53, 1057–1061. [Google Scholar] [CrossRef]
- Cui, C.Y.; Cui, X.G.; Ren, X.D.; Qi, M.J.; Hu, J.D.; Wang, Y.M. Surface oxidation phenomenon and mechanism of AISI 304 stainless steel induced by Nd:YAG pulsed laser. Appl. Surf. Sci. 2014, 305, 817–824. [Google Scholar] [CrossRef]
- Kyosuke, S.; Shinji, O.; Tatsuki, I.; Motohiro, S.; Koichi, A. Evaluation of Corrosion Potential Stability of Stainless Steels in Dilute Electrolyte Solution for Application to a Quasi-Reference Electrode Used in Electrochemical Sensing System. Chemosensors 2025, 13, 4. [Google Scholar]
- Akinori, K.; Taichiro, M.; Harada, W. Effect of Ni Content on Crevice Corrosion Resistance of Ferritic Stainless Steel. Nisshin Steel Tech. Rep. 2013, 94, 8–16. [Google Scholar]
- Azuma, S.; Kudo, T.; Miyuki, H.; Yamashita, M.; Uchida, H. Effect of nickel alloying on crevice corrosion resistance of stainless steels. Corros. Sci. 2004, 46, 2265–2280. [Google Scholar] [CrossRef]
- Wang, Z.; Paschalidou, E.-M.; Seyeux, A.; Zanna, S.; Maurice, V.; Marcus, P. Mechanisms of Cr and Mo Enrichments in the Passive Oxide Film on 316L Austenitic Stainless Steel. Front. Mater. 2019, 6, 232. [Google Scholar] [CrossRef]
- Upadhyay, N.; Pujar, M.G.; Das, C.R.; Krishna, N.G.; Mallika, C.; Mudali, U.K. Pitting Corrosion Behaviour of Boron Added Modified 9Cr–1Mo Steel: Combined Effects of Alkali and Chloride Ions. Trans. Indian Inst. Met. 2014, 68, 129–141. [Google Scholar] [CrossRef]
- Suzuki, S.; Sugiyama, K.; Inoue, H.; Waseda, Y. Correlation between changes of the chemical state and preferential sputtering in the surface of Fe2O3, NiFe2O4 and ZnFe2O4, by argon ion bombardment. Tohoku Univ. Repos. 1996, 52, 74–80. [Google Scholar]
- Guo, L.Q.; Qin, S.X.; Yang, B.J.; Liang, D.; Qiao, L.J. Effect of hydrogen on semiconductive properties of passive film on ferrite and austenite phases in a duplex stainless steel. Sci. Rep. 2017, 7, 3317. [Google Scholar] [CrossRef] [PubMed]
- Chen, X.; Dai, X.; Qian, H.; Yang, B.; Zhao, J. Effects of surface nanocrystallization on the oxide film formed on 316LN stainless steel in a high-temperature aqueous environment. Mater. Corros. Werkst. Und Korros. 2021, 73, 125–133. [Google Scholar] [CrossRef]
- Natarajan, R.; Palaniswamy, N.; Natesan, M. XPS Analysis of Passive Film on Stainless Steel. Open Corros. J. 2009, 2, 114–124. [Google Scholar] [CrossRef]
- Hanawa, T.; Hiromoto, S.; Yamamoto, A.; Kuroda, D.; Asami, K. XPS Characterization of the Surface Oxide Film of 316L Stainless Steel Samples that were Located in Quasi-Biological Environments. Mater. Trans. 2002, 43, 3088–3092. [Google Scholar] [CrossRef]
- Freire, L.; Catarino, M.A.; Godinho, M.I.; Ferreira, M.J.; Ferreira, M.G.S.; Simões, A.M.P.; Montemor, M.F. Electrochemical and analytical investigation of passive films formed on stainless steels in alkaline media. Cem. Concr. Compos. 2012, 34, 1075–1081. [Google Scholar] [CrossRef]
- Tsutomu, M. A scientific approach to chromium electroplating. J. Surf. Finish. Soc. Jpn. 2005, 56, 308–314. [Google Scholar]
- Noda, K.; Saito, T., II. Fundamental Electrochemical Methods for Corrosion—Polarization Curve (i-V Curve). Zair Kankyo 2018, 67, 9–16. [Google Scholar] [CrossRef][Green Version]
- Pourbaix, M. Atlas of Electrochemical Equilibria in Aqueous Solutions; National Association of Corrosion Engineers: Houston, TX, USA, 1974. [Google Scholar]
- Tetsuji, H.; Shuji, K.; Yasuhiro, A.; Hiroshi, M. Electrolytic Reduction of Cr(III) to Cr(II) with a Bipolar Electrolytic Cell. Shigen Sozai 1995, 111, 793–800. [Google Scholar]
- Bairachnyi, B.I.; Zhelavs’kyi, S.G.; Maizelis, A.O.; Voronina, O.V. Corrosion Behavior of Electrode Materials in the Production of Hydrogen. Mater. Sci. 2017, 53, 324–329. [Google Scholar] [CrossRef]
- Gao, X.; Wu, X.; Zhang, Z.; Guan, H.; Han, E.-H. Characterization of oxide films grown on 316L stainless steel exposed to H2O2-containing supercritical water. J. Supercrit. Fluids 2007, 42, 157–163. [Google Scholar] [CrossRef]
- Tranchida, G.; Clesi, M.; Di Franco, F.; Di Quarto, F.; Santamaria, M. Electronic properties and corrosion resistance of passive films on austenitic and duplex stainless steels. Electrochem. Acta 2018, 273, 412–423. [Google Scholar] [CrossRef]
- Ji, Y.; Hao, L.; Wang, J.; Ke, W. EIS investigation on surface roughness induced oxide film evolution on 304 SS in simulated secondary circuit water of PWR system. Met. Corros. 2025, 60, 5511–5532. [Google Scholar] [CrossRef]
- Takatoshi, S.; Yoichi, K. The fundamentals of Corrosion of Aluminum IX. UACJ Tech. Rep. 2014, 1, 82–91. [Google Scholar]
- Bautista, A.; González-Centeno, A.; Blanco, G.; Guzmán, S. Application of EIS to the study of corrosion behaviour of sintered ferritic stainless steels before and after high-temperature exposure. Mater. Charact. 2008, 59, 32–39. [Google Scholar] [CrossRef]
- Zheng, Z.J.; Gao, Y.; Gui, Y.; Zhu, M. Studying the fine microstructure of the passive film on nanocrystalline 304 stainless steel by EIS, XPS, and AFM. J. Solid State Electrochem. 2014, 18, 2201–2210. [Google Scholar] [CrossRef]
- Wilburn, J.P.; Ciobanu, M.; Buss, N.I.; Franceschetti, D.R.; Lowy, D.A. Miniaturized reference electrodes with stainless steel internal reference elements. Anal. Chim. Acta 2004, 511, 83–89. [Google Scholar] [CrossRef]
- Masao, K. Properties of Stainless Steel at Elevated Temperature. Sanyo Tech. Rep. 2014, 21, 11–27. [Google Scholar]
Disclaimer/Publisher’s Note: The statements, opinions and data contained in all publications are solely those of the individual author(s) and contributor(s) and not of MDPI and/or the editor(s). MDPI and/or the editor(s) disclaim responsibility for any injury to people or property resulting from any ideas, methods, instructions or products referred to in the content. |
© 2025 by the authors. Licensee MDPI, Basel, Switzerland. This article is an open access article distributed under the terms and conditions of the Creative Commons Attribution (CC BY) license (https://creativecommons.org/licenses/by/4.0/).