Abstract
The nutritional properties of Pleurotus mushrooms were studied to select the varieties with the most favourable properties. These mushrooms have high nutritional value; they are rich in carbohydrates, protein, minerals, vitamins, chitin and reducing compounds, such as phenols and polyphenols. In this study, the polyphenol profiles of thirteen Pleurotus ostreatus cultivars were established by the UHPLC-ESI-MS/MS technique. The results showed that 4-hydroxibenzoic acid, caffeic acid, p-coumaric acid and vanillic acid were the most abundant polyphenolic components in the samples. In addition, the Fourier-transformed near infrared (FT-NIR) spectra of the samples were recorded and evaluated. The correlation between the differences in NIR spectra and the differences in polyphenol patterns of the samples was investigated. The polyphenol results were subjected to several statistical evaluations (Kruskal–Wallis test, Principal Component Analysis (PCA), Spearman correlation analysis, cluster analysis) to detect possible differences between the samples. Relationships between the polyphenol profile and antioxidant capacity (FRAP), total polyphenol content (TPC), free amino acid content (fAA) and the values of each polyphenol component were examined. Based on the results, an effort was made to group the varieties according to the attributes tested.
1. Introduction
Mushrooms are organisms that are visible to the human eye, and they differ both in their function and appearance. Their unique taste, texture and beneficial nutritional composition have made them part of the human diet for centuries. Among the approximately 2000 edible species, the most popular mushrooms are button mushrooms (Agaricus bisporus), shiitake mushrooms (Lentinula edodes) and oyster mushrooms (Pleurotus spp.) [1]. There are several species of oyster mushrooms, such as Pleurotus ostreatus, Pleurotus pulmonarius and Pleurotus sajor-caju. China is the primary producer of these mushrooms, accounting for around 87% of total production. Its popularity among breeders is due to a number of positive attributes, such as shorter growing time compared to other species, higher resistance to disease and pests and high yields [2]. In addition, it can be grown on agricultural waste and requires less space and water compared to other agricultural crops, making it cost-effective to produce [3]. However, it has the disadvantage of being a highly perishable variety due to its high moisture content (~90%), so it can be stored at room temperature for only 1–2 days [4]. It is low in calories, low in fat, high in protein and fibre and rich in many vitamins, minerals and phenolic components [5,6,7]. Polyphenols are secondary metabolites synthesised by plants that provide a protective function against various stress conditions and pathogenic threats [8]. Since the production of polyphenols is a response to stress on fungi, the quantity and quality of these compounds depends on many factors, such as climate, weather, the stage of development, species, etc., and therefore also on their geographical and botanical origin. Furthermore, in the case of cultivated mushrooms, the quality of the compost, the stage of development and the pre- and post-harvest stages also influence the chemical composition and nutritional value of the mushrooms [9]. These factors verify the diversity of published data on the same mushroom species [10]. The Pleurotus ostreatus’ fruiting body contains about 100 different bioactive compounds, such as phenolic compounds (phenolic acids, flavonoids, hydroxycinnamic acids, hydroxibenzoic acids, lignans, tannins, stilbenes and oxidised polyphenols) [11]. Polyphenol composition has been studied in a number of plant samples, showing that not only the processing method, but also the botanical and geographical origin influences their variability [12,13,14]. Due to the structural variability of different polyphenols and their numerous derivatives, the main challenge in their determination is the selection of the appropriate sample preparation method. Solvents of different polarities extract the various components with different efficiencies. Consequently, after careful optimisation, a compromise procedure needs to be found that is effective for the most polyphenols and most effective for the most relevant components [15]. High performance liquid chromatography (HPLC) or ultra-high performance liquid chromatography (UHPLC) is used to separate the polyphenol components in the prepared sample solution. After separation, UV, or less frequently diode array (DAD) or photo diode array (PDA), or mass spectrometry detection, are used. Phenolic compounds are measured in the wavelength range between 260 and 370 nm. However, the sensitivity of UV detection is not sufficient for the quantification of compounds present in small quantities and does not allow the identification of co-eluting components. Consequently, they are often used in combination with mass spectrometry [16].
The success of mushroom production depends on the breeding of suitable cultivars and the selection of strains with favourable characteristics such as high yields and excellent nutritional quality [17]. There are several ways to improve the genetic properties, such as intraspecific, interspecific or intergenetic hybridisation, gene transfer or selection [18,19].
The heteroallelic nature of mushrooms results in a wide variability in colour morphology, spore formation, texture, etc. Taxonomically, this variability poses a challenge to species identification, as misidentification can mislead mushroom growers in establishing the right environmental factors for growing different species. As a consequence, researchers face difficulties in selecting and breeding new strains with high yield potential [19]. In addition, distinguishing edible from non-edible mushrooms and detecting adulteration practices involving the mixing of high-quality mushrooms with poor quality ones for economic gain is also a key objective [9].
Due to the above-mentioned facts, the demand for analytical methods to determine and evaluate the quantity, quality and authenticity of food ingredients has increased significantly. The widespread use of near-infrared spectroscopy as an environmentally friendly, non-destructive “green” technique in agriculture is unquestionable. In combination with modern chemometric methods, nowadays it has become one of the key areas of analytical practice for the determination of nutritional parameters and the detection of adulteration [20].
The aim of this work is to detect possible differences between candidate varieties, as different characteristics may have different nutritional values for the human diet. The correlation between the differences in NIR spectra and the polyphenol patterns of the samples was investigated. The polyphenol results were subjected to several statistical evaluations (Kruskal–Wallis test, principal component analysis (PCA), Spearman correlation analysis, cluster analysis) to detect possible differences between samples. Correlations between polyphenol profiles and other nutritional characteristics (antioxidant capacity, total polyphenol content, free amino acid content) were investigated by Spearman correlation analysis.
2. Materials and Methods
2.1. Samples
The tested samples are interspecific hybrids of Pletorius ostreatus species. Thirteen candidate cultivars, with five samples per cultivar for a total of sixty-five samples, were investigated. The samples were grown under identical conditions and harvested and processed at the same stage of production. Therefore, differences in chemical composition can only be due to genetic differences [21]. The samples were analysed after gentle drying and grinding. During the drying, samples were treated in an air-conditioned oven (Memmert, Schwabach, Germany) at 60 °C for 19 h. The dried samples were then ground to a particle size smaller than 315 µm (Bosch TSM6A017C, Bosch GMbH, Stuttgart, Germany) [21].
2.2. Chemicals and Reagents
The polyphenol standards used in the measurements were purchased from Sigma-Aldrich, Cayman, Extrasyntese, Alfa Aesar, Merck and Fluka. The solid standards were first dissolved in dimethyl sulfoxide, and single component solutions with approximately 40 mM concentration were prepared. These solutions were then further diluted with methanol to a concentration of 1 mM. To prepare the standard mix solution with 20 µM concentration, the single component methanolic polyphenol standards were mixed in methanol and 0.1% v/v formic acid.
For the extraction of phenolic components, a 60:39:1 methanol:water: 0.1% v/v formic acid extraction solvent was prepared. In all cases, high purity Milli-Q (18 ΜΩ⋅cm−1) (Merck-Millipore, Milford, MA, USA) water was used for solution preparation and dilution. For UHPLC separation, a gradient elution was used; eluent A was prepared from HPLC-grade concentrated formic acid and eluent B was also HPLC-grade acetonitrile.
2.3. Polyphenol Determination by UHPLC-ESI-MS/MS
The extraction of polyphenols from the oyster mushrooms was performed as described by Palacios et al. (2011) [22] with some modifications. First, 0.5 g of sample was dissolved in 10 mL of extraction solvent (60% methanol, 39% water and 1% formic acid). It was then shaken for 30 min (Heidolph Reax 2. 20 °C), and finally it was centrifuged (3000 rpm, 10 min, 4 °C). The supernatant fraction containing the extracted components was used to prepare the standard addition solutions.
Separations of the phenolic components were performed using a Phenomenex Kinetex EVO C18 100 × 2.1 mm, 100 A, 2.6 µm, reversed phase stationary phase column (Phenomenex, Inc., Torrance, CA, USA) and a corresponding SecurityGuard ULTRA Cartridges (Phenomenex, Inc., Torrance, CA, USA) for UHPLC EVO C18 for 2.1 mm ID Columns. For elution, water containing 0.1% v/v formic acid (‘eluent A’) and UHPLC-MS grade acetonitrile (‘eluent B’) were used as solvents at a flow rate of 0.5 mL/min. The column temperature was set to 30 °C. The injected sample volume was 10 µL. Gradient elution with binary mobile phase was used for the analysis of polyphenols. A tandem (QQQ) mass spectrometer equipped with an ESI ion source (electrospray ionization) was used as a detector. The measurements were carried out in dMRM (Dynamic Multiple Reaction Monitoring) mode.
2.4. Total Polyphenol Content (TPC)
The total polyphenol content of the dried samples was determined according to Singleton V.L 1965 [23] using chromogenic redox reagent (Folin–Ciocalteou reagent) [21].
2.5. Antioxidant Capacity (FRAP)
The antioxidant capacity of the dried samples was determined by the Benzie FRAP [24] method using iron-2,4,6-tris(2-pyridyl)-S-triazine (TPTZ) [21].
2.6. Free Amino Acid Content (fAA)
Instrumental analysis of amino acids was performed using an automated amino acid analyser (Amino Acid Analyzer AAA400, Ingos Ltd., Prague, Czech Republic) equipped with an Ostion LCP5020 cation exchange column (200 × 3.7 mm). The AAA400 instrument was operated with the chromatography software CHROMuLAN vs. 0.26 (PiKRONLtd, Prague, Czech Republic). Determination was carried out in a strongly acidic medium using a series of eluents of decreasing acidity with stepwise gradient elution. Detection of amino acids was performed on the basis of their colour response to ninhydride by spectrophotometry. Proline was analysed at 440 nm, while the other amino acids were analysed at 570 nm [21].
2.7. Fourier-Transform near Infrared Spectroscopy (FT-NIR)
The gently dried and ground samples were subsequently measured on a Bruker MPA Multipurpose FT-NIR analyser (Bruker Optik GmbH, Ettlingen, Germany) equipped with a rotating quartz sample holder (d = 85 mm, 2 cm thick layer). Spectra were detected in the 12,500–3800 cm−1 measuring range. The diffuse reflectance absorption spectra were recorded with 8 cm−1 resolution and 10 kHz scanner speed. Each spectrum was detected as the average spectrum of 32 subsequent scans. The internal background was measured using the gold-coated surface of the integrating sphere.
Three spectra were recorded for each sample. As the prepared mushroom samples have a granular texture, homogeneity is not necessarily ensured. To eliminate possible light scattering phenomena due to grain size variation and to achieve a more ideal grain size distribution, the sample was moved in the sample holder between spectral recordings.
2.8. Statistical Evaluation
2.8.1. Normality Test
Previously, a Shapiro–Wilk test was used to determine whether our data series was normally distributed or not [25].
2.8.2. Correlation Analysis
The Pearson test can be used for normal distribution. We performed the Spearman correlation test because our data were non-normally distributed. The direction and value of the correlation (between −1 and +1) indicate the direction and the strength of the correlation.
2.8.3. Nonparametric Tests for Difference—Kruskal–Wallis
The Kruskal–Wallis H-test is the non-parametric equivalent of one-way ANOVA and is usually used when the data are non-normally distributed. It is used to determine if there is a statistically significant difference between the medians of three or more independent groups.
However, it does not determine where or how many differences actually occur. A test procedure is therefore needed to make pairwise comparisons. A procedure often used with the Kruskal–Wallis method is the Conover-Inman post-hoc procedure with Bonferroni correction.
The test was also performed on the correlation between the studied polyphenol components and the samples, as well as on the correlation between polyphenols [26].
2.8.4. Principal Component Analysis (PCA)
Principal component analysis was performed for both spectra and measured data. In the first case the spectral outliers were investigated, and in the second case the dominant polyphenol components were identified.
PCA is a commonly used statistical method that transforms several independent variables into a smaller number of new independent variables compared to the original ones by means of a linear transformation. This means that the originally observed variables are combined into a smaller number of principal component variables (PC) based on their correlation.
The first principal component (PC-1) explains the variability of the data with the largest possible variance. Each subsequent principal component explains the remaining variability of the data with the largest possible variance. It is used to represent the spatial distribution and clustering of variables. The principal component variables, calculated by considering the concentrations of the polyphenol components under study together, can be used to identify the dominant polyphenol components. For spectra, outliers can be easily identified [27].
2.8.5. Software Applications
Spectra were recorded with OPUS 7.2 (BRUKER, Ettlingen, Germany), a normality test, correlation analysis and a Kruskal–Wallis test with XLSTAT 2019 statistical and data analysis solution (Addinsoft (2019), Boston, MA, USA, https://www.xlstat.com); PCA was evaluated with UNSCRAMBLER 10.4 (CAMO, Oslo, Norway) software.
3. Results
3.1. Polyphenol Composition
Nineteen components commonly found in edible mushrooms and Pleurotus ostreatus were selected for quantitative analysis. The polyphenol profiles of the thirteen Pleurotus ostreatus cultivar candidate mushrooms are summarised in Table 1. It can be seen that 4-hydroxibenzoic acid, caffeic acid, p-coumaric acid and vanillic acid were the most abundant polyphenolic components in the samples. It was observed that p-coumaric acid (2.80–50.41 mg/kg) and 4-hydroxibenzoic acid (10.62–98.23 mg/kg) were present in all 13 candidate varieties, but their concentrations showed a high variability. Vanillic acid was found in measurable amounts only in the third and seventh variety candidates, while for caffeic acid only four variety candidates (6,8,9,12) did not contain these components. Both caffeic acid and vanillic acid were therefore present in the above-mentioned candidate varieties three and seven.

Table 1.
Polyphenols in Pleurotus ostreatus cultivars.
Ucar and Karadag (2019) also investigated the polyphenol composition of oyster mushrooms and identified gallic acid (56.08 ± 5.40 µg/g), protocatechuic acid (14.12 ± 3.89 µg/g), p-hydroxibenzoic acid (8.00 ± 1.32 µg/g), chlorogenic acid (11.08 ± 0.19 µg/g), p-coumaric acid (3.01 ± 0.86 µg/g) and o-coumaric acid (5.91 ± 1.40 µg/g) in the samples [4]. Min-Young et al. (2008) investigated the polyphenol pattern of edible and medicinal mushrooms using HPLC-DAD [28]. They identified gallic acid (7 µg/g), homogentisic acid (16 µg/g), protocatechuic acid (18 µg/g), chlorogenic acid (19 µg/g), naringin (9 µg/g) and myricetin (21 µg/g), but in contrast to our results, p-coumaric acid, p-hydroxibenzoic acid, caffeic acid and vanillic acid were not found in their samples. They also did not detect chlorogenic acid, syringic acid, ferulic acid, rutin, quercetin, kaempferol and hesperetin in the samples, which is in good agreement with our results. Oyster mushrooms were also analysed using the HPLC-DAD technique by Palacios and co-workers (2011) [22]. Several polyphenols were identified in the samples, including p-coumaric acid (11.15 ± 0.85 mg/g), ferulic acid (20.16 ± 0.16 mg/g), gallic acid (290.34 ± 3.61 mg/g), gentisic acid (292. 62 ± 3.42 mg/g), p-hydroxibenzoic acid (4.69 ± 1.59 mg/g), homogentisic acid (629.86 ± 1.54 mg/g), myricetin (21.99 ± 0.89 mg/g) and protocatechuic acid (19.32 ± 0.84 mg/g).
It can be seen that the polyphenol profile of these mushrooms is very diverse, indicating that many parameters other than botanical origin may influence this.
3.2. Spectrum Profiling
The raw spectra of the dried, ground 13 cultivars of Pleurotus ostreatus are shown in Figure 1. The figure shows a narrowed range (9000–3800 cm−1), since the wavenumber range 12,500–9500 cm−1 has no evaluable region. The spectra structure correlations in the 7500–4300 cm−1 region are presented in Table 2.
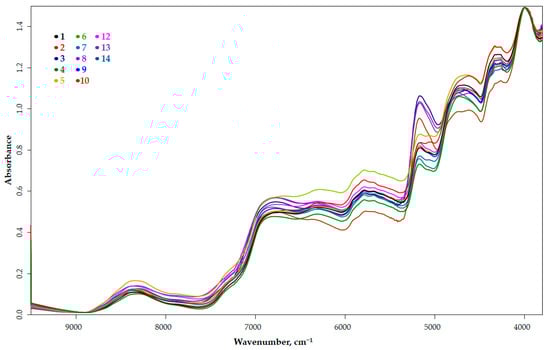
Figure 1.
Raw spectra of the thirteen cultivars of Pleurotus ostreatus.
Table 2.
Spectra structure correlations in 7500–4300 cm−1 region [29,30].
Differences in the shape of the spectra can already be seen in this figure. This difference is clearly visible in the first, but even more pronounced in the second derivative spectral image (Figure 2a). In Figure 2b,c, the ranges showing the typical differences are zoomed in.
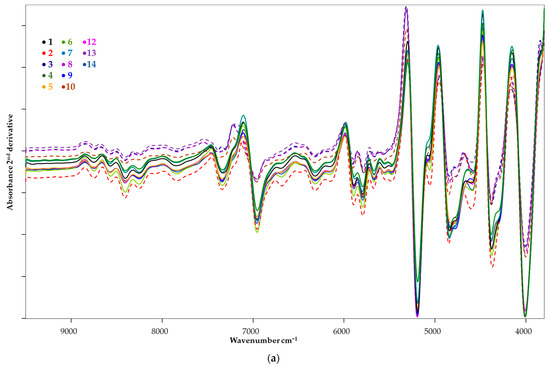
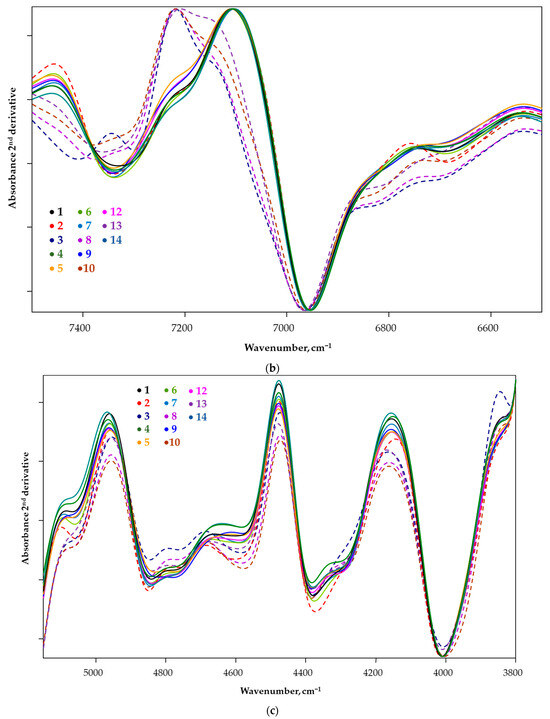
Figure 2.
The second derivative of the FT-NIR spectra of the candidate species Pleurotus ostreatus (a) with highlighted areas ((b) = 7500–6500 cm−1; (c) = 5500–3800 cm−1).
For the samples marked with broken lines (2, 3, 8, 10, 13), a difference in the spectral pattern was observed. This divergence is either a peak shift or the appearance of a new peak. In the 7500–6500 cm−1 region (Figure 2b), overtones and combinations of stretching and bending vibrations associated with aliphatic and aromatic C-H bonding are predominant, while in the 5500–5000 cm−1 and 4800–4600 cm−1 regions, combinations of O-H bonding and normal vibrations associated with aliphatic and aromatic amino acids and proteins are typically observed (Table 2). The 4400–4300 cm−1 spectral shift (Figure 2c) is related to the chitin content of the samples. Spectral images indicate that samples 2, 3, 8, 10, 13 show a qualitative difference compared to the other samples tested, mainly in terms of polyphenol and amino acid profiles.
Furthermore, it is important to emphasise that chitin, a characteristic component of mushrooms, is also an infra-active component, so differences in chitin content may also contribute to differences in spectra.
The specific polyphenol and amino acid parameters of these samples are summarised in Table 3.
Table 3.
Amino acid and polyphenol patterns of samples with different spectra.
3.3. Chemometric Evaluation of Polyphenol Data
3.3.1. Normality Testing
With the exception of sinapic acid, the data on polyphenols showed a non-normal distribution, so the data were treated as uniformly non-normally distributed for uniform data management.
3.3.2. Correlation Analysis
Our non-normally distributed polyphenol data, as well as TPC, FRAP and free amino acid values from previous studies [21], were subjected to Spearman correlation analysis.
The results of the analysis showed that the concentrations of sinapic acid were not significantly correlated with any of the other polyphenol components tested, nor with the previously established TPC results. A middle strong negative correlation (−0.620) was found between the vanillic acid and catechin.
A very strong positive significant correlation was found between the following polyphenol components: rutin–chrysin (0.956), chrysin–isorhamnetin (0.929), rosmarinic acid–conifer–aldehyde (0.918), rutin–quercetin (0.912), rutin–kaempferol (0.907), quercetin–rosmarinic acid (0.901).
A strong positive significant correlation was observed in the following cases: 5-CQA-ferulic acid (0.879), genistein–rutin (0.874); rosmarinic acid–rutin (0.868); 5-CQA–naringin (0.863); quercetin–isorhamnetin (0.863); apigenin–luteolin (0.863); quercetin–chrysin (0.857); chrysin–apigenin (0.835); isorhamnetin–genistein (0.824); quercetin–conifer–aldehyde (0.813); chrysin–genistein (0.808); isorhamnetin–apigenin (0.808) (File S1).
Based on the results, TPC values only show a middle strong positive significant correlation with the concentration of genistein and myricetin among the polyphenols. FRAP values did not show significant correlation with any of the tested polyphenol components. The results are explained by the fact that both TPC and FRAP also measure reducing compounds other than polyphenols.
Spearman correlation analysis was also performed for polyphenols–amino acids. Positive significant correlations of varying strengths were found between the following polyphenols and amino acids: hesperetin–lysine (0.791); hesperetin–asparagine (0.753); myricetin–cysteine (0.717); hesperetin–arginine (0.698); p-coumaric acid–glutamine (0.692); hesperetin–serine (0.670); hesperetin–valine (0.665); hesperetin–phenylalanine (0.659); hesperetin–tyrosine (0.643); hesperetin–total free amino acid (0.621); chrysin–total free amino acid (0.621); hesperetin–1-methyl-histidine (0.599); hesperetin-histidine (0.593); myricetin–proline (0.566); chrysin–glycine (0.560). However, a strong negative significant correlation (−0.713) was observed between ellagic acid and cysteine.
3.3.3. Kruskal–Wallis Test
The Kruskal–Wallis non-parametric statistical procedure was performed for each polyphenol component tested (3–3 parallel values) and also for the comparison of samples. For 4-hydroxibenzoic acid, caffeic acid and p-coumaric acid, a significant difference between samples was found at the 95% significance level. For 4-hydroxibenzoic acid, samples 1–2, for caffeic acid, samples 2–13 and samples 3–13 and for p-coumaric acid, samples 3–12 and samples 3–6 are different. This result can be compared with the differences seen in the spectra. Based on the Kruskal–Wallis result, it can be assumed that the different spectra in sample 2 may be related to the concentration of 4-hydroxibenzoic acid and caffeic acid, and in sample 3 to the concentration of caffeic acid and p-coumaric acid (Files S2–S4). The polyphenol patterns of the samples were compared; the results are reported in Table 4. This shows that the polyphenol patterns of sample 2, samples 5, 12 and 13 and sample 1 are different and form a distinct group.
Table 4.
Multiple pairwise comparisons using the Conover–Iman procedure/two-tailed test.
The relation of each sample to the other is shown in Table 5.
Table 5.
Significant differences between samples based on polyphenol profile.
3.3.4. Principal Component Analysis
The PCA analysis on spectral data was used to identify spectral outliers. It was carried out on the average spectra of the thirteen candidate varieties. Based on Hotelling’s T2 and F-residual values, no spectral outliers were detected, and thus the candidate varieties can be considered as one sample population from a spectral point of view.
The polyphenol data were normalised before PCA (Figure 3), since the data values for some components differed by an order of magnitude from the others. Based on Figure 3, groups can be clearly distinguished, but the composition of the groups differs from the group recognition based on the spectral data.
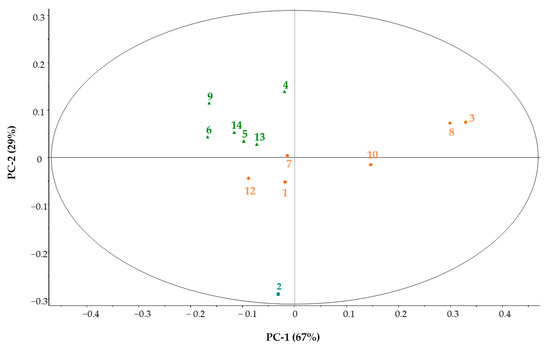
Figure 3.
PCA pattern recognition based on polyphenol results. The numbers in the figure represent the sequence number of the samples.
Samples 1, 3, 10 were also grouped together in this case, but they were supplemented by samples 7, 8 and 12. Sample 2 was completely separated. The PCA test provides an opportunity to determine which polyphenol components are primarily responsible for the variance (Figure 4a,b).
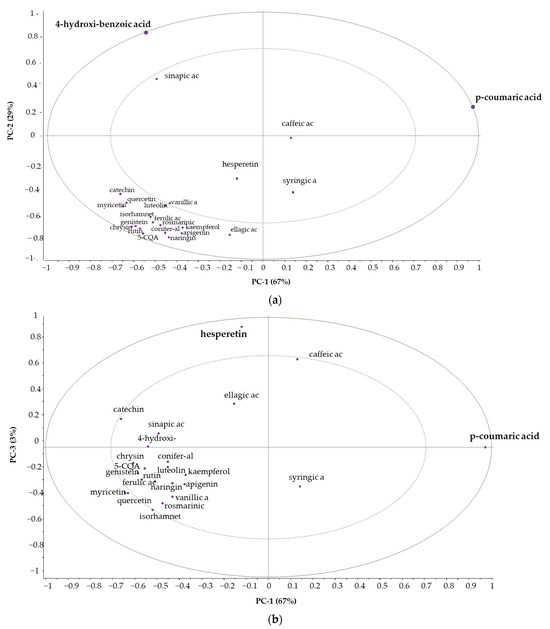
Figure 4.
Correlation loadings PC-1 vs. PC-2 (a), PC-1 vs. PC-3 (b).
Correlation loadings were computed for each variable for the displayed principal components. In addition, the plot contains two ellipses that indicate how much variance is taken into account. The outer one is the unit-circle and shows 100% explained variance. The inner ellipse represents 50% of explained variance.
The importance of individual variables is visualised more clearly in the correlation loadings plot compared to the standard loadings plot.
It can be concluded that 4-hydroxibenzoic acid, p-coumaric acid and hesperetin are mainly responsible for the variance. The polyphenolic components located in the area between the two ellipses have a smaller but not negligible effect.
The first principal component is defined by p-coumaric acid (Figure 5a), the second principal component by 4-hydroxibenzoic acid (Figure 5b) and the third principal component by hesperetin (Figure 5c).
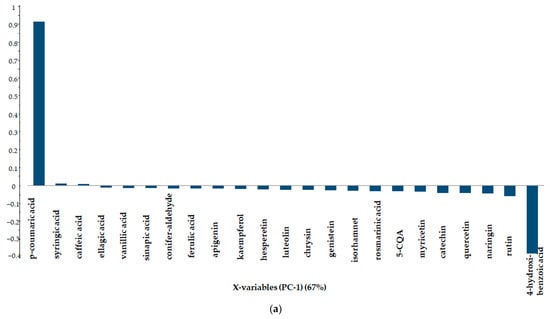
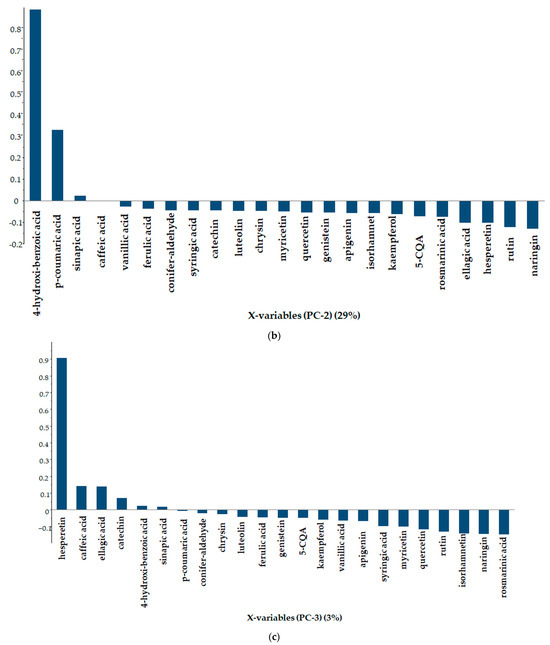
Figure 5.
Line plot of loadings in descending order of importance ((a)−PC-1, (b)−PC-2, (c)−PC-3).
3.3.5. Pattern Recognition by Cluster Analysis
For the polyphenol data (Figure 6), complete linkage clustering using Euclidean distance cluster analysis was performed, resulting in three clusters. Based on the results, sample 2 is separated, samples 3 and 8 form a separate group, and the remaining samples are placed in the third group.
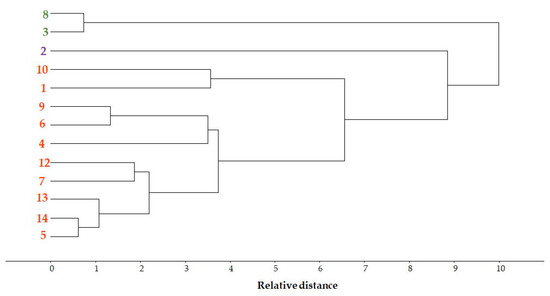
Figure 6.
Cluster analysis of cultivated Pleurotus ostreatus samples based on polyphenol concentrations.
The cluster analysis of the normalised values of the amino acid data resulted in a new clustering. Namely, samples 9, 12 and 13 form one cluster, samples 8 and 10 form another cluster, and the remaining samples can be grouped into a single cluster (File S5).
This can be interpreted as an explanation for our hypothesis that the observed qualitative differences in the spectra of the candidate varieties are not only influenced by the polyphenol and amino acid profile, but also by other components (e.g., polysaccharide and fibre content).
4. Discussion
The aim of the work was to detect possible differences between thirteen Pleurotus ostreatus cultivar candidate varieties based on their polyphenol patterns and to explore the possible relationship between polyphenol patterns and other nutritional characteristics. The 4-hydroxibenzoic acid, caffeic acid, p-coumaric acid and vanillic acid were the most abundant polyphenolic components in the samples.
Principal component analysis for polyphenol concentrations clearly separated sample 2 from the others, which were put into two further groups. The first principal component is determined by p-coumaric acid (67%), the second principal component by 4-hydroxibenzoic acid (29%) and the third principal component by hesperetin (3%).
Based on Kruskal–Wallis analysis, a significant difference was found between the samples at 95% significance level for 4-hydroxibenzoic acid, caffeic acid, p-coumaric acid. Considering the total polyphenol pattern, sample 2 was found to be significantly different from the others, forming a separate group.
The candidate variety 2 was also grouped separately by the cluster analysis for polyphenol concentrations, clearly distinguishing it from the other varieties.
Finally, the samples can also be divided into three groups based on the NIR spectra, one of which is represented by sample 2, with differences in the 6900–6700 cm−1 and 5500–5000 cm−1 range.
In summary, although the statistical methods used for the polyphenol profile grouped the samples slightly differently, the results were definitely consistent for several cases. The candidate variety 2 was clearly distinguishable by all statistical methods in terms of its positive nutritional characteristics. The distinction of mushroom cultivar candidate varieties based on their polyphenol profiles can be considered as a promising research direction; therefore, this work could be the starting point of a larger-scale study. Expanding the number of samples and the number of tested polyphenolic components and investigating other nutritional parameters such as chitin content could create the opportunity to select varieties with the best nutritional characteristics. These results could greatly assist the work of breeders.
Supplementary Materials
The following supporting information can be downloaded at: https://www.mdpi.com/article/10.3390/chemosensors12020019/s1, File S1: Spearman correlation matrix. File S2: Kruskal–Wallis test—4-hydroxibenzoic acid. File S3: Kruskal–Wallis test—caffeic acid. File S4: Kruskal–Wallis test—p-coumaric acid. File S5: Cluster analysis of cultivated Pleurotus ostreatus samples based on amino acid concentrations.
Author Contributions
Conceptualisation, A.M., M.F. and Z.J.; methodology, A.M., M.F. and Z.J.; software, A.M., M.F. and Z.J.; validation, A.M., M.F. and Z.J.; formal analysis, A.M., M.F. and Z.J.; investigation, A.M., M.F. and Z.J.; resources, A.M., M.F. and Z.J.; data curation, A.M., M.F. and Z.J.; writing—original draft preparation, A.M., M.F. and Z.J.; writing—review and editing, A.M., M.F. and Z.J.; visualisation, A.M., M.F. and Z.J.; supervision, A.M., M.F. and Z.J.; project administration, A.M., M.F. and Z.J. All authors have read and agreed to the published version of the manuscript.
Funding
This research was funded by the New National Programme of Excellence ÚNKP-22-3-II-MATE/16 of the Ministry of Culture and Innovation, which is funded by the National Research, Development and Innovation Fund of the Ministry of Culture and Innovation.
Institutional Review Board Statement
Not applicable.
Informed Consent Statement
Not applicable.
Data Availability Statement
The data presented in this study are available on request from the authors.
Acknowledgments
The authors are grateful for the support of the Doctoral School of Food Science of the Hungarian University of Agricultural and Life Sciences and for the New National Programme of Excellence ÚNKP-22-3-II-MATE/16 of the Ministry of Culture and Innovation, funded by the National Research, Development and Innovation Fund of the Ministry of Culture and Innovation.
Conflicts of Interest
The authors declare no conflicts of interest.
References
- Wan Mahari, W.A.; Peng, W.; Nam, W.L.; Yang, H.; Lee, X.Y.; Lee, Y.K.; Liew, R.K.; Ma, N.L.; Mohammad, A.; Sonne, C.; et al. A Review on Valorization of Oyster Mushroom and Waste Generated in the Mushroom Cultivation Industry. J. Hazard. Mater. 2020, 400, 123156. [Google Scholar] [CrossRef]
- Bellettini, M.B.; Fiorda, F.A.; Maieves, H.A.; Teixeira, G.L.; Ávila, S.; Hornung, P.S.; Júnior, A.M.; Ribani, R.H. Factors Affecting Mushroom Pleurotus Spp. Saudi J. Biol. Sci. 2019, 26, 633–646. [Google Scholar] [CrossRef]
- Muswati, C.; Simango, K.; Tapfumaneyi, L.; Mutetwa, M.; Ngezimana, W. The Effects of Different Substrate Combinations on Growth and Yield of Oyster Mushroom (Pleurotus ostreatus). Int. J. Agron. 2021, 2021, 9962285. [Google Scholar] [CrossRef]
- Ucar, T.M.; Karadag, A. The Effects of Vacuum and Freeze-Drying on the Physicochemical Properties and in Vitro Digestibility of Phenolics in Oyster Mushroom (Pleurotus ostreatus). Food Meas. 2019, 13, 2298–2309. [Google Scholar] [CrossRef]
- Assemie, A.; Abaya, G. The Effect of Edible Mushroom on Health and Their Biochemistry. Int. J. Microbiol. 2022, 2022, 8744788. [Google Scholar] [CrossRef]
- Feng, Y.; Xu, H.; Sun, Y.; Xia, R.; Hou, Z.; Li, Y.; Wang, Y.; Pan, S.; Li, L.; Zhao, C.; et al. Effect of Light on Quality of Preharvest and Postharvest Edible Mushrooms and Its Action Mechanism: A Review. Trends Food Sci. Technol. 2023, 139, 104119. [Google Scholar] [CrossRef]
- Rangsinth, P.; Sharika, R.; Pattarachotanant, N.; Duangjan, C.; Wongwan, C.; Sillapachaiyaporn, C.; Nilkhet, S.; Wongsirojkul, N.; Prasansuklab, A.; Tencomnao, T.; et al. Potential Beneficial Effects and Pharmacological Properties of Ergosterol, a Common Bioactive Compound in Edible Mushrooms. Foods 2023, 12, 2529. [Google Scholar] [CrossRef]
- Plant Metabolites under Environmental Stress: Mechanisms, Responses, and Adaptation Strategies, 1st ed.; Desai, N.M., Patil, M., Pawar, U.R., Eds.; Apple Academic Press: Palm Bay, FL, USA, 2023; ISBN 978-1-77491-094-8. [Google Scholar]
- Abdelshafy, A.M.; Belwal, T.; Liang, Z.; Wang, L.; Li, D.; Luo, Z.; Li, L. A Comprehensive Review on Phenolic Compounds from Edible Mushrooms: Occurrence, Biological Activity, Application and Future Prospective. Crit. Rev. Food Sci. Nutr. 2022, 62, 6204–6224. [Google Scholar] [CrossRef] [PubMed]
- Reis, F.S.; Barros, L.; Martins, A.; Ferreira, I.C.F.R. Chemical Composition and Nutritional Value of the Most Widely Appreciated Cultivated Mushrooms: An Inter-Species Comparative Study. Food Chem. Toxicol. 2012, 50, 191–197. [Google Scholar] [CrossRef]
- Lesa, K.N.; Khandaker, M.U.; Mohammad Rashed Iqbal, F.; Sharma, R.; Islam, F.; Mitra, S.; Emran, T.B. Nutritional Value, Medicinal Importance, and Health-Promoting Effects of Dietary Mushroom (Pleurotus ostreatus). J. Food Qual. 2022, 2022, 2454180. [Google Scholar] [CrossRef]
- Domokos-Szabolcsy, É.; Alshaal, T.; Koroknai, J.; Kovács, S.; Tóth, C.; Csilléry, G.; Jókai, Z.; Matkovits, A.; Makleit, P.; Veres, S.; et al. Phytochemical Evaluation of the Fruits and Green Biomass of Determinate-Type Sweet Pepper (Capsicum annuum L. fasciculatum) Grown in Terrestrial Bioregenerative Life-Support Research Facilities. J. Plant Interact. 2023, 18, 2268118. [Google Scholar] [CrossRef]
- Matkovits, A.; Nagy, K.; Fodor, M.; Jókai, Z. Analysis of Polyphenolic Components of Hungarian Acacia (Robinia pseudoacacia) Honey; Method Development, Statistical Evaluation. J. Food Compos. Anal. 2023, 120, 105336. [Google Scholar] [CrossRef]
- Farkas, Á.; Horváth, G.; Kuzma, M.; Mayer, M.; Kocsis, M. Phenolic Compounds in Hungarian Acacia, Linden, Milkweed and Goldenrod Honeys. Curr. Res. Food Sci. 2023, 6, 100526. [Google Scholar] [CrossRef]
- Rahimah, S.B.; Djunaedi, D.D.; Soeroto, A.Y.; Bisri, T. The The Phytochemical Screening, Total Phenolic Contents and Antioxidant Activities in Vitro of White Oyster Mushroom (Pleurotus ostreatus) Preparations. Open Access Maced. J. Med. Sci. 2019, 7, 2404–2412. [Google Scholar] [CrossRef]
- Istasse, T.; Jacquet, N.; Berchem, T.; Haubruge, E.; Nguyen, B.K.; Richel, A. Extraction of Honey Polyphenols: Method Development and Evidence of Cis Isomerization Ubertas Academica. Anal. Chem. Insights 2016, 11, S39739. [Google Scholar] [CrossRef]
- Koutrotsios, G.; Kalogeropoulos, N.; Stathopoulos, P.; Kaliora, A.C.; Zervakis, G.I. Bioactive Compounds and Antioxidant Activity Exhibit High Intraspecific Variability in Pleurotus ostreatus Mushrooms and Correlate Well with Cultivation Performance Parameters. World J. Microbiol. Biotechnol. 2017, 33, 98. [Google Scholar] [CrossRef] [PubMed]
- Lettera, V.; Del Vecchio, C.; Piscitelli, A.; Sannia, G. Low Impact Strategies to Improve Ligninolytic Enzyme Production in Filamentous Fungi: The Case of Laccase in Pleurotus ostreatus. Comptes Rendus Biol. 2011, 334, 781–788. [Google Scholar] [CrossRef] [PubMed]
- Barh, A.; Sharma, V.P.; Annepu, S.K.; Kamal, S.; Sharma, S.; Bhatt, P. Genetic Improvement in Pleurotus (Oyster Mushroom): A Review. 3 Biotech 2019, 9, 322. [Google Scholar] [CrossRef]
- Amirvaresi, A.; Parastar, H. Miniaturized NIR Spectroscopy and Chemometrics: A Smart Combination to Solve Food Authentication Challenges. Front. Anal. Sci. 2023, 3, 1118590. [Google Scholar] [CrossRef]
- Fodor, M.; Mikola, E.E.; Geösel, A.; Stefanovits-Bányai, É.; Mednyánszky, Z. Application of Near-Infrared Spectroscopy to Investigate Some Endogenic Properties of Pleurotus ostreatus. Cultiv. Sens. 2020, 20, 6632. [Google Scholar] [CrossRef] [PubMed]
- Palacios, I.; Lozano, M.; Moro, C.; D’Arrigo, M.; Rostagno, M.A.; Martínez, J.A.; García-Lafuente, A.; Guillamón, E.; Villares, A. Antioxidant Properties of Phenolic Compounds Occurring in Edible Mushrooms. Food Chem. 2011, 128, 674–678. [Google Scholar] [CrossRef]
- Singleton, V.L.; Rossi, J.A. Colorimetry of Total Phenolics with Phosphomolybdic-Phosphotungstic Acid Reagents. Am. J. Enol. Vitic. 1965, 16, 144–158. [Google Scholar] [CrossRef]
- Benzie, I.F.F.; Strain, J.J. [2] Ferric Reducing/Antioxidant Power Assay: Direct Measure of Total Antioxidant Activity of Biological Fluids and Modified Version for Simultaneous Measurement of Total Antioxidant Power and Ascorbic Acid Concentration. In Methods in Enzymology; Elsevier: Amsterdam, The Netherlands, 1999; Volume 299, pp. 15–27. ISBN 978-0-12-182200-2. [Google Scholar]
- Sheard, J. Quantitative Data Analysis. In Research Methods; Elsevier: Amsterdam, The Netherlands, 2018; pp. 429–452. ISBN 978-0-08-102220-7. [Google Scholar]
- Ostertagová, E.; Ostertag, O.; Kováč, J. Methodology and Application of the Kruskal–Wallis Test. Appl. Mech. Mater. 2014, 611, 115–120. [Google Scholar] [CrossRef]
- Ringnér, M. What Is Principal Component Analysis? Nat. Biotechnol. 2008, 26, 303–304. [Google Scholar] [CrossRef]
- Kim, M.-Y.; Seguin, P.; Ahn, J.-K.; Kim, J.-J.; Chun, S.-C.; Kim, E.-H.; Seo, S.-H.; Kang, E.-Y.; Kim, S.-L.; Park, Y.-J.; et al. Phenolic Compound Concentration and Antioxidant Activities of Edible and Medicinal Mushrooms from Korea. J. Agric. Food Chem. 2008, 56, 7265–7270. [Google Scholar] [CrossRef]
- Workman, J.; Weyer, L. Practical Guide to Interpretive Near-Infrared Spectroscopy; CRC: Boca Raton, FL, USA, 2008; ISBN 978-1-57444-784-2. [Google Scholar]
- Beć, K.B.; Huck, C.W. Breakthrough Potential in Near-Infrared Spectroscopy: Spectra Simulation. A Review of Recent Developments. Front. Chem. 2019, 7, 48. [Google Scholar] [CrossRef]
Disclaimer/Publisher’s Note: The statements, opinions and data contained in all publications are solely those of the individual author(s) and contributor(s) and not of MDPI and/or the editor(s). MDPI and/or the editor(s) disclaim responsibility for any injury to people or property resulting from any ideas, methods, instructions or products referred to in the content. |
© 2024 by the authors. Licensee MDPI, Basel, Switzerland. This article is an open access article distributed under the terms and conditions of the Creative Commons Attribution (CC BY) license (https://creativecommons.org/licenses/by/4.0/).