
Rapid Assessment of Extractability of Macronutrients from Yerba Mate (Illex paraguariensis) Leaves Based on Laser-Induced Breakdown Spectroscopy


Abstract
1. Introduction
2. Materials and Methods
2.1. Samples
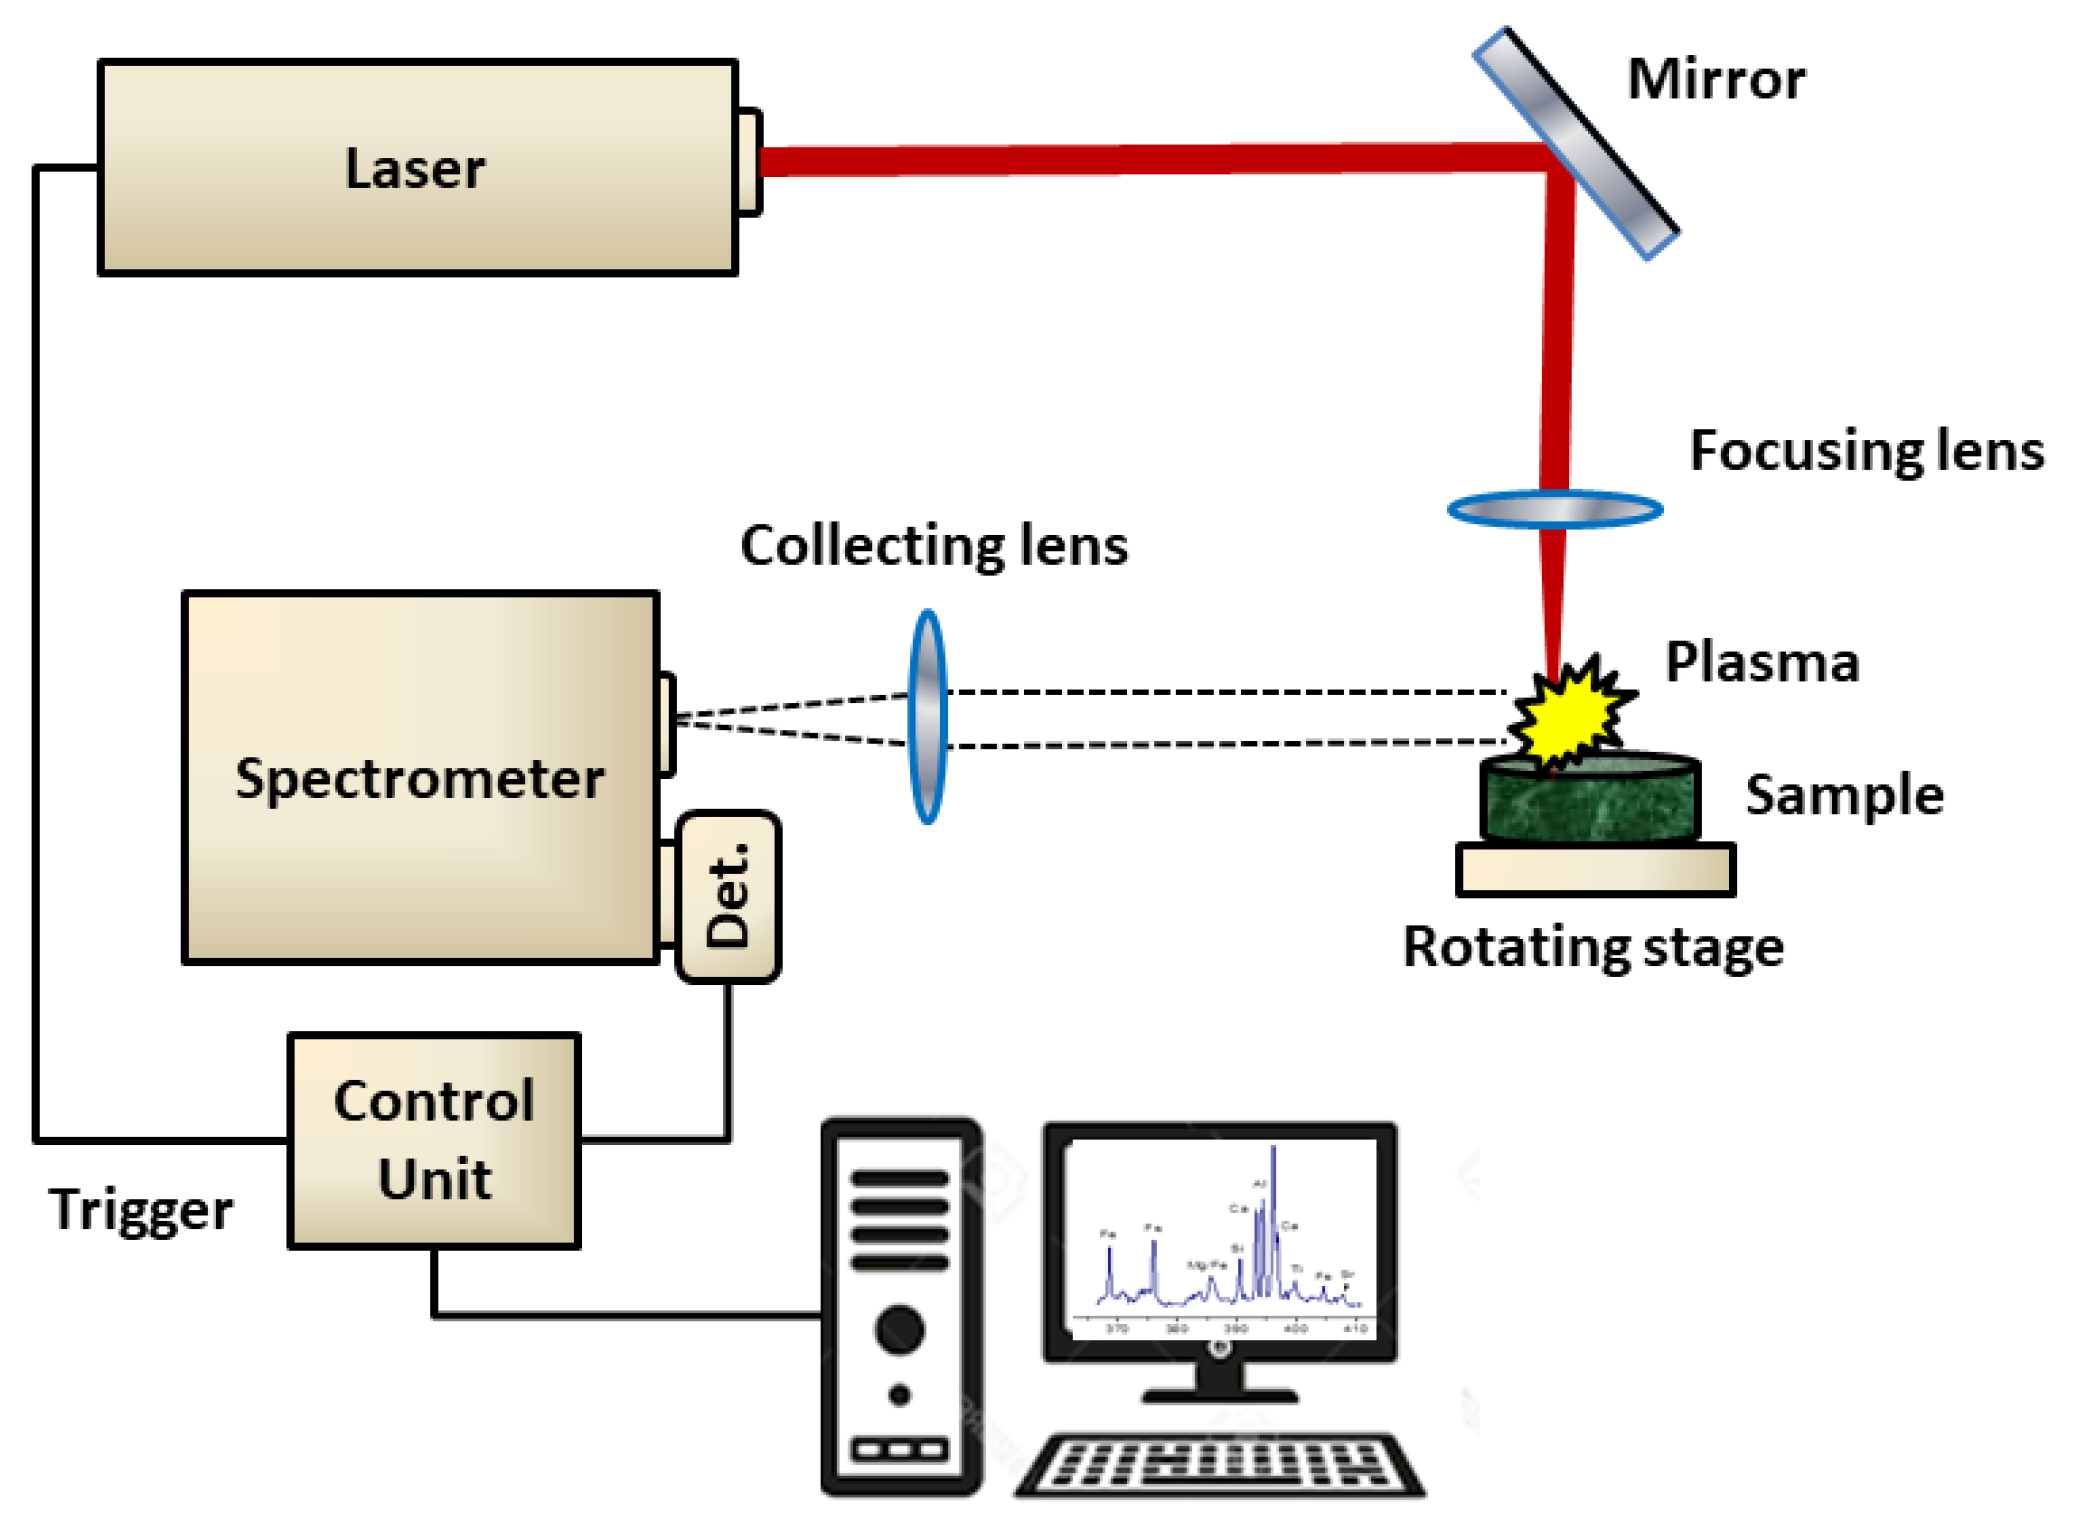
2.2. LIBS Analysis
2.3. AAS Analysis
3. Results and Discussion
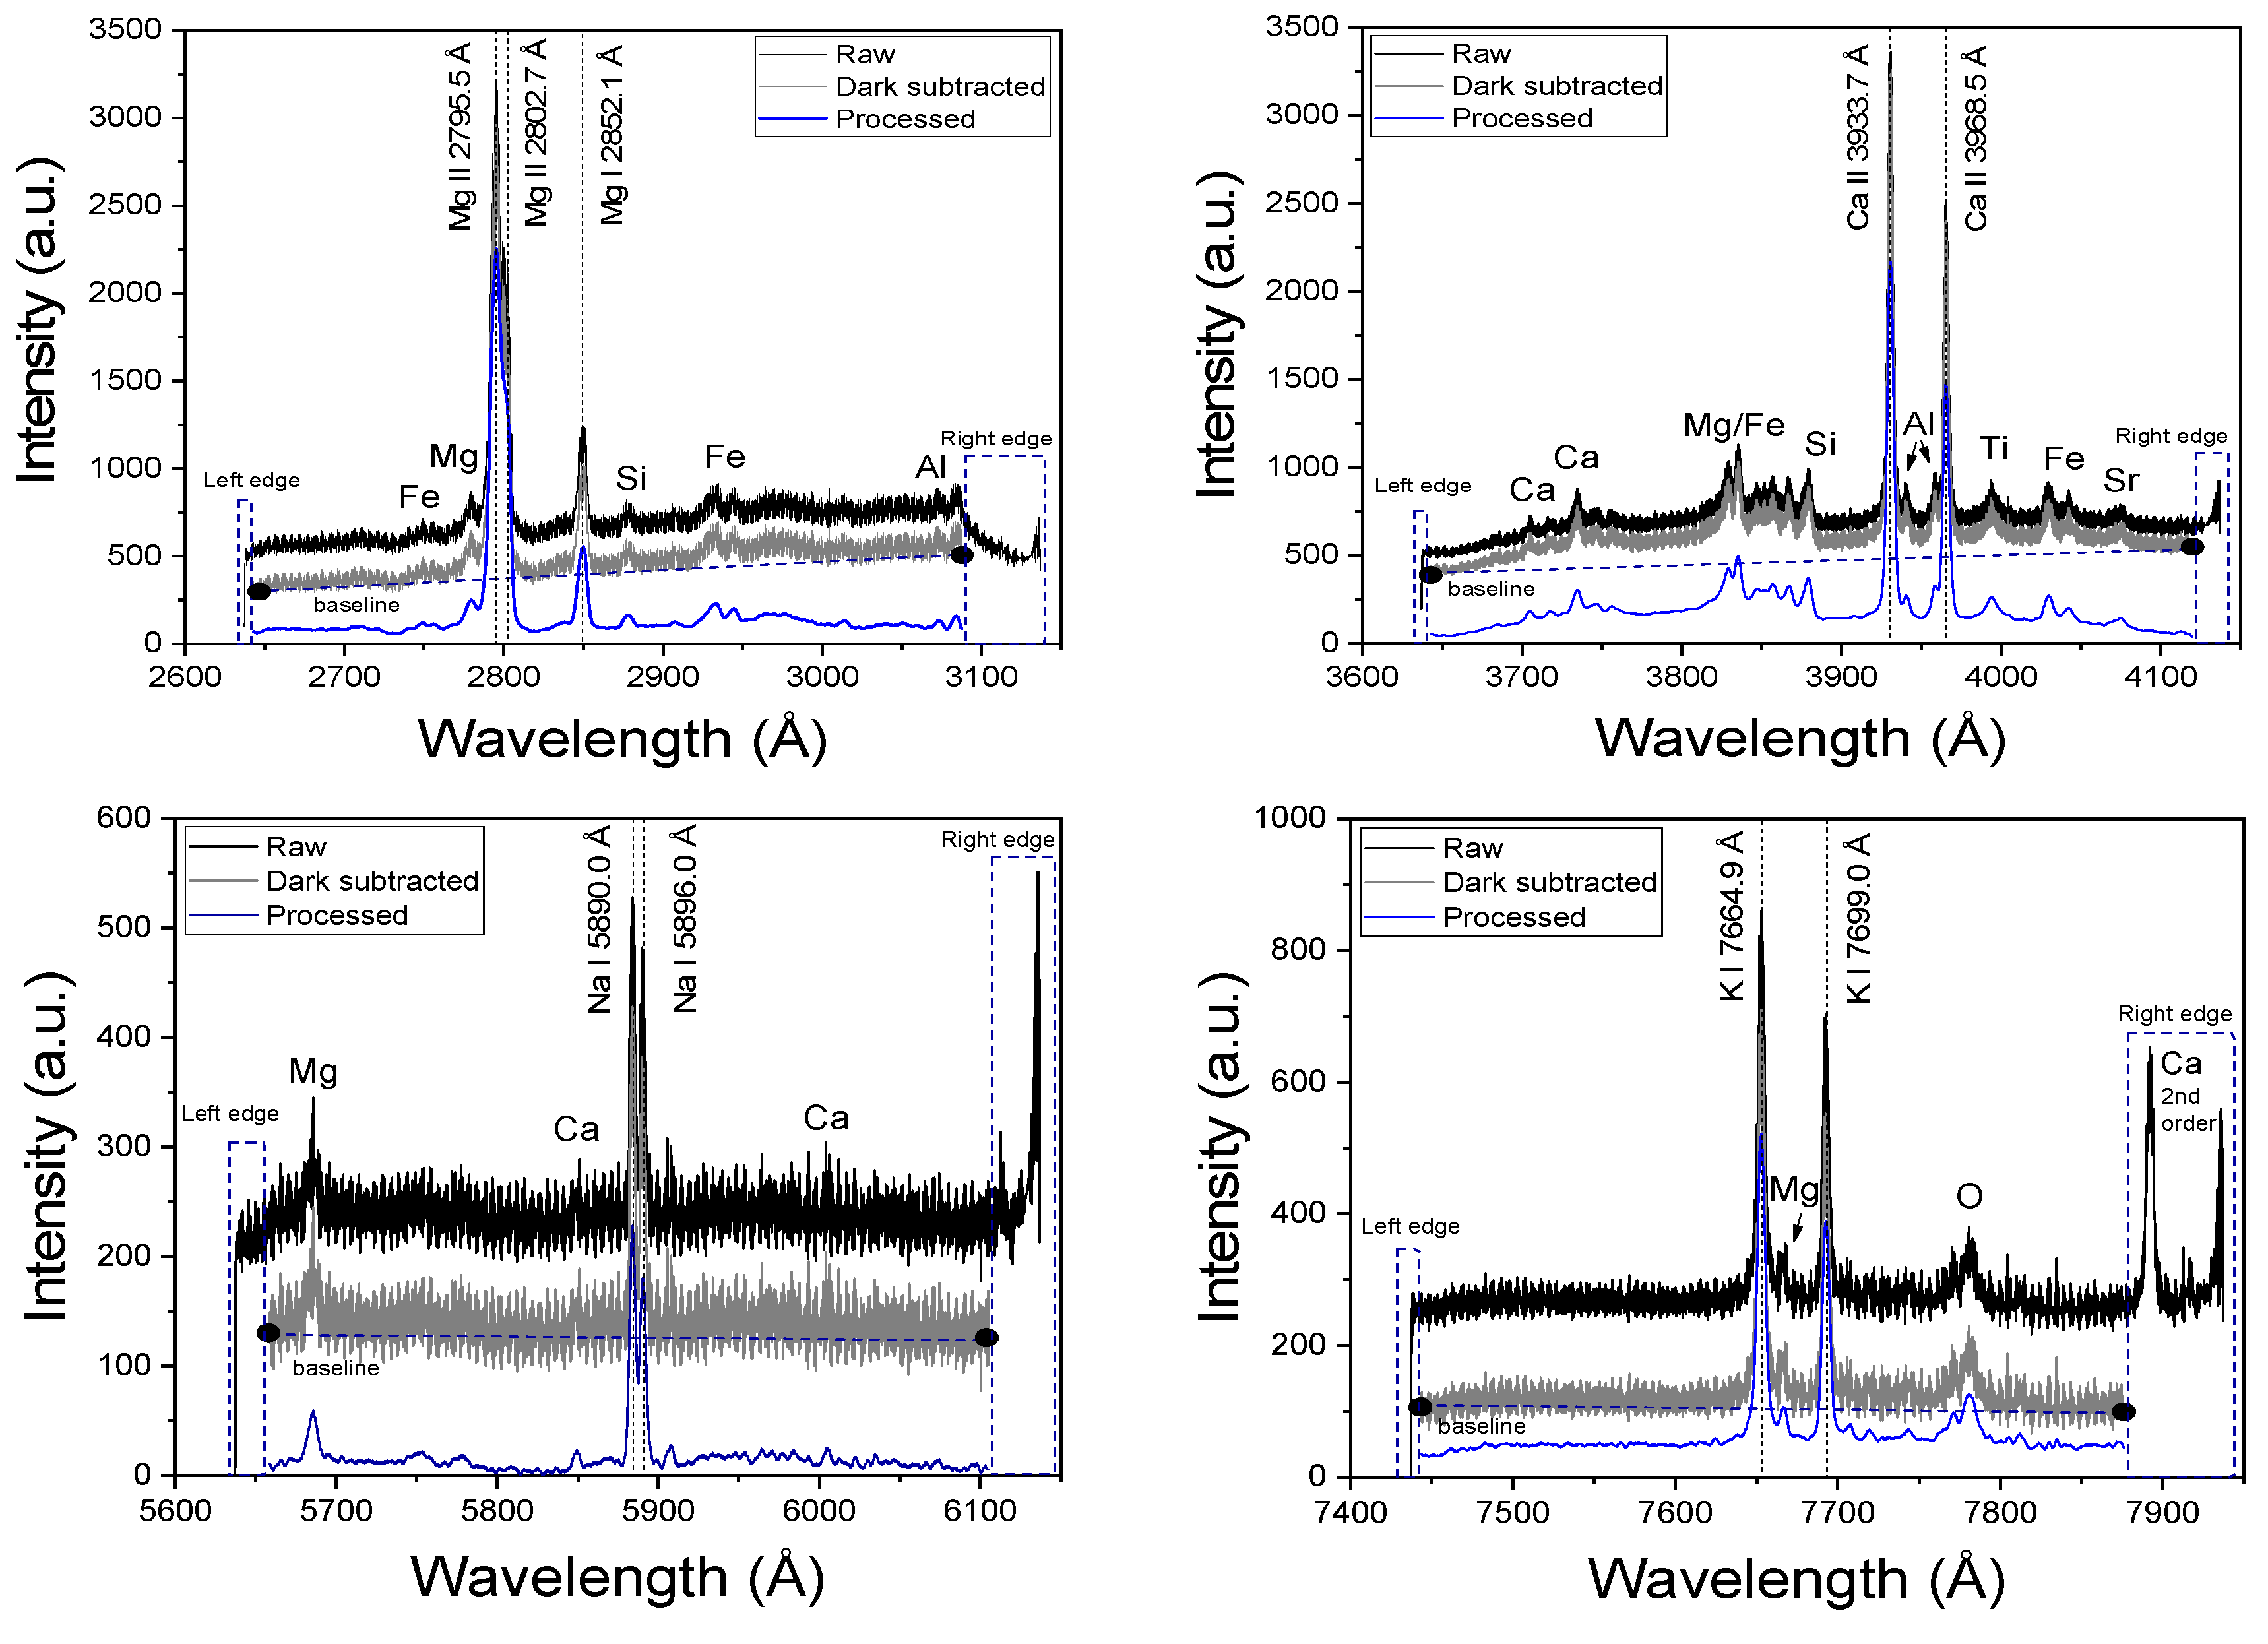
3.1. Data Pre-Processing
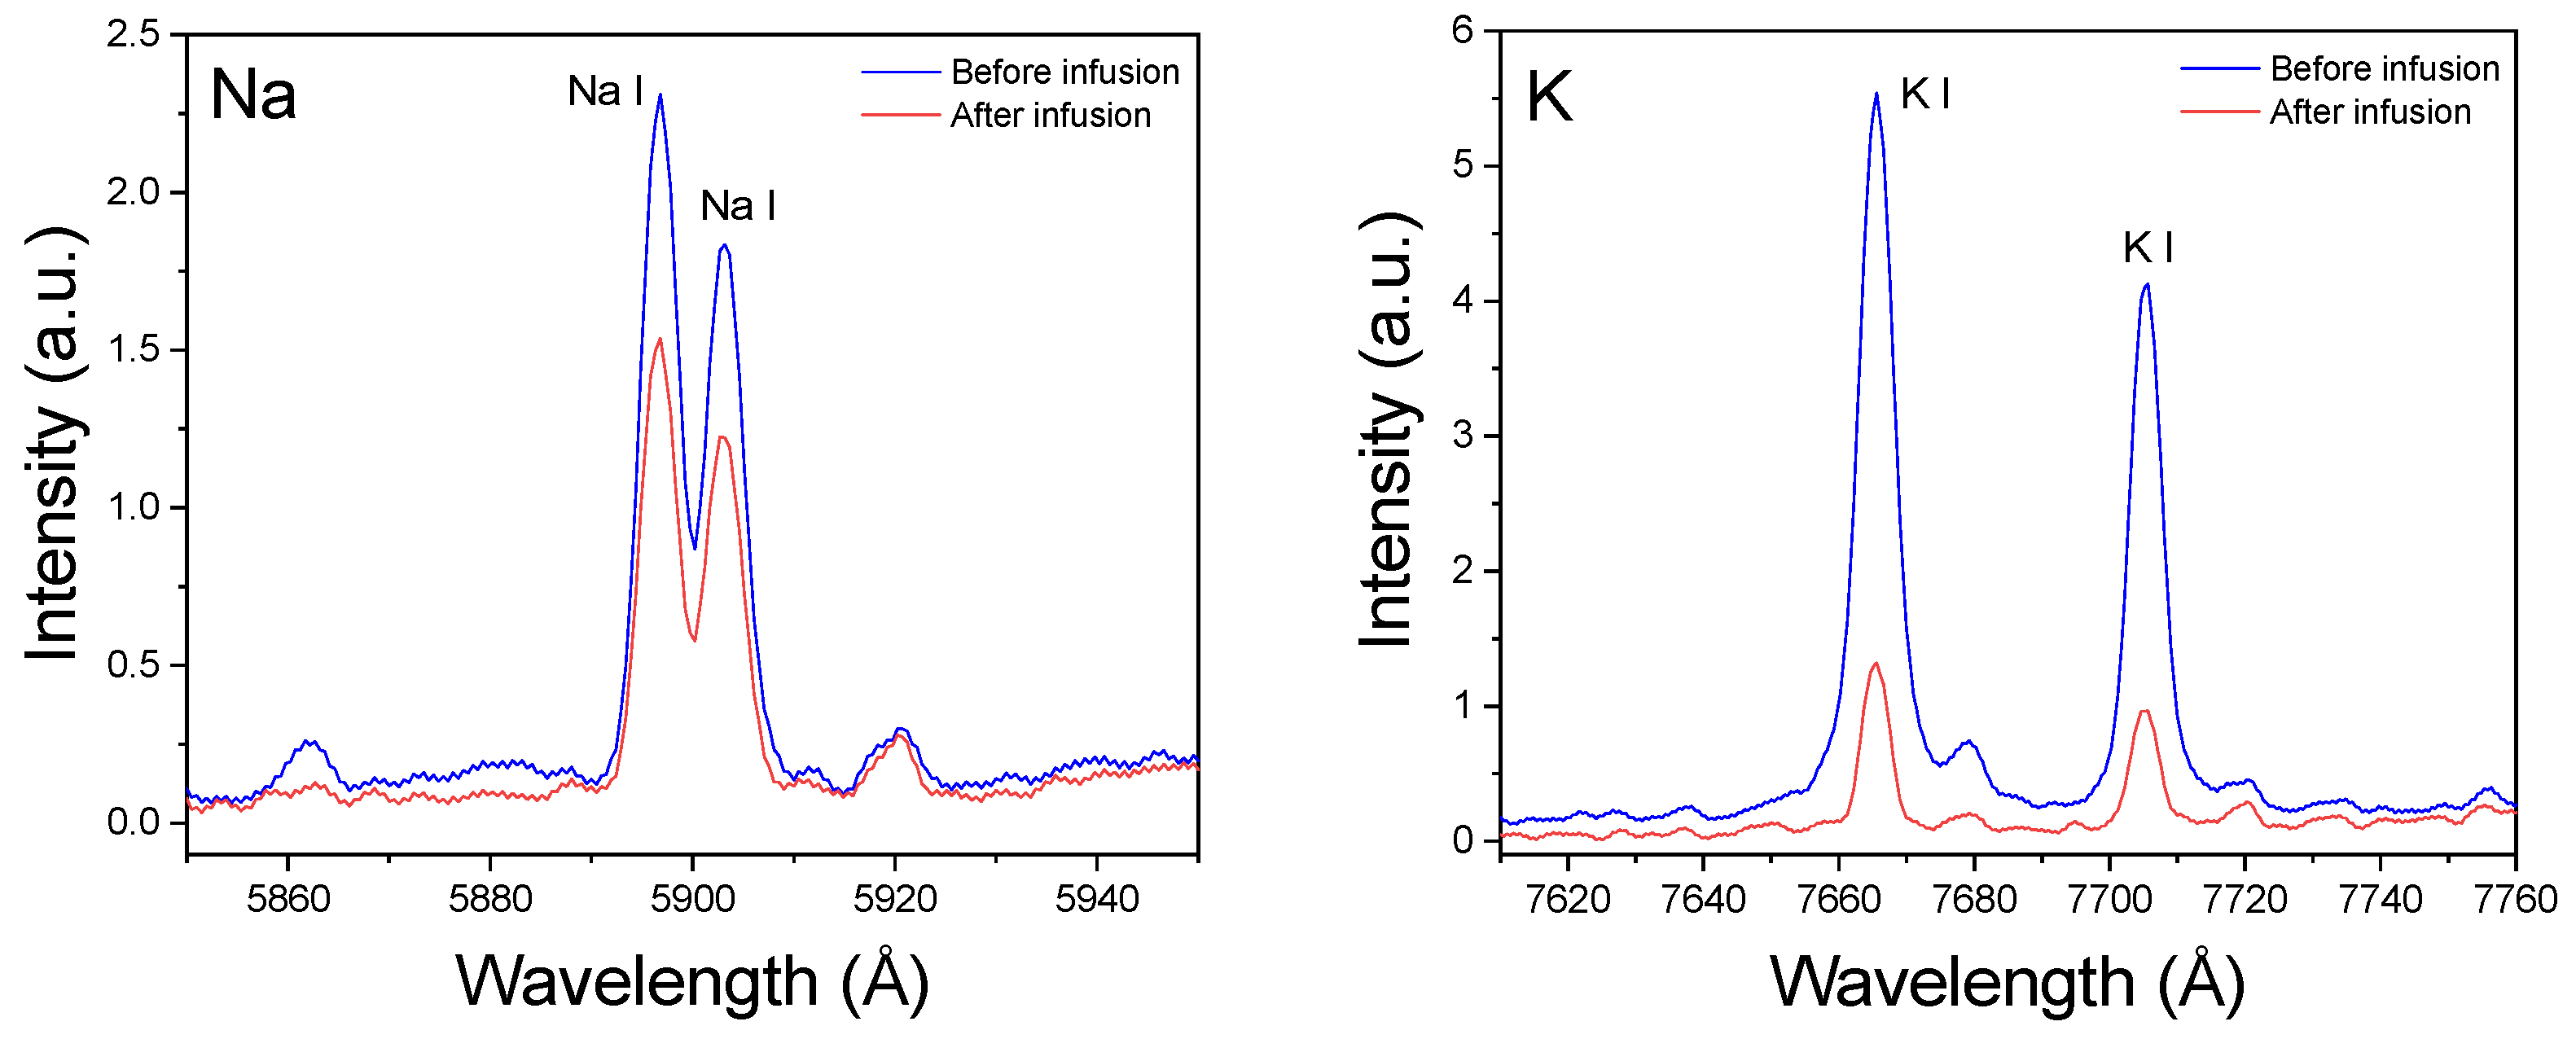
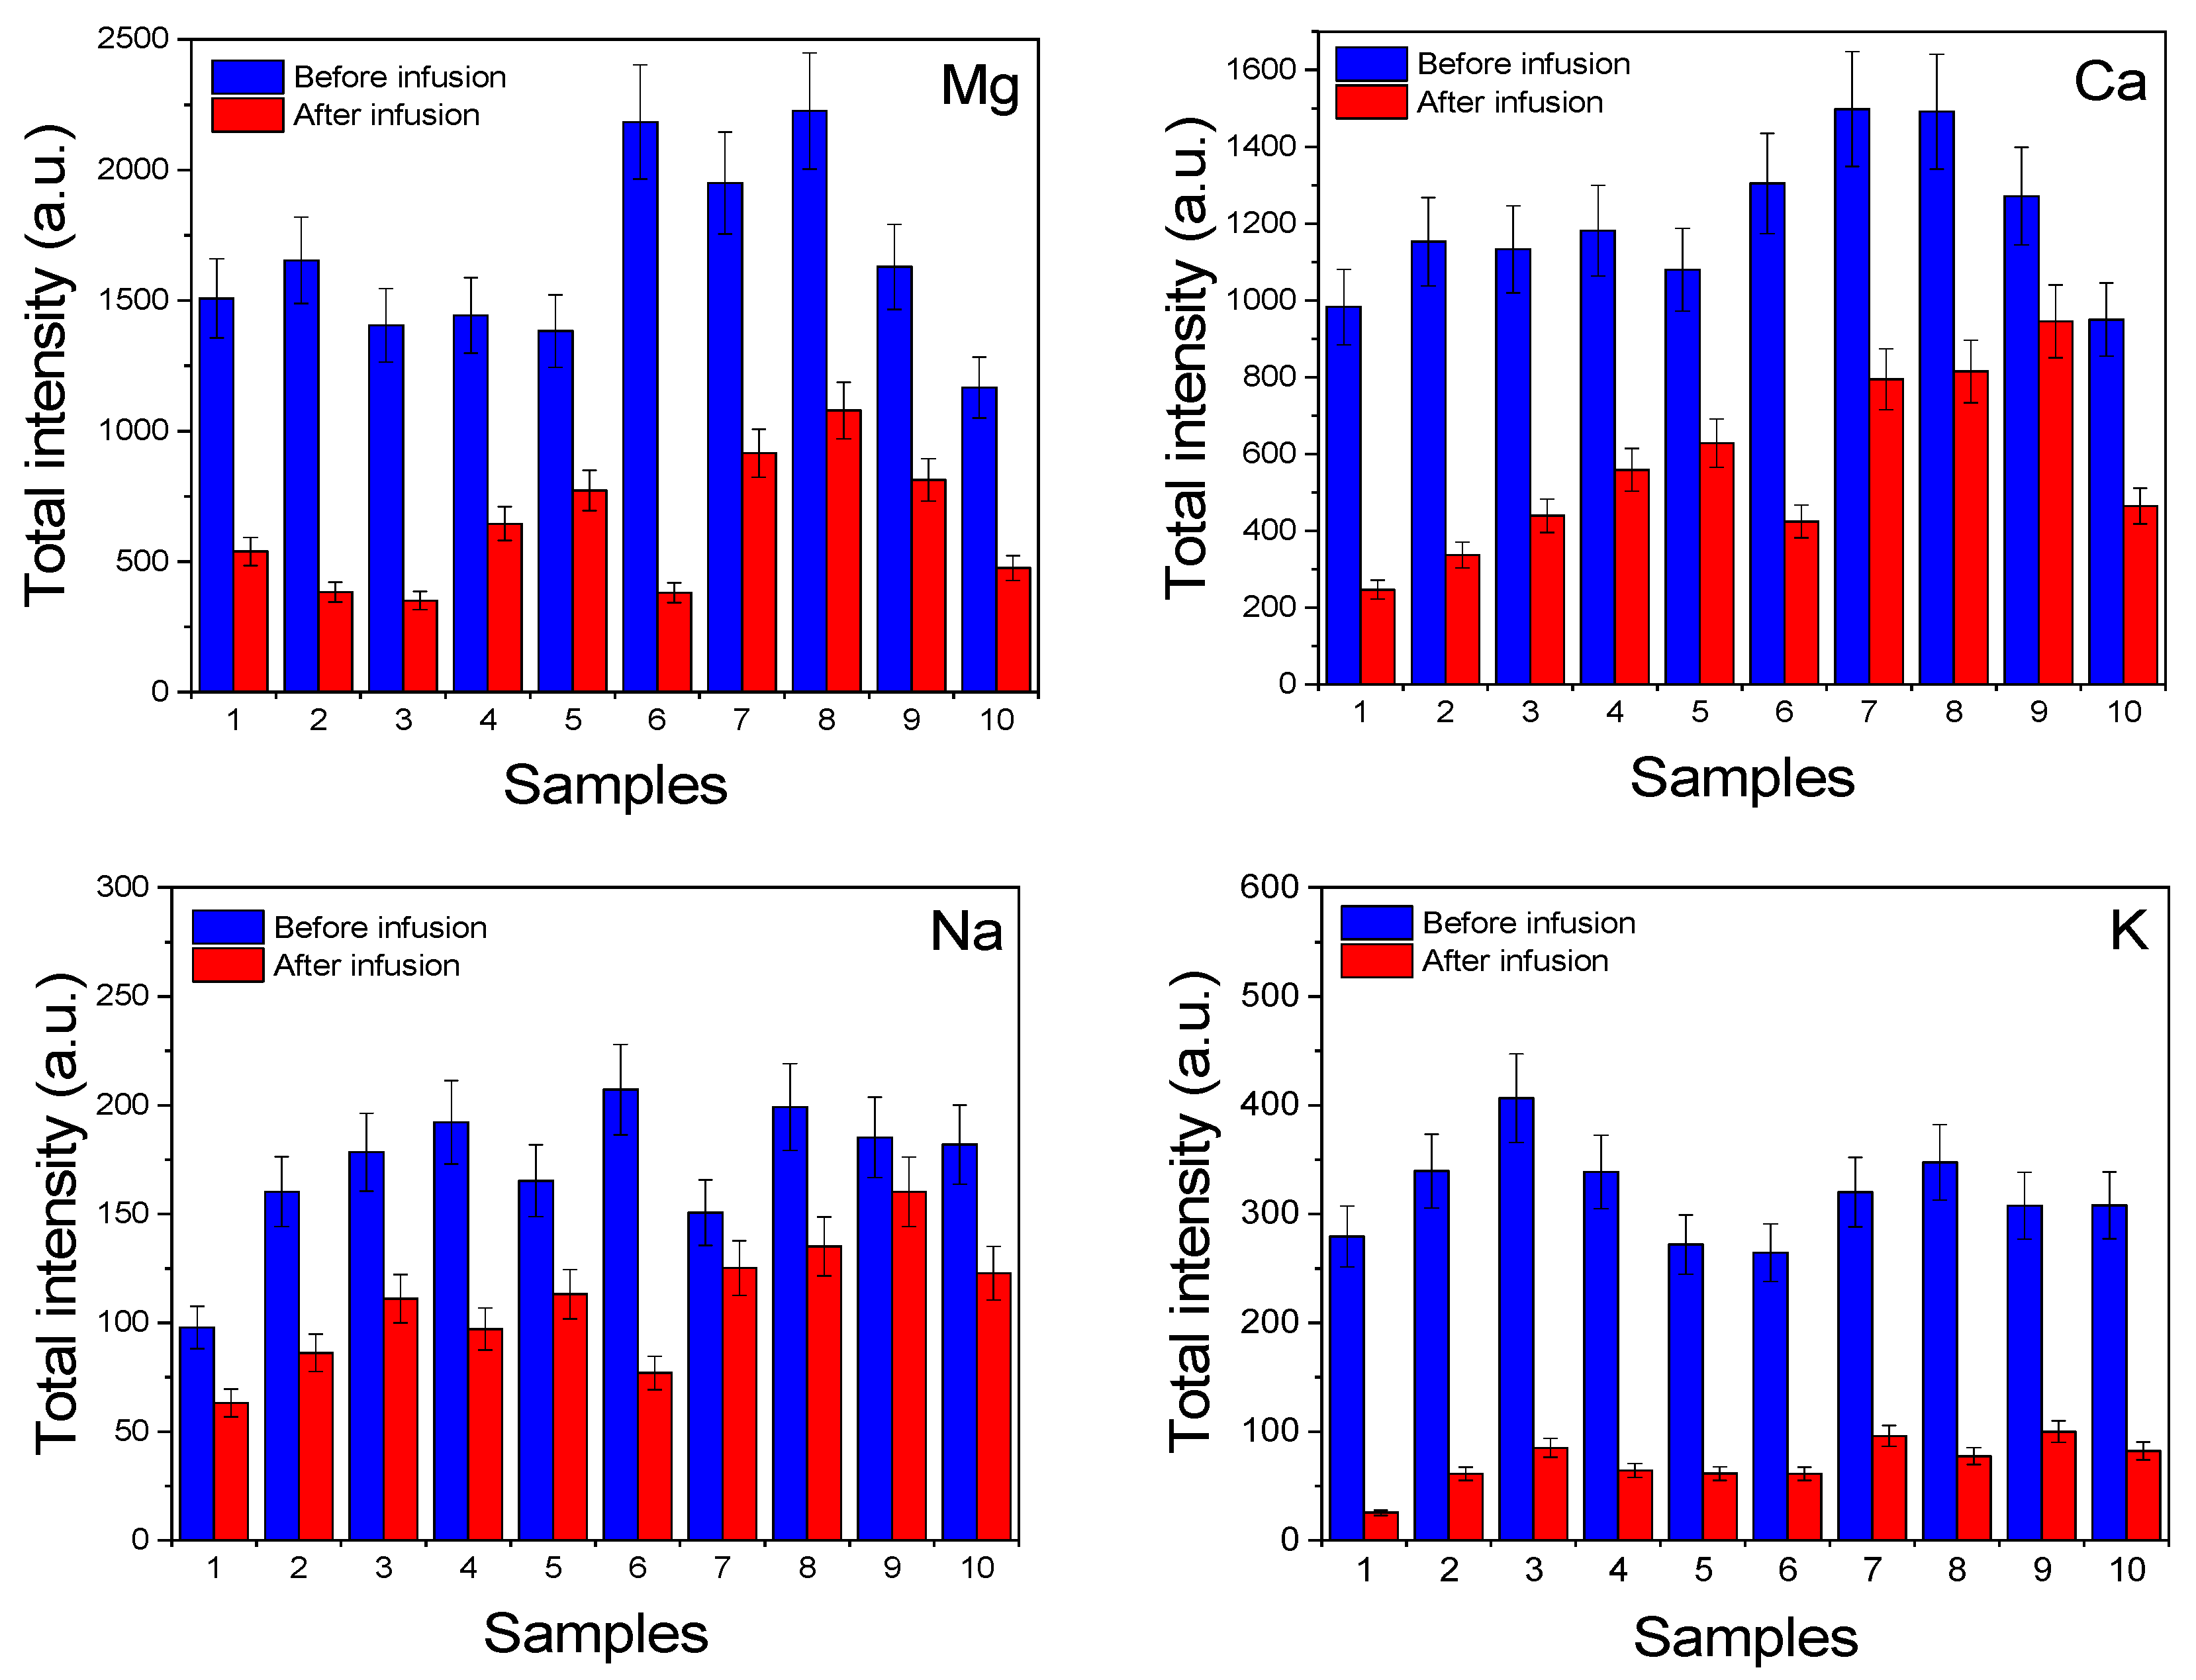
3.2. Spectral Analysis
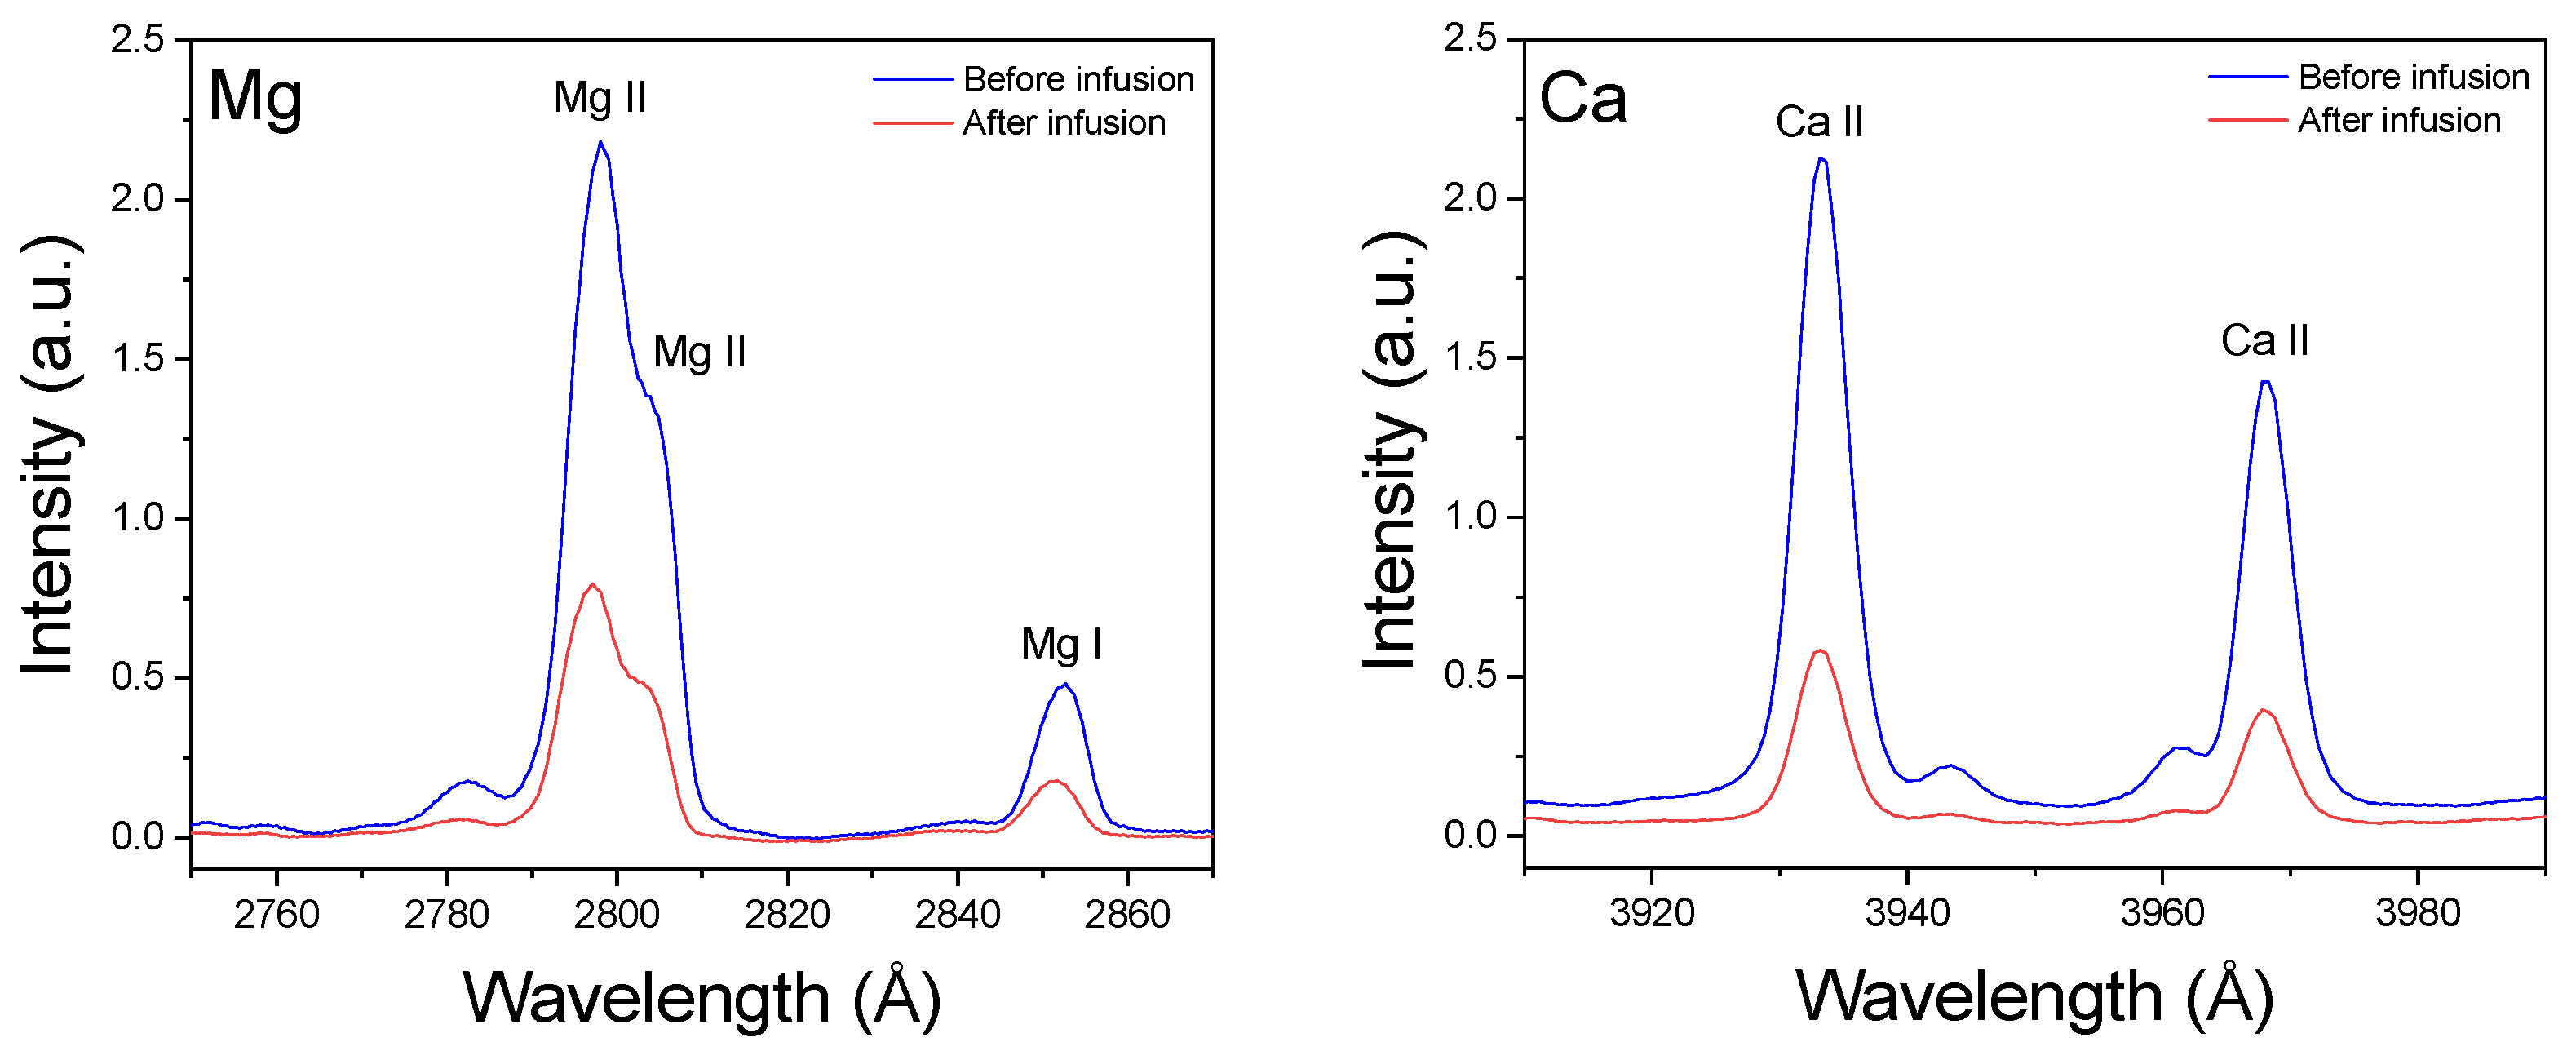
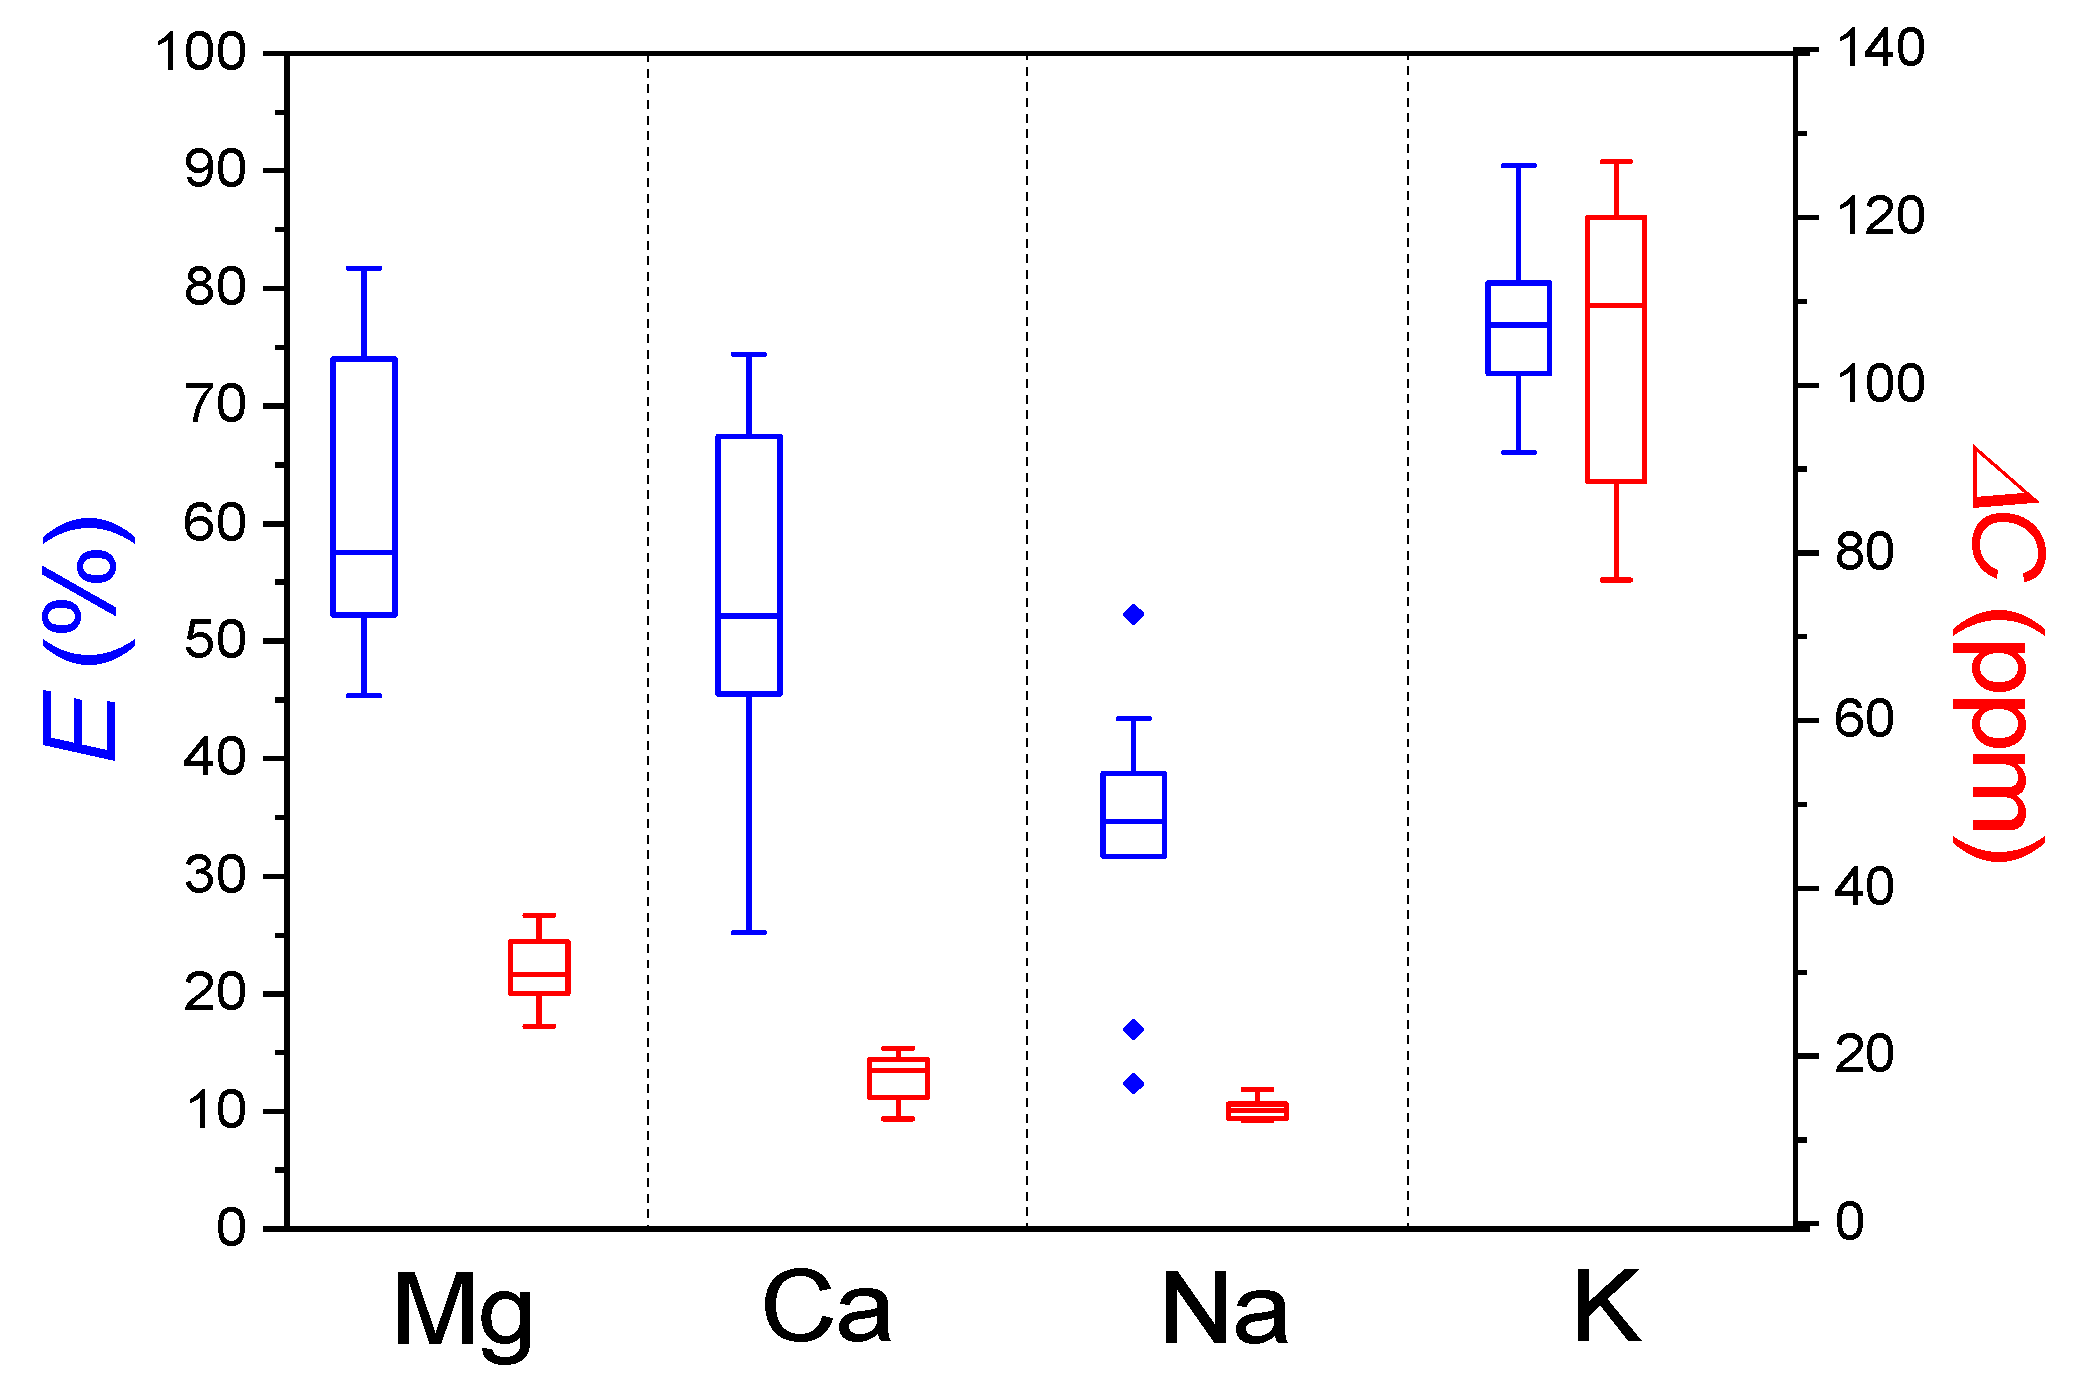
3.3. Extractability of Macronutrients
4. Conclusions
Author Contributions
Funding
Institutional Review Board Statement
Informed Consent Statement
Data Availability Statement
Acknowledgments
Conflicts of Interest
References
- Instituto Nacional de la Yerba Mate (INYM). Available online: http://inym.org.ar (accessed on 20 October 2023).
- Food and Agriculture Organization for the United Nations (FAO). FAOSTAT Database. Available online: http://www.fao.org/faostat/es/#home (accessed on 26 October 2023).
- Wrobel, K.; Urbina, E.M. Determination of total aluminum, chromium, copper, iron, manganese, and nickel and their fractions leached to the infusions of black tea, green tea, Hibiscus sabdariffa, and Ilex paraguariensis (mate) by ETAAAS. Biol. Trace Elem. Res. 2000, 78, 271–280. [Google Scholar] [CrossRef] [PubMed]
- Giulian, R.; Iochis Dos Santos, C.E.; de Moraes Shuneita, S.; Manfredi Da Silva, L.; Ferraz Días, H.; Yoneama, M.L. Elemental Characterization of Commercial Mate Tea Leaves (Ilex paraguariensis A. St.–Hil.) before and after Hot Water Infusion Using Ion Beam Techniques. J. Agric. Food Chem. 2007, 55, 741–746. [Google Scholar] [CrossRef] [PubMed]
- Malik, J.; Szakova, J.; Drabek, O.; Balik, J.; Kokoska, L. Determination of certain micro and macroelements in plant stimulants and their infusions. Food Chem. 2008, 111, 520–525. [Google Scholar] [CrossRef] [PubMed]
- Pozebon, D.; Dressler, V.L.; Alexandre Marcelo, M.C.; Charão de Oliveira, T.; Flores Ferrão, M. Toxic and nutrient elements in yerba mate (Ilex paraguariensis). Food Addit. Contam. Part B 2015, 8, 215–220. [Google Scholar] [CrossRef] [PubMed]
- Barbosa, J.Z.; Zambon, L.M.; Motta, A.C.V.; Wendling, I. Composition, Hot–Water Solubility of Elements and Nutritional Value of Fruits and leaves of yerba mate. Ciênc. Agrotec. 2015, 39, 593–603. [Google Scholar] [CrossRef]
- Vaccari Toppel, F.; Maccari Junior, A.; Vargas Motta, A.C.; Frigo, C.; Magri, E.; Zimmer Barbosa, J. Soil chemical attributes and their influence on elemental composition of yerba mate leaves. Floresta 2018, 48, 425–434. [Google Scholar] [CrossRef]
- Urruchua, F.C.; Fernández, M.A.; Jaworski, M.; Mendoza Zelis, P.; Olivelli, M.S.; Montes, M.L. Yerba mate waste: Transformation to magnetic composites for the adsorption of chemically diverse pollutants. J. Environ. Chem. Eng. 2023, 11, 110824. [Google Scholar] [CrossRef]
- Winefordner, J.D.; Gornushkin, I.B.; Correll, T.; Gibb, E.; Smith, B.W.; Omenetto, N. Comparing several atomic spectrometric methods to the super stars: Special emphasis on laser induced breakdown spectrometry, LIBS, a future super star. J. Anal. At. Spectrom. 2004, 19, 1061–1083. [Google Scholar] [CrossRef]
- Miziolek, A.W.; Palleschi, V.; Schechter, I. Laser–Induced Breakdown Spectroscopy (LIBS) Fundamentals and Applications; Cambridge University Press: New York, NY, USA, 2006. [Google Scholar]
- Hahn, D.W.; Omenetto, N. Laser–induced breakdown spectroscopy (LIBS), part II: Review of instrumental and methodological approaches to material analysis and applications to different fields. Appl. Spectrosc. 2012, 66, 347–419. [Google Scholar] [CrossRef] [PubMed]
- Santos, D., Jr.; Nunes, L.C.; Gustinelli Arantes de Carvalho, G.; da Silva Gomes, M.; Florêncio de Souza, P.; de Oliveira Leme, F.; Cofani dos Santos, L.G.; Krug, F.J. Laser-induced breakdown spectroscopy for analysis of plant materials: A review. Spectrochim. Acta Part B 2012, 71–72, 3–13. [Google Scholar] [CrossRef]
- Garcimuño, M.; Díaz Pace, D.M. Determinación de sodio en agua mediante espectroscopia de plasmas producidos por láser. Cienc. Docencia Tecnol. 2013, 47, 219–230. [Google Scholar]
- American Public Health Association. Standard Methods for the Examination of Water and Wastewater; American Public Health Association: Washington, DC, USA, 2012; pp. 16–17. [Google Scholar]
- NIST Atomic Spectra Database (Version 5.8). Available online: http://physics.nist.gov/PhysRefData (accessed on 26 October 2023).
- Zwicker, H. Evaluation of Plasma Parameters in Optically Thick Plasmas. In Plasma Diagnostics; Lochte Holtgreven, W., Ed.; North–Holland Publishing Company: Amsterdam, The Netherlands, 1968; pp. 214–248. [Google Scholar]
- Aragón, C.; Aguilera, J.A. CSigma graphs: A new approach for plasma characterization in laser–induced breakdown spectroscopy. J. Quant. Spectrosc. Radiat. Transf. 2014, 149, 90–102. [Google Scholar] [CrossRef]
- Konjević, N.; Ivković, M.; Jovićević, S. Spectroscopic diagnostics of laser–induced plasmas. Spectrochim. Acta Part B 2010, 65, 593–602. [Google Scholar] [CrossRef]
- Díaz Pace, D.M.; D’Angelo, C.A.; Garcimuño, M.; Bertuccelli, G. Quantitative analysis of Mg in natural water using LIBS technique. Opt. Pura Apl. 2011, 44, 719–729. [Google Scholar]

| Element | Ionization State | λ0 (Å) | Aji (108 s–1) | Ei (eV) | Ej (eV) | gi | gj |
|---|---|---|---|---|---|---|---|
| Mg | I | 2852.1 | 4.91 | 0.000 | 4.346 | 1 | 3 |
| II | 2795.5 | 2.60 | 0.000 | 4.434 | 2 | 4 | |
| II | 2802.7 | 2.57 | 0.000 | 4.442 | 2 | 2 | |
| Ca | II | 3933.7 | 1.47 | 0.000 | 3.151 | 2 | 4 |
| II | 3968.5 | 1.40 | 0.000 | 3.123 | 2 | 2 | |
| Na | I | 5889.9 | 0.61 | 0.000 | 2.104 | 2 | 4 |
| I | 5895.9 | 0.61 | 0.000 | 2.102 | 2 | 2 | |
| K | I | 7664.9 | 0.38 | 0.000 | 1.617 | 2 | 4 |
| I | 7699.0 | 0.37 | 0.000 | 1.610 | 2 | 2 |
| Element | E (%) | ΔC (ppm) |
|---|---|---|
| Mg | 56 ± 23 | 30 ± 5 |
| Ca | 51 ± 21 | 18 ± 4 |
| Na | 34 ± 6 | 13 ± 1 |
| K | 76 ± 8 | 115 ± 29 |
Disclaimer/Publisher’s Note: The statements, opinions and data contained in all publications are solely those of the individual author(s) and contributor(s) and not of MDPI and/or the editor(s). MDPI and/or the editor(s) disclaim responsibility for any injury to people or property resulting from any ideas, methods, instructions or products referred to in the content. |
© 2024 by the authors. Licensee MDPI, Basel, Switzerland. This article is an open access article distributed under the terms and conditions of the Creative Commons Attribution (CC BY) license (https://creativecommons.org/licenses/by/4.0/).
Share and Cite
Díaz Pace, D.; Molina, J.; Rodríguez, C.I. Rapid Assessment of Extractability of Macronutrients from Yerba Mate (Illex paraguariensis) Leaves Based on Laser-Induced Breakdown Spectroscopy. Chemosensors 2024, 12, 18. https://doi.org/10.3390/chemosensors12020018
Díaz Pace D, Molina J, Rodríguez CI. Rapid Assessment of Extractability of Macronutrients from Yerba Mate (Illex paraguariensis) Leaves Based on Laser-Induced Breakdown Spectroscopy. Chemosensors. 2024; 12(2):18. https://doi.org/10.3390/chemosensors12020018
Chicago/Turabian StyleDíaz Pace, Diego, Juan Molina, and Corina Iris Rodríguez. 2024. "Rapid Assessment of Extractability of Macronutrients from Yerba Mate (Illex paraguariensis) Leaves Based on Laser-Induced Breakdown Spectroscopy" Chemosensors 12, no. 2: 18. https://doi.org/10.3390/chemosensors12020018
APA StyleDíaz Pace, D., Molina, J., & Rodríguez, C. I. (2024). Rapid Assessment of Extractability of Macronutrients from Yerba Mate (Illex paraguariensis) Leaves Based on Laser-Induced Breakdown Spectroscopy. Chemosensors, 12(2), 18. https://doi.org/10.3390/chemosensors12020018