Article

The Influence of Core-Periphery Structure on Information Diffusion over Social Networks

by
Guiyuan Fu
1,2 and
Hejun Liang
3,*
1
School of Finance, Shanghai University of Finance and Economics, Shanghai 200433, China
2
Shanghai Key Laboratory of Financial Information Technology, Shanghai University of Finance and Economics, Shanghai 200433, China
3
College of Engineering Science and Technology, Shanghai Ocean University, Shanghai 201306, China
*
Author to whom correspondence should be addressed.
Mathematics 2025, 13(18), 3048; https://doi.org/10.3390/math13183048
Submission received: 4 August 2025 / Revised: 29 August 2025 / Accepted: 19 September 2025 / Published: 22 September 2025

Abstract

While core-periphery (CP) structures are a fundamental property of many social networks, their influence on information diffusion remains insufficiently understood, especially for complex contagions that require social reinforcement. To address this research gap, this paper investigates the role of core-periphery (CP) structure on information diffusion using the Maki-Thompson model. Both simple contagion and complex contagion scenarios are analyzed through extensive numerical simulations and theoretical analysis. Our results reveal several key insights. First, a stronger CP structure facilitates broader information dissemination compared to a weaker core-periphery structure. Second, strong CP networks are particularly vulnerable to targeted interventions; immunizing core nodes is highly effective at impeding diffusion, especially for simple and small-k complex contagions. Third, counterintuitively, CP structure significantly hinders the spread of complex contagions, requiring a higher critical threshold for a global outbreak compared to equivalent random networks. These findings can provide valuable insights into the nuanced role of network topology in shaping information propagation, highlighting that CP structure can both facilitate and hinder diffusion depending on contagion type.

1. Introduction

Information diffusion becomes a concerning public issue nowadays as the rapid and vast adoption of online social media, like Facebook, Twitter, Whatsapp, Weibo, Wechat, etc. For example during the outbreak of Covid-19, various information on the virus is widespread through the online social media platforms quickly, and has a significant impact on the whole society. Therefore, it is of great importance to investigate the process of information diffusion. There are lots of research trying to explore the mechanism underlying how information spreads over social network [1,2,3].
Up to now, a large body of research has demonstrated that network structure plays a crucial role in the process of information diffusion, with studies examining its influence from multiple scales. For example, Duffy et al. [4] experimentally explored the influence of network structure on financial contagion in interbank networks, and showed that contagions are more likely to occur in incomplete network structures than in complete ones. Montanari and Saberi [5] investigated the network structure favoring rapid spread of innovations, finding that diffusion is significantly slower on well-connected network structures dominated by long range links. In contrast, Bakshy et al. [6] argued that weak ties in the social network play a dominant role in the information diffusion online. Similarly, Qiao et al. in [7] demonstrated that scale-free network or the existence of hubs can facilitate knowledge diffusion better than other network structures, such as small-world network and regular network. Furthermore, an optimal network topology is presented in [8] based on link structure to increase spreading prevalence. Pan et al. in [9] further explored the interplay between network topology and spreading dynamics, showing that the degree distribution of an optimal network topology for spreading prevalence relies on the infection rate, where strong degree heterogeneity can facilitate the spreading only for small infection rate.
While the above studies focus primarily on macro-level features such as degree distribution and overall network connectivity, other research has examined diffusion dynamics from a meso-scale perspective. For example, Stegehuis et al. [10] analyzed epidemic spreading on networks with community structures and found that such structures can either facilitate or hinder the diffusion process, depending on their configuration. Similarly, Lin et al. [11] also investigated the community effect on information diffusion and demonstrated evident homophily in both actions and influence, as individuals within the same community tend to behave similarly and exert stronger mutual influence during the diffusion process.
Core-periphery (CP) is another typical mesoscale property of network structure. It is first formalized by Borgatti and Everett [12], and described by two qualitatively distinct components: densely connected nodes in the core component and loosely connected nodes in the periphery component. The core size is typically much smaller than the entire network [13]. CP structure appears widely in the real world networks, such as trade network [14], financial network [15], brain networks [16], transportation networks [17], as well as World Wide Web and social networks [18,19], etc. However, unlike the community structure, the role of CP structure in diffusion processes has not yet been extensively explored.
Most of the prior research has concentrated either on detecting core-periphery structure more efficiently [13,20,21,22,23] or on understanding how core-periphery structure can emergence [24,25,26]. More recently, some attentions have been paid to their impact on the dynamics on networks, such as cascading failure and information diffusion over networks. For example, Ref. [27] investigated the impact of CP structure on cascading failures in interdependent networks, and demonstrated that the networks with weak core-periphery structure will be more robust. In [28], the influence of CP network on Ising model was examined by numerical simulations, revealing that a strong core-periphery structure leads to an intermediate phase and a double phase transition, the nature of which depends on whether the connections between the core and periphery nodes scale sub-linearly or linearly with the network size. Similarly, Ref. [29] explored the dynamics of epidemics over weighted core-periphery networks and derived the upper bound of critical threshold for epidemic spreading, but they did not further indicate the influence of core-periphery structure on epidemic prevalence. These works reveal that CP structure can significantly alter the robustness and dynamical behavior of networks.
Overall, despite these advances, there are still relatively few work into the influence of CP structure on the diffusion dynamics, and the specific role of CP structure in shaping information propagation over networks remained insufficiently understood. There are still several gaps to be addressed.
Firstly, existing studies predominantly considered the scenario of simple contagion, which required a single exposure for adoption. However, empirical evidence [30] indicated that many real-world behaviors spread through complex contagion, in which adoption requires multiple exposures due to social reinforcement. Therefore, it is necessary to further examine the impact of CP structure under different contagion scenarios, including both simple and complex contagion.
Secondly, most existing studies employed epidemic models like SIS in [29] to investigate the diffusion dynamics over networks, while the impact of CP periphery structure on diffusion dynamics under Maki–Thompson (MT) model [31] is still lacking. MT model, a representative rumor spreading model, differs from epidemic models in the removal mechanism [32], leading to different dynamic behavior. MT model assumes that a spreader ceases spreading only when contacting another spreader or stifler, whereas in epidemic models an infected individual can recover spontaneously at a given recovering rate. Consequently, MT model is generally much more vulnerable to the network structure compared to epidemic model [32]. Therefore, it would make the investigation of CP effects particularly relevant.
In order to bridge the aforementioned gaps, this paper would focus on the role of core-periphery structure playing in the process of information diffusion within the framework of Maki–Thompson model, from both simple contagion and complex contagion perspectives. To this end, a tunable CP network is constructed to generate networks with different strength of CP structure. We then analyze the information diffusion dynamics across these networks with different strength of CP structure, and further examine the impact of CP structure on information intervention under different intervention strategies.
The remainder of this paper is organized as follows. Section 2 introduces the construction of networks with different strength of core-periphery structure, and provides a description of Maki-Thompson model. Section 3 and Section 4 present the main results on the influence of core-periphery structure on information diffusion and information intervention. Finally, some discussions and conclusions are drawn in Section 5.

2. Model Definition

2.1. Core-Periphery Network

Consider an unweighted and undirected network G composed of N nodes and M edges, the adjacency matrix is denoted by A = ( A i j ) N × N , if there exists a link between node i , j , then A i j = 1 , otherwise A i j = 0. According to [12], the core-periphery network can be defined as follows.
Definition 1
([12]). A network G is a core-periphery (CP) network, if there exists a set of core agents C N and periphery agents P = N C such that:
(a) 
  i , j C , A i j = 1 , and i , j P , A i j = 0 ;
(b) 
i C , j P so that A i j = 1 , and j P , i C so that A i j = 1 .
An idealized core-periphery network is the network where each agent in the core C is linked to all agents in the periphery P, i.e., i C and j P , there exists A i j = 1 . Figure 1 is an example of idealized core-periphery network with network size N = 12 , where there are 3 core nodes in green and 9 periphery nodes in blue. We can measure the degree of core-periphery of a given network by the degree to which the given network is similar to the corresponding ideal network.
Denote by Δ = ( δ i j ) the corresponding idealized CP network for network G, thus the strength of Core-periphery structure in network A can be characterized by the similarity between A and Δ , as is shown in Equation (1).
s = i , j A i , j δ i , j
δ i , j = 1 , i f i C o r j C 0 , o t h e r w i s e
It can be seen that Equation (1) calculates the number of the same links between actual network A and the idealized CP network Δ . Essentially, the approach applies an unnormalized Pearson correlation to the matrix. In order to normalized the similarity in the scale [ 0 , 1 ] , as outlined in [12], the Pearson correlation coefficient is employed for A and Δ to gauge the strength of the core-periphery structure, ρ c p . The larger ρ c p , the stronger core-periphery structure. When the network A is an idealized core-periphery structure, ρ c p reaches its maximum 1.
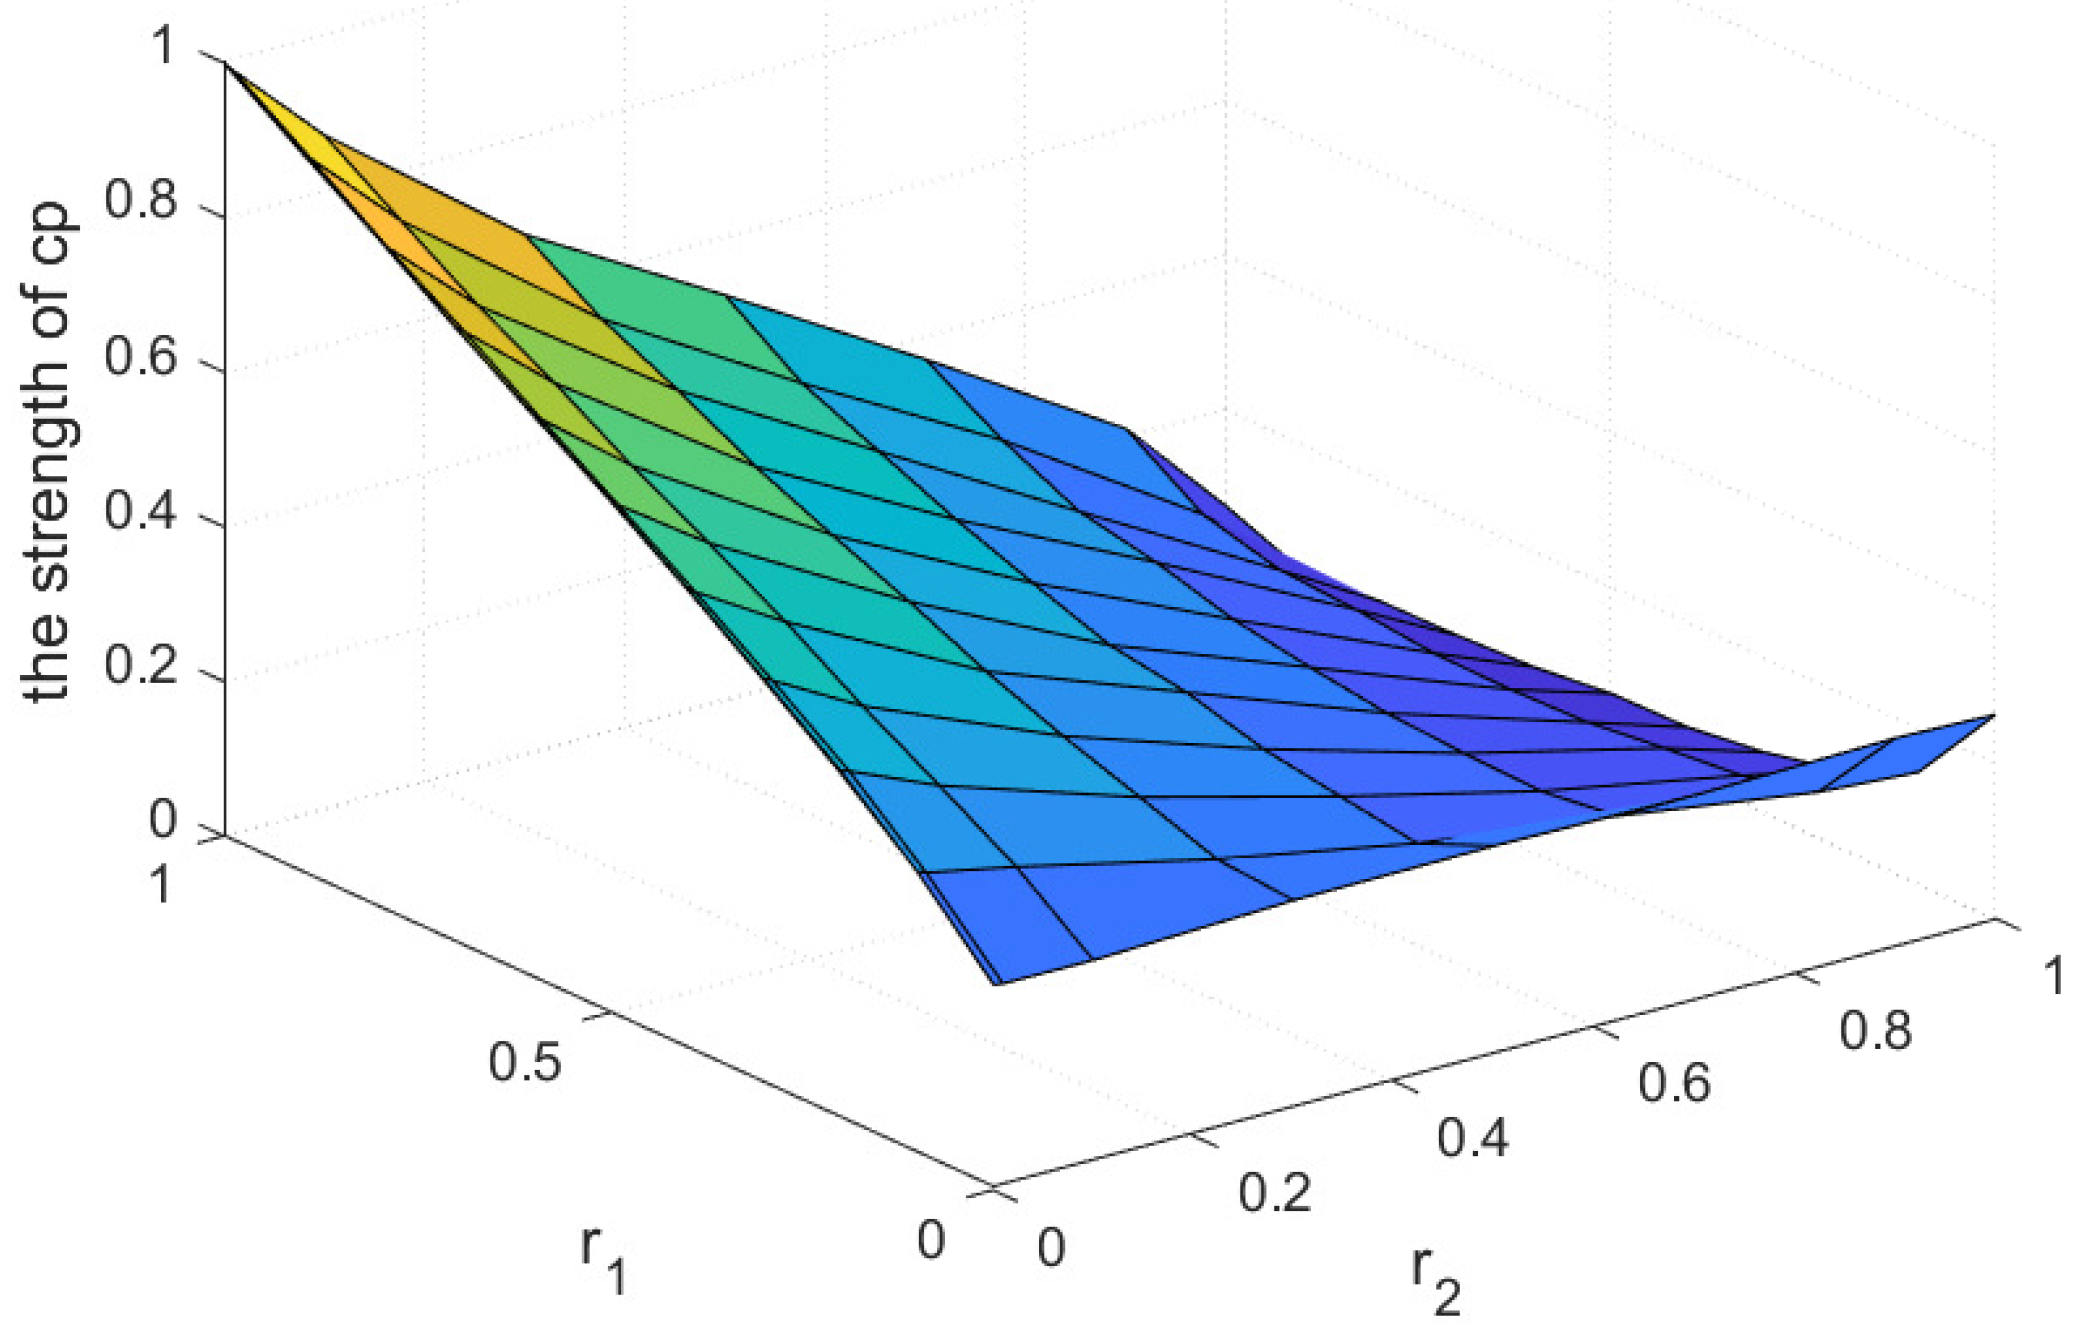
In order to establish a core-periphery network with tuneable parameters, we assume that any two core nodes will connect with each other with probability p c c , while the core node and periphery node would be connected with p c p and periphery-periphery nodes will be connected with p p p , respectively. The network will exhibit core-periphery structure if p c c > p c p > p p p . To satisfy such condition, we thus assume p c p = r 1 p c c , and p p p = r 2 p c p , where r 1 , r 2 [ 0 , 1 ] . We will further investigate the relationship between the strength of core-periphery of the network and r 1 and r 2 . Consider the network size N = 100 , the fraction of core nodes as 0.2 , the connectivity probability p c c = 1 , then the strength of core-periphery ρ c p with different r 1 , r 2 is shown in Figure 2. It can be seen that if r 2 is fixed, the strength of core-periphery increases as r 1 increases, especially when r 2 is relatively small. Therefore we can easily tune r 1 and r 2 to modify the strength of core-periphery of the networks. It is worth to note that experiments involving various fractions of core nodes were conducted, and these experiments yielded similar results.

2.2. Maki–Thompson Model

In this paper we consider the information diffusion over social network based on Maki-Thompson (MT) model, which is a variant of the original rumor model [33]. Like epidemic model, individuals in MT model will be classified into three compartments: ignorant (I), spreader (S) and stifler (R), where ignorant is the individual who does not know the information, spreader is the individual who knows the information and would like to actively spread it, while stifler is the individual who knows the information but is not longer spreading it. The contagion process evolves through interactions between individuals by the following rules: (i) if a spreader contacts an ignorant individual, the ignorant will become a spreader with a probability β , (ii) if a spreader contacts either a stifler or another spreader, the spreader will become a stifler with a probability μ . Thus there are three types of interactions that can be happened:
S + I β 2 S S + S μ S + R S + R μ 2 R
It is worth to note that although the rumor spreading models share mathematical similarities with epidemic models such as the SIR family, their removal mechanism is different [32]. In the rumor model such as MT model, removal is driven by the directed contact with informed individuals, i.e., a spreader can become a stifler only after contacting another spreader or stifler. On the contrary, epidemic models adopt a spontaneous mechanism, i.e., an infected individual can recover at a given rate, independent of contact.
As is shown in [34], MT model in the homogenous mixed population will always spread to a large proportion as long as the ratio τ = β / μ > 0 . As for the heterogenous network, the information will go viral over the network based on MT model as long as β / μ is larger than a threshold τ c . Theoretical analysis for the dynamics of MT model over connected network is presented in Appendix A.
Most of the available research on information diffusion consider the process of simple contagion. However, empirical studies indicate people spread information often by complex contagion [35,36,37], where multiple successful exposures are required before the individual adopts the information. Therefore, we will look into the influence of core-periphery structure on the dynamics of information diffusion based on MT model from both simple contagion and complex contagion.

3. Information Diffusion with Different Core-Periphery Structure

In this section we will analyze the influence of core-periphery structure on information diffusion from the perspective of the relationship between different core-periphery structure and the final percentage of the population adopting the information. To this end, different CP networks will be constructed by tuning the parameters r 1 and r 2 and fixing the other parameters based on the description in the previous section. We consider the network size N = 1000 , and assume the percentage of core nodes is 20%, i.e., there are 200 core individuals, while the connectivity probability of core-core nodes p c c = 0.8 . Inspired by Figure 2, the parameters r 1 and r 2 would be chosen as 1 and 1 × 10 4 , 1 and 1, 0.5 and 0.5 , 1 × 10 2 and 1 × 10 2 , 1 × 10 2 and 1, 0.05 and 0.05 , respectively. So that the strength of core-periphery for these networks can vary from small to large. The statistics for these networks is shown in Table 1, where k is the average degree, l is the average shortest path length and c c is the clustering coefficient.
In what follows, we will present the results of information diffusion over the networks with CP structure shown in Table 1 through numerical simulations, considering both simple contagion process and complex contagion process. Without loss of generality, we assume μ = 0.05 and the initial number of spreaders is 3, which are chosen randomly from the whole population. The detailed parameters used are provided in Table 2, and the methodology for implementing the numerical simulations is described in Appendix C. All the results are obtained through 100 independent realizations.

3.1. Simple Contagion Process

Simple contagion in MT model means that only one successful interaction between ignorant individual and spreader is required before the ignorant can be transferred to a spreader. As is shown in Appendix A, based on MT model as the ratio τ = β μ is large enough, the information will go virus among the population, i.e., all of the individuals will finally become stiflers. Thus in this subsection we will analyze the influence of core-periphery with different ratio τ . We assume the initial number of seed is 3, which are randomly selected from the whole population. Figure 3, Figure 4 and Figure 5 are the numerical simulation results for the simple contagion.
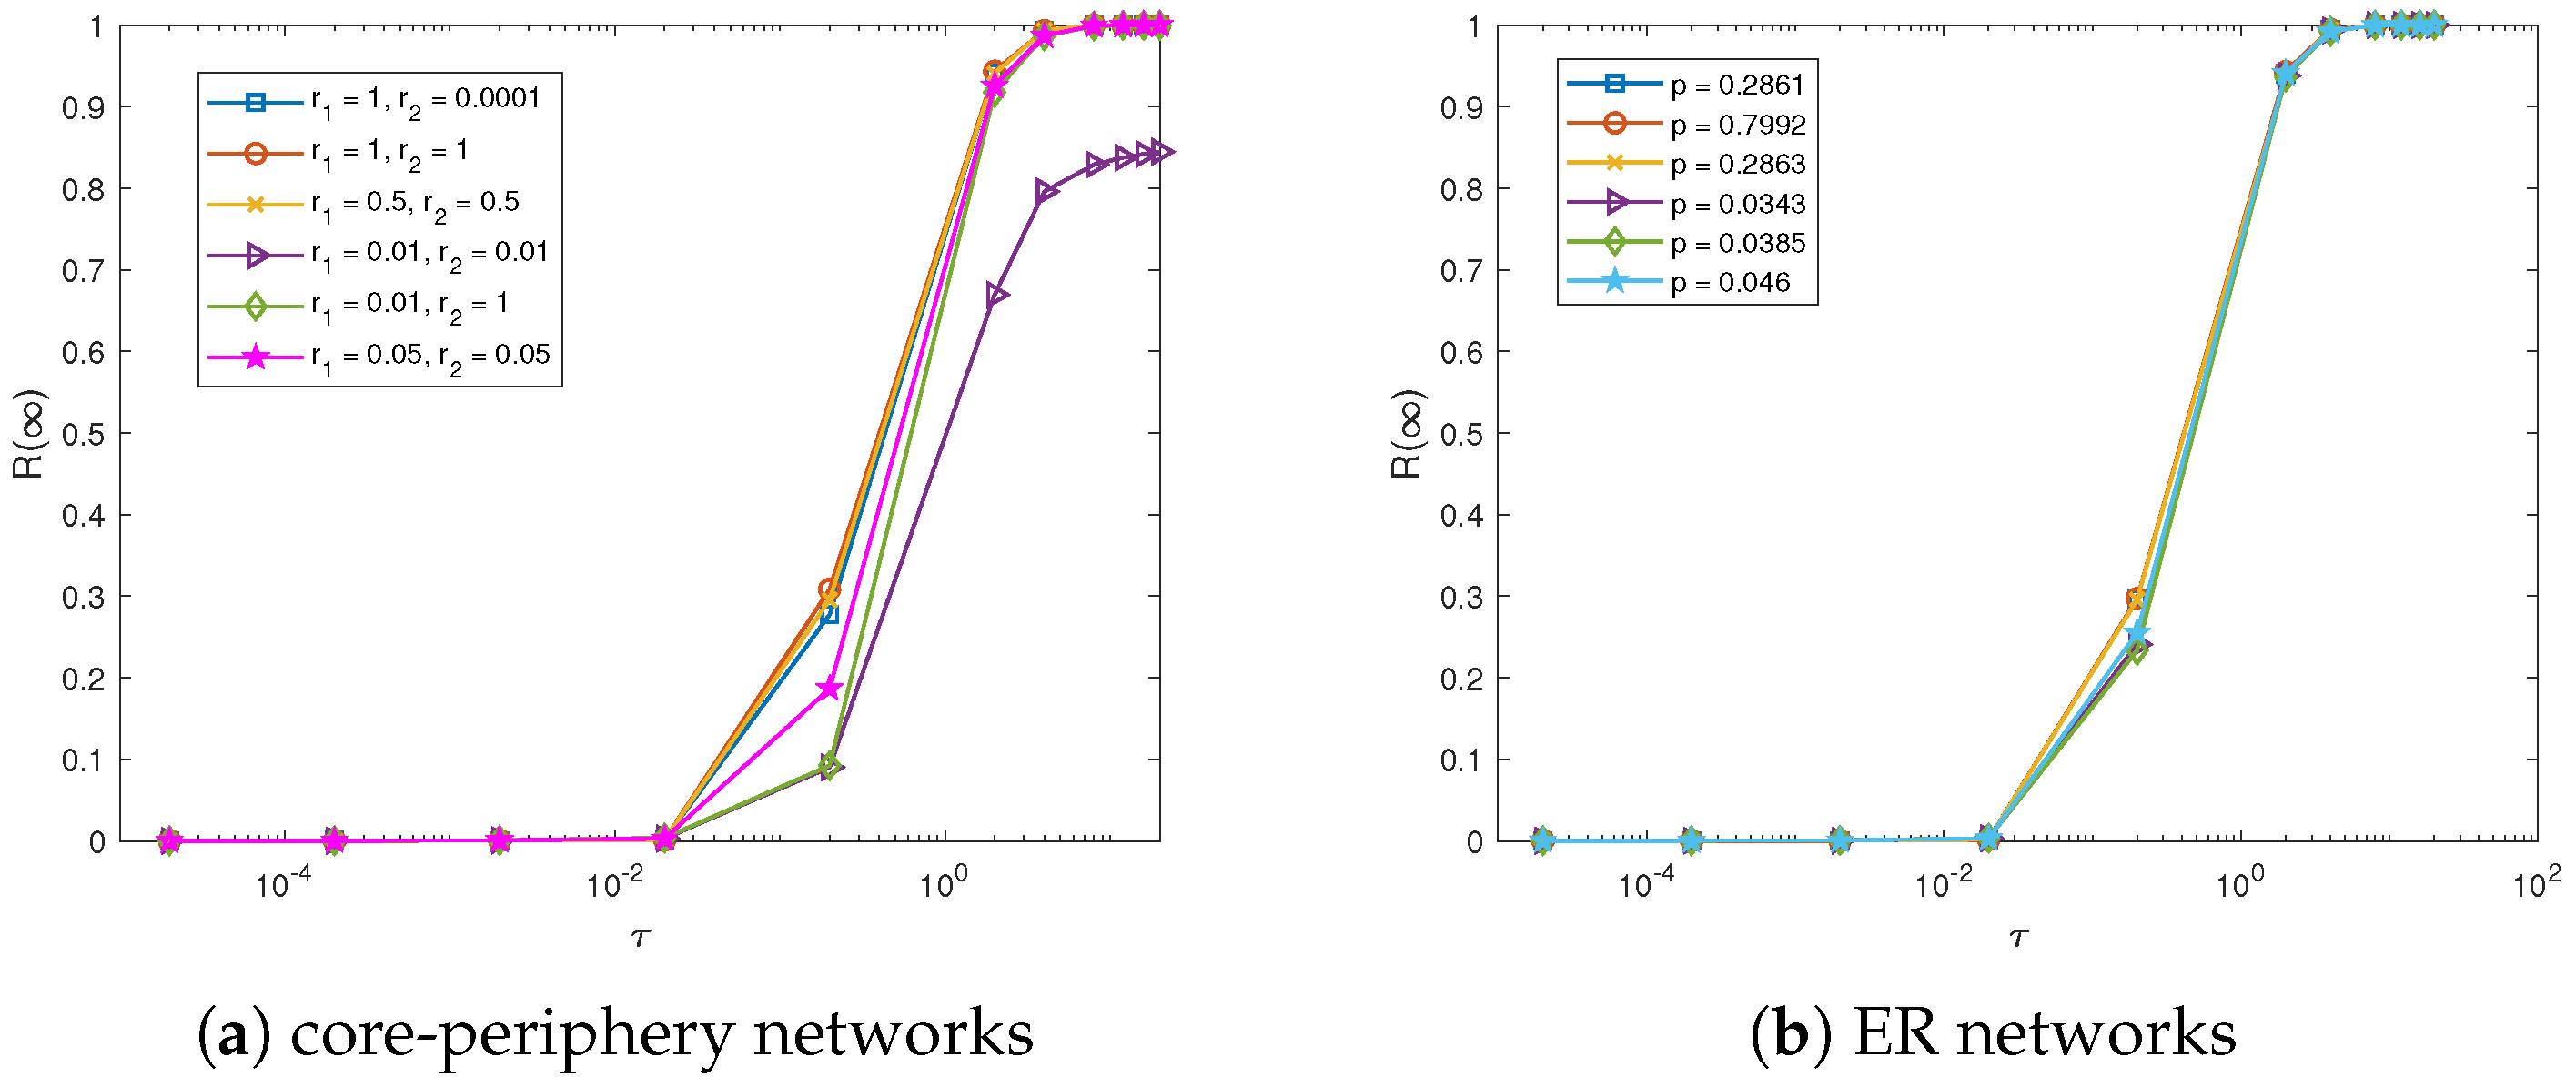
Figure 3 is the final percentage of stiflers with different ratio τ over the networks in Table 1. As can be seen in Figure 3a, the final percentage of stiflers is almost 0 when τ is small, and then increases quickly until it approaches its stable value when τ is larger than a threshold value τ c . The threshold value τ c is almost the same, about 0.02, for different core-periphery strength, which indicates the core-periphery structure has little impact on the threshold value τ c in this case. But the value of final percentage of stiflers is different under different core-periphery structure. It can be seen in Figure 3a that R ( ) increases much slower than others, when r 1 = 0.01 and r 2 = 0.01 , and its final percentage of R ( ) is also much smaller than others. That is partly due to the fact that the network is quite sparse when r 1 = 0.01 and r 2 = 0.01 and the average length of the path is relative large compared with other networks. Since according to Figure 2, the strength of core-periphery structure for r 1 = 0.01 and r 2 = 0.01 is much larger than that for r 1 = 1 and r 2 = 1 , while the final percentage of stiflers for r 1 = 1 and r 2 = 1 still approaches 1.
In order to further demonstrate the influence of core-periphery structure, we also compare with the corresponding results over ER random networks, as is shown in Figure 3b. By the corresponding ER random networks, it is actually zero order null model of the corresponding CP network, i.e., the average degree of the network is reserved, while every two nodes are connected with a predefined probability p = 2 m n ( n 1 ) , where m and n are the number of links and the number of nodes in the CP network, respectively. Obviously p can be regarded as the network density. Thus in this paper we just assume p as the network density of the CP network.
It is obvious from Figure 3b that the final percentage of the stiflers keeps almost the same with different ER random networks, and the shape is quite similar to cases when the strength of core-periphery is relatively large. In addition, we can also see in the Figure 3 that the final percentage of stiflers R ( ) will converge to stable level when τ is larger than about 8 for all of CP networks, which is quite the same for random networks. Therefore, it can be indicated that the structure of core-periphery has little impact on the dynamics of information diffusion for simple contagion in this case.
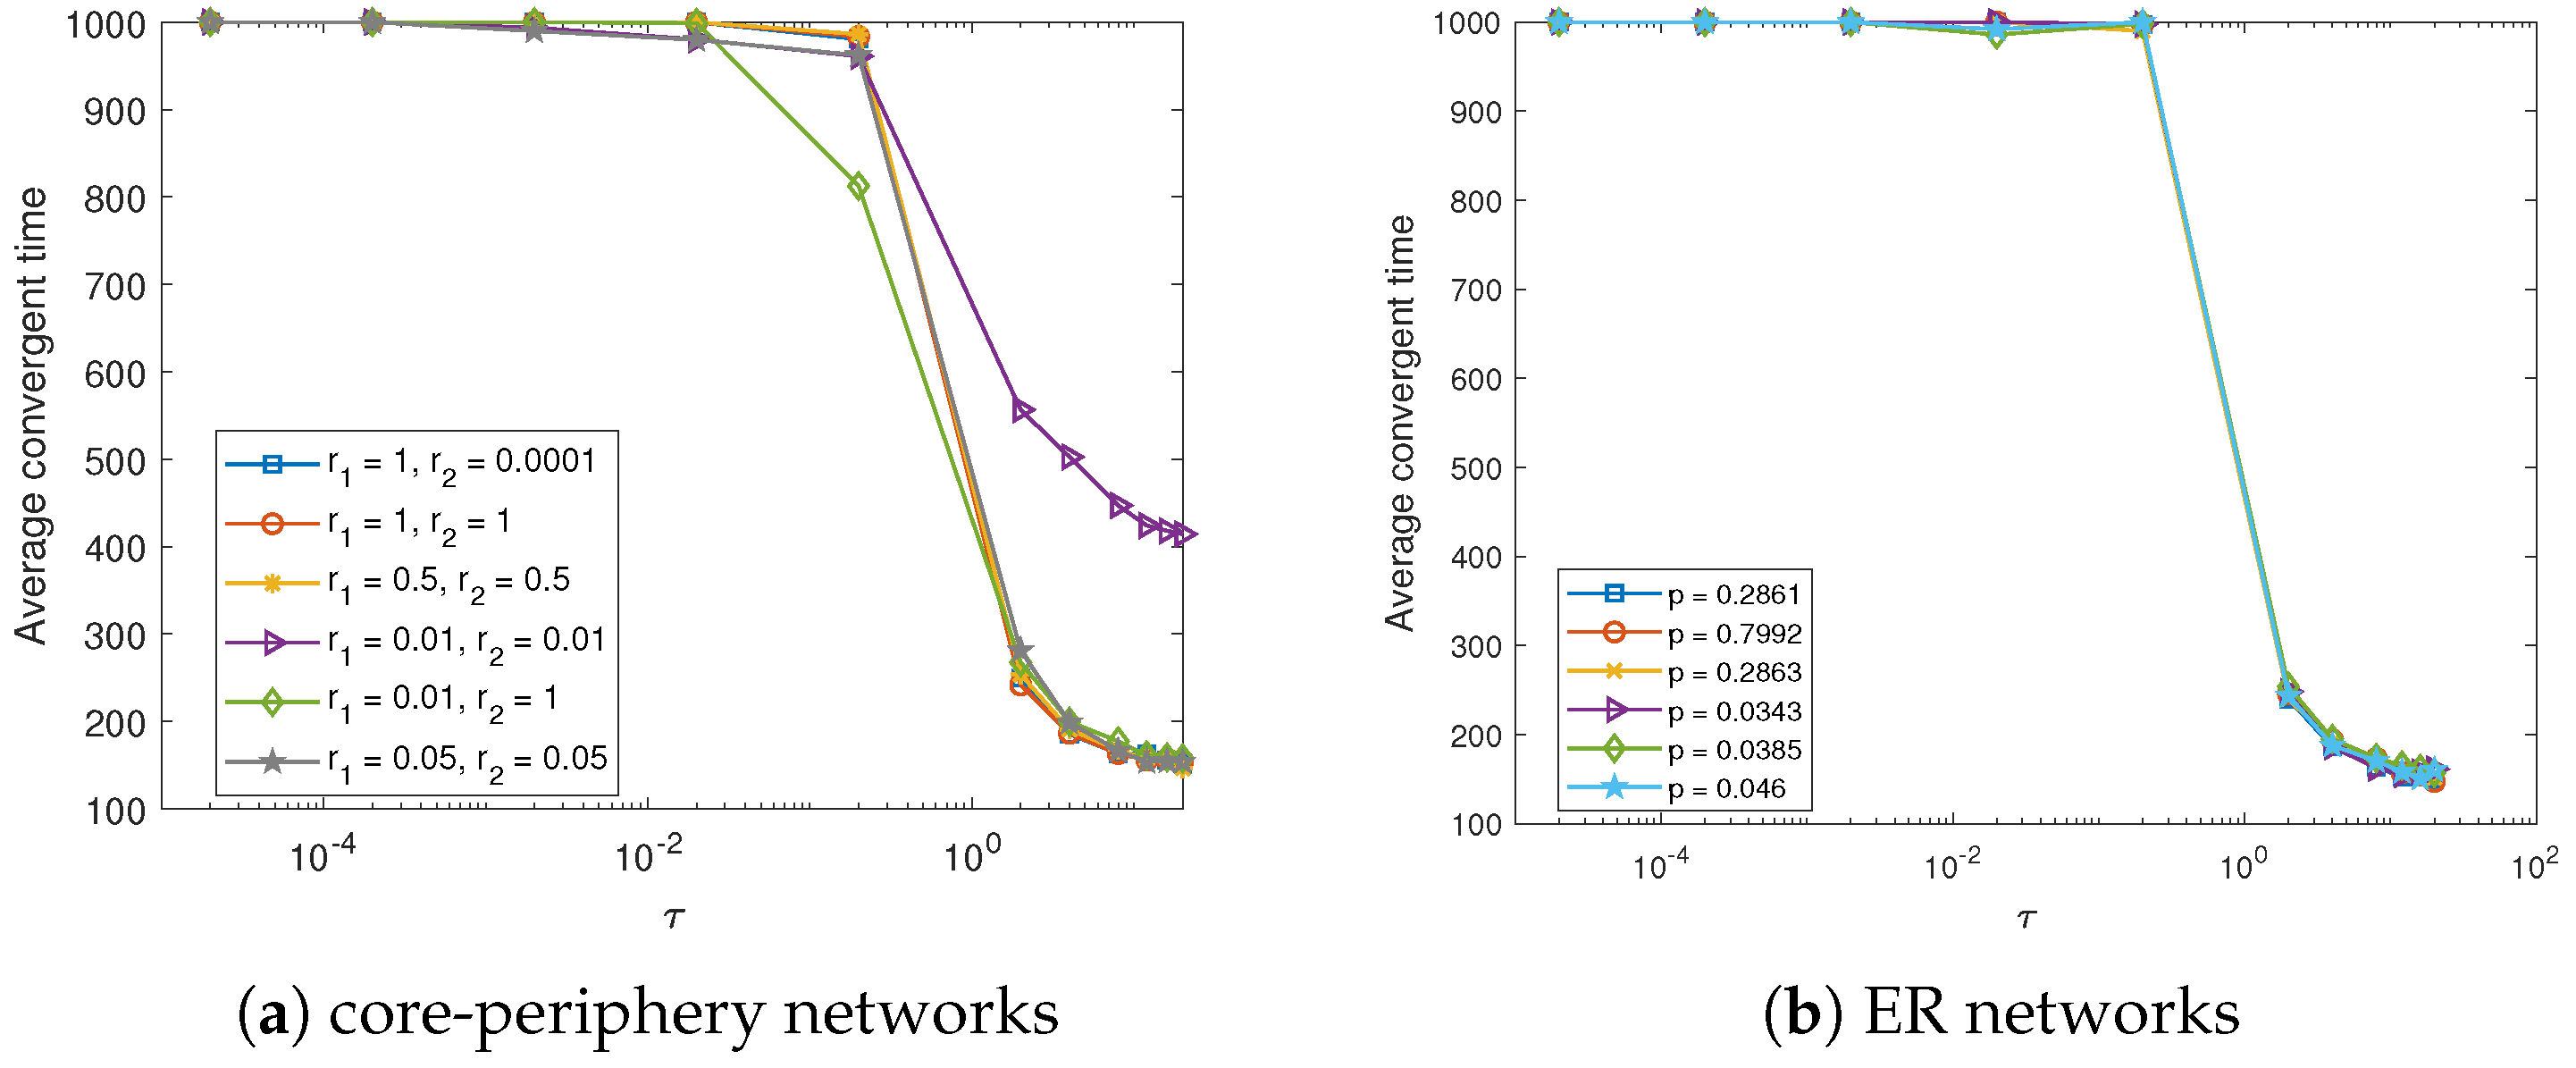
The convergence speed is also considered under different strength of CP structure in Figure 4. According to the theoretical analysis in the Appendix A, it is known that when the spreader is extinct, the population will reach a stable equilibrium. Thus the convergent time can refer to the number of time steps it takes until either the number of spreader is zero or it reaches the maximum number of time steps. It can be seen from Figure 4 that for both the core-periphery networks and ER random network the average convergence time decrease sharply when τ is near τ c . Specifically, for the CP networks it makes little difference among different strength of core-periphery structure except the case when r 1 = 0.01 , r 2 = 0.01 , whose average convergence time is much larger than others. At the meanwhile, the average convergence time exhibits the same trend for all the corresponding ER random networks. These results coincide with that of the final percentage of stiflers. Thus it can further confirm that it makes no difference for the dynamics of information diffusion in this scenario by core-periphery structure.

3.2. Complex Contagion Process

Inspired by the empirical studies [30,38,39], which show that the process of information diffusion exhibits complex contagion, thus we will further look into the influence of core-periphery structure on the dynamics of information diffusion in the scenario of complex contagion. By complex contagion in MT model, it means multiple successful interactions between ignorant individual and spreader are required before the ignorant can switch to a spreader. In what follows we denote k-complex contagion where k is the required number of successful interactions. When k = 1 , it becomes simple contagion. In this paper we will consider the cases when k = 2 , 3 , 4 respectively.
Before we demonstrate the results through numerical simulations, a proposition would be proposed based on heterogeneous mean-field theory.
Proposition 1.
Consider a complex contagion process k > 1 on a core–periphery (CP) network. Let the threshold value τ c = β μ , then the critical threshold on a CP network, τ c C P , satisfies
τ c C P > τ c E R
where τ c E R is the corresponding threshold for the equivalent Erdős–Rényi (ER) network with the same average degree.
Regarding the proof of the proposition, please refer to Appendix B.
In what follows, numerical simulations will be carried out to further verify Proposition 1. Likewise, we will investigate the relationship between final percentage of stiflers and the threshold value τ under different strength of core-periphery structure, as well as the convergence speed.
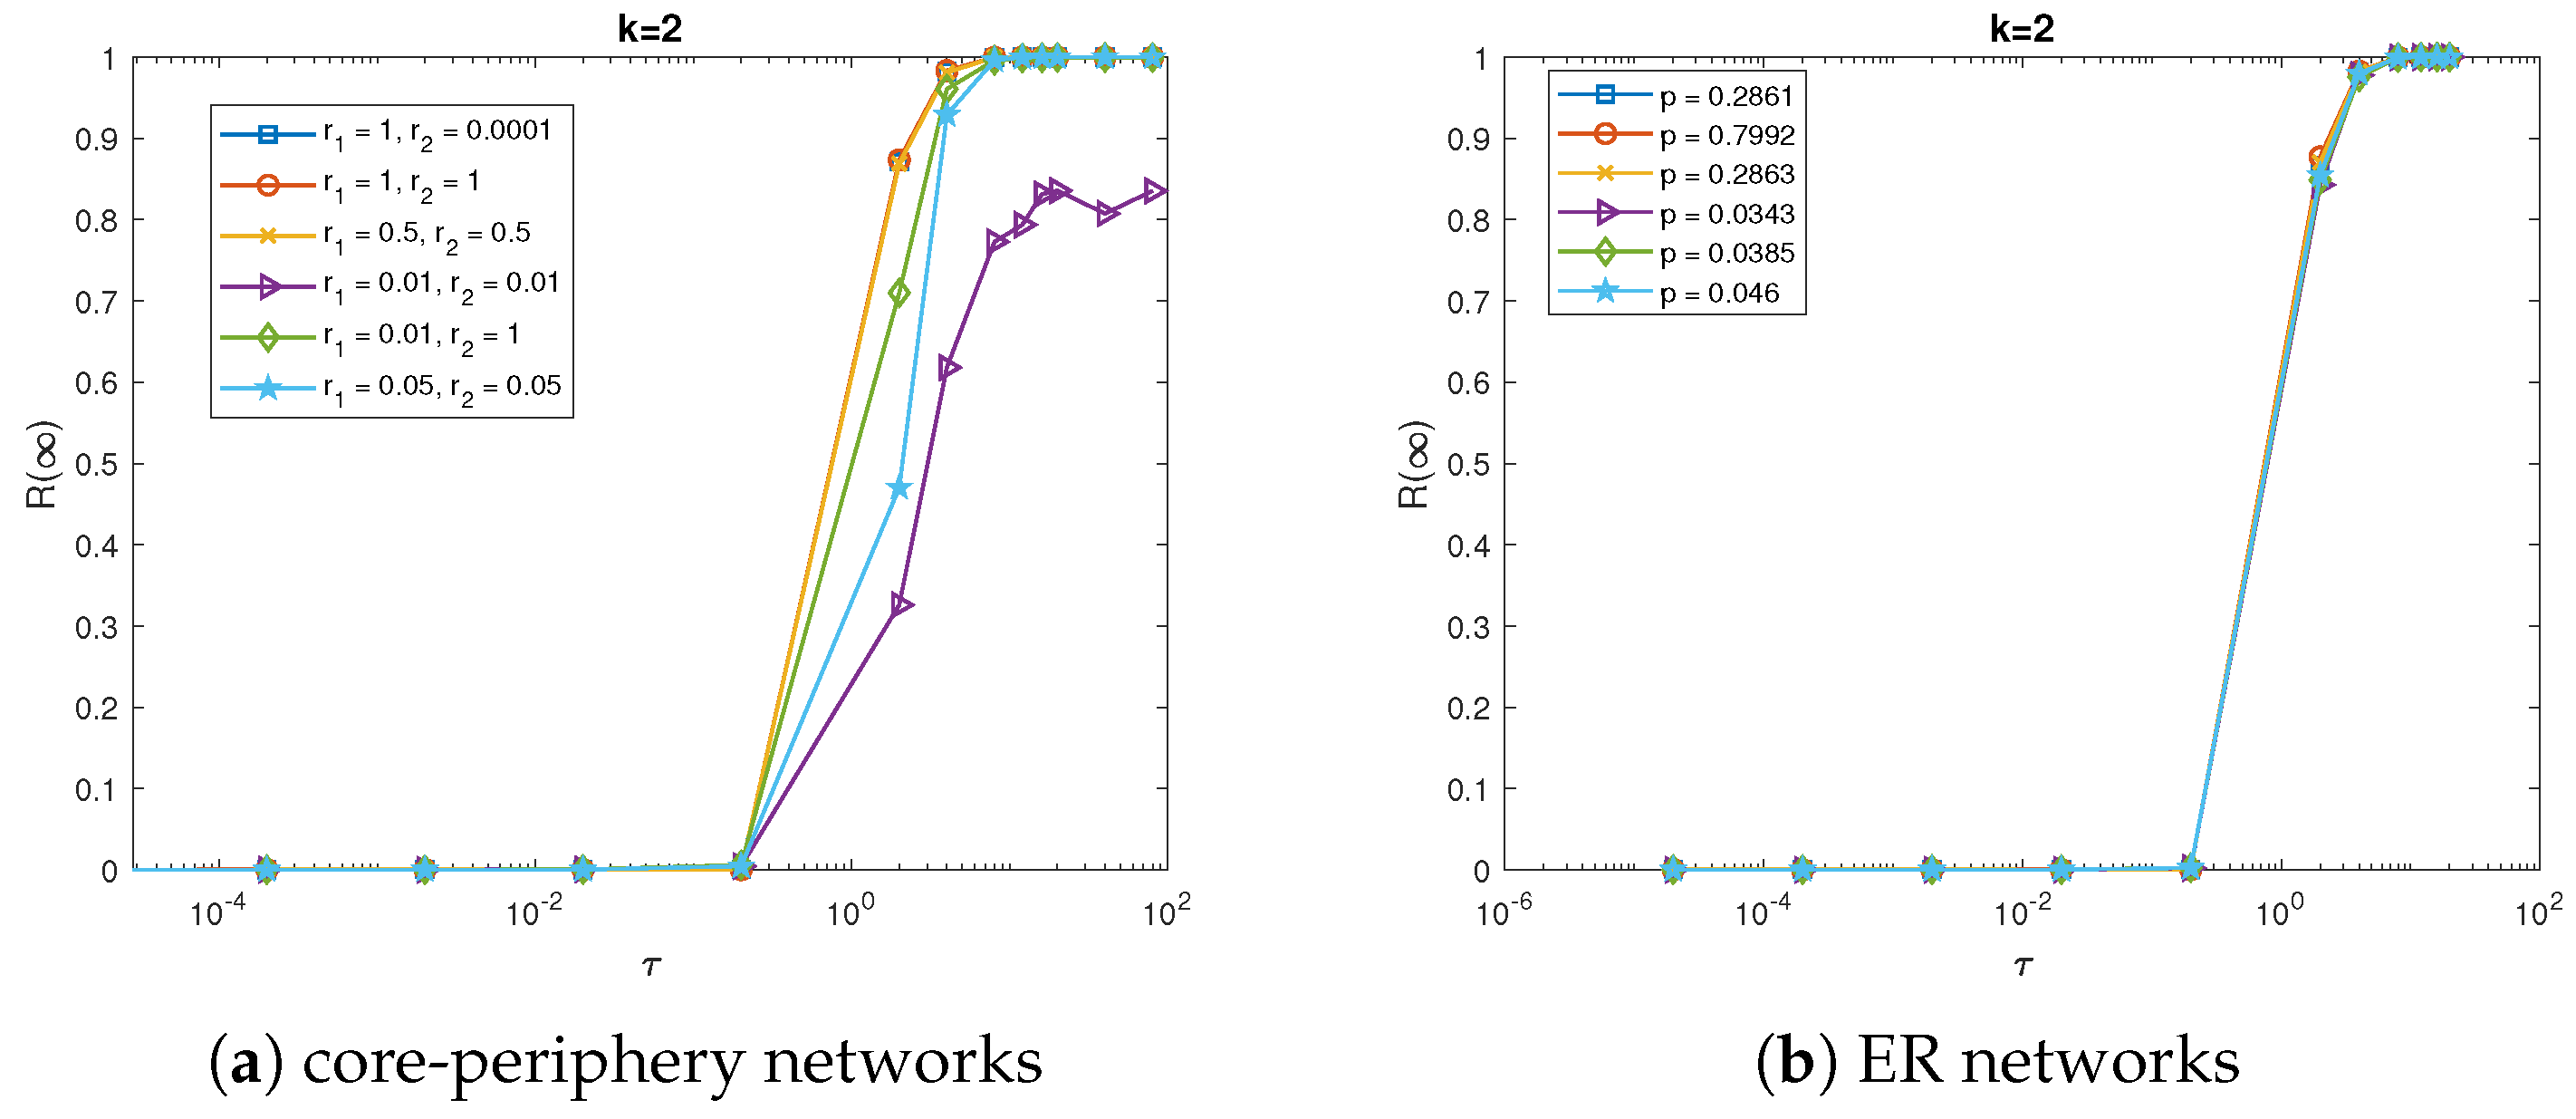
Figure 5 shows that the final percentage of stiflers increases with large τ until it reaches its stable value over different CP networks when k = 2 . It can be seen from Figure 5a that there is also a phase transition which occurs at the critical threshold value τ c = 0.2 in the simulation results for all the CP networks. Thus it can be indicated that the CP structure has no impact on the critical threshold value in this complex contagion. As is the same with simple contagion, the final percentage of stiflers varies with τ in almost the same way for different CP networks except the network with r 1 = 0.01 , r 2 = 0.01 , whose R ( ) is much smaller. That is because the network is much sparser and its average shortest path length is much larger. Likewise, we also compare the results with the corresponding ER random networks, shown in Figure 5b. It can be seen that the final percentage of stiflers increases with large τ on all different ER random networks in the same way, which is a little bit different from that on CP networks. It can be partly due to the fact that there is not much difference for the average shortest path length among all the ER random networks.
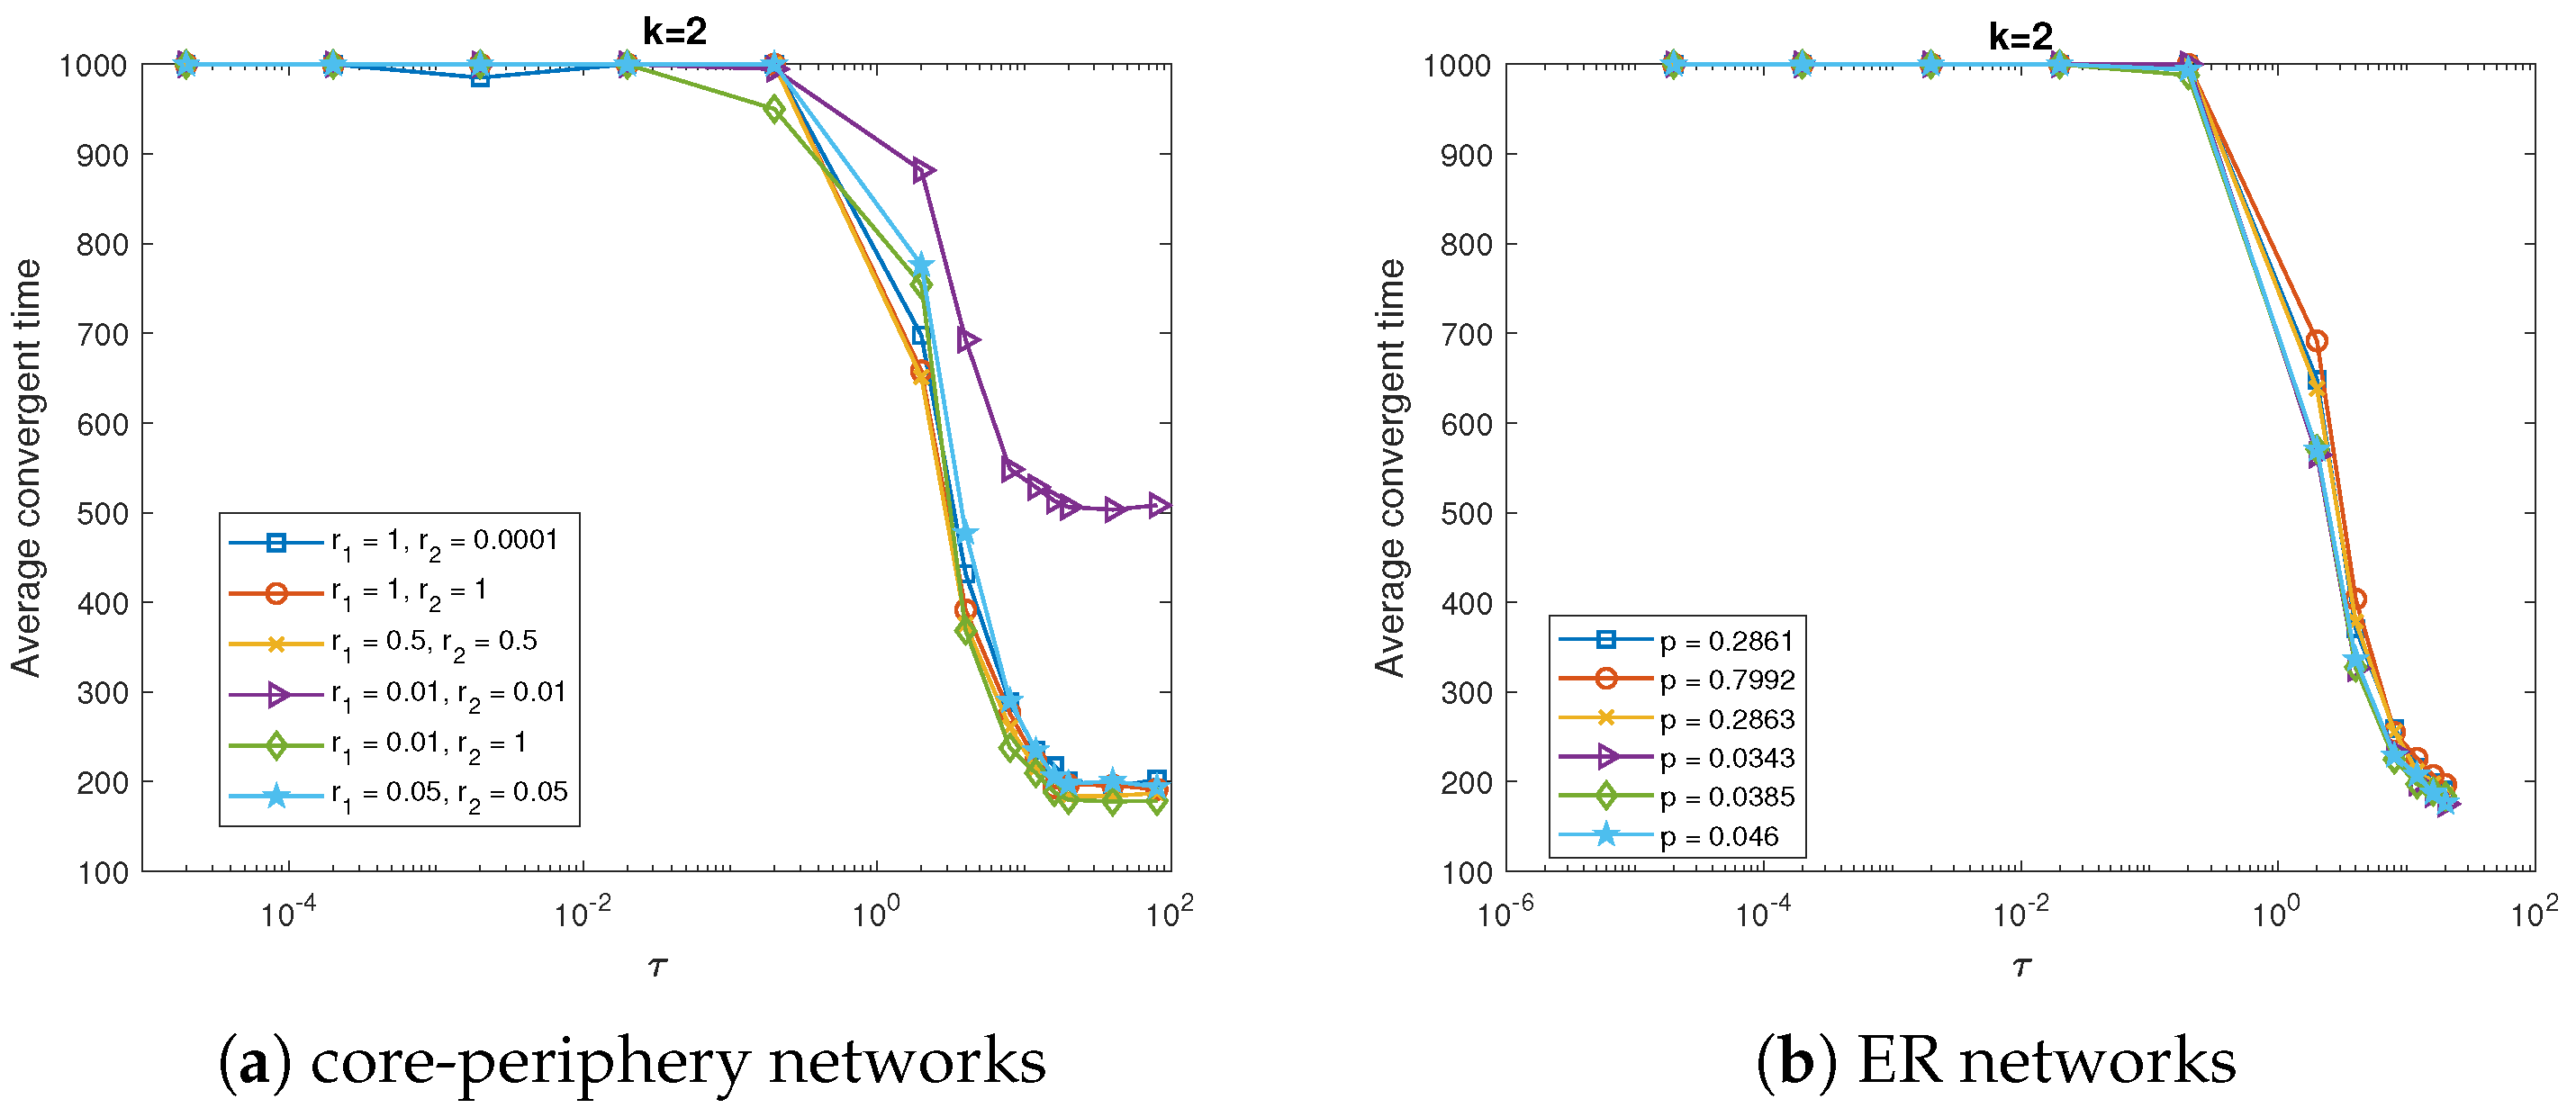
Figure 6 is the average convergence time for both the CP networks and the corresponding ER networks. It can be found that the shapes are quite the same with simple contagion. It further implies that the dynamics of information diffusion is almost unaffected by the structure of core-periphery.
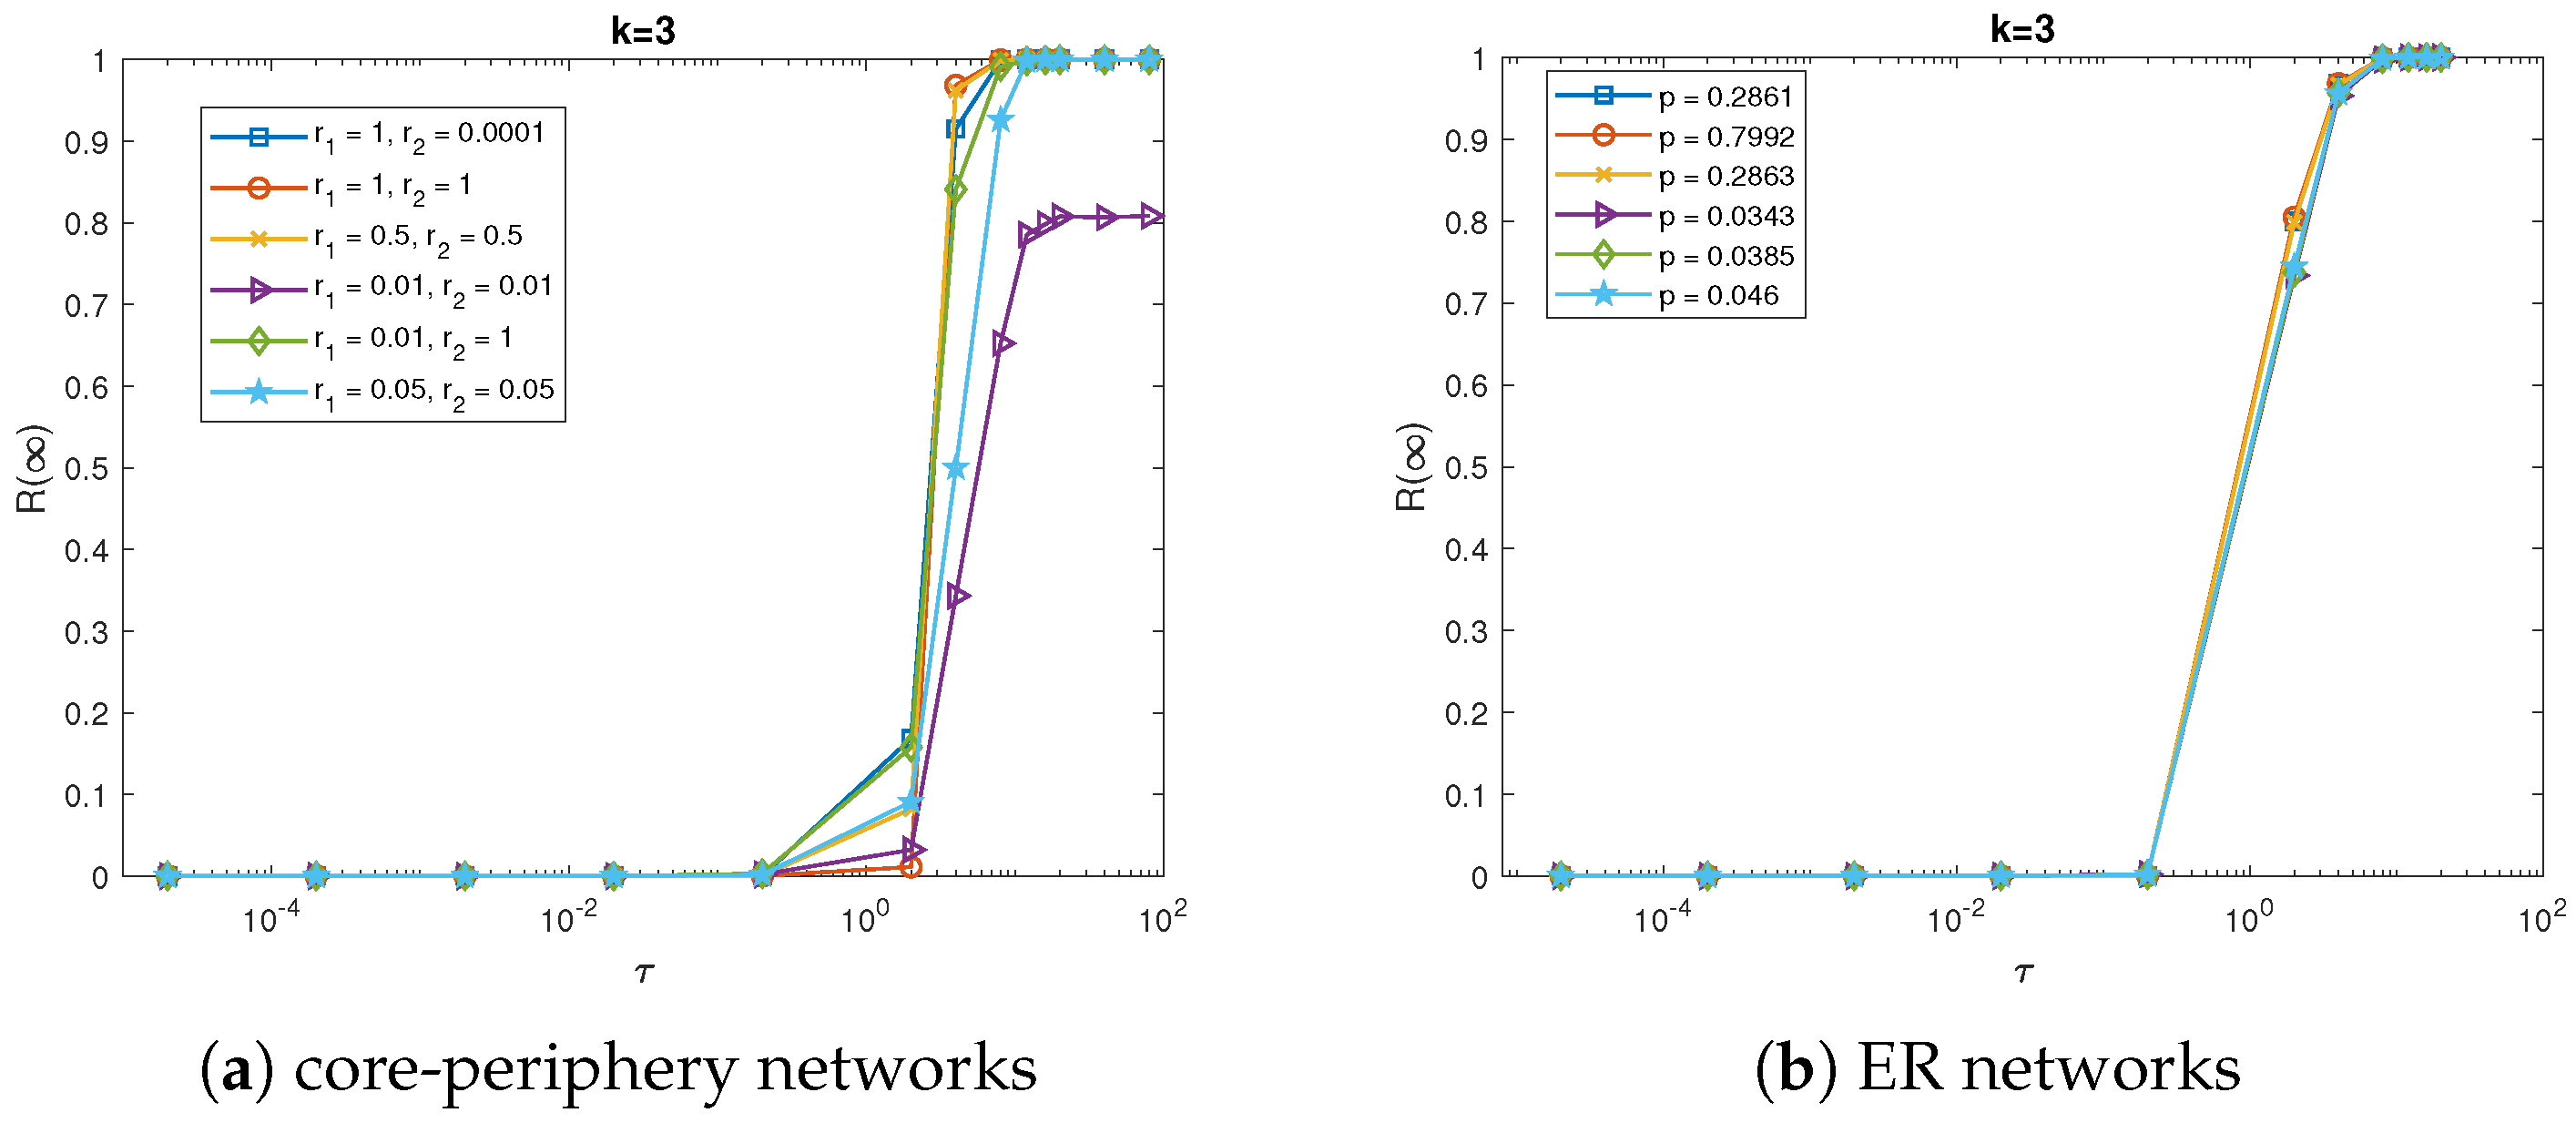
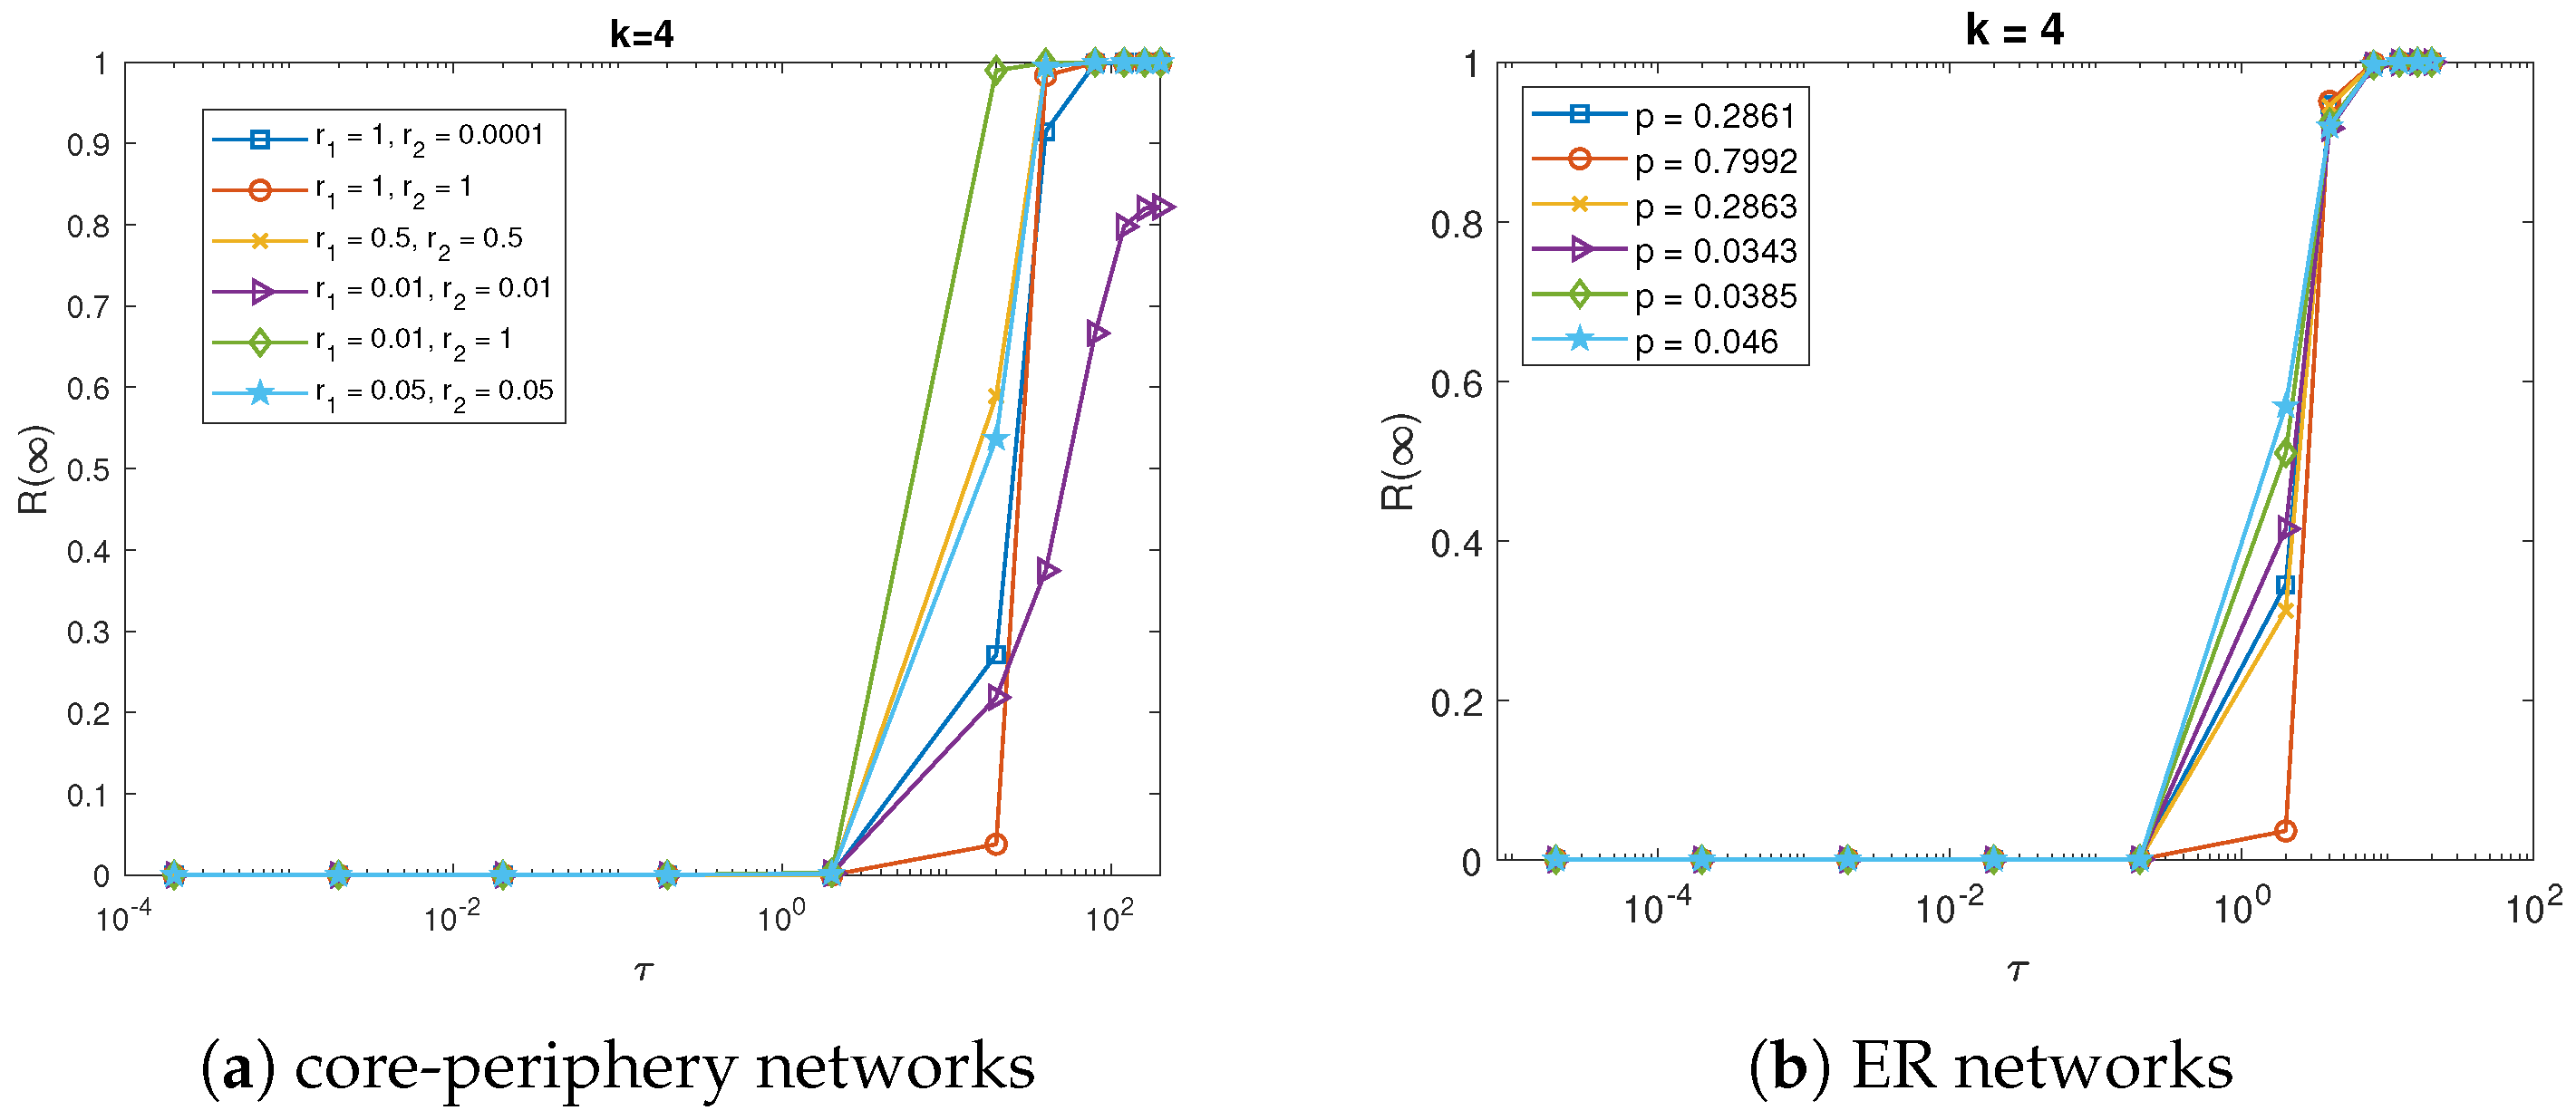
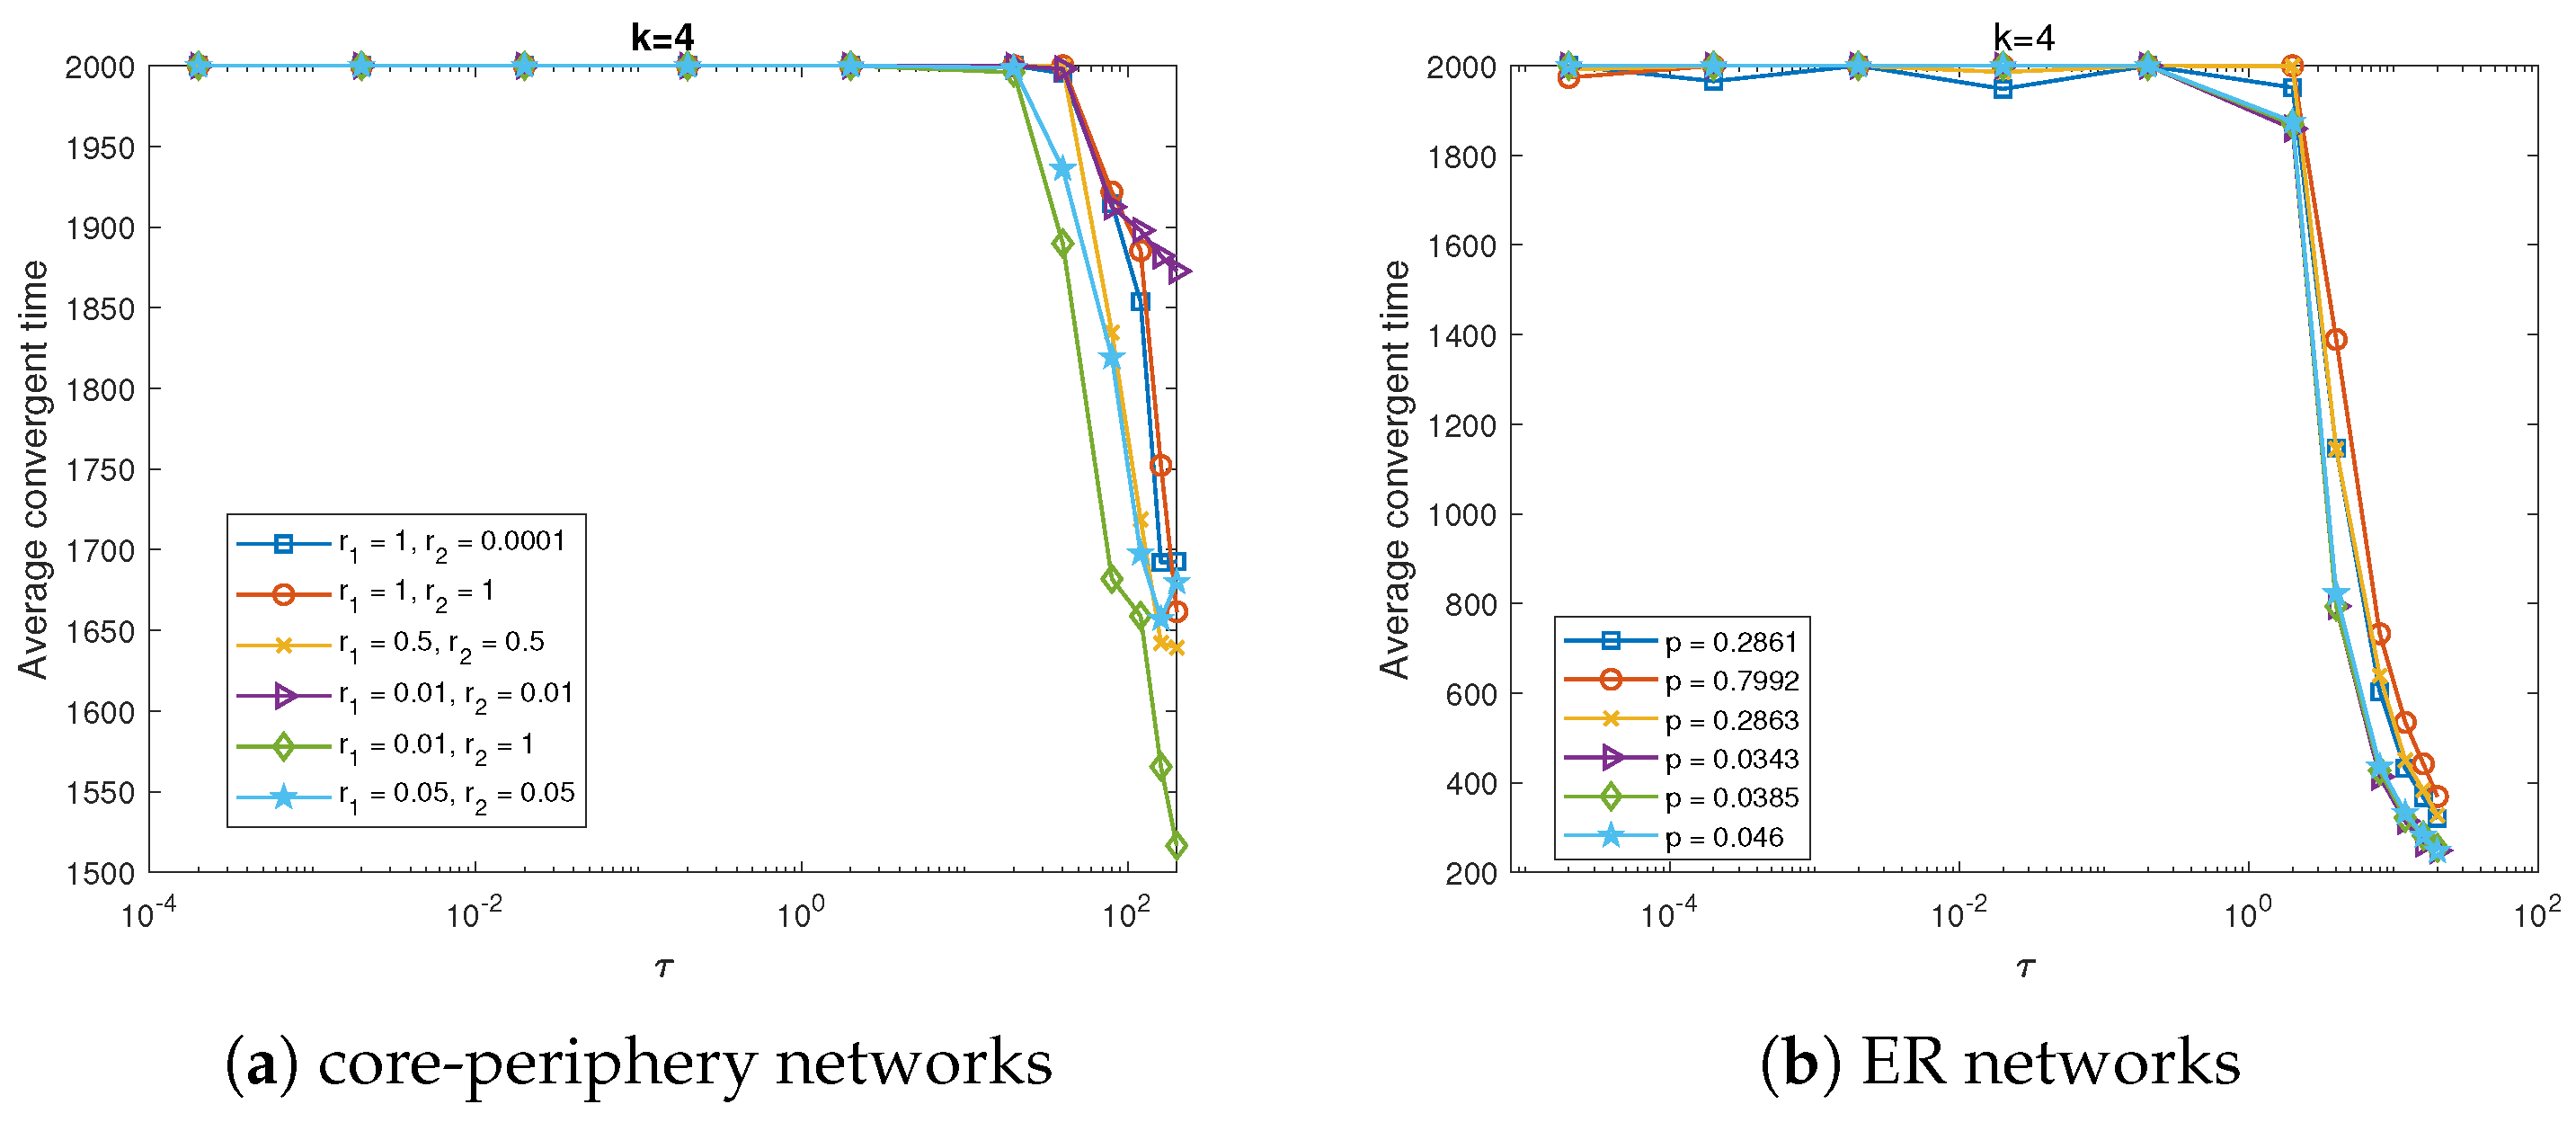
We also presented the results when k = 3 and k = 4 respectively in Figure 7, Figure 8, Figure 9 and Figure 10. The final percentage of stiflers over CP networks and ER random networks increases with τ in the similar way as in the previous results. The only difference lies in the value of critical threshold τ c . As k becomes large, τ c increases too. In these simulation results, for CP networks it can be seen that τ c 0.2 when k = 2 , and τ c 1 when k = 3 , while the value is 2 when k = 4 . This is mainly due to the fact more successful interactions are required for larger k. Therefore it is much more difficult for the ignorant individuals to change their states to a spreader. In order to realize such transformation it should have higher probability to be successful for each interaction β . As a result the threshold value β μ is much larger with larger k. Meanwhile the critical threshold value for the corresponding ER random networks is a little bit smaller. For example when k = 4 , the value is about 0.2 , as is shown in Figure 8b. It implies that core-periphery structure may even diminish the ability for the network to disperse the information extensively.
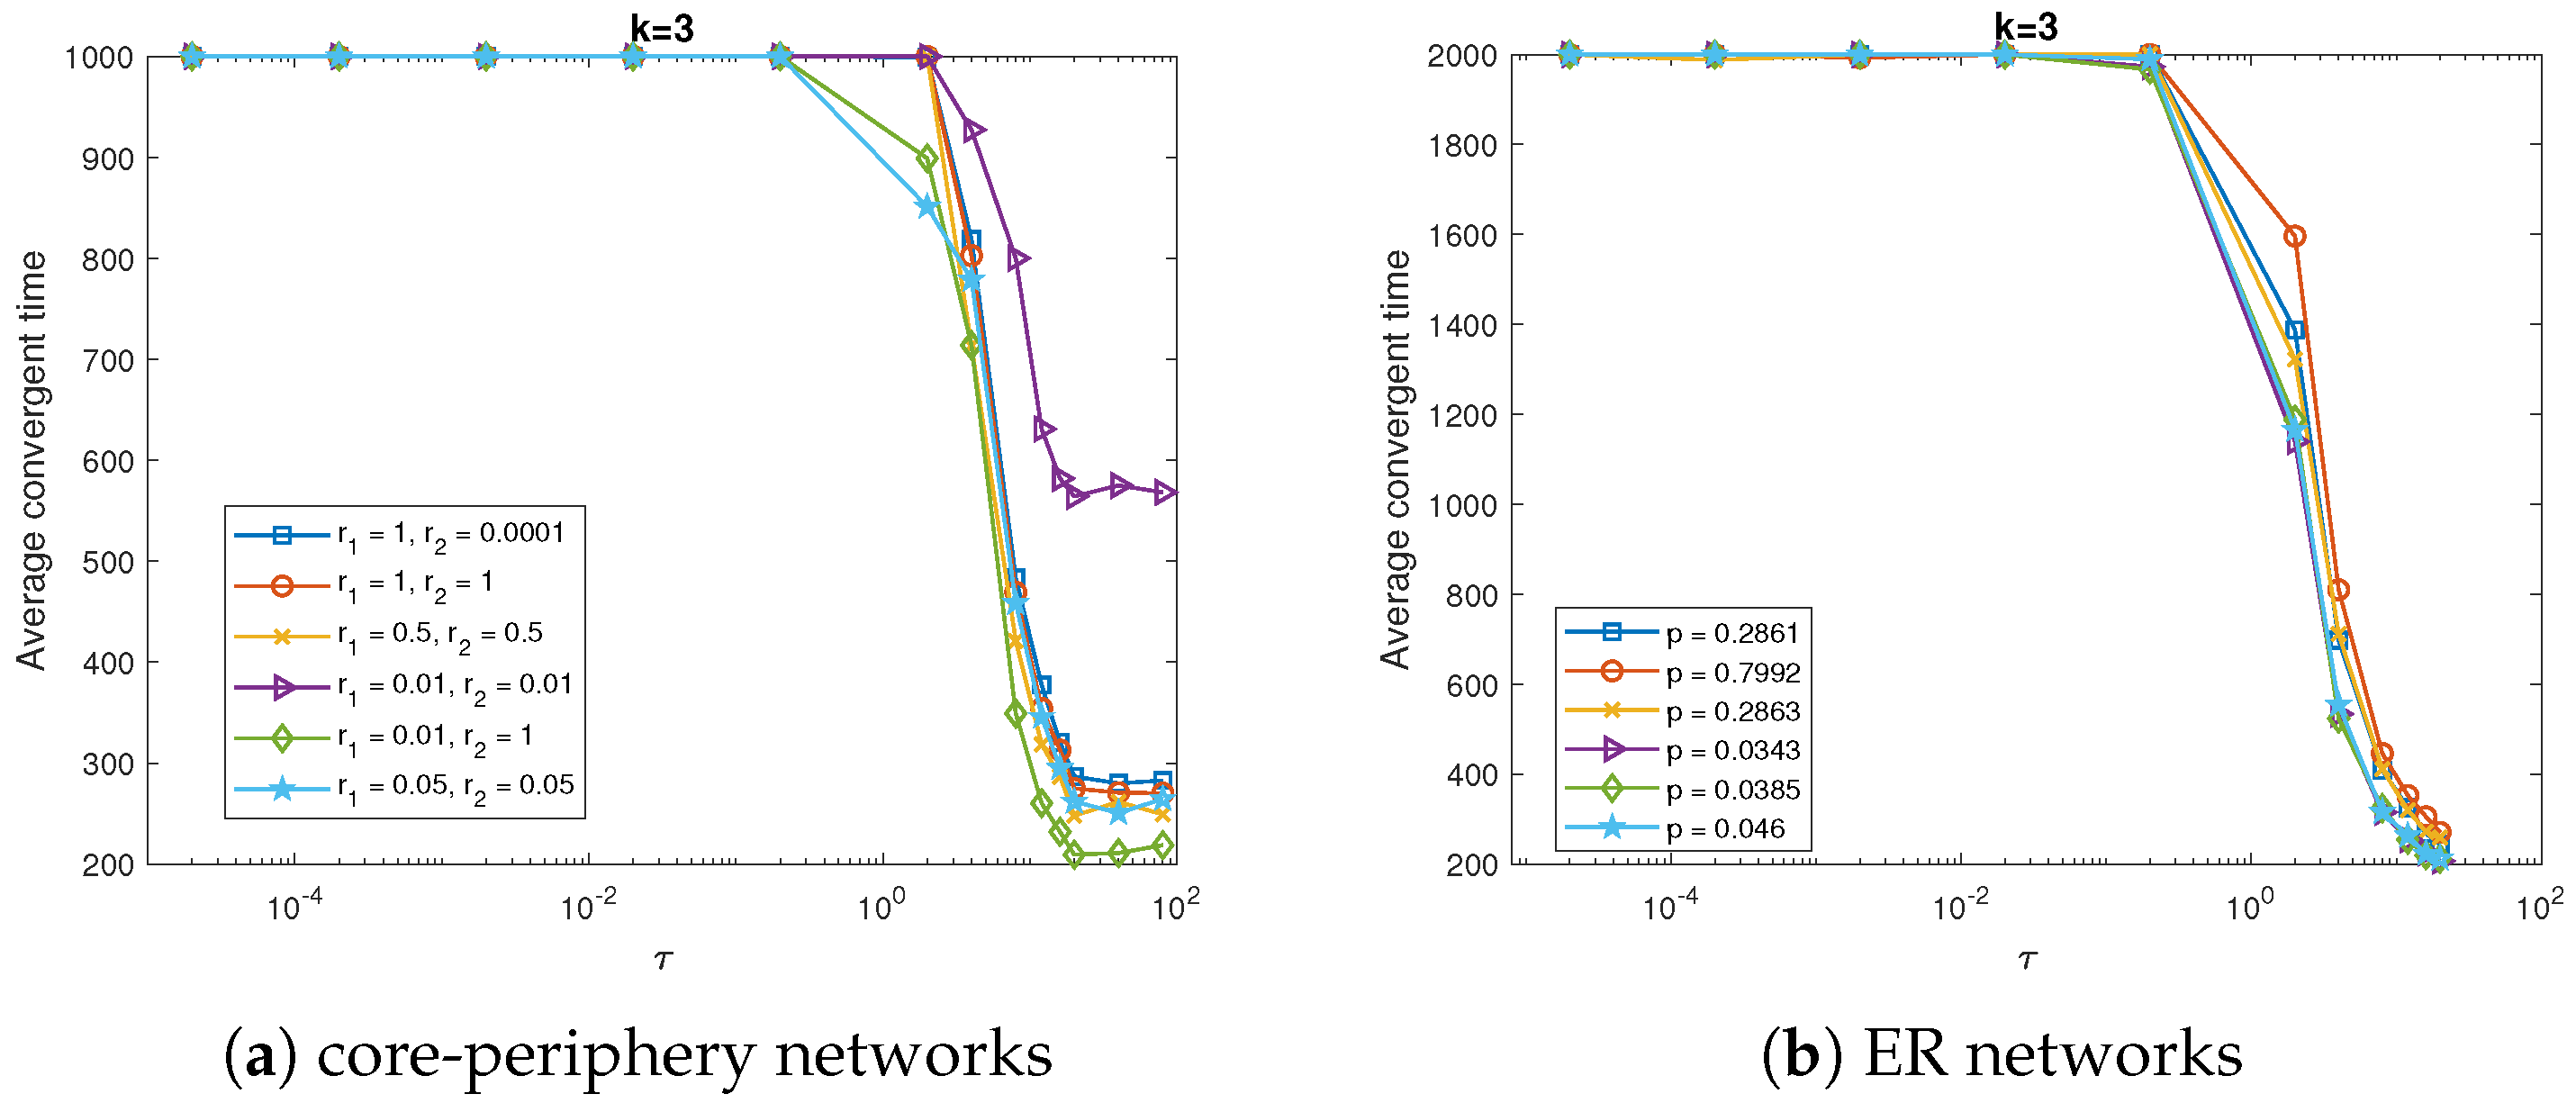
As for the average convergence time shown in Figure 9 and Figure 10, it is interested to find that the network with r 1 = 0.01 and r 2 = 1 can converge to the equilibrium much faster than the other networks when τ > τ c . For the CP network with r 1 = 0.01 and r 2 = 1 in this paper, it means that the individuals other than the core individuals will connect to any individual randomly with the same probability. Therefore it is somehow much closer to a random network, whose clustering coefficient is quite small, as is shown in the Table 1. By comparing with ER random networks, it is obviously that the random networks require much less time steps under the same threshold τ . Thus the network akin to ER random network can converge to the stable equilibrium with less time steps. Meanwhile, when k is small, the difference between CP networks and ER random networks is quite few, as is shown in Figure 4, so that most of the CP networks converge to the stable equilibrium at similar speed.

4. Immunization-Based Information Diffusion Control

In the previous section, it is found that the CP structure has little impact on information diffusion. We will further investigate the influence of the CP structure on fighting fake news and preventing information diffusion in this section. Inspired by the immunization strategy proposed by [40], the random immunization and target immunization will be analyzed respectively. By random immunization it means a random selected individual would become a stifler at a predefined probability no matter what kind of state he is, while by target immunization it refers to a targeted individual, which was set as core individual in the network in this paper. We assume the rate β = 0.2 and μ = 0.05 , so that τ > τ c can be guaranteed. The diffusion dynamics will be examined and compared under varying immunization rates, i.e., the proportion of nodes immunized, thereby capturing the range of available intervention capacity.
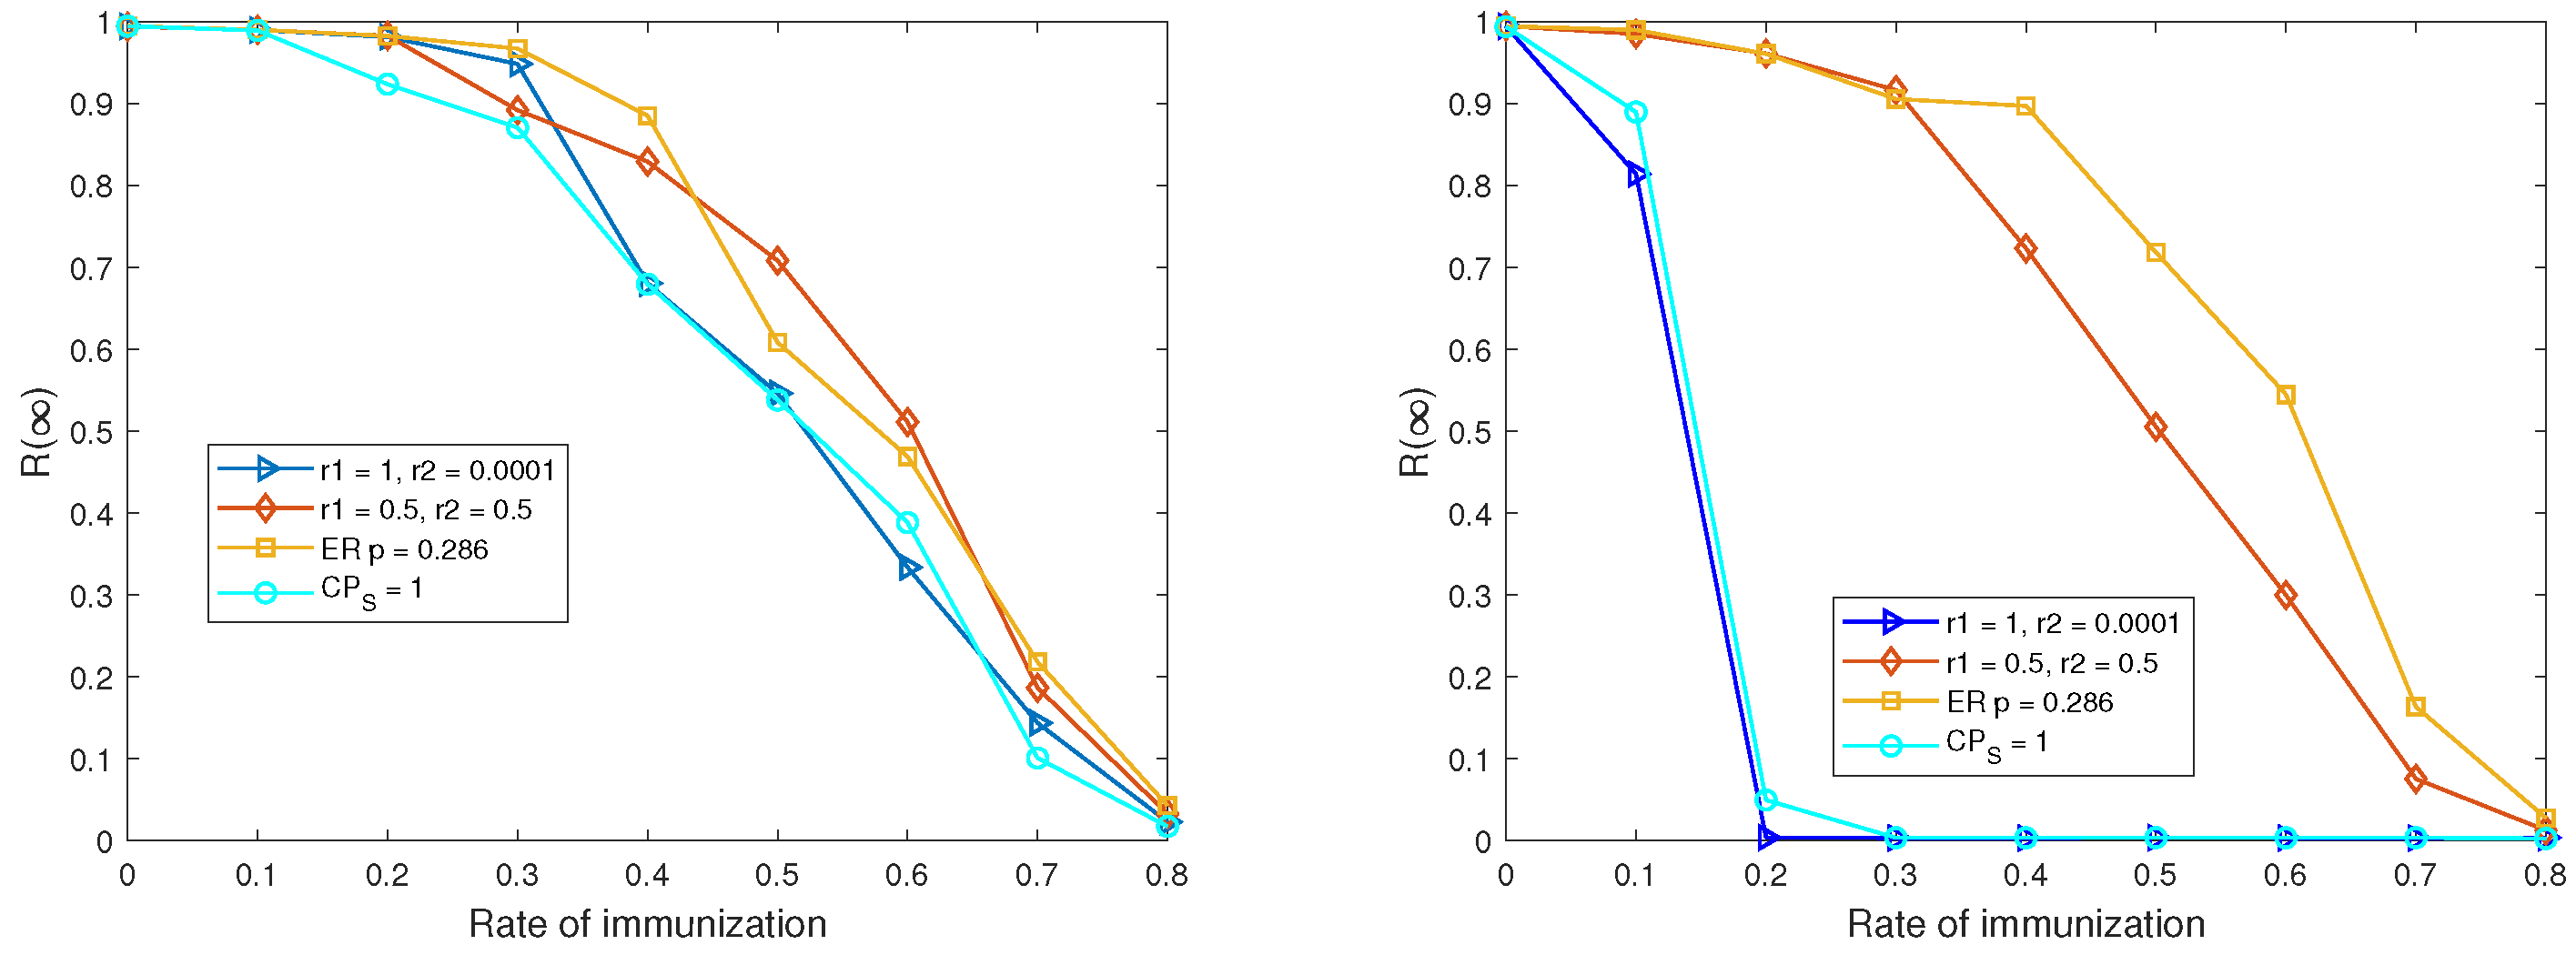
Figure 11 is the final percentage of stifler with different rates of immunization over different networks. The results for both the CP networks and the corresponding ER random networks are presented. It can be seen from Figure 11a that with the strategy of random immunization, the final percentage of stiflers decreases in a similar way as the rate of immunization increases for all the networks. Thus the network structure has little impact on the performance of the information intervention under the strategy of random immunization. Meanwhile, Figure 11b is the final percentage of stiflers with increasing rate of immunization over different networks when the target immunization is taken. It can be seen that there are phase transition for the networks with strong core-periphery structure, while for the other two networks the final percentage of stiflers declines much more smoothly as the rate of immunization increases, which is much more similar to the case of random immunization. It can be thus indicated that the structure of core-periphery has a significant impact on the information diffusion in this case. That is mainly due to the fact that the core nodes can be regarded as hubs to some extent.
Figure 12 is the average convergent time with different rates of immunization over different networks under the strategy of random immunization and targeted immunization respectively. It can be seen from Figure 12a that the average convergent time keeps almost the same when the rate of individuals being immunized is relatively small, and then declines much more quickly when the rate is larger than about 0.5 in this case. The two networks with strong the core-periphery structure can converge to the stable equilibrium a little bit faster than the other two networks, especially when the rate of immunization is large, but the difference is quite tiny. Thus it can be indicated that under the strategy of random immunization the structure of core-periphery can hardly accelerate the convergence speed. As for the case of target immunization, it can be observed from Figure 12b that there is a sharp decline for the two networks with strong core-periphery structure compared to the other two networks, when the rate of immunization reaches a threshold about 0.2 in these cases. The trend is quite similar to the results for the average final percentage of stiflers shown in Figure 11b. Thus it can be obviously indicated that the structure of core-periphery may help speed up the convergence in the case of targeted immunization. That may be due to the fact that in strong CP networks, core nodes can act as critical bridges between dense core and sparse periphery. Thus targeting these core nodes can essentially fragment the network and sever the main pathways for information spread to the majority of nodes in the periphery.
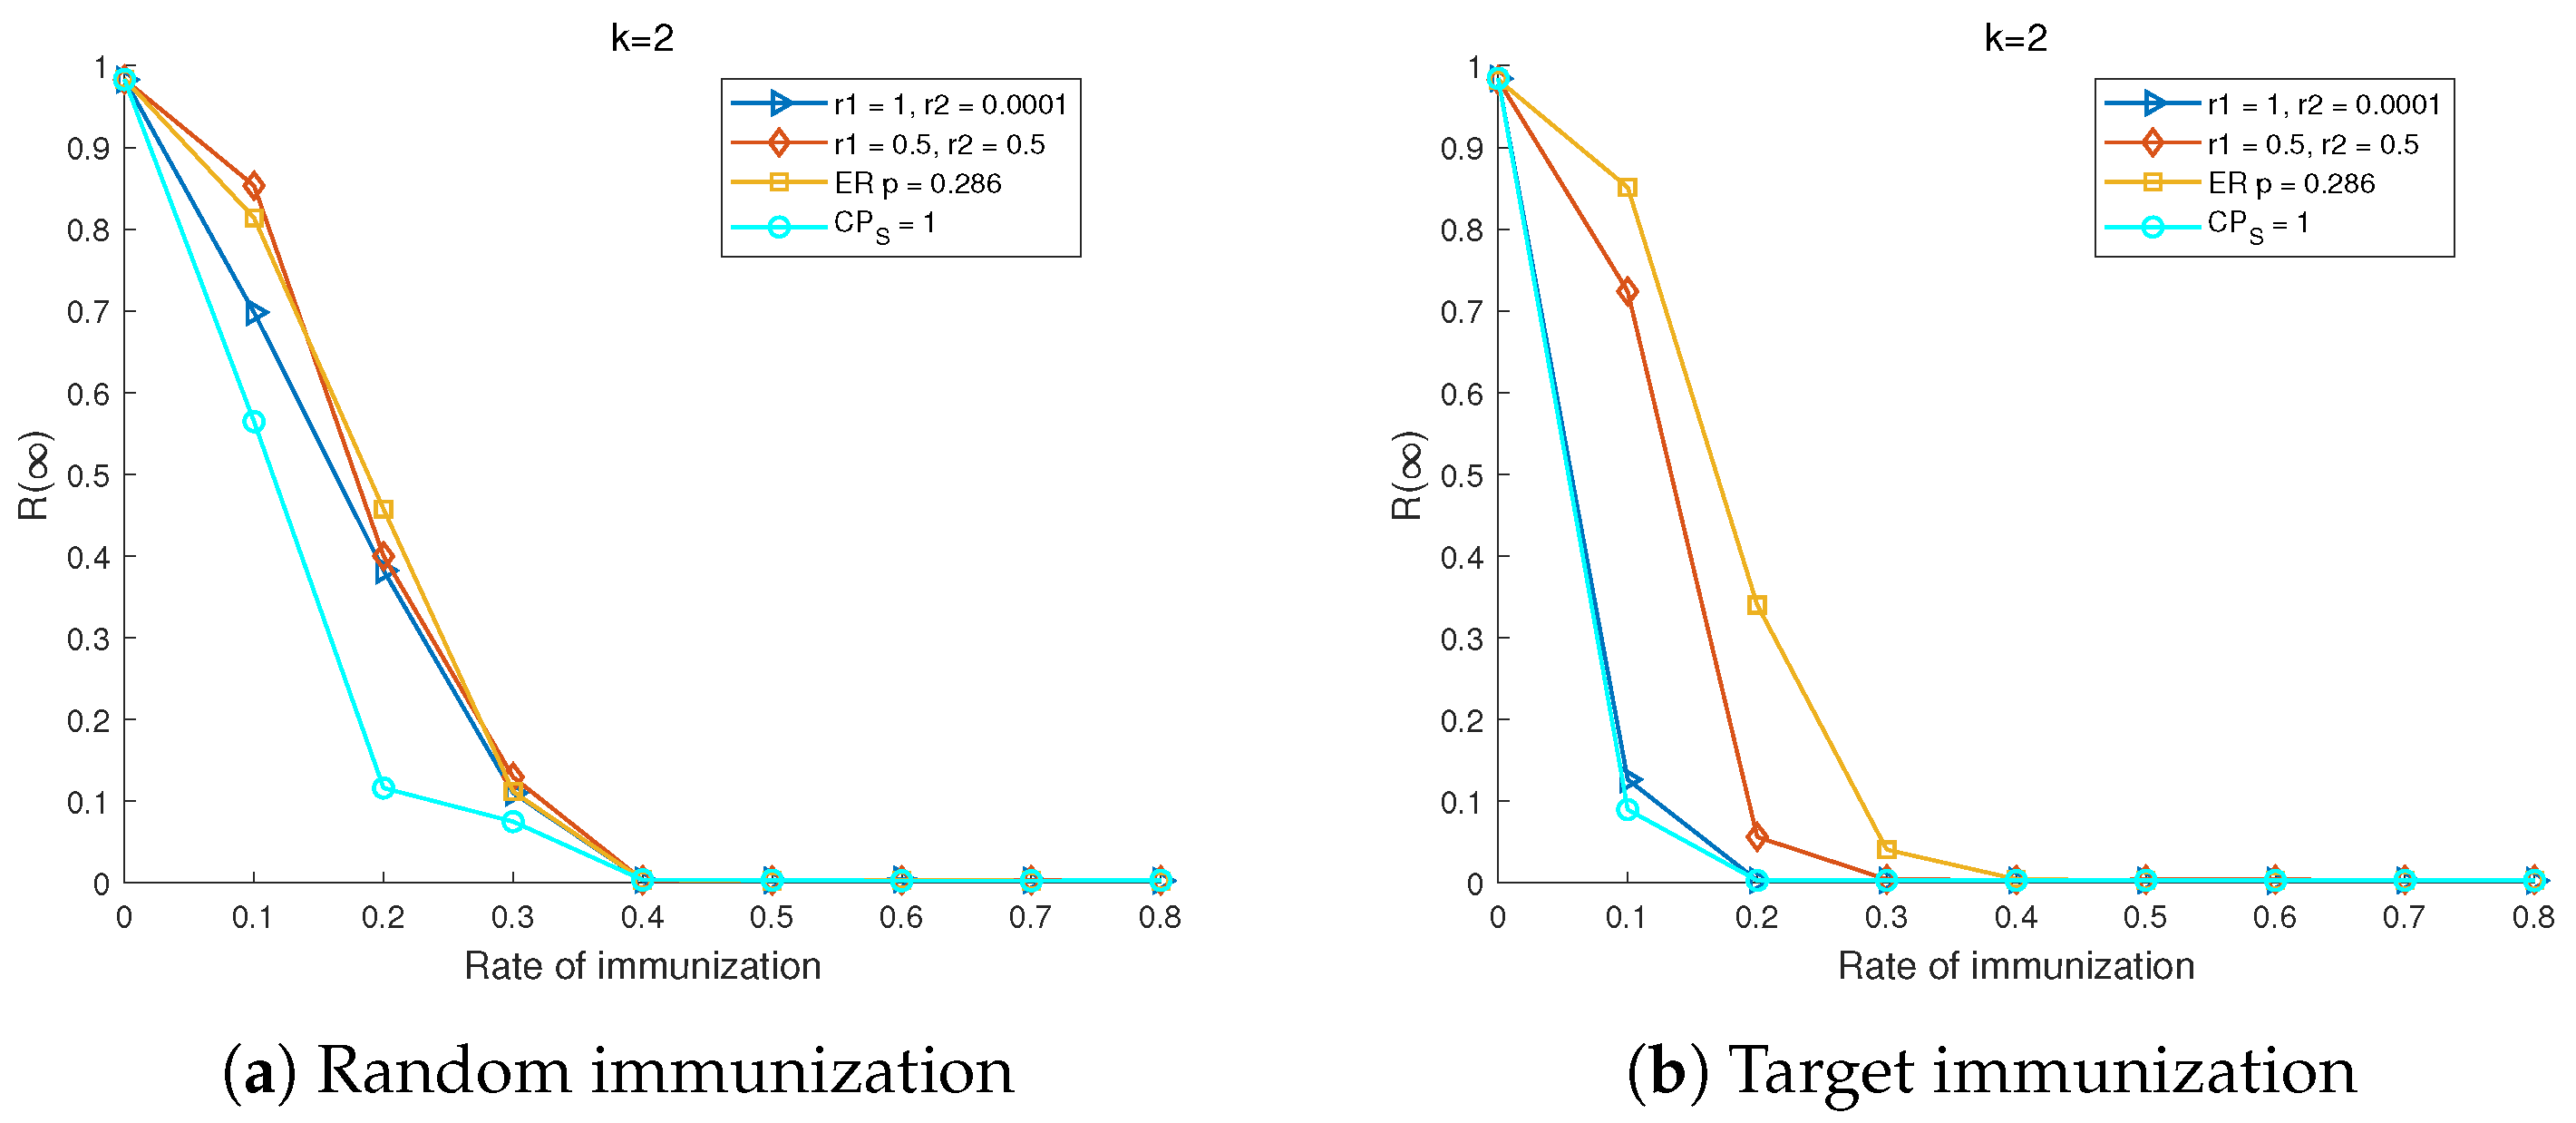
While the above results are concerned with simple contagion, we further investigate the case of complex contagion. The corresponding results when k = 2 are presented in Figure 13 and Figure 14. As can be seen in Figure 13a, under the strategy of random immunization, there is little impact from core-periphery structure as well. The final percentage of stiflers decreases at almost the same speed, irrespective of different strength of core-periphery structure. Meanwhile, it can be found from Figure 13b that under the strategy of target immunization, the influence by core-periphery becomes slighter compared to the case of simple contagion. We also investigate the scenario with different k, and find when k increases, the influence is gradually diminishing. That is partly because when k increases, it is much more difficult for the individual to change his state. As a result, the impact by immunizing the core individual is fading, especially when the threshold τ is not large.
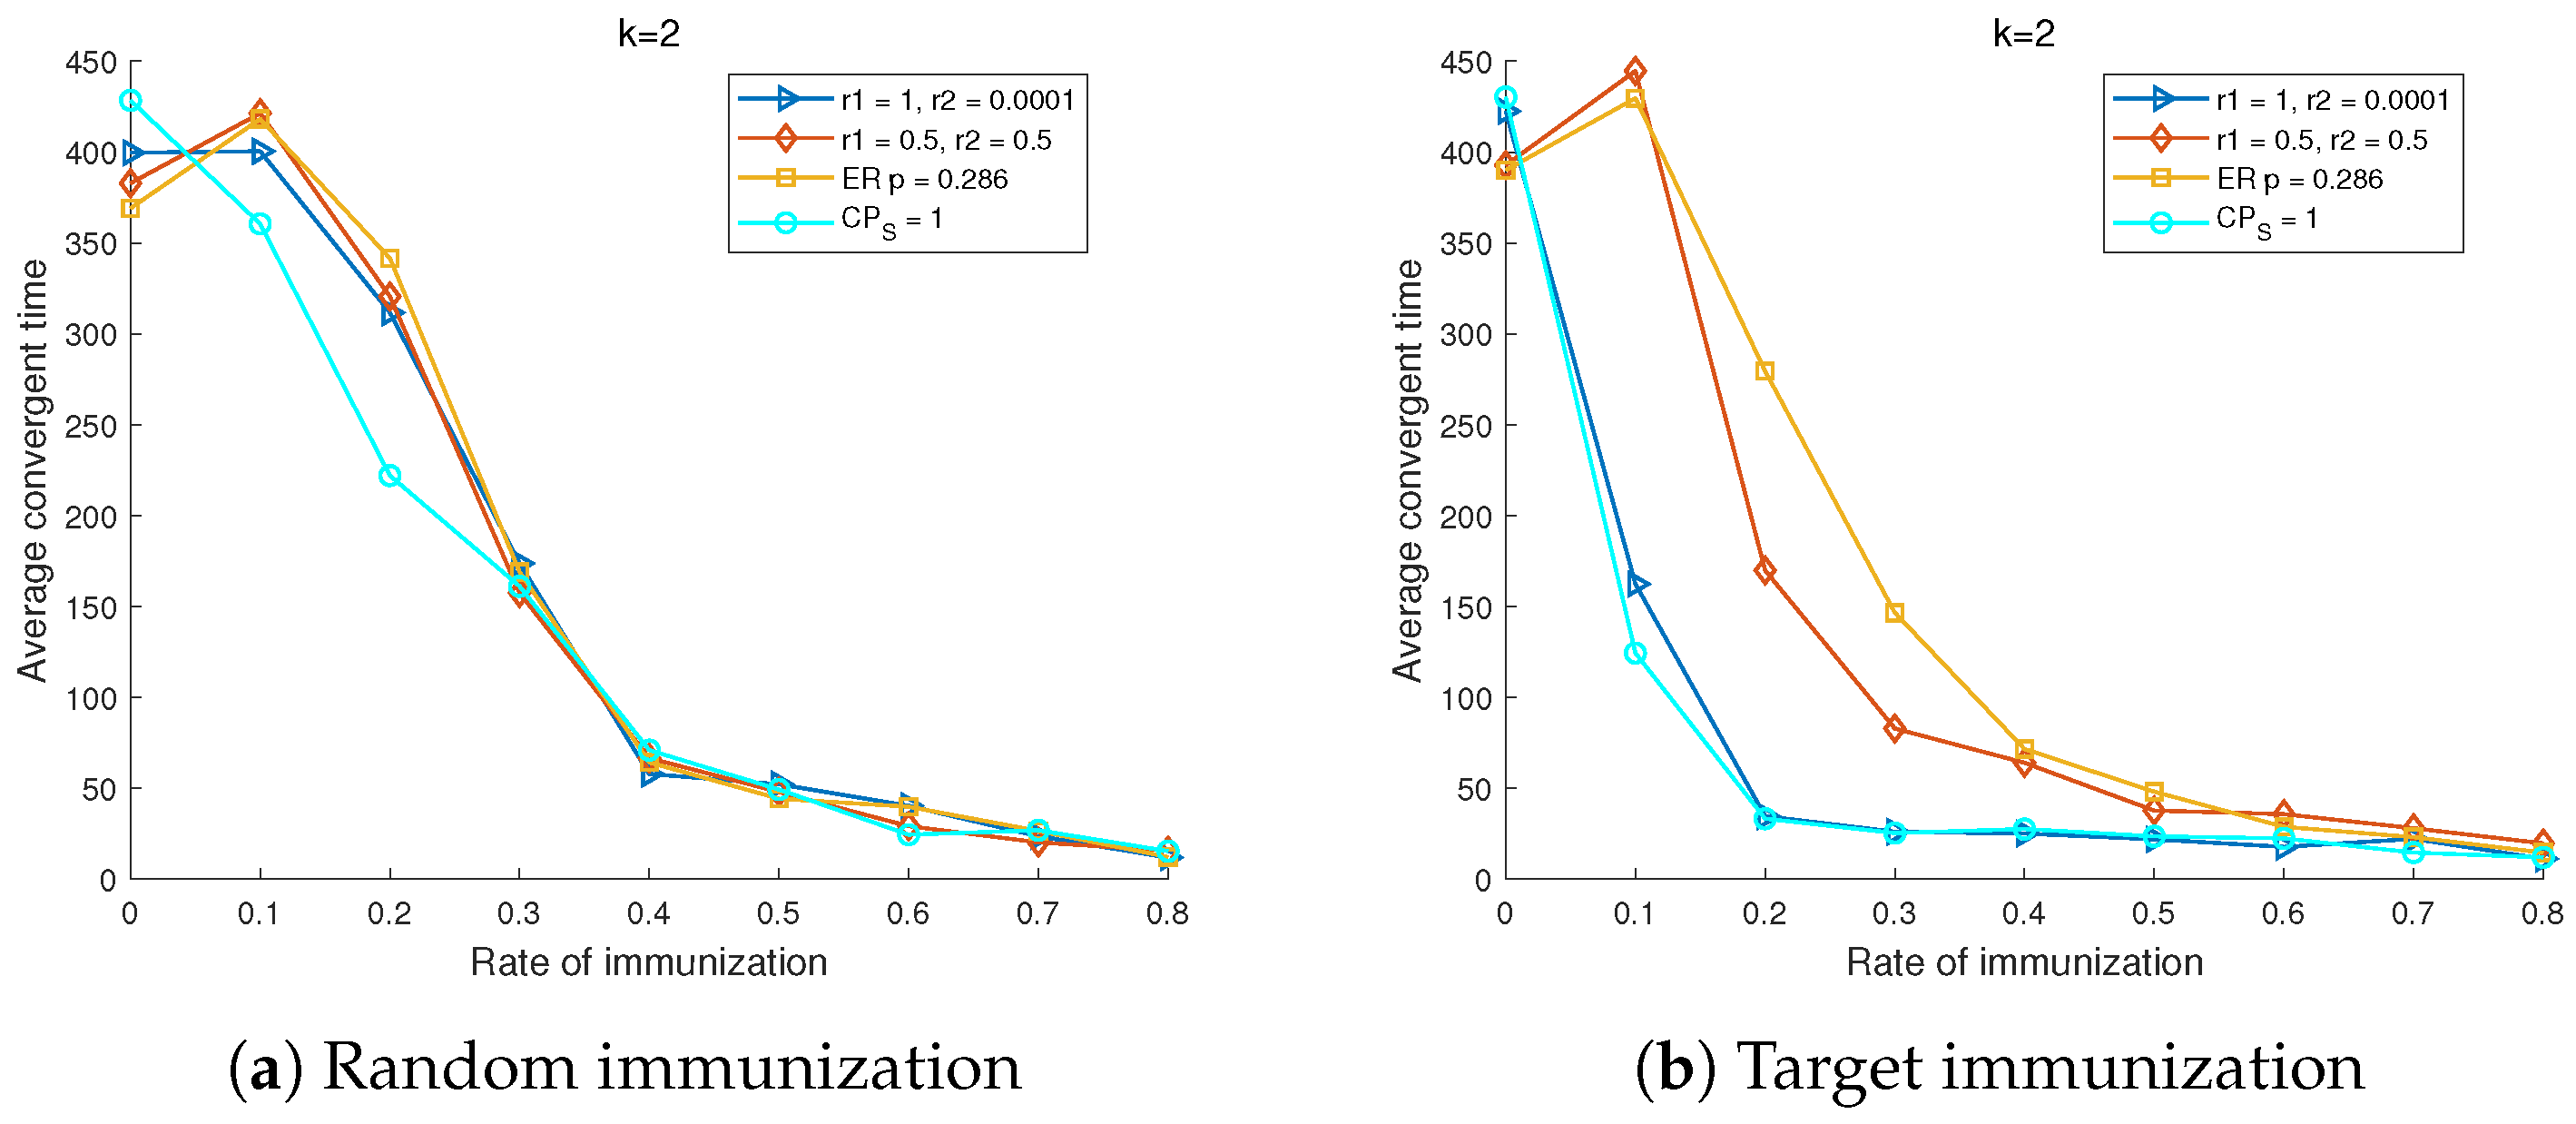
Likewise the average convergence time over different networks is also presented in Figure 14. It can be observed that the average convergent time decreases as the rate of immunization becomes large for both the random immunization and target immunization. Moreover, the average convergent time goes down a little bit more sharply over the networks with stronger core-periphery structure than weak core-periphery structure under the strategy of target immunization. However as k increases, such difference is diminishing as well. Thus it can be indicated the structure of core-periphery cannot accelerate convergence for target immunization as well when the adoption threshold for complex contagion increases.

5. Conclusions

In this paper, we conducted a comprehensive investigation into the influence of core-periphery (CP) structure on information diffusion over social networks, utilizing the Maki-Thompson (MT) model. By constructing networks with tunable CP strength and employing numerical simulations supported by theoretical analysis, we systematically examined the dynamics under both simple and complex contagion scenarios. The main contributions and findings can be summarized as follows.
Firstly, it is found that CP structure plays a nuanced, dual role in diffusion. While a stronger CP structure facilitates broader dissemination of information across the population compared to a weaker one, it simultaneously hinders the onset of complex contagions. Counterintuitively, CP networks require a significantly higher critical threshold for a global cascade of complex behaviors than equivalent random networks, due to the lack of local social reinforcement in the sparse periphery.
Secondly, the results demonstrate that networks with a strong CP structure are highly susceptible to targeted immunization strategies. Intervening in the densely connected core nodes is remarkably effective at curbing information spread, whereas random interventions show little dependence on the network structure. This underscores the practical importance of identifying and targeting structural cores for efficient information control.
Moreover, the advantage of targeted immunization diminishes as the complexity of the contagion, k, increases. This suggests that controlling the spread of behaviors requiring strong social reinforcement may necessitate more sophisticated strategies beyond simply targeting central nodes.
These findings offer crucial insights into how network structure governs diffusion dynamics. Since core–periphery structures are prevalent across diverse domains, such as financial, trade, and transportation networks, these results extend beyond social media contexts. In particular, the distinction between how CP structures affect simple versus complex contagion is especially relevant for understanding systemic risk in interbank networks, where multiple shocks may be required to trigger failures (analogous to complex contagion), in contrast to the rapid spread of financial panic (akin to simple contagion). This realization highlights that such a prevalent network topology can both facilitate and hinder diffusion depending on the contagion type, carrying significant implications for public opinion management, viral marketing, and epidemic control.
While this study provides a solid foundation, it also has several limitations opening up several avenues for future research. First, all the simulation results are based on synthetic networks with fixed size. Validating these findings on large-scale, real-world network data and exploring the model’s robustness across different network sizes and core proportions could be an important extension. Second, comparing the effects of CP structure with other mesoscale topologies, such as community or small-world structures, would also be a valuable extension. Furthermore, promising future directions include investigating diffusion on adaptive CP networks where the structure co-evolves with the spreading process, as well as incorporating more complex real-world factors such as multi-source information fusion [41] and negative user emotions [42].

Author Contributions

Conceptualization, G.F. and H.L.; methodology, G.F.; software, G.F.; software, G.F.; validation, G.F. and H.L.; formal analysis, G.F.; writing-original draft preparation, G.F.; writing—review and editing, G.F. and H.L.; project administration, G.F. and H.L.; funding acquisition, G.F. and H.L. All authors have read and agreed to the published version of the manuscript.

Funding

This research was partly funded by National Natural Science Foundation of China (61603253), Open Project of Technology Innovation Center for Natural Ecosystem Carbon Sink (CS2023D11), Research and Application Demonstration of High-Precision Autonomous Navigation and Fish-Finding Intelligent Vessel for Oceanic Fishing Grounds (D8006250201), China Postdoctoral Science Foundation funded project (2016M601598), China Scholarship Council and the Fundamental Research Funds for the Central Universities.

Data Availability Statement

The original contributions presented in this study are included in the article. Further inquiries can be directed to the corresponding author.

Conflicts of Interest

The authors declare no conflict of interest.

Appendix A. Micro Markov Chain Analysis of MT Model

We start to analyze the dynamics of information diffusion over social networks by Markov chain approach. Let the state of individual i at time t as ξ i ( t ) . ξ i ( t ) { 0 , 1 , 2 } , where 0 for ignorant, 1 for spreader, and 2 for stifler. For the network with N individuals, the state of the whole network can be represented as:
Ξ ( t ) = ( ξ 1 ( t ) , ξ 2 ( t ) , , ξ n ( t ) ) { 0 , 1 , 2 } n
Let p i ( t ) = [ p I , i ( t ) , p S , i ( t ) , p R , i ( t ) ] to be the probability that individual i is in the state of 0, 1, 2 at time t, respectively. Obviously, p I , i ( t ) + p S , i ( t ) + p R , i ( t ) = 1 .
In this paper, we assume the current states of the individuals are independent with each other. Denote by p i , I S ( t ) the probability that individual i in the state of ignorant is affected by his neighbors in the state of spreader at time t. We can obtain the probability p i , I S ( t ) as follows:
p i , I S ( t ) = 1 j = 1 N [ 1 β A i j p S , j ( t ) ]
Likewise, we can obtain the probability that an individual with the state of spreader will change his state to a stifler, p i , S R ( t ) , as follows:
p i , S R ( t ) = 1 j = 1 N [ 1 μ A i j ( p S , j + p R , j ) ( t ) ]
Based on Markov chain, we can calculate the probability of individual i in the state of spreader ( p S , i ( t ) ) as follows:
p S , i ( t + 1 ) = ( 1 p i , S R ) p S , i ( t ) + p i , I S ( t ) p I , i ( t ) = j = 1 N [ 1 μ A i j ( p S , j + p R , j ) ( t ) ] p S , i ( t ) + ( 1 j = 1 N [ 1 β A i j p S , j ( t ) ] ) p I , i ( t )
where p I , i ( t ) = 1 p S , i ( t ) p R , i ( t ) . By inserting it into Equation (A3) and ignoring the higher order terms, Equation (A3) can be rewritten as:
p S , i ( t + 1 ) = ( 1 μ ) p S , i ( t ) + β j = 1 N A i j p S , j ( t )
Likewise, the probability of individual i in the state of stifler ( p R , i ( t ) ) can be obtained as:
p R , i ( t + 1 ) = p R , i ( t ) + μ p S , i ( t )
When individual i reaches his steady-state, i.e., p S , i ( t + 1 ) = p S , i ( t ) , the convergent probability of individual with state ξ i ( t ) = 1 , i.e., p R , i , can be calculated as:
p S , i = β μ j = 1 N A i j p S , j
And then Equation (A6) can be rewritten as:
j = 1 N ( A i j μ β δ i j ) p S , j
where δ i j is the Kronecker delta, where δ i j = 1 , if i = j , and 0 otherwise.
For all the individuals in the network, let p S = [ p S , 1 , p S , 2 , , p S , N ] T , then Equation (A7) can be expressed in terms of matrix as follows:
( A μ β I ) p S = 0
where I is the identity matrix. It can be seen that μ β is the eigenvalue of the matrix A .
Let τ = β μ . We are interested in the threshold value τ c , above which there is a break of information diffusion among the population. When τ is close to τ c , the probability that the individuals in the network are in the state 1, p R , i , would satisfy 0 < p R , i 1 .
According to Perron-Frobenius Theorem, for the connected network, its adjacent matrix A has a largest eigenvalue and the corresponding eigenvector has positive entries. Thus nontrivial solution of Equation (A8) is:
τ c = 1 λ m a x ( A )
If the recover rate μ is fixed, the threshold of spreading rate β c is as follows:
β c = μ λ m a x ( A )

Appendix B. Heterogeneous Mean-Field Based Analysis of Information Diffusion over CP Network

Following up the previous analysis of MT model, we will further explore the impact of CP network structure on the k-complex contagion by employing the heterogeneous mean-field theory.
Firstly, let C and P denote the sets of core and peripheral nodes in the CP network. Each node in C(P) has potential three states: Ignorant (I), Spreader (S) and Stifler (R). Denote the proportions of nodes in each state at time t by C I ( t ) , C S ( t ) , C R ( t ) for the core nodes and P I ( t ) , P S ( t ) , P R ( t ) for the peripheral nodes. Clearly, the following equation holds:
C I ( t ) + C S ( t ) + C R ( t ) = 1 , P I ( t ) + P S ( t ) + P R ( t ) = 1
Similarly, let k C C and k C P denote the average degree of a core node connecting to other core nodes and to periphery nodes, respectively, while k P C and k P P represent the average degree of a peripheral node connecting to core nodes and to other peripheral nodes, perspectively. Since the network is undirected, with N C and N P being the number of core and peripheral nodes respectively, we have N C k C P = N P k P C .
In what follows, we will deduce the influence of CP structure on simple contagion ( k = 1 ) and complex contagion ( k > 1 ), respectively.

Appendix B.1. Case 1: k = 1

For the core nodes, based on MT model in Equation (3), the probability that a core node with state of I can become a spreader (S), λ C , depends on the density of spreaders among their neighbors. It can be determined as:
λ C ( t ) = β ( k C C C S ( t ) + k C P P S ( t ) )
Meanwhile, the rate at which a core spreader(S) becomes a stifler(R), γ C ( t ) , depends on the density of spreaders or stiflers among their neighbors, and is defined as:
γ C ( t ) = μ [ k C C ( C S ( t ) + C R ( t ) ) + k C P ( P S ( t ) + P R ( t ) ) ]
Similarly, for the periphery nodes, the corresponding λ P and γ P are obtained analogously as:
λ P ( t ) = β ( k P C C S ( t ) + k P P P S ( t ) ) γ P ( t ) = μ [ k P C ( C S ( t ) + C R ( t ) ) + k P P ( P S ( t ) + P R ( t ) ) ]
Next, taking into account the transmission rates in Equations (A11)–(A13), the evolutionary dynamics of the nodes over CP network can be formulated by Equation (A14).
d C S d t = λ C ( t ) · C I ( t ) γ C ( t ) · C S ( t ) d C R d t = γ C ( t ) · C S ( t ) d P S d t = λ P ( t ) · P I ( t ) γ P ( t ) · P S ( t ) d P R d t = γ P ( t ) · P S ( t )
where the fraction of ignorant nodes C I = 1 C S C R and P I = 1 P S P R .

Appendix B.2. Case 2: k > 1

In this case, an ignornant individual (I) much be exposed to at least k successful transmissions before becoming a spreader. This renders the infection process nonlinear, in contrast to the simple contagion case when k = 1 .
To model this process, we introduce k 1 intermediate states, denoted as:
I λ E 1 λ E 2 λ λ S
where E j ( j = 1 , 2 , , k 1 ) represents a partially state that has accumulated j exposures but has not yet become an active spreader.
Under the mean-field approximation, the instantaneous rate at which an ignorant individual becomes a spreader is proportional to the k-th power of the infection pressure they experience, i.e., ( λ ( t ) ) k .
Accordingly, the evolutionary dynamics of the nodes over CP network in Equation (A14) can be modified as:
d C S d t = ( λ C ( t ) ) k · C I ( t ) γ C ( t ) · C S ( t ) d C R d t = γ C ( t ) · C S ( t ) d P S d t = ( λ P ( t ) ) k · P I ( t ) γ P ( t ) · P S ( t ) d P R d t = γ P ( t ) · P S ( t )
In order to examine whether the information can diffuse across the entire CP network, it hinges on whether it can successfully propagate from the core to the periphery and sustain itself therein. Thus, we focus on the growth equation for peripheral spreaders, d P S d t .
The defining structural characteristic of CP networks is that p c c > p c p > p p p , indicating that connections within the core are dense, while those among peripheral nodes are sparse. Consequently, the average degree of peripheral-to-peripheral links, k P P , is typically very small.
In Equation (A13), since k P P is nearly zero, the transmission rate from I to S is entirely almost entirely driven by core spreaders, i.e.,
λ P ( t ) β k P C C S ( t )
In the case of complex contagion, a peripheral ignorant individual needs to accumulate at least k exposures. However, given the scarcity of peripheral–peripheral connections, a peripheral node cannot accumulate sufficient exposures from its peers. This absence of local reinforcement, where clustered neighbors strengthen the likelihood of adoption, is known as social reinforcement. In the periphery of a CP network, this mechanism is structurally missing. As a result, the activation of peripheral nodes relies almost exclusively on “one-way transmission” from the core nodes. For a structually isolated peripheral node to receive k successful transmissions from its limited core neighbors within a short period, the effective transmission rate β much be very high.
Since in the CP network, the lack of local reinforcement indicates that sustaining contagion requires a higher effective transmission rate, β . Whereas, in an ER network, local clusters of neighbors with state of I are more frequent, making it easier to satisfy the multiple-exposure condition, and thus lowering the threshold, i.e., τ c C P = β μ τ c E R .
Thus, we have Proposition 1 presented in Section 3.

Appendix C. Implementation of the Algorithm

The numerical simulations are primarily implemented based on MT model shown in Equation (3). Generally each individual has 3 possible states involving 2 possible activities, i.e., (1) Individual with ignorant state becomes a spreader after contacting a spreader, (2) A spreader becomes a stifer after contacting a spreader or a stifler. Individuals will update their states at each iteration.
The algorithm to implement the MT model over networks is presented as follows.
Algorithm A1 Information diffusion based on MT model over CP network.
  • Initialization
  • repeat
  •     for  k = 1 : N  do
  •         An individual i V is randomly chosen
  •         if then  i ’s neighborhood N i is empty
  •            Continue
  •         end if
  •         Pick an individual at random from i’s neighborhood, denoted by j N i
  •         if Individual i is an ignorant then
  •            if The neighbor j is a spreader then
  •                if  r a n d ( ) β  then
  •                    Record the number of successful exposures for individual i
  •                     c o u n t i = c o u n t i + 1
  •                    if  c o u n t i k  then
  •                        Individual i will become a spreader
  •                    end if
  •                end if
  •            end if
  •         end if
  •         if Individual i is a spreader then
  •            if The neighbor j is a spreader or a stifler then
  •                Individual i will become a stifler at the rate of μ
  •            end if
  •         end if
  •         Update the number of individuals with different states
  •     end for
  • until The number of spreaders is 0, or the termination time is reached.

References

  1. Li, M.; Wang, X.; Gao, K.; Zhang, S. A Survey on Information Diffusion in Online Social Networks: Models and Methods. Information 2017, 8, 118. [Google Scholar] [CrossRef]
  2. Gleeson, J.P.; O’Sullivan, K.P.; Baños, R.A.; Moreno, Y. Effects of network structure, competition and memory time on social spreading phenomena. Phys. Rev. X 2016, 6, 021019. [Google Scholar] [CrossRef]
  3. Guilbeault, D.; Becker, J.; Centola, D. Complex Contagions: A Decade in Review. In Complex Spreading Phenomena in Social Systems; Springer: Cham, Switzerland, 2018; pp. 3–25. [Google Scholar] [CrossRef]
  4. Duffy, J.; Karadimitropoulou, A.; Parravano, M. Financial contagion in the laboratory: Does network structure matter? J. Money Credit. Bank. 2019, 51, 1097–1136. [Google Scholar] [CrossRef]
  5. Montanaria, A.; Saberi, A. The spread of innovations in social networks. Proc. Natl. Acad. Sci. USA 2010, 107, 20196–20201. [Google Scholar] [CrossRef]
  6. Bakshy, E.; Rosenn, I.; Marlow, C.; Adamic, L. The Role of Social Networks in Information Diffusion. In Proceedings of the 21st International Conference on World Wide Web, WWW ’12, Lyon, France, 16–20 April 2012; pp. 519–528. [Google Scholar] [CrossRef]
  7. Qiao, T.; Shan, W.; Zhang, M.; Liu, C. How to facilitate knowledge diffusion in complex networks: The roles of network structure, knowledge role distribution and selection rule. Int. J. Inf. Manag. 2019, 47, 152–167. [Google Scholar] [CrossRef]
  8. Wang, D.; Small, M.; Zhao, Y. Exploring the optimal network topology for spreading dynamics. Phys. A Stat. Mech. Its Appl. 2021, 564, 125535. [Google Scholar] [CrossRef]
  9. Pan, L.; Wang, W.; Tian, L.; Lai, Y.C. Optimal networks for dynamical spreading. Phys. Rev. E 2021, 103, 012302. [Google Scholar] [CrossRef]
  10. Stegehuis, C.; van der Hofstad, R.; van Leeuwaarden, J.S.H. Epidemic spreading on complex networks with community structures. Sci. Rep. 2016, 6, 29748. [Google Scholar] [CrossRef]
  11. Lin, S.; Hu, Q.; Wang, G.; Yu, P.S. Understanding Community Effects on Information Diffusion. In Advances in Knowledge Discovery and Data Mining; Cao, T., Lim, E.P., Zhou, Z.H., Ho, T.B., Cheung, D., Motoda, H., Eds.; Springer: Cham, Switzerland, 2015; pp. 82–95. [Google Scholar]
  12. Borgatti, S.P.; Everett, M.G. Models of core/periphery structures. Soc. Netw. 1999, 21, 375–395. [Google Scholar] [CrossRef]
  13. Eric Yanchenko, S.S. Core-periphery structure in networks: A statistical exposition. arXiv 2022, arXiv:2202.04455. [Google Scholar] [CrossRef]
  14. Fricke, D.; Lux, T. Core–Periphery Structure in the Overnight Money Market: Evidence from the e-MID Trading Platform. Comput. Econ. 2015, 45, 359–395. [Google Scholar] [CrossRef]
  15. Anastasiou, D.; Louri, H.; Tsionas, M. Nonperforming loans in the euro area: Are core–periphery banking markets fragmented? Int. J. Financ. Econ. 2019, 24, 97–112. [Google Scholar] [CrossRef]
  16. Battiston, F.; Guillon, J.; Chavez, M.; Latora, V.; De Vico Fallani, F. Multiplex core–periphery organization of the human connectome. J. R. Soc. Interface 2018, 15, 20180514. [Google Scholar] [CrossRef] [PubMed]
  17. Lee, S.H.; Cucuringu, M.; Porter, M.A. Density-based and transport-based core-periphery structures in networks. Phys. Rev. E 2014, 89, 032810. [Google Scholar] [CrossRef]
  18. Csermely, P.; London, A.; Wu, L.Y.; Uzzi, B. Structure and dynamics of core/periphery networks. J. Complex Netw. 2013, 1, 93–123. [Google Scholar] [CrossRef]
  19. Mkono, Y.T.L.C. Information Diffusion or Deviation? An Exponential Random Graph Model of Activism Against Discrimination on Airbnb. J. Hosp. Tour. Res. 2024, 48, 1253–1266. [Google Scholar] [CrossRef]
  20. Rossa, F.D.; Dercole, F.; Piccardi, C. Profiling core-periphery network structure by random walkers. Sci. Rep. 2013, 3, 1467. [Google Scholar] [CrossRef]
  21. Tang, W.; Zhao, L.; Liu, W.; Liu, Y.; Yan, B. Recent advance on detecting core-periphery structure: A survey. CCF Trans. Pervasive Comput. Interact. 2019, 1, 175–189. [Google Scholar] [CrossRef]
  22. Elliott, A.; Chiu, A.; Bazzi, M.; Reinert, G.; Cucuringu, M. Core–periphery structure in directed networks. Proc. R. Soc. A Math. Phys. Eng. Sci. 2020, 476, 20190783. [Google Scholar] [CrossRef]
  23. Gallagher, R.J.; Young, J.G.; Welles, B.F. A clarified typology of core-periphery structure in networks. Sci. Adv. 2021, 7, eabc9800. [Google Scholar] [CrossRef]
  24. Saxena, A.; Iyengar, S. Evolving models for meso-scale structures. In Proceedings of the 2016 8th International Conference on Communication Systems and Networks (COMSNETS), Bangalore, India, 5–10 January 2016; IEEE: New York, NY, USA, 2016; pp. 1–8. [Google Scholar]
  25. Verma, T.; Russmann, F.; Araújo, N.; Nagler, J.; Herrmann, H. Emergence of core–peripheries in networks. Nat. Commun. 2016, 7, 10441. [Google Scholar] [CrossRef] [PubMed]
  26. Kojaku, S.; Masuda, N. Core-periphery structure requires something else in the network. New J. Phys. 2018, 20, 043012. [Google Scholar] [CrossRef]
  27. Dong, Z.; Tian, M.; Lu, Y.; Lai, J.; Tang, R.; Li, X. Impact of core-periphery structure on cascading failures in interdependent scale-free networks. Phys. Lett. A 2019, 383, 607–616. [Google Scholar] [CrossRef]
  28. Chen, H.; Zhang, H.; Shen, C. Double phase transition of the Ising model in core–periphery networks. J. Stat. Mech. Theory Exp. 2018, 2018, 063402. [Google Scholar] [CrossRef]
  29. Huang, J.; Huang, J. Epidemic behaviors in weighted networks with core–periphery structure. Phys. A Stat. Mech. Its Appl. 2019, 528, 121452. [Google Scholar] [CrossRef]
  30. Mønsted, B.; Sapieżyński, P.; Ferrara, E.; Lehmann, S. Evidence of complex contagion of information in social media: An experiment using Twitter bots. PLoS ONE 2017, 12, e0184148. [Google Scholar] [CrossRef]
  31. Maki, D.P.; Thompson, M. Mathematical Models and Applications: With Emphasis on the Social Life, and Management Sciences; Technical report; Prentice-Hall: Englewood Cliffs, NJ, USA, 1973. [Google Scholar]
  32. Ferraz de Arruda, G.; Jeub, L.G.S.; Mata, A.S.; Rodrigues, F.A.; Moreno, Y. From subcritical behavior to a correlation-induced transition in rumor models. Nat. Commun. 2022, 13, 3049. [Google Scholar] [CrossRef]
  33. Daley, D.J.; Kendall, D.G. Epidemics and Rumours. Nature 1964, 204, 1118. [Google Scholar] [CrossRef]
  34. Davis, J.T.; Perra, N.; Zhang, Q.; Moreno, Y.; Vespignani, A. Phase transitions in information spreading on structured populations. Nat. Phys. 2020, 16, 590–596. [Google Scholar] [CrossRef]
  35. Centola, D. How Behavior Spreads: The Science of Complex Contagions; Princeton University Press: Princeton, NJ, USA, 2018. [Google Scholar] [CrossRef]
  36. Sprague, D.A.; House, T. Evidence for complex contagion models of social contagion from observational data. PLoS ONE 2017, 12, 40–42. [Google Scholar] [CrossRef]
  37. Fink, C.; Schmidt, A.; Barash, V.; Kelly, J.; Cameron, C.; Macy, M. Investigating the observability of complex contagion in empirical social networks. In Proceedings of the 10th International Conference on Web and Social Media, ICWSM 2016, Cologne, Germany, 17–20 May 2016; pp. 121–130. [Google Scholar]
  38. Centola, D.; Macy, M. Complex contagions and the weakness of long ties. Am. J. Sociol. 2007, 113, 702–734. [Google Scholar] [CrossRef]
  39. Romero, D.M.; Meeder, B.; Kleinberg, J. Differences in the mechanics of information diffusion across topics: Idioms, political hashtags, and complex contagion on twitter. In Proceedings of the 20th International Conference on World Wide Web, Hyderabad, India, 28 March–1 April 2011; pp. 695–704. [Google Scholar]
  40. Yang, Y.; McKhann, A.; Chen, S.; Harling, G.; Onnela, J.P. Efficient vaccination strategies for epidemic control using network information. Epidemics 2019, 27, 115–122. [Google Scholar] [CrossRef] [PubMed]
  41. Yang, R.S.; Li, H.B.; Huang, H.Z. Multisource information fusion considering the weight of focal element’s beliefs: A Gaussian kernel similarity approach. Meas. Sci. Technol. 2023, 35, 025136. [Google Scholar] [CrossRef]
  42. Deng, Q.; Chen, X.; Lu, P.; Du, Y.; Li, X. Intervening in Negative Emotion Contagion on Social Networks Using Reinforcement Learning. IEEE Trans. Comput. Soc. Syst. 2025, 1–12. [Google Scholar] [CrossRef]
Figure 1. An example of idealized core-periphery network.
Mathematics 13 03048 g001
Figure 2. The strength of core-periphery with different r 1 and r 2 .
Mathematics 13 03048 g002
Figure 3. The average final percentage of stiflers with different τ over core-periphery networks and the corresponding ER networks.
Mathematics 13 03048 g003
Figure 4. The average convergent time with different τ over core-periphery networks and the corresponding ER networks.
Mathematics 13 03048 g004
Figure 5. The final percentage of stiflers with different τ when k = 2 .
Mathematics 13 03048 g005
Figure 6. The average convergent time with different τ when k = 2 .
Mathematics 13 03048 g006
Figure 7. The final percentage of stiflers with different τ when k = 3 .
Mathematics 13 03048 g007
Figure 8. The final percentage of stiflers with different τ when k = 4 .
Mathematics 13 03048 g008
Figure 9. The average convergent time with different τ when k = 3 .
Mathematics 13 03048 g009
Figure 10. The average convergent time with different τ when k = 4 .
Mathematics 13 03048 g010
Figure 11. The final percentage of stiflers with different level of immunization.
Mathematics 13 03048 g011
Figure 12. The average convergent time with different level of immunization.
Mathematics 13 03048 g012
Figure 13. The average final percentage of stiflers with different level of immunization when k = 2 .
Mathematics 13 03048 g013
Figure 14. The average convergent time with different level of immunization when k = 2 .
Mathematics 13 03048 g014
Table 1. The statistics of the network with different strength CP.
Network k Densitylcct
1/ 1 × 10 4 286.0790.28641.71360.69750.3557
1/1799.1920.81.20.80.8
0.5/0.5286.33510.28661.71340.35350.3531
0.01/0.0134.33510.03440.43890.7391
0.01/138.52950.03862.81510.1760.7305
0.05/0.0546.00350.0462.41620.56490.5632
Table 2. The parameter settings used in this study.
μ stifling rate, this study adopts μ = 0.05
β spreading rate
τ = β μ spreading-stifling ratio
kthe number of successful interactions required in complex contagion
r 1 , r 2 Tunable parameters for CP network configuration
pThe probability that any two nodes in the equivalent ER random network are connected
R ( ) The final percentage of stiflers among all the individuals.
Disclaimer/Publisher’s Note: The statements, opinions and data contained in all publications are solely those of the individual author(s) and contributor(s) and not of MDPI and/or the editor(s). MDPI and/or the editor(s) disclaim responsibility for any injury to people or property resulting from any ideas, methods, instructions or products referred to in the content.