Abstract
Despite the recent advances in Virtual Reality technology and its use in education, the review of the literature shows several gaps in research on how immersive virtual environments impact the learning process. In particular, the lack of curriculum-specific experiments along with investigations of the effects of different content, activity, and interaction types in the current VR studies has been identified as a significant shortcoming. This has been more significant in STEM fields, where VR has the potential to offer engaging experiential learning opportunities. The study reported here was designed to address this gap by assessing the effect of authentic visualization and interaction types on learning a particular scientific concept. A use case scenario of “orbital hybridization” in chemistry education was selected to create this experiment and to collect data for analysis. We collected data on learning outcomes, task-completion efficiency, accuracy, and subjective usability. A combination of learning content and tasks designed based on the relevant educational theories was presented to three groups: 2D, VR interaction type 1 (hand gestures), and VR interaction type 2 (ray casting). The results showed that VR could improve learning and that interaction type could influence efficiency and accuracy depending on the task.
1. Introduction
Learning and teaching science, technology, engineering, and mathematics (STEM) has its own unique set of difficulties in higher education. This is in part due to the abstract nature of concepts in STEM disciplines and the wide range of issues such as cognitive load, required spatial thinking, and the necessity for experiential and hands-on learning. Most STEM-related fields require laboratory courses that are essential for providing students the opportunity to interact with and gain experience using scientific equipment, expensive instruments, and chemicals available in science labs. To address some of these challenges and issues, different types of educational technologies have been used to make the process of STEM education easier and more effective both for students and educators.
While Virtual Reality (VR) is thought of as any 3D virtual environment (3DVE) that can be presented on Head-Mounted Display (HMD), desktop, and mobile devices, it has historically been associated with HMD devices. More recently, and in this paper, HMD-based VR is referred to as immersive VR (IVR). VR is a potentially suitable tool to create realistic simulations where users get the opportunity to conduct experiments in a safe and inexpensive 3D virtual environment (3DVE) [1,2]. Some of its many advantages [3] are realistic simulation and visualization, a high level of interactivity (including natural body movement/hand gestures), flexibility and customization for accessibility and inclusion, and immersive presence [4,5].
Despite the advantages of VR in providing visualization and interactivity, a review of the current literature (see Section 2) shows that the use of VR technology in STEM education is under-investigated and faces challenges such as a lack of clear evidence of the efficacy of VR in STEM education [1,2,6,7], VR experiences that are not rooted in pedagogical methods and curriculum-based content (Pirker et al., 2019) [8], limited studies on the effect of various interaction types [2,9] and accessibility issues [10]. As a result of these and other technical and logistic constraints, VR has not become a mainstream part of STEM education [11,12]. To address these challenges, and in response to the growing need for virtual environments for safe hands-on experiential learning after the COVID pandemic, we have designed a study in chemistry to investigate how different learning materials and tasks can be experienced in VR and through different interaction types. We used educational theories most relevant to virtual learning environments to design the VR learning experiences [2], including Constructivism, Cognitivism, Scaffolding, and Experiential and Guided Learning, which are discussed in Section 3. We compared the traditional method of teaching a fundamental course concept using text and 2D content for our control group in comparison with two corresponding test groups, using varying interactive VR experiences within the 3D environment. Our aim is to compare the usability and learning outcomes of traditional teaching methods with VR, and to assess if any of the interaction methods are advantageous in terms of either content, activity, or both. In the following sections, we briefly review the literature, showing existing gaps that justify our research, then describe our method and experimental results, followed by a discussion and concluding remarks.
2. Related Work
2.1. Characteristics of STEM/Chemistry Education
A closer look at STEM education and lessons reveals that they are rooted in a hands-on, inquiry-based approach. We can categorize some of the specific characteristics of an ideal STEM education [13] as follows:
- It requires hard-to-set-up infrastructure, equipment, and safety procedures;
- The content/subject matter is complex;
- It may require extra skills and abilities (such as spatial skills) to be able to visualize and understand the concepts;
- It involves active learning/learners’ engagement.
As a complex field of study, chemistry deals with many abstract concepts that are challenging without the use of analogies or models to improve students’ conceptual understanding. In chemistry education, we can see all elements listed above, such as the existence of complex and abstract concepts, the need for spatial skills, 2D/3D representation, physical models, and required laboratory experiments in teaching/learning processes. Organic chemistry, as a subdiscipline of chemistry, involves the study of the structure, composition, reactions, and properties of organic materials, specifically different forms of carbon-containing compounds. Mastering this subject presents several challenges for students due to the abstract nature of the concepts that are often presented to them in flat, two-dimensional (2D) formats [14]. It is a challenge for instructors to successfully communicate these complex concepts, as in many cases, traditional text-based and 2D methods are still being used from textbooks that have not dramatically changed in the last five decades. Spatial-visualization skills are essential to help students connect complex chemistry representations to conceptual and symbolic knowledge. As a result, when students are faced with complex representations of organic molecules, they begin to lose the motivation to learn.
Traditionally, 2D figures or 3D representations in the form of physical models, such as ball-and-stick molecular-model kits have been used to help students observe and visualize molecular structures. However, studies show that using 3D models is a more effective learning tool compared to the 2D representation of chemical concepts [15]. 3D spatial visualization combined with interaction, as offered by VR, seems to be a suitable combination for addressing the special needs of several domains of STEM education, including organic chemistry.
2.2. VR for STEM/Chemistry Education
Significant advantages of VR such as immersion (even on non-HMD devices), visualization, and interactivity, in addition to its affordability in recent years, have made VR an attractive option for STEM education and other types of hands-on and experiential learning. Even prior to the recent widespread use of VR, researchers had investigated its potential in learning, especially in STEM, thanks to the match between its advantages and the special needs of STEM education [16,17]. More recently, studies have shown this potential through the immersive interactive simulation of STEM activities [2,6,8]. It has been shown that VR can be helpful in offering more student engagement and satisfaction [2]. These studies have also pointed out possible learning advantages, but the results have not been conclusive [11,12], and studies have been limited in terms of the type of learning material and interactions. We discuss significant examples of using VR in STEM, particularly chemistry, in this section.
Several reviews [2,18] emphasize virtual technology’s educational advantages, such as enhancing students’ academic, social, collaborative, psychomotor, and cognitive skills. VR’s benefits extend from desktop devices to AR/VR headsets and 360-degree videos. Its challenges encompass content creation aligned with learning theories, accessibility, scalability, and technological limitations, necessitating further research.
VR has been shown to allow for better visualization, hands-on learning, and improved engagement. Atomic structure [19], the water cycle in nature [20], electronic micro-systems [16], and the CNC milling machine [17] were among the early small-scale pilot studies that use virtual laboratory concepts and make a comparison between VR and text/2D-based content. The authors point out the difficulties teachers face with the motivation, engagement, and learning outcomes of students in STEM subjects. Most of these early studies use desktop VR and have limited curriculum-based learning activities. Their focus is primarily on usability and increased engagement with limited investigation of actual learning and the potential for improving it, as measured through knowledge tests, problem solving, and other methods. Pirker et al. [8] discuss this shortcoming in the context of a VR-based physics lab and identify the need for further studies and specific learning and pedagogical support.
Additionally, experimental projects by Parong and Mayer [21] and Elme et al. [1] compared immersive VR to desktop slideshows for teaching biology and explored generative-learning strategies in VR lessons, with evidence of improved learning. Wang et al. [6] demonstrated student receptiveness to VR in electronics courses. Further curriculum-based studies are required to assess the impact of IVR, particularly in combination with learning strategies, and to evaluate IVR usability, especially regarding accessibility and inclusion [10,22].
In the context of chemistry education, a few researchers have focused on the usability of VR simulations [23,24,25]. It has been shown that VR-based learning modules can be perceived as efficient tools for learning [23,25,26] and can improve student engagement and satisfaction [7,27]. In terms of objectively measured learning effectiveness, the results have not been conclusive. Some studies [23,27,28] show that VR-based approaches have been successful in improving short-term and long-term learning (commonly measured through knowledge tests compared to text and 2D-based ones). Hu-Au and Okita [28], for example, compared VR with a real-life lab experience and concluded that “Overall, learning performance was comparable across the two conditions, except in applying knowledge, where only VR participants showed a significant increase in their scores”. They also found some evidence suggesting VR may encourage reflection on the content and laboratory safety. Some other studies [6,7] could not find a significant difference between those two approaches.
These inconclusive findings suggest that further research with a better implementation of educational content and approaches may be needed to investigate VR and its role as a learning tool in STEM education [28], despite the evidence of improved engagement. In particular, it is important to investigate whether contradictory results could be due to the effect of activity or interaction types. Also, the effect of novelty or “wow” factor [29] should be considered in the increased engagement.
The restrictions caused by the COVID-19 pandemic increased the interest in setting up virtual labs and other uses of VR in STEM education [23,24]. As a result, the industry has seen a few companies that now offer virtual solutions for general collaboration, training, and STEM education. Among them, we can mention Labster (https://www.labster.com, accessed on 14 May 2023), LearnBrite (https://www2.learnbrite.com, accessed on 14 May 2023), Virbela (https://www.virbela.com, accessed on 14 May 2023), Immersed (https://immersedvr.com, accessed on 14 May 2023), and Mozilla Hubs (https://hubs.mozilla.com, accessed on 14 May 2023). A detailed review of these products is beyond the scope of this paper. They offer general-purpose VR environments and, in some cases, pre-made and (to a certain level) customizable labs and STEM experiences. Some of the issues with these tools include restricted interactions, the cost of educational development, and a lack of proper Application-Programming Interfaces (APIs) for data collection.
More recent studies on the use of VR in STEM try to use these newly available 3D VR platforms for better interactions and use some well-known learning theories as the basis for designing VR experiences. For example, Zhao et al. [30] used a generative learning strategy and Elme et al. [1] used self-explanation techniques to investigate the use of immersive VR in teaching biology. Their reliance on simple prototypes or existing limited VR products reduces their ability to have flexible interaction and free lab customization. These products also lack proper and customizable data collection that is essential in the assessment and guidance of students. But these examples demonstrate the potential for using customized VR experiences and motivate educational theory-based experience design.
2.3. Summary and Gap Analysis
The review of the literature on the educational use of VR, especially in STEM, shows that researchers have found evidence that VR-based approaches can offer more engaging and attractive learning environments [2] although most studies have focused on short-term effects and are affected by the device’s novelty [29]. The research suggests that VR has the potential to improve usability and accessibility [10], thus making STEM education more inclusive. Despite these findings, our review of the recent literature shows that the learning potential of VR in STEM still requires investigation.
Open areas of research regarding the learning potential of VR include, but are not limited to, the following research questions:
- Can using VR and authentic visualization (using ball–stick models) improve learning compared to two-dimensional (2D/text-based) content? More specifically, what is the effect of learning activity or subject-matter type on the success of VR-based learning?
- What is the effect of different VR-interaction techniques on learning and overall learner experience?
- What is the effect of immersion through HMD devices compared to desktop and mobile VR?
- What is the effect of realistic simulations of labs and other environments on learning compared to more limited virtual solutions?
- How can specific curriculum-based content be implemented in VR?
- How can learning theories and pedagogical methods be implemented in VR?
- How does VR help with performance and learning evaluation?
The research presented in this paper aims to offer initial answers to questions 1 and 2.
3. Study Design
3.1. Overview and Experience-Design Principles
Ethics approval for this study was provided by the Institutional Research Ethics Board. In the following sub-sections, we briefly review the basic concepts of the study and then describe the design in terms of its participants, material, and procedure.
3.1.1. Research Questions and Variables
Our literature review has identified gaps in the research on how immersive virtual environments and interactions affect the learning process. Therefore, this study aims to investigate the effect of using immersive virtual reality and authentic three-dimensional visualization on learning in the context of chemistry education. This study also examines the impact of interaction types on user experience and learning outcomes focusing on the use of relevant and curriculum-based content. The goal was to measure user knowledge through standard methods of knowledge tests, surveys, and in-app data. Our specific research questions are the following: (1) Can using VR and authentic visualization improve content learning compared to two-dimensional text and images? (2) Can flexible interaction types impact efficiency, accuracy, and learning outcomes? Alternative methods of content presentation, such as on a tablet or using physical models, were not considered due to the scope of the study.
Our study used the introductory concept of “orbital hybridization” in chemistry education as the learning task. We used the learning context as the independent variable with 2D and VR (with two interaction types) as possible values. Table 1 shows our dependent variables (comparison factors), related research questions, and the type of data and instruments used to answer them.

Table 1.
Research questions and variables.
3.1.2. Interactions
In this context, we consider interaction to be a set of actions and operations that allow users to manipulate, explore, and understand the virtual environment, which includes the tasks to be conducted. VR devices are generally manufactured based on the general assumption that all users can use both hands and their fingers to manipulate virtual artifacts. Thus, special consideration should be given to the types of interactions and tasks designed and implemented in virtual environments. Using a hand avatar, we created touch, grasp, move, press, and drop interactions for the Oculus touch controller (Figure 1) to interact with 3D objects.
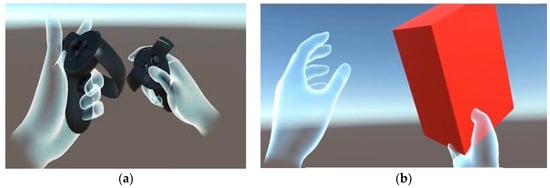
Figure 1.
Oculus Touch controller + hand avatar. (a) The touch controller is visible; (b) the touch controller is not visible.
Interactions with objects include selection, grasping, and navigating in IVR using the Oculus handheld controllers. To minimize the complexity of interactions, the main roles of grasping objects and teleporting were assigned to two main buttons on both controllers, i.e., the grip button and the trigger button. Since the buttons are activated on both controllers, users could easily interact with objects regardless of their handedness.
3.1.3. Specific Application of Learning Theories
Although a variety of theories have been utilized in previous VR studies, we have identified and collected some of the most relevant and frequently used theories and have applied them directly to our VR experiences:
- Constructivism [31] and Experiential Learning [32]: Related to each other, these theories state that the learner builds knowledge rather than receiving it, and does so through their experience of the world. Our high-fidelity immersive VR experience allows learners to simulate real-world situations and problems, simulate real-world spatial navigation and interaction, and attempt to solve problems. For example, stacking cubes or finding objects and operating equipment are tasks used in our VR environment;
- Cognitivism [33]: To reduce cognitive load, we have limited the amount of information presented in the virtual lab to only what is necessary at a given time. Users can choose to reveal or hide extra information as needed;
- Scaffolding [34]: We have utilized this theory to gradually increase the complexity of the VR environment as learners progress. Starting with a lower fidelity simulation, learners are directed to focus on the most important elements and gradually build their skills in interacting with objects and navigating the environment;
- Guided Learning [35]: To make the information more manageable, we have divided the activities into smaller segments and presented them in separate stations. Complex procedures and related information are also broken into smaller texts and are hidden in popup/dialogue boxes, only revealed when users point to or hover over them. To enhance the learning experience, we have incorporated voice instructions, in-app quizzes, tests, and highlighting features for interactable elements to guide the learner through each step.
While we applied these theories to improve overall learning, our current study does not aim at validating and investigating the specific effect of each of these theories or the mechanisms used to implement them in our VR experiences. Further studies are required to see how each of these theories and mechanisms affect learning in VR.
3.2. Participants
The participants were undergraduate university/college students (first-year chemistry or other science fields). They were recruited through social media, on-campus ads, and email lists at our universities and VR-related communities. The inclusion criteria were that participants should be able to use the Internet and be willing to use a VR headset (no previous experience was required). In compliance with the COVID restrictions, this study was initially conducted remotely (at participants’ homes with equipment drop-off and pick-up for participants who did not have headsets). During a COVID relaxation period, a number of headsets were dropped off at a university campus and volunteers were observed while conducting the VR experiment. The data reported herein pertain to users who conducted the VR experiments in person with the researcher(s) present. The mixed participation followed our approved research-ethics protocol. In total, thirty (30) participants were recruited and divided into three distinct groups:
- Group A, 10 participants (text-based group);
- Group B1, 10 participants (IVR, interaction type1);
- Group B2, 10 participants (IVR, interaction type2).
Participants in Group B1 used natural hand gestures and body movements to select, grasp, or place/dock 3D objects (Figure 2a). Participants in Group B2 used a laser beam (ray-cast), to interact with 2D buttons and to select and trigger the action to place/dock 3D objects (Figure 2b). The groups were not mixed nor were the same interactions listed above, repeated among the different groups. The data reported are for one group of 30 participants, divided into the aforementioned groups, and not a composite of many groups.
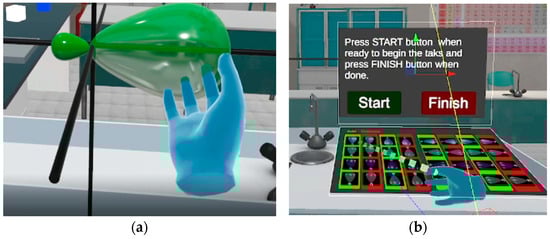
Figure 2.
Interaction types in VR. (a) Hand interaction and (b) ray casting.
In total, 15 of the participants were females and 15 were males, with 2 being left-handed vs. 28 being right-handed. The participants received a $CAD10 gift card as a token of appreciation for their participation in the study.
3.3. Material
3.3.1. Base VR Experience
Based on a set of specific educational theories described in Section 3.1.3, a realistic virtual environment similar to the physical lab environment (Figure 3) was built to enable learners to feel that they were in an authentic lab or classroom setting. Our proposed experiment was designed to show a chemistry classroom with separate desks, where each task was conducted. This virtual environment provided an alternative to the physical classroom to make distance learning possible, particularly during events such as the recent pandemic.
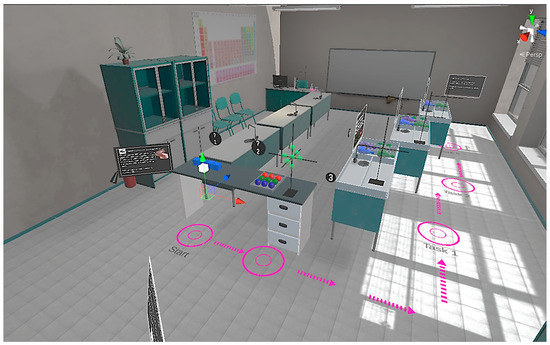
Figure 3.
VR experiment areas.
The base virtual environment was built for a chemistry classroom using Unity 3D, a popular game engine used to build 2D, 3D, and VR games and experiences. The resulting experience can be modified and exported for different platforms, including desktop, mobile, and Head-Mounted Displays (HMDs). Due to the practicality and feasibility of the Android-based mobile headset, the Oculus Quest V.1 device (by Meta) was selected as the device of choice for the immersive VR experiment. To minimize the production time, a variety of ready-made assets were acquired from Unity 2019 and third-party asset stores. Other 3D objects were modeled using Autodesk 3Ds Max (version 2013) software.
3.3.2. Curriculum-Based Content
One of the gaps identified in the literature was a lack of curriculum-specific content in VR studies. Therefore, this study was designed to address this gap by assessing the effect of authentic visualization and interaction types on learning specific curriculum-based scientific concepts. A use-case scenario of “sp, sp2, and sp3 orbital hybridization” in chemistry education was selected to create this experiment and to collect data for analysis. This study is more focused on the interaction and learning effect of VR by using relevant and curriculum-based content using two methods for depicting and simulating chemistry concepts: (a) orbital diagrams and (b) Lewis structure.
In chemistry education, both orbital diagrams and Lewis structures are used to represent the arrangement of electrons around atoms of molecules, utilizing the concept of orbital hybridization. Orbital diagrams show the three-dimensional arrangement of electrons in hybridized atomic orbitals based on the valence shell electron pair repulsion (VSEPR) theory. This 3D arrangement makes orbital diagrams very interactive when replicated and modeled in a 3D environment. Lewis structures, on the other hand, show the two-dimensional arrangement of electrons in hybridized atomic orbitals of molecules and are less interactive. Both methods are frequently used to explain the 3D shapes and chemical structures of molecules in a way to visually explain such concepts. Overall, they are complementary tools that help students understand the electronic structures of atoms in molecules.
Using such curriculum-specific simulation provided a better method of understanding and measuring the efficacy of the VR experiment.
3.3.3. Knowledge Test
The knowledge test was designed to measure participants’ knowledge about hybridization, after being divided into groups, as described in the next section. This allowed us to collect and compare the results between the groups.
This test consisted of nine questions including age, handedness, gender, and prior experience with immersive VR. Three questions were specific to the course content presented to them by 2D text and VR simulation. Each question had two parts, (a) for the orbital diagram, and (b) for the Lewis structure. Participants were given a paper version of the knowledge test and asked to draw the orbital diagram of three compounds: BeCl2, BF3, and NH4+.
We included two final questions based on a Likert scale:
- Rate the following question from 1 to 5 (1 = strongly disagree to 5 = strongly agree)
- ○
- This VR visualization helps to understand the hybridization concept (angles) better compared to what I read in the textbook.
- Which of the following statements is agreeable to you?
- ○
- My test score would improve if I had a chance to complete the VR experiment before taking the knowledge test;
- ○
- Completing this VR experiment before the knowledge test would not help me to score better.
3.3.4. Usability Survey
To collect subjective data, our usability survey included questions on ease of use, memorability, learnability, pleasantness, clarity, visualization, and overall satisfaction, to be rated on a scale of 1–5 (1 being very negative and 5 being very positive). These questions are selected based on common usability criteria [36].
3.4. Procedure
3.4.1. Overview and Hypotheses
A tutorial section was designed and developed to help VR users learn how to use handheld controllers that are used to interact with objects and the environment in the VR platform. Upon the start of the VR experience, a four-digit code would be automatically generated and assigned to each participant. They would use this code to complete the post-experiment knowledge test and survey.
For this study, we defined three hypotheses to test:
- Group A (2D text and images) will have a lower test score compared to Groups B1 (VR interaction type 1) and B2 (VR interaction type 2). This outcome is hypothesized due to the perceived complexity of the concepts and the lack of visualization features in text-based content vs. the visualization capability VR would be providing for the other two groups;
- Group B2 will perform better in terms of efficiency and accuracy compared to the other two groups. We expect this to happen due to the nature of ray-cast features vs. hand–body gesture interactions, which is more user-friendly in VR environments (even though the hand gestures may seem more natural);
- Usability test scores for Group B2 will show higher rates for ease of use and overall satisfaction, due to the use of VR and the interaction of type 2, which is expected to be easier.
3.4.2. Tasks for Group A (Text-Based)
Each participant was given two pages of text and 2D-image content. They were expected to take 20–30 min to read the content. The goal was to see if participants would be able to remember the proper angles and hybridization for each type of molecule. After the reading session, they completed a written knowledge test based on what they had read. They were asked to complete the VR experience using a headset and along with an online survey, only after having completed the knowledge test. This was only to allow this group to experience VR, and discuss how they felt compared to using the text-based content instead of VR.
The user journey for Group A included the following tasks:
- Read the two-page lesson content related to the hybridization topic (Supplementary Materials S1, D);
- Complete a knowledge test;
- Complete the VR experiment interaction type 1, detailed in the next section. Due to the small group sizes, we did not divide Group A into two sub-groups for type 1 and 2 for the VR tasks. Group A with type 1 was used as a comparison group;
- Answer an open-ended question about how they felt in VR and if they thought it would enhance their learning if it had been made available to them before taking the knowledge test.
3.4.3. Tasks for VR Groups
VR groups were given 3D models (Figure 4) on a table in a virtual lab and were asked to arrange molecules with correct angles based on the information presented to them. Participants in both VR groups were asked to follow sequential steps in VR to learn the same content as Group A, which was related to the topic of hybridization. This information was presented in VR through a combination of interactive content, popup text, and voice recordings. After the completion of the VR experience, they were asked to complete the same knowledge test (as Group A) and a usability survey.

Figure 4.
3D models of molecules.
Table 2 shows each task along with the expected correct answers for the post-experiment knowledge test. The goal of these tasks was to help participants learn the same course material and understand the hybridization and proper bond angles for each molecule, by placing each 3D object on the stand with the correct bond angles (task 1 requires 180-degree placement, task 2 requires 120-degree placement, and task 3 requires 109-degree placement). The snapping feature is enabled on each stand for multiple axes to challenge participants to reinforce the correct angle.
Table 2.
VR group task and expected correct answers.
3.4.4. Group B1—VR (Interaction Type 1)
Participants in this group would start with the VR experience. They would complete a tutorial activity to learn how to use hand-held controllers and interact with objects by stacking 3D cubes on top of each other, picking up sphere-shaped objects and placing them on a stand with a predefined drop zone. They would also read the description of hybridization through popup windows. This activity was designed to help participants learn how to use the buttons on hand-held controllers to interact and navigate the scene, and provide the needed theoretical knowledge about the topic in an interactive manner. Figure 5 shows users’ journey for Group B1.
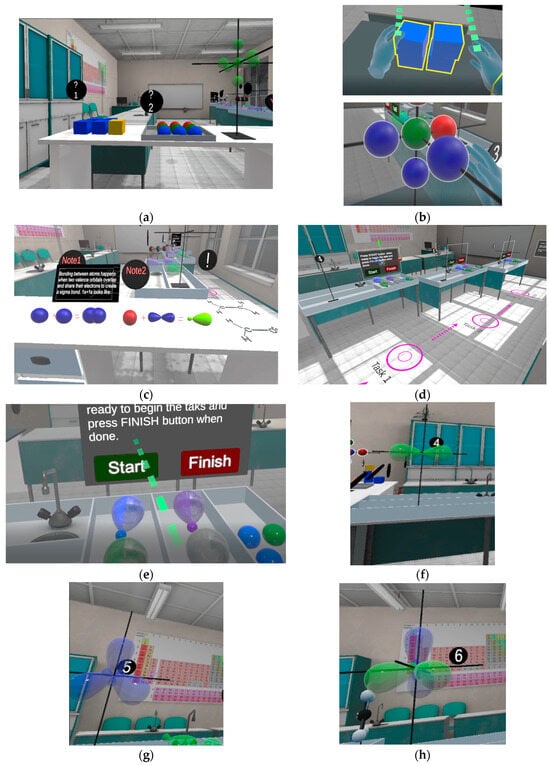
Figure 5.
The user’s journey for Group B1. (a) The user lands in the VR classroom and is asked to complete a tutorial, as shown by Tasks 1 and 2. The goal here is to help participants learn how to use VR controllers. (b) Task 1 (top) is to stack cubes and task 2 (bottom) is to attach the balls to the stand. (c) The user learns curriculum-based content in VR. (d) The user moves to the area for tasks 1 to 3 (marked on the floor). (e) The user picks up 3D objects (top) and attaches the molecules to the correct axis based on the information provided to reinforce learning. (f) The user builds sp hybrid orbitals (linear). (g) The user builds sp2 hybrid orbitals (trigonal planar). (h) The user builds sp3 hybrid orbitals (tetrahedral). Numbers indicate the order of tasks to be completed by user.
3.4.5. Group B2—VR (Interaction Type 2)
Participants in this group were expected to complete similar tutorial activities and main tasks to VR Group B1. The procedures and tasks for this VR group were identical to VR Group B1, except for the interaction technique. While the tasks were still object selection, manipulation, and docking, the method of interaction was different from the previous VR group, as participants used ray-casting to interact with 2D buttons in VR for automatic object placement instead of using the hand controllers. They used a ray-caster to point to a 2D representation of a 3D object with the proper angle and use the trigger button on the controller to place the object on a pre-defined axis. Figure 6 shows the user journey for Group B2.
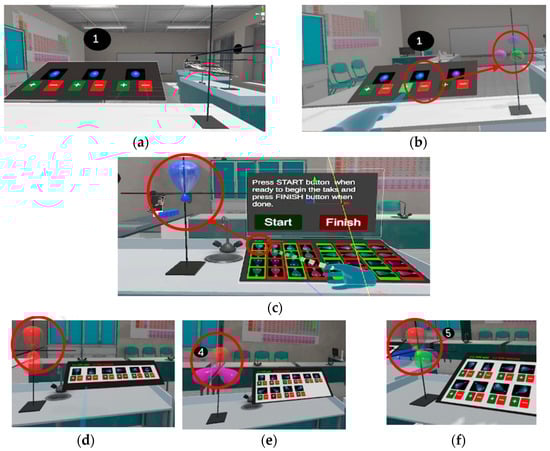
Figure 6.
The user’s journey for Group B2. (a) The user lands in the VR classroom and is asked to complete a tutorial activity. (b) The user points to a 2D representation of a 3D object and uses the trigger button on the controller to place the object on a pre-defined axis. (c) An orbital is placed on the proper axis by pointing to a 2D representation of it using a ray-caster and the trigger button. (d) The user builds sp hybrid orbitals (linear) as indicated in the circle. (e) The user builds sp2 hybrid orbitals (trigonal planar) as indicated in the circle (f) The user builds sp3 hybrid orbitals (tetrahedral) as indicated in the circle. Numbers indicate progression of tasks for the user.
4. Results
4.1. Orbital and Lewis Structure
4.1.1. For BeCl2
The knowledge-test score differences for the compound BeCl2 were investigated between the three different groups. Given the non-normality of the data, a non-parametric approach was adopted to investigate the differences between groups. Non-parametric methods are used when the data did not have a normal distribution or when we were using ordinal data such as the Likert scale and non-numeric labels.
A Kruskal–Wallis test (non-parametric alternative to a one-way ANOVA) was carried out and based on the results; it was noted that there was a significant difference (p < 0.05) between the different groups for the orbital-diagram knowledge test. A post hoc test was carried out to ascertain the differences that existed within the three different groups. Based on the result of the test, it was noted that there was a significant difference (p < 0.05) between “Group A and Group B1” and “Group A and Group B2”, whilst for “Group B1 and Group B2”, there was no significant difference noted. As seen in Figure 7, the distribution in Group B1 and Group B2 was higher than in Group A. This shows that in the knowledge test for the orbital diagram of BeCl2, the VR groups performed better concerning the completion rate compared to the text-based group.
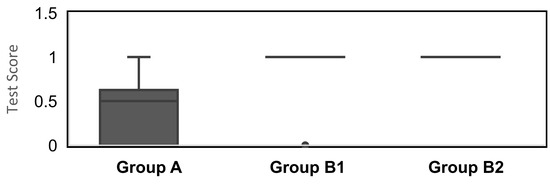
Figure 7.
Box plot showing the distribution differences between groups for the orbital-diagram knowledge test of BeCl2.
A Kruskal–Wallis test was also carried out to assess the differences in completion levels for the three different groups in the Lewis-structure knowledge test. Based on the result, it was noted that there was no significant difference (p > 0.05) in the distribution between the different groups for the Lewis structure knowledge test. This shows that all the groups performed similarly concerning the completion level and accuracy on the Lewis-structure knowledge test. Table 3 shows the summary of the completion rate in three groups for BeCl2.
Table 3.
Descriptive summary of completion rate for the three different groups for the BeCl2 orbital diagram and Lewis structures).
4.1.2. For BF3
In this section, the differences in knowledge test scores for BF3 between the three different groups were investigated. Given the non-normality of the data, a non-parametric approach was used to investigate group differences. A Kruskal–Wallis one-way ANOVA was performed, and the results revealed a significant difference (p < 0.05) between the different groups for the orbital-diagram knowledge test. A post hoc test was performed to determine the differences between the three different groups. Based on the result of the test, it was noted that there was a significant difference (p < 0.05) between “Group A and Group B1” and “Group A and Group B2”, while there was no significant difference between “Group B1 and Group B2”.
As seen in Figure 8, the distribution in Group B1 and Group B2 is higher than in Group A. This shows that in the knowledge test for the orbital structure of BF3, the VR groups performed better concerning the completion rate compared to the text group.
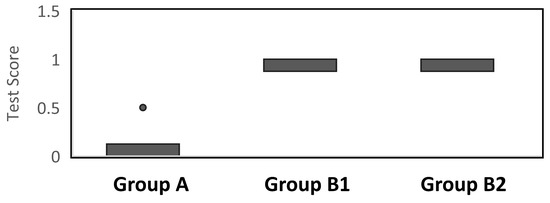
Figure 8.
Box plot showing the distribution differences between groups for the orbital-structure knowledge test of the BF3).
For the Lewis structure knowledge test for the compound BF3, a Kruskal–Wallis test was also performed to determine the differences in the completion rate for the three different groups. According to the findings, there is no statistically significant difference (p > 0.05) in the distribution between the different groups for the Lewis structure knowledge test. This demonstrates that all the groups performed similarly on the Lewis structure knowledge test for the compound BF3 in terms of completion rate, as seen in Table 4.
Table 4.
Descriptive summary of completion rate for the three different groups for the BF3 compound.
4.1.3. For NH4+
In this section, the differences in knowledge test scores for NH4+ between the three different groups were investigated. Given the non-normality of the data, a non-parametric approach was used to investigate the differences between the groups. A Kruskal–Wallis one-way ANOVA was performed, and the results revealed that there was no significant difference (p > 0.05) between the different groups for the orbital-diagram knowledge test for the compound NH4+. This indicates that all the groups performed similarly in terms of completion type on the orbital diagram knowledge test for the compound NH4+.
A Kruskal–Wallis test was also performed to determine the differences in completion rate between the three groups in the Lewis structure knowledge test for the compound NH4+. According to the results, there is no significant difference (p > 0.05) in the distribution of the Lewis structure knowledge test between the different groups. This demonstrates that all the groups performed similarly on the Lewis knowledge test for NH4+ in terms of completion rate, as seen in Table 5.
Table 5.
Descriptive summary of completion rate for the three different groups for NH4+.
4.2. Efficiency and Accuracy
4.2.1. Efficiency and Accuracy Differences between Groups for Task 1 (BeCl2)
The normality of the efficiency and accuracy data for task 1 was first investigated to determine the most appropriate statistical approach. Based on the results, it was noted that the data for both variables are normally distributed, thus a parametric statistical approach was favored. Given that the objective of this section is to evaluate the differences in duration and accuracy between the three different groups for task 1, a one-way ANOVA test was carried out. From the results, it was noted that there is no significant difference (p > 0.05) in duration between the groups for task 1 and no significant difference in the (p > 0.05) accuracy percentage between the groups for task 1 (Figure 9).
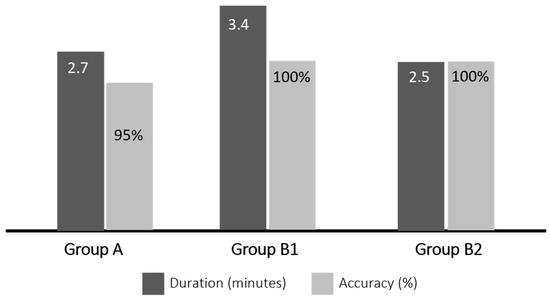
Figure 9.
Bar chart showing the duration (left) and accuracy (right) differences between the three different groups for task 1.
4.2.2. Efficiency and Accuracy Differences between Groups for Task 2 (BF3)
Similar to task 1, the normality of the efficiency and accuracy data for this task was first investigated to determine the appropriate statistical approach. Based on the findings, it was determined that the data for both variables are normally distributed, thus a parametric statistical approach was preferred. Given that the goal of this section is to compare the differences in duration and accuracy between the three groups for task 2, a one-way ANOVA test was performed. According to the findings, although Group B2 performed faster with more accuracy (Figure 10), there is no significant difference (p > 0.05) in task 2 duration between the groups, and no significant difference (p > 0.05) in task 2 accuracy percentage between the groups.
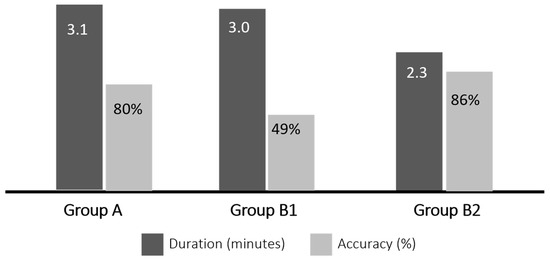
Figure 10.
Bar chart showing the average duration (left) and accuracy (right) differences between the three different groups for task 2.
4.2.3. Efficiency and Accuracy Differences between Groups for Task 3 (NH4+)
The normality of efficiency and accuracy data was first investigated for this task to determine a proper statistical approach. Based on the results, it was noted that the data for both variables are normally distributed, and thus a parametric statistical approach was favored. Given that the objective of this section is to evaluate the differences in duration and accuracy between the three different groups for task 3, a one-way ANOVA test was carried out. From the results, it was noted that there is a significant difference (p < 0.05) in duration between the groups for task 3. To ascertain where the differences occurred, a Bonferroni correction post hoc test was carried and based on the result; it was noted that there is no significant difference (p > 0.05) in the completion duration between “Group A and Group B1” and “Group B1 and Group B2” while a significant difference (p < 0.05) was noted between the “Group A and Group B2”.
Since, during the VR usability study, participants of Group A used the interaction-type-1 environment (similar to Group B1), this difference makes sense considering hypothesis 2. As seen in Figure 11, Group B2 has a significantly shorter duration than Group A in task 3 completion. Regarding the accuracy differences, a one-way ANOVA was carried out, and it was noted that there is no significant difference in the (p > 0.05) accuracy percentage between the groups for task 3.

Figure 11.
Bar chart showing the average duration (left) and accuracy (right) differences between the three different groups for task 3.
4.3. Usability
Memorability: the non-parametric Kruskal–Wallis test found no significant difference (p > 0.05) in group memorability scores (Figure 12).
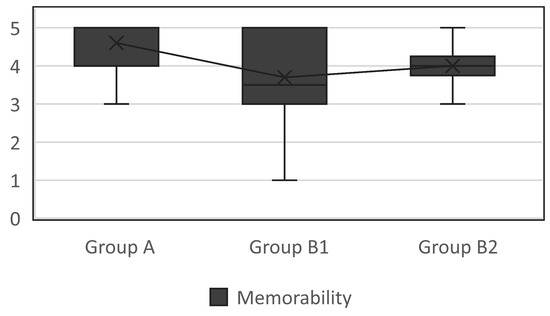
Figure 12.
Box plot showing the distribution of the memorability score (Likert scale: 1—very negative; 5—very positive).
Learnability: similar findings were found in the learnability section, as the groups had no significant difference between them (p > 0.05, Figure 13).
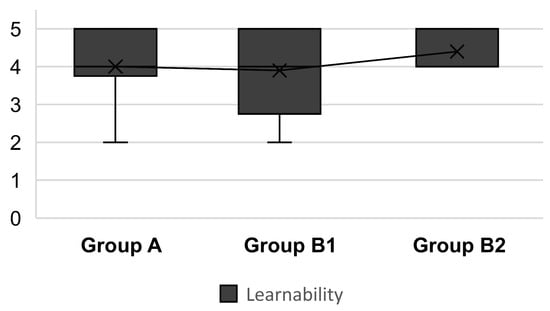
Figure 13.
Box plot showing the distribution of the learnability score by groups (Likert scale: 1—very negative; 5—very positive).
Pleasantness: non-parametric analysis showed no significant difference (p > 0.05) in pleasantness among groups (Figure 14).
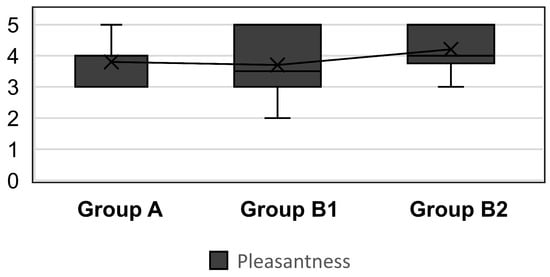
Figure 14.
Box plot showing the distribution of the pleasantness score by groups (Likert scale: 1—very negative; 5—very positive).
Clarity: non-parametric test indicated no significant difference (p > 0.05) in clarity among groups (Figure 15).
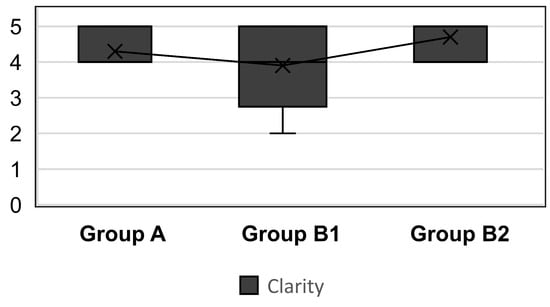
Figure 15.
Box plot showing the distribution of the clarity score by groups (Likert scale: 1—very negative; 5—very positive).
Visualization: Similar to previous sections, no significant difference (p > 0.05) was found among groups in visualization (Figure 16).
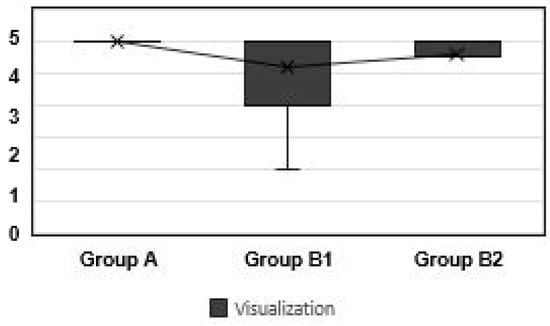
Figure 16.
Box plot showing the distribution of the visualization score by groups (Likert scale:1—very negative; 5—very positive).
Ease of use: non-parametric analysis revealed no significant difference (p > 0.05) among groups in ease-of-use perception (Figure 17).

Figure 17.
Box plot showing the distribution of the ease-of-use score by groups (Likert scale: 1—very negative; 5—very positive).
Overall satisfaction: consistent with other aspects, no significant difference (p > 0.05) among groups in overall satisfaction (Figure 18).
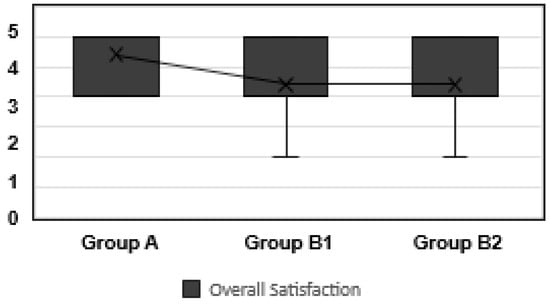
Figure 18.
Box plot showing the distribution of the overall satisfaction score by groups (Likert scale: 1—very negative; 5—very positive).
On the question of rating the statement “This VR visualization helps to understand the hybridization concept better compared to what I read in the text” (Q9), the normality was assessed using the Shapiro–Wilk test. From the results of the test, it was noted that the data are normally distributed. (Table 6). Therefore, a parametric approach was adopted to assess the differences between the three groups for this question. The difference in the groups was analyzed using a one-way ANOVA.
Table 6.
Rating VR experience on the understanding of concepts (compared to 2D text).
The f-ratio value is 0.23841, and the p-value is 0.78952. For this question, it was noted that the result is not significant at p < 0.05, indicating that all groups had a similar perception of the effect of VR on their understanding of the concept compared to the text.
Higher scores indicate that most of the participants agree with the statement that VR helps them to understand the concept better than text (Figure 19).
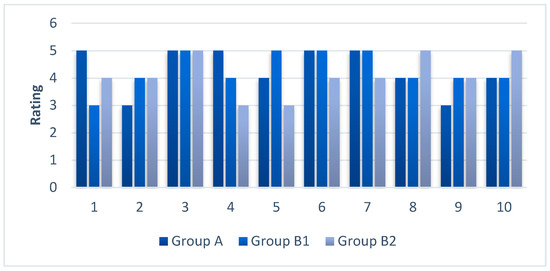
Figure 19.
Ratings for the effect of VR on participants’ understanding for 10 participants of each group.
5. Discussion
5.1. Summary of Findings
5.1.1. Hypothesis 1: The Effect of VR on Learning
Considering test scores and analyzed data as detailed in the Results Section, there were a few significant differences between Group A and B1 as well as Group A and B2 concerning the orbital-diagram and Lewis structure questions. These differences indicate that VR played a significant role in helping participants to answer orbital diagram questions more accurately, where 3D visualization is essential to understand and remember the concept due to the needed spatial skills.
However, there was no significant difference between the responses of groups B1 and B2 (VR groups) for most tasks, despite the different interaction type, although interaction type 2 (ray-caster) performed slightly better in terms of efficiency and accuracy.
This confirms H1 on orbital-diagram questions, unlike in the case of Lewis structure questions, between the three groups. This could be due to the insufficient interactive content developed within the VR for the Lewis structure topic (i.e., it was a more passive feature showing the Lewis structure to users rather than making them interact with or build the structure). Figure 20 showcases the presentation of the Lewis structure as a passive, non-interactable image in the virtual lab.

Figure 20.
Lewis structures (images in circles) were presented as passive images.
To answer the first research question on learning in VR (Section 3.1.1), we can deduce that using VR and authentic visualization has improved learning outcomes compared to 2D/text-based content.
5.1.2. Hypothesis 2: For Efficiency (in Tutorial Tasks)
There was a significant difference between the three groups in terms of the tutorial-task completion. Group B2 (interaction type 2) completed the task faster compared to the other groups. This confirms H2, that Group B2 with the ray-casting interaction technique would perform faster with a higher accuracy.
For the efficiency and accuracy of task 1 (BeCl2 molecule): Group B2 completed the task faster (in 2.6 min vs. Group B1 with 3.4 min and Group A with 2.7 min). Group B1 and B2 also performed this task with 100% accuracy vs. 95% for Group A. However, this does not show a significant difference (statistically), which could be due to the small sample size.
For the efficiency and accuracy of Task 2 (BF3 molecule): Similar to task 1, Group B2 completed this task in a shorter time (2.3 min vs. 3.0 min for Group B1 and 3.1 min for Group A), with 86% accuracy, vs. 79% for Group B2 and 80% for Group A. However, it does not show a significant difference statistically, which could be due to the small sample size, as mentioned above.
For the efficiency and accuracy of task 3 (NH4+ ion): There is a significant difference in the duration of task 3 between Groups A and B2 (3.1 min vs. 1.9 min). It is worth mentioning that Group A completed the VR experiment using interaction type 1, similar to Group B1 (using body and hand movements). The overall results of comparing the three groups confirms H2, that Group B2 performs faster with more accuracy, showing that the ray-casting interaction technique provides better performance and accuracy in completing the tasks.
5.1.3. Hypothesis 3. Usability and Overall Satisfaction
We expected that Group B2 (using ray-casting) would score higher; however, the result showed no significant difference between the groups using different interaction techniques. From this result, which addresses RQ #4, we noticed that the interaction technique has a direct impact on the efficiency, accuracy, and learning outcome, as seen in the results for Group B2, as we have seen that the remote interaction using ray-casting led to better results compared to the body/hand movement.
An open-ended question about users’ experiences revealed that they felt VR was “a great experience” that should be recommended and used in education. Some participants called it “amazing”, and a “very cool realistic lab”. One participant suggested including more practice questions in VR while another user commented on the level of detail and how “real” the lab looked. Some usability issues such as “teleportation” and occasional delays in teleporting were also mentioned.
5.2. Limitations
Updating software and using plugins became an issue that disabled parts of the project and required repeating some parts of the experiment. Sharing the project source files with research collaborators was another issue due to the project size and complexity of Unity and Oculus integration. It was solved by using the “Collaborate” feature of the Unity game engine.
As this study was conducted during the pandemic, COVID restrictions related to physical distancing and in-person activities made it very challenging to recruit eligible users during this time. Since most of the users did not have a VR headset, researchers had to arrange to deliver a headset to each participant with all the health-related precautions in mind.
Regarding the memorability score, the ideal condition would be to test users in a real lab scenario after a certain period of time, as seen appropriate by the instructor. However, due to the pandemic’s restrictions, this part could not be achieved, which was another limitation. Knowledge-retention tests were conducted by researchers after two weeks of a learning intervention or experience to assess the long-term impact. The retention test helps to determine whether the learned information or skills are retained over time or forgotten quickly [37].
6. Conclusions
In this study, our goal was to evaluate VR learning using a real-world curriculum and course-based content. One particularly difficult area for science students, and especially chemistry students, is the visualization of objects in 3D and the spatial arrangement of atoms in molecules. Virtual reality, with its unique ability to display abstract and complex concepts visually, and its 3D capability, interactivity, and flexibility in how things can be displayed, can provide clear visual and spatial representations of concepts that are typically difficult to visualize [25,38]. Thus, VR has a unique capacity to present science topics in novel ways, such as representations of orbital hybridizations, molecular shapes, and bond angles.
Harnessing the powerful 3D-visualization capabilities of VR, students were taught these traditional topics in VR, and our comparisons of their learning with the control groups using text and 2D images revealed that VR had a positive impact on the learning outcome, as seen in the knowledge test scores and participants’ feedback on the surveys. The results indicated that the students found the experience very engaging and helpful for understanding complex concepts of hybridization and those requiring spatial visualization. The results for the efficiency and accuracy of the performed tasks were not as conclusive, although they suggest potential task-dependent differences.
Our findings, using curriculum-based experiences, show that VR indeed offers a more engaging experience and better learning outcomes, especially for content that is more interactive. Our findings also suggest that interaction types, such as ray-casting-based selection and gesture-based object manipulation, used in our testing, can have different results on learning and usability based on the activity type. While there was no preference in the use of interaction techniques by the participants, the data collected showed that the ray-casting technique is more efficient compared to the body/hand-movement interaction technique. Our research findings have provided insights into the practicality and success of using VR to enhance students’ learning outcomes in science-based education. This study lays the foundation for applying VR in teaching challenging curriculum content, and how learning theories and pedagogical approaches can be implemented in VR, especially those requiring spatial-visualization skills, as a means of increasing student understanding and engagement with course content. Researchers can use this technology to strategically incorporate course-specific content into VR to help students better retain and later apply traditionally challenging content.
Our research contributes to a better understanding of the efficacy of VR in learning STEM and offers insights into the design of STEM VR experiences, especially for chemistry.
However, there are numerous design and development factors that need to be considered to achieve this objective. Our study has addressed some of the important aspects of effective VR implementation, but further research with larger sample sizes and different learning topics is necessary to enhance and broaden this study. Possible avenues for future research could explore more advanced STEM topics, the effect of specific pedagogical theories and mechanisms, accessibility challenges, different interaction methods, and privacy concerns in VR.
Supplementary Materials
The following supporting information can be downloaded at: https://www.mdpi.com/article/10.3390/educsci14050476/s1, Supplementary Materials S1: Text-based content for 2-D test group; Supplementary Materials S2: Post-study questionnaire.
Author Contributions
Conceptualization, S.Q., S.D., A.A. and C.J.; methodology, S.Q. and A.A.; software, S.Q.; validation, S.Q., S.D. and A.A.; formal analysis, S.Q.; investigation, S.Q.; resources, A.A.; data curation, S.Q.; writing—original draft preparation, S.Q.; writing—review and editing, S.Q., S.D. and A.A.; visualization, S.Q.; supervision, A.A. and C.J.; project administration, S.D. and A.A.; funding acquisition, A.A. All authors have read and agreed to the published version of the manuscript.
Funding
This research was funded by Ontario Centre for Innovation grant number 33593, and the APC was funded by University of Toronto Mid-Career and Promotion Fund.
Institutional Review Board Statement
The study was conducted in accordance with the Declaration of Helsinki, and approved by the Carleton University Research Ethics Board-B, Project # 116987, approved 16 February 2022.
Informed Consent Statement
Informed consent was obtained from all subjects involved in the study.
Data Availability Statement
The raw data is not available due to privacy reasons. The anonymized data presented in the analysis section of this paper are available on request from the corresponding author.
Conflicts of Interest
The authors declare no conflict of interest.
References
- Elme, L.; Jorgensen, M.L.; Dandanell, G.; Mottelson, A.; Makransky, G. Immersive virtual reality in STEM: Is IVR an effective learning medium and does adding self-explanation after a lesson improve learning outcomes? Educ. Technol. Res. Dev. 2022, 70, 1601–1626. [Google Scholar] [CrossRef] [PubMed]
- Scavarelli, A.; Arya, A.; Teather, R.J. Virtual reality and augmented reality in social learning spaces: A literature review. Virtual Real. 2021, 25, 257–277. [Google Scholar] [CrossRef]
- Steffen, J.H.; Gaskin, J.E.; Meservy, T.O.; Jenkins, J.L.; Wolman, I. Framework of affordances for virtual reality and augmented reality. J. Manag. Inf. Syst. 2019, 36, 683–729. [Google Scholar] [CrossRef]
- Alqahtani, A.S.; Daghestani, L.F.; Ibrahim, L.F. Environments and system types of virtual reality technology in STEM: A survey. Int. J. Adv. Comput. Sci. Appl. 2017, 8, 77–89. [Google Scholar] [CrossRef]
- Anthes, C.; García-Hernández, R.J.; Wiedemann, M.; Kranzlmüller, D. State of the art of virtual reality technology. In Proceedings of the 2016 IEEE Aerospace Conference, Big Sky, MT, USA, 5–12 March 2016; pp. 1–19. [Google Scholar] [CrossRef]
- Wang, W.S.; Pedaste, M.; Huang, Y.M. Designing STEM Learning Activity Based on Virtual Reality. In International Conference on Innovative Technologies and Learning; Springer: Cham, Switzerland, 2022; pp. 88–96. [Google Scholar]
- Lu, Y.; Xu, Y.; Zhu, X. Designing and Implementing VR2E2C, a Virtual Reality Remote Education for Experimental Chemistry System. J. Chem. Educ. 2021, 98, 2720–2725. [Google Scholar] [CrossRef]
- Pirker, J.; Holly, M.; Almer, H.; Gütl, C.; Belcher, J.W. Virtual reality STEM education from a teacher’s perspective. In iLRN 2019 London, Workshop, Long and Short Paper, and Poster Proceedings: From the Fifth Immersive; Verlag der Technischen Universitat, Technikerstraße: Graz, Austria, 2019. [Google Scholar] [CrossRef]
- Kim, Y.M.; Rhiu, I.; Yun, M.H. A systematic review of a virtual reality system from the perspective of user experience. Int. J. Hum.–Comput. Interact. 2020, 36, 893–910. [Google Scholar] [CrossRef]
- Mott, M.; Franco, M.; Holz, M.G.; Ofek, C.; Stoakley, R.; Morris, M.R. Accessible by design: An opportunity for virtual reality. In Proceedings of the 2019 IEEE International Symposium on Mixed and Augmented Reality Adjunct, Beijing, China, 10–18 October 2019. [Google Scholar]
- Lee, T.; Wen, Y.; Chan, M.Y.; Azam, A.B.; Looi, C.K.; Taib, S.; Ooi, C.H.; Huang, L.H.; Xie, Y.; Cai, Y. Investigation of virtual & augmented reality classroom learning environments in university STEM education. Interact. Learn. Environ. 2022, 1–16. [Google Scholar] [CrossRef]
- Pellas, N.; Dengel, A.; Christopoulos, A. A scoping review of immersive virtual reality in STEM education. IEEE Trans. Learn. Technol. 2020, 13, 748–761. [Google Scholar] [CrossRef]
- Kelley, T.R.; Knowles, J.G. A conceptual framework for integrated STEM education. Int. J. STEM Educ. 2016, 3, 11. [Google Scholar] [CrossRef]
- Gabel, D. Improving teaching and learning through chemistry education research: A look to the future. J. Chem. Educ. 1999, 76, 548. [Google Scholar] [CrossRef]
- Stull, A.T.; Fiorella, L.; Gainer, M.J.; Mayer, R.E. Using transparent whiteboards to boost learning from online STEM lectures. Comput. Educ. 2018, 120, 146–159. [Google Scholar] [CrossRef]
- Cecil, J.; Ramanathan, P.; Mwavita, M. Virtual Learning Environments in engineering and STEM education. In Proceedings of the 2013 IEEE Frontiers in Education Conference (FIE), Oklahoma City, OK, USA, 23–26 October 2013; pp. 502–507. [Google Scholar]
- Rogers, C.B.; El-Mounaryi, H.; Wasfy, T.; Satterwhite, J. Assessment of STEM e-learning in an immersive virtual reality (VR) environment. Comput. Educ. J. 2017, 8, 1–9. [Google Scholar] [CrossRef][Green Version]
- Martín-Gutiérrez, J.; Mora, C.E.; Añorbe-Díaz, B.; González-Marrero, A. Virtual technologies trends in education. Eurasia Journal of Mathematics. Sci. Technol. Educ. 2017, 13, 469–486. [Google Scholar]
- Ghergulescu, I.; Lynch, T.; Bratu, M.; Moldovan, A.; Muntean, C.H.; Muntean, G.M. STEM education with atomic structure virtual lab for learners with special education needs. In Proceedings of the 10th International Conference on Education and New Learning Technologies, Palma, Spain, 2–4 July 2018; Volume 1, pp. 8747–8752. [Google Scholar]
- Bogusevschi, D.; Tal, I.; Bratu, M.; Gornea, B.; Caraman, D.; Ghergulescu, I.; Muntean, C.H.; Muntean, G.M. Water cycle in nature: Small-scale STEM education pilot. In EdMedia+ Innovate Learning; Association for the Advancement of Computing in Education (AACE): Chesapeake, VA, USA, 2018; pp. 1496–1505. [Google Scholar]
- Parong, J.; Mayer, R.E. Learning science in immersive virtual reality. J. Educ. Psychol. 2018, 110, 785. [Google Scholar] [CrossRef]
- Menke, K.; Beckmann, J.; Weber, P. Universal design for learning in augmented and virtual reality trainings. In Universal Access through Inclusive Instructional Design; Routledge: London, UK, 2019; pp. 294–304. [Google Scholar]
- Williams, N.D.; Gallardo-Williams, M.T.; Griffith, E.H.; Bretz, S.L. Investigating Meaningful Learning in Virtual Reality Organic Chemistry Laboratories. J. Chem. Educ. 2021, 99, 1100–1105. [Google Scholar] [CrossRef]
- Kader, S.N.; Ng, W.B.; Tan SW, L.; Fung, F.M. Building an interactive immersive virtual reality crime scene for future chemists to learn forensic science chemistry. J. Chem. Educ. 2020, 97, 2651–2656. [Google Scholar] [CrossRef]
- Ferrell, J.B.; Campbell, J.P.; McCarthy, D.R.; McKay, K.T.; Hensinger, M.; Srinivasan, R.; Zhao, X.; Wurthmann, A.; Li, J.; Schneebeli, S.T. Chemical exploration with virtual reality in organic teaching laboratories. J. Chem. Educ. 2019, 96, 1961–1966. [Google Scholar] [CrossRef]
- Zhao, R.; Chu, Q.; Chen, D. Exploring chemical reactions in virtual reality. J. Chem. Educ. 2022, 99, 1635–1641. [Google Scholar] [CrossRef]
- Dunnagan, C.L.; Dannenberg, D.A.; Cuales, M.P.; Earnest, A.D.; Gurnsey, R.M.; Gallardo-Williams, M.T. Production and evaluation of a realistic immersive virtual reality organic chemistry laboratory experience: Infrared spectroscopy. J. Chem. Educ. 2020, 97, 258–262. [Google Scholar] [CrossRef]
- Hu-Au, E.; Okita, S. Exploring differences in student learning and behavior between real-life and virtual reality chemistry laboratories. J. Sci. Educ. Technol. 2021, 30, 862–876. [Google Scholar] [CrossRef]
- Miguel-Alonso, I.; Rodriguez-Garcia, B.; Checa, D.; Bustillo, A. Countering the Novelty Effect: A Tutorial for Immersive Virtual Reality Learning Environments. Appl. Sci. 2023, 13, 593. [Google Scholar] [CrossRef]
- Zhao, J.; Lin, L.; Sun, J.; Liao, Y. Using the summarizing strategy to engage learners: Empirical evidence in an immersive virtual reality environment. Asia-Pac. Educ. Res. 2020, 29, 473–482. [Google Scholar] [CrossRef]
- Merriam, S.B.; Bierema, L.L. Adult Learning: Linking Theory and Practice; John Wiley & Sons: Hoboken, NJ, USA, 2013. [Google Scholar]
- Kolb, A.; Kolb, D. Eight important things to know about the experiential learning cycle. Aust. Educ. Lead. 2018, 40, 8–14. [Google Scholar]
- Lowyck, J. Bridging learning theories and technology-enhanced environments: A critical appraisal of its history. In Handbook of Research on Educational Communications and Technology; Spector, J.M., Merrill, M.D., Elen, J., Eds.; Springer: New York, NY, USA, 2014; Chapter 1; pp. 3–20. [Google Scholar]
- Ambrose, S.; Bridges, M.; Lovett, M.; DiPietro, M.; Mayer, R.E.; Norman, M.K. How Learning Works: 7 Research-Based Principles for Smart Teaching; Jossey Bass: San Francisco, CA, USA, 2010; ISBN 978-0-470-48410-4. [Google Scholar]
- Billett, S. Guided learning at work. J. Workplace Learn. 2000, 12, 272–285. [Google Scholar] [CrossRef]
- Harrison, R.; Flood, D.; Duce, D. Usability of mobile applications: Literature review and rationale for a new usability model. J. Interact. Sci. 2013, 1, 1–16. [Google Scholar] [CrossRef]
- Murre, J.M.; Dros, J. Replication and analysis of Ebbinghaus’ forgetting curve. PLoS ONE 2015, 10, e0120644. [Google Scholar] [CrossRef]
- Crosier, J.K.; Cobb, S.V.; Wilson, J.R. Experimental comparison of virtual reality with traditional teaching methods for teaching radioactivity. Educ. Inf. Technol. 2000, 5, 329–343. [Google Scholar] [CrossRef]


Disclaimer/Publisher’s Note: The statements, opinions and data contained in all publications are solely those of the individual author(s) and contributor(s) and not of MDPI and/or the editor(s). MDPI and/or the editor(s) disclaim responsibility for any injury to people or property resulting from any ideas, methods, instructions or products referred to in the content. |
© 2024 by the authors. Licensee MDPI, Basel, Switzerland. This article is an open access article distributed under the terms and conditions of the Creative Commons Attribution (CC BY) license (https://creativecommons.org/licenses/by/4.0/).