Abstract
The need for efficient water management is critical today, as this resource faces increasing scarcity due to population growth, pollution, climate change, depletion, and overexploitation of water resources. This further exacerbates the problem of intermittent water supply (IWS), where consumers receive running water for less than 24 h a day, 7 days a week, affecting more than one billion people worldwide. This article presents the development and implementation of a smart water metering and monitoring system (SWMMS) for households affected by IWS. The system comprises IoT devices that record water levels and consumption and supply events in real time; cloud computing services to store and process the readings taken by the IoT devices; and a mobile application that allows users to view the available volume, consult their daily consumption history, and receive alerts for prolonged consumption time, overflows, and low water levels. The system was implemented for 115 days in a home suffering from an IWS, where a lower number of consumption events were recorded during the first 40 days of monitoring due to an initial behavioral response to continuous observation (Hawthorne effect), rather than an improvement in efficiency induced by the system.
1. Introduction
Water is fundamental to the development of life on our planet. However, increasing demand, depletion, and overexploitation of water resources due to population growth, as well as environmental challenges, make efficient management of water resources crucial [1,2,3]. According to the Global Water Partnership (GWP), the water crisis is considered the fifth most significant global risk in terms of its impact on our society. Although water resources are finite, the world’s population is consuming water at an ever-increasing rate [4]. Due to rapid development, conventional water sources, such as groundwater and surface water, will no longer be able to meet the high water demand. This problem is expected to worsen, as many developing countries will face water scarcity issues [5]. Groundwater is the primary source of drinking water in most urban areas worldwide [6]. Furthermore, intermittent water supply (IWS), in which consumers receive running water for less than 24 h a day, 7 days a week [7,8], currently affects one billion people worldwide [9,10,11]. IWS is most prevalent in urban areas of developing countries, affecting approximately one-third of consumers in Africa, half in Asia, and two-thirds in Latin America [12]. In South Asia, nearly 350 million people receive intermittent water, where 90% of water supply systems operate intermittently [12,13]. In Latin America, more than 50 million inhabitants of major cities receive rationed water supplies [13]. In India, nearly 100% of water distribution systems operate intermittently, affecting approximately 460 million people [12,13,14]. The IWS arises from a persistent imbalance between water supply and demand [11,15], and is generally adopted out of necessity rather than by design [8,13]. This imbalance is caused by population growth, unplanned urbanization, increased water use, water scarcity resulting from climate change, droughts, mismanagement, poor planning, deteriorating infrastructure, little or no investment, and political, economic, or cultural problems [8,16].
Households employ a wide variety of water storage infrastructure, including underground cisterns, oversized rooftop storage tanks, purchasing water by tanker truck, buckets, and a variety of storage containers, with the intention of storing as much water as possible when the supply is restored [10,14]. However, this adaptation imposes significant financial and time burdens on households, known as “coping costs,” which often exceed the cost of municipally supplied water [8,10]. Efficient management of household water use is of great importance, as around 50% of the water supplied to cities is wasted due to misuse [17]. Water management aims to provide a safe, reliable, and sustainable water supply to consumers, as well as to develop and implement strategies to manage the supply more efficiently, implement water conservation measures, and develop drought response plans when necessary [18].
Currently, the concept of smart city (SC) has emerged as a solution to address the challenges faced by both developed and developing countries [19]. The SC is defined by its capacity to use technology comprehensively to improve the quality of life of its citizens, boost the efficiency of public services, and promote sustainability in all aspects of urban life [20,21]. Attracting the attention of urban policymakers, corporations, and international institutions [19,22]. SC is built on an interconnected network of physical and digital infrastructures, including efficient transportation systems, smart energy grids, information and communication technologies (ICTs), sensors, actuators, and cloud computing, to create urban environments that are more accessible, efficient, sustainable, and safe [21,23].
The Internet of Things (IoT) is a new and innovative concept with the potential to build smart cities. This technology plays a fundamental role in smart cities by enabling connectivity and communication between urban devices and systems to collect and share data in real time [1]. Smart cities can support this approach by improving the monitoring capabilities of drinking water distribution infrastructure through smart metering devices and systems that leverage IoT to transmit real-time measurement data [4]. Integrating smart water metering and monitoring systems (SWMMS) into homes can not only address intermittent water supply but also incentivize consumers to change their consumption habits. It is crucial to encourage people to use water consciously and change their consumption behavior as individuals [4]. Governments and society must work together to develop and implement effective water management strategies to improve water efficiency, conserve water resources, and ensure access to safe drinking water for all [24].
However, most existing literature on water metering and monitoring focuses on continuous water supply (CWS) scenarios, with little attention paid to water management and monitoring in homes experiencing IWS, where water availability depends on storage tanks, and user behavior plays a crucial role in managing consumption. Very few studies address event-based metering and monitoring of consumption at the individual activity level or consider the temporal dynamics of water use during prolonged supply interruptions in urban areas. This work addresses these issues by developing and implementing a smart, real-time water metering and monitoring system for homes operating with an IWS. The system comprises IoT devices responsible for recording water levels and consumption and supply events in real time; Cloud computing services to store and process readings taken by IoT devices, and a mobile application that allows you to view the available volume, check the daily consumption history, and receive alerts for prolonged consumption time, overflows, low battery level, and low stored water level.
This document is structured as follows: Section 2 presents a brief review of the literature and related work on IoT-based smart water metering and monitoring systems. The design and development of the proposed system are presented in Section 3. Section 4 presents the discussion and results obtained from the system’s implementation in a home. Finally, Section 5 presents the conclusions and future work.
2. Related Work
A SWMMS enables real-time measurement and collection of data on water consumption and supply, leak detection, and the automation of consumption processes using internet-connected devices and sensors [25,26]. SWMMS provides valuable data for both drinking water service providers and consumers [27,28,29]. Table 1 presents a compilation of research on how implementing SWMMS enables significant savings and reductions in water consumption in homes, buildings, and cities.

Table 1.
Review of research evaluating water savings and consumption reduction using SWMMS.
In a SWMMS, two main types of sensors are used to measure and monitor water consumption: flow sensors and level sensors. Flow sensors measure the amount of water passing through a pipe; one of the most commonly used is the YF-S201 sensor, which consists of a plastic body, a hydraulic rotor with a magnet, and a Hall-effect sensor. When water flows through the sensor, the rotor turns, allowing the Hall-effect sensor to detect variations in the magnetic field and generate a certain number of pulses per unit of displaced volume [3,38,39]. On the other hand, water level sensors measure the amount of water available in storage tanks or cisterns. Among the most common are ultrasonic sensors (HC-SR04 and JSN-SR04T-2.0), which measure the distance to the water surface without direct contact [2,40,41]. In homes, these sensors measure and monitor water levels in rooftop tanks and automatically activate the water pump to transfer water from the cistern to the rooftop tank [42]. However, these sensors can be affected by container shape, foam, turbulence, suspended particles, or internal structures that interfere with the reflected signal. Table 2 presents a comparison of the technologies used and the results reported in recent literature on smart water metering and monitoring systems or devices. This table shows the technologies employed, including the type of microcontroller, sensors, modules, communication protocols, data management platforms, user interfaces, and the main results obtained. This compilation enables us to identify current trends in SWMMS development and highlight the predominant technologies.
Table 2.
Technologies and components used in SWMMS are reported in the literature.
In the literature, most SWMMS are designed for CWS environments, where a flow sensor like the YF-S201 is primarily used. However, the system presented in this work was developed for homes affected by IWS, which forces residents to rely on storage tanks to address this problem. In this scenario, the main concern of the residents is knowing the amount of water stored and available during days without supply. For this reason, the proposed SWMMS was developed to measure the water level using an ultrasonic sensor and infer the volume of water stored in the tank. The system records the water level at the beginning and end of each consumption and supply event, using flow switches that wake the IoT device from deep sleep whenever flow is detected. This allows for robust monitoring, low energy consumption, and longer battery life, making it more suitable for implementation in rooftop tanks.
3. SWMMS Development
In the vast majority of homes in urban and rural areas of Mexico, drinking water is stored in water tanks and/or cisterns due to the IWS problem. These tanks are installed on the roofs of each house, where the municipal public water supply enters directly, providing this resource for residents’ daily activities, as shown in Figure 1.
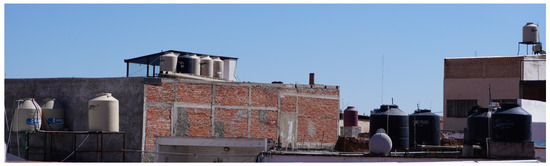
Figure 1.
Storage of drinking water in tanks.
According to the 2024 Encuesta Nacional sobre Disponibilidad y Uso de Tecnologías de la Información en los Hogares (ENDUTIH), 100.2 million people in Mexico (83.1% of the population aged 6 and over) are internet users, and 97.2 million connect to the internet via a smartphone. Furthermore, 95.1% of internet users accessed the internet from home [52]. This indicates that internet access for wireless smart devices is primarily via a Wi-Fi network connected to a modem-router.
3.1. SWMMS Architecture
The design and development of the proposed SWMMS are based on an IoT architecture divided into three main parts (Figure 2): IoT devices (Figure 2a) that measure and monitor water consumption and supply events in real time. The second part consists of cloud computing services (Figure 2b) for data storage, processing, and analysis, and a mobile application (Figure 2c) that provides an intuitive user interface for decision-making in homes with IWS. This application allows users to register homes and water tanks, view available volume in real time, consult consumption history, and receive alerts for prolonged consumption time, water tank overflow, low water level, and low battery level of the IoT device.
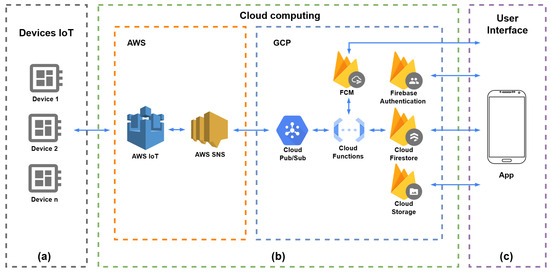
Figure 2.
SWMMS Architecture: (a) IoT Devices, (b) Cloud Computing, (c) User Interfaces.
3.2. IoT Device
The IoT device was designed and developed in three parts: the printed circuit board (PCB), the prototype housing, and the algorithm. Its purpose is to measure and monitor the water level stored in a tank and detect consumption and supply events.
3.2.1. PCB Design and Development
The design and development of the printed circuit board (PCB) includes six fundamental elements (Figure 3): the microcontroller responsible for control and processing; the wireless communication that allows data transmission to the cloud; the sensors that capture readings of the water level and flow; the user interface integrated through buttons and an OLED display; a rechargeable battery as a power source; and the power conditioning and management system that guarantees electrical stability and energy consumption efficiency.
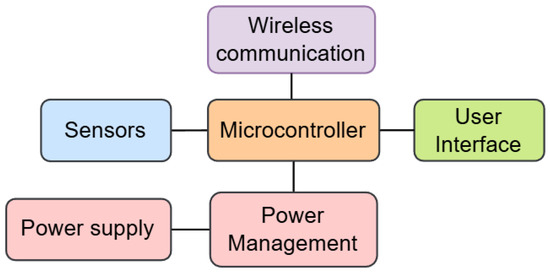
Figure 3.
Block diagram of the proposed IoT device for water metering and monitoring.
To enable the IoT device (Figure 4(a)) to process and transmit sensor data, the ESP-WROOM-32E module was used. This low-cost module, created by Espressif Systems, integrates Wi-Fi (802.11 b/g/n) and Bluetooth/BLE, two processing cores, and low energy consumption, enabling efficient and secure communication with cloud computing services [53]. The IoT device uses an XKC-DS1603L.V1 ultrasonic sensor, Shenzhen Kechengmei Technology Co., Ltd., Shenzhen, China (Figure 4(b)) to measure the distance to the water surface. This sensor is installed at the bottom of a water column (Figure 4(c)) adjacent to and parallel with the water tank (Figure 4(d)). This is because water tanks are usually supported by a metal or concrete base (Figure 4(e)), which makes direct installation on the tank difficult. The ultrasonic sensor operates at a supply voltage of 3.0 V to 12 V and consumes less than 35 mA. It has a resolution of 1 mm, detects liquid over a height range of 50 mm to 2000 mm, and has a response time of 2 s when liquid is present in the container and 10 s when no liquid is present [54].
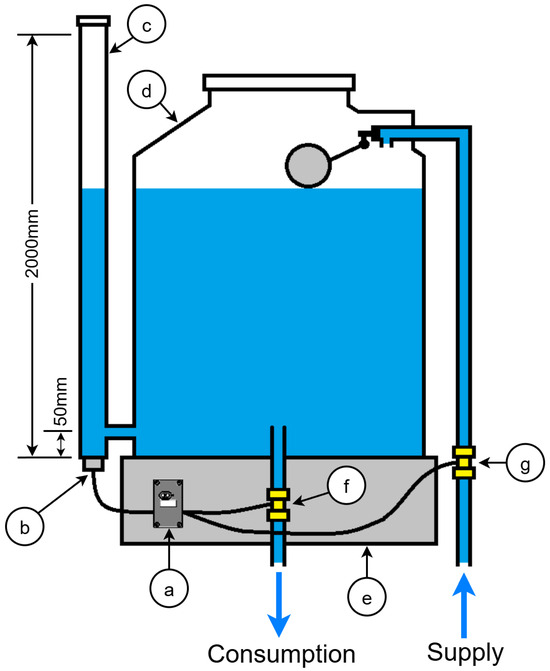
Figure 4.
Design and installation of the SWMMS: (a) IoT device, (b) Ultrasonic sensor, (c) Water column, (d) Water tank, (e) Metal or concrete base supporting the water tank, (f) Flow switch in the consumption pipe, (g) Flow switch in the supply pipe.
Two YFC01 1/2-inch water flow switches were used to activate or wake the IoT device whenever a water consumption or supply event occurred. The flow switches were installed on the water tank’s outlet (Figure 4(f)) and inlet (Figure 4(g)) pipes. These switches operate at a flow rate of 1 to 30 L/min, a voltage of 0 to 220 Vdc, a current of 0 to 0.5 A, an operating temperature of 1 °C to 120 °C, a maximum working pressure of 1.75 MPa, and a response time of 0.2 s.
The IoT device features a 0.91-inch OLED display (128 × 32) as its user interface (Figure 5(a)). This display shows the water level, battery charge level, and a “sensor not detected” alert, and also assists the user in adding the Wi-Fi network. The PCB includes three tactile switches: reset (Figure 5(b)), “b2” (Figure 5(c)) for sending data, and “b1” (Figure 5(d)) for configuring the SSID and password of the home Wi-Fi network via the mobile app. It also includes a slide switch (Figure 5(e)) to power the IoT device on or off.
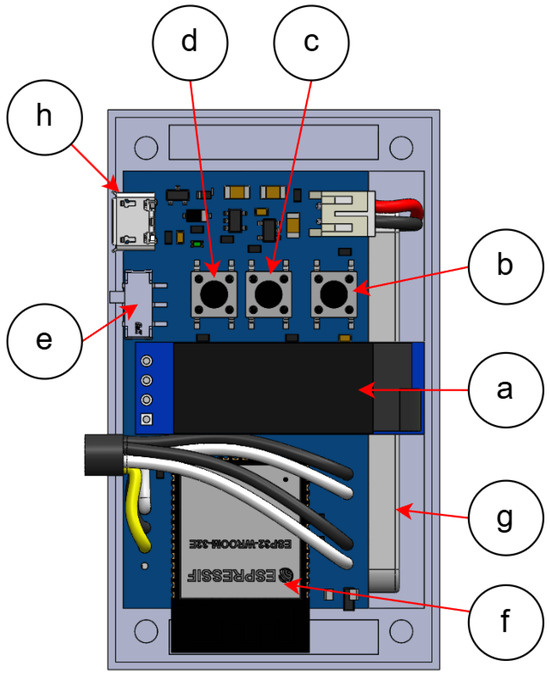
Figure 5.
PCB: (a) 128 × 32 OLED display, (b) reset tactile switch, (c) “b2” tactile switch, (d) “b1” tactile switch, (e) SPDT slide switch (IoT device power on/off), (f) ESP-WROOM-32E module, (g) Rechargeable battery, (h) Micro USB B 2.0 connector.
The ESP-WROOM-32E module (Figure 5(f)) operates at a voltage between 2.55 V and 3.6 V, with a power consumption of 80–180 mA when Wi-Fi is active. The ultrasonic sensor operates at a supply voltage of 3.3 V to 12.0 V and consumes less than 35 mA. Based on this, a 3.7 V, 1200 mAh rechargeable Li-ion battery (Figure 5(g)) was used. For power management, the AP7365-33YRG-13 SOT-89R-3 low-voltage linear regulator (Diodes Incorporated, Plano, TX, USA) with current limiting and short-circuit protection was used, providing an output voltage of 3.3 V, an output current of 600 mA, a standby current consumption of 80 µA, an operating temperature range of −40 °C to 85 °C, and a maximum input voltage of 6.0 V. The MCP73831T-2ACI/OT lithium-polymer battery charging controller (Microchip Technology, Chandler, AZ, USA), configured to 600 mA, was also integrated to ensure a long battery life. A voltage divider consisting of two 100 Kohms resistors was used to measure and monitor the battery charge level. The AO3407A P-channel MOSFET (Alpha & Omega Semiconductor, Sunnyvale, CA, USA) was used as a High-Side Switch to cut off power to the ultrasonic sensor, OLED display, and voltage divider when the IoT device enters deep sleep. For charging, the device has a micro USB B 2.0 connector (Figure 5(h)), which allows it to be connected to a home power outlet using a commercial 5 V 600 mA charger.
3.2.2. Design, Development, and Manufacturing of the IoT Device Casing Prototype
A prototype enclosure (Figure 6) was designed to protect the PCB and battery electronic components, accounting for environmental conditions at the IoT device’s installation site (on the rooftop of the house), including humidity, dust, direct sunlight, and potential mechanical impacts. The design was created in SolidWorks 2022, enabling precise modeling of the electronic assembly dimensions and optimizing the internal space to accommodate the PCB and battery. The enclosure design includes openings for the sensor connection cables (Figure 6(a)), the power switch (Figure 6(b)), the OLED display (Figure 6(c)), the micro USB B 2.0 connector (Figure 6(d)) for charging the device, and the touch switch for reset functions (Figure 6(e)). Two buttons were included for the “b2” tactile switch (Figure 6(f)) and the “b1” tactile switch (Figure 6(g)). The casing was manufactured using FDM (Fused Deposition Modeling) 3D printing with PETG (Polyethylene Terephthalate Glycol) filament, selected for its low cost, impermeability and resistance to Ultraviolet (UV) radiation, slightly superior to PLA (Polylactic Acid) and ABS (Acrylonitrile Butadiene Styrene) filament, making it suitable for prototypes with undemanding electronic applications and prolonged exposure to the outdoors [55].
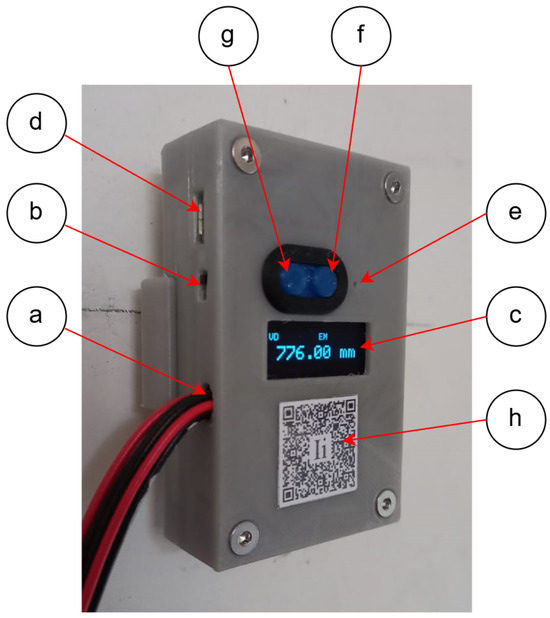
Figure 6.
IoT device casing prototype: (a) Cable hole, (b) Power switch hole, (c) OLED display hole, (d) Micro USB B 2.0 connector hole, (e) Reset hole, (f) “b2” button, (g) “b1” button, and (h) QR code.
3.2.3. IoT Device Algorithm
The control algorithm implemented in the IoT device is based on a finite state machine consisting of nine states: read level, sensor not connected, add WiFi, connect WiFi, connect MQTT, publish message, disconnect MQTT, disconnect WiFi, and deep sleep (Figure 7), which allow it to control the flow of operation of the IoT device, manage wireless communication, publish the message to cloud computing services, and optimize energy consumption through deep sleep mode.
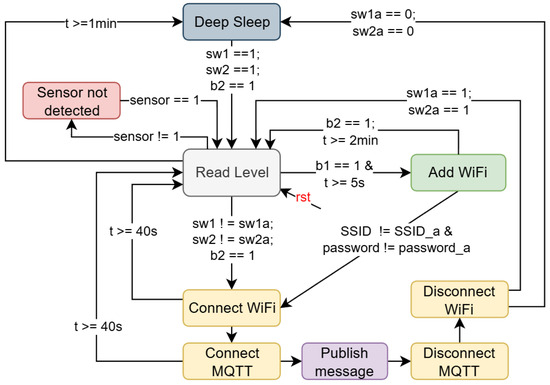
Figure 7.
Finite state machine of the IoT device algorithm.
In the initial “read level” state, the ultrasonic sensor measures the water level in the tank and displays this value on the IoT device’s OLED display (Figure 5(a)). During this state, the system remains in continuous monitoring until one of the following conditions is met: if one minute of inactivity elapses, the device automatically enters “deep sleep” mode to optimize energy use; if the reset tactile switch (Figure 5(b)) is pressed, the IoT device restarts; if the “b1” tactile switch (Figure 5(d)) is held down for more than five seconds (b1 == 1 and t > 5 s), the device switches to the “add WiFi” state; if the ultrasonic sensor is not correctly connected to the IoT device, the OLED display shows the alert message “sensor not detected” until the sensor is successfully connected. The IoT device will switch to the “connect WiFi” state whenever the current reading of the flow switch on the consumption pipe (sw1) differs from its previous recorded reading (sw1a). Similarly, when the current reading of the flow switch on the supply pipe (sw2) differs from its previous reading (sw2a), it will switch to the “connect WiFi” state. This allows the start and end of each water consumption and supply event to be identified, sent, and recorded. Pressing the “b2” tactile switch (Figure 5(c)) switches the device to the “connect WiFi” state.
Upon entering the “add WiFi” state, the user can scan the IoT device’s QR code (Figure 6(h)) in the mobile application to register the home WiFi network’s SSID and password. This process has a two-minute time limit; if the time expires (t ≥ 2 min) without receiving valid data, the system returns to the “read level” state. Suppose the new WiFi network data differs from that previously stored in the EEPROM memory (SSID ! = SSID_a & password ! = password_a). In that case, the algorithm will switch to the “connect WiFi” state to establish the new connection. If the user presses the “b2” tactile switch (Figure 5(c)) during this state, the device also returns to the initial “read level” state.
In the “Connect WiFi” state, the device attempts to connect to the home WiFi network. If the connection is successful, the system transitions to the “Connect MQTT” state. Otherwise, if the connection is not established after 40 s (t ≥ 40 s), the device returns to the “Read Level” state. Similarly, in the “Connect MQTT” state, the system attempts to establish communication with the MQTT server to send data. If the connection is successful within 40 s (t ≥ 40 s), it transitions to the “Publish Message” state; otherwise, it returns to the initial “Read Level” state. In the “publish message” state, the device transmits the collected information to the contracted cloud computing services. Each message sends the following information: the timestamp, the sw value (where sw = 0 represents a consumption event and sw = 1 a supply event), the e-sw value (where e-sw = 1 indicates the start of the event and e-sw = 0 its end), and the water level reading in millimeters. Once the message has been successfully sent, the system transitions to the “disconnect MQTT” state, ending the communication session with the server. Finally, if no water flow is detected in the pipes (sw1a = 0; sw2a = 0), the system enters a “deep sleep” state to conserve energy. Conversely, if flow is still detected (sw1a = 1; sw2a = 1), the IoT device returns to the “read level” state to continue measuring and monitoring the water level in real time.
3.3. Cloud Computing Services
The SWMMS architecture uses Amazon Web Services (AWS) and Google Cloud Platform (GCP) (Figure 2b). Communication and management of IoT devices are handled by AWS IoT Core, which receives messages from devices via the MQTT protocol. Data transmitted between the IoT device and the cloud computing services is encrypted in transit using TLS, and device authentication in AWS IoT Core is performed using X.509 certificates. When AWS IoT Core gets a message, an IoT Rule is automatically triggered, forwarding the message payload to an AWS Simple Notification Service (SNS) topic. The AWS SNS service is configured to operate as a messaging client, sending data via an HTTP POST request to a Google Cloud Pub/Sub push subscription endpoint. Cloud Function automatically activates functions as soon as the message is confirmed in the Pub/Sub topic, enabling data processing to calculate water volume based on tank dimensions, log IoT device readings, record daily consumption volume, and send alerts via Firebase Cloud Messaging (FCM) when prolonged consumption time, tank overflow, low water level, and low battery are detected on the IoT device. For user authentication and management, Firebase Authentication was used, which automatically stores passwords using salted hashing, enabling user registration and validating access to the mobile application, ensuring data privacy and protection. Data about the home, its occupants, and IoT devices, as well as daily consumption history and IoT device readings, were stored in Cloud Firestore. This document-based NoSQL database supports real-time data synchronization, updates, and queries. The system also uses Cloud Storage to store multimedia files, allowing for changes or additions to profile pictures, container images, home images, and more.
3.4. Mobile App
A mobile application for smartphones was developed as a user interface using the Flutter SDK (Software Development Kit, version 3.27.1) and the Dart language, allowing deployment on both Android and iOS devices. This mobile application will enable users to manage their IoT devices, view the amount of available water in liters, and access a real-time history of daily water consumption, enabling more efficient water use. It also notifies users about prolonged consumption time, tank overflow, low water level, and low battery on the IoT device. The first time a user accesses the mobile application, they must create sign up (Figure 8a). Once the account is created, the user can sign in (Figure 8b) by correctly entering their registered email address and password. If these values are incorrect, an alert will be displayed with the message “Enter a valid email address and password”.
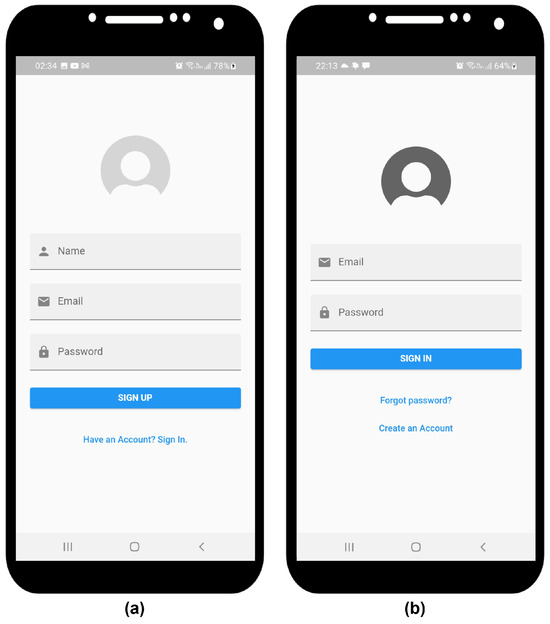
Figure 8.
(a) Sign-up page. (b) Sign-in page.
Once the user signs in, they can navigate the main menu, which includes: a list of homes, a list of contacts, add WiFi, and my profile, ensuring intuitive navigation and a clear hierarchical structure within the application (Figure 9).
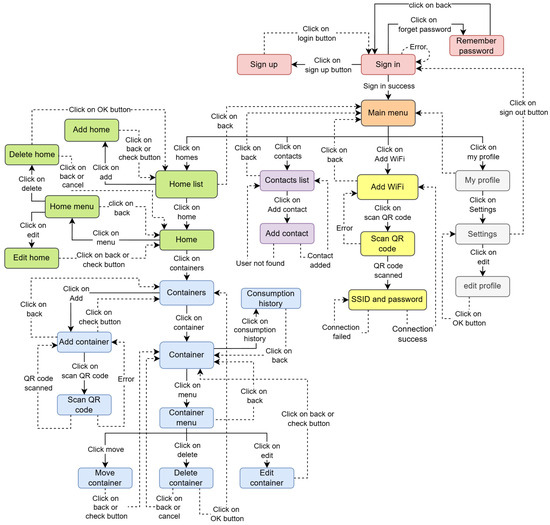
Figure 9.
Mobile application navigation routes.
In the homes list page (Figure 10a), the user can see the houses where they are registered as a resident. By clicking the “Add (+)” button located in the lower right corner of the screen, they will be taken to the “add home” page (Figure 10b) where they will enter the name and description of the house, as well as an image of the house, choosing from an image in their gallery or taking a photo with their mobile phone camera. The house will be added upon pressing the “Accept (✓)” button. The home page (Figure 10c) will display the property image, description, residents, containers, events, recipes, shopping list, add residents, and edit home. Users with the administrator title can edit the home description, delete residents, and be promoted or demoted to or from the administrator role. The containers page (Figure 10d) displays all registered containers for the home in a grid format. Users can create new containers by clicking the “add (+)” button in the bottom-right corner of the page.
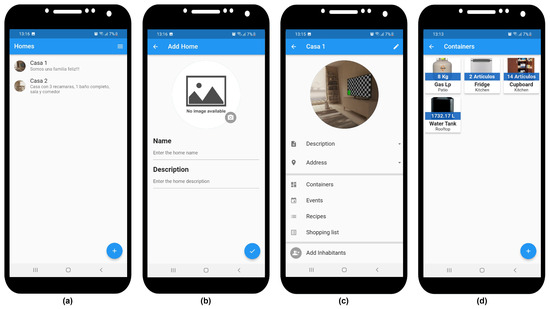
Figure 10.
(a) Home list. (b) Add home page. (c) Home page. (d) Containers page.
On the Add Container page (Figure 11a), the user will enter the necessary information to create the container (water tank), such as: name, description, its location in the home, the minimum and maximum volume of the container (to alert the user about low water levels and tank overflow), maximum water consumption time (maximum time, in minutes, for the prolonged consumption time alert), and the dimensions (the diameter and height of the tank). By pressing the “Scan QR code” button, the user can scan the IoT device’s QR code (Figure 11b), which contains essential information such as the IoT device’s serial number and type, necessary to register the IoT device with the home. If the device has already been registered, the application will display an alert with the message: “This device has already been registered.” However, if this IoT device has not been registered, the user will be directed to the “Add WiFi” page (Figure 11c), where they will enter the SSID and password of the home WiFi network. The IoT device will be added to the home by pressing the “accept (✓)” button.
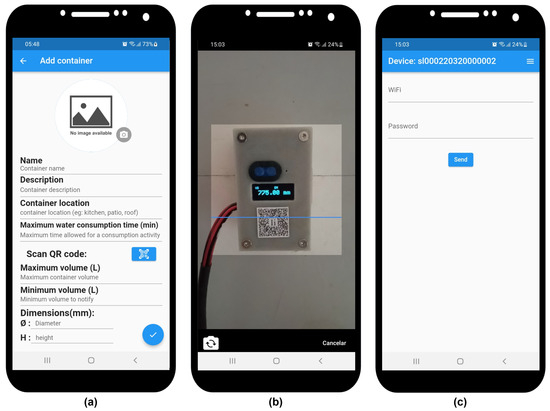
Figure 11.
(a) Add container. (b) Scan the QR code. (c) Add WiFi.
On the container page (Figure 12a), residents will be able to see: an image of the container, the real-time volume in liters, a horizontal level bar indicating the volume as a percentage (where 100% is the container’s maximum capacity), a bar graph showing daily water consumption for the past week so users can take action to save and manage their water usage, and a drop-down menu in the upper right corner of the page where administrators can move, edit, or delete the container. Clicking the consumption history button will display a table of daily consumption for the last 30 days in the mobile application (Figure 12b).
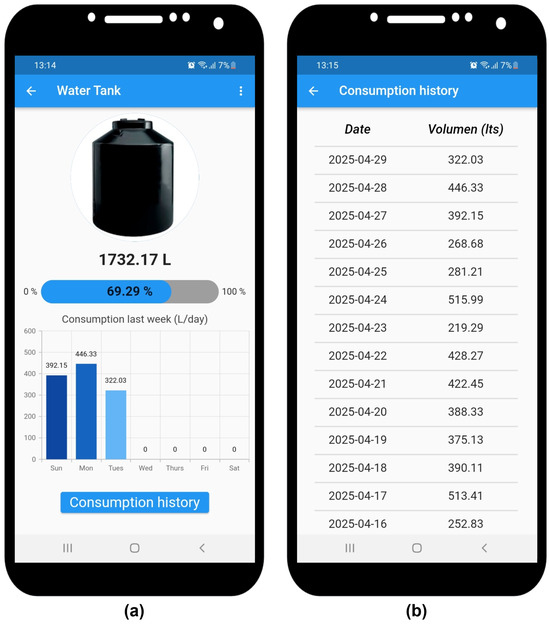
Figure 12.
(a) Container page. (b) Consumption history page.
In addition, users are alerted by notifications on their smartphones through the Firebase Cloud Messaging service. These alerts are:
- Low battery level!: This alert is sent when the battery level is equal to or less than 15% of the total charge (Figure 13a);
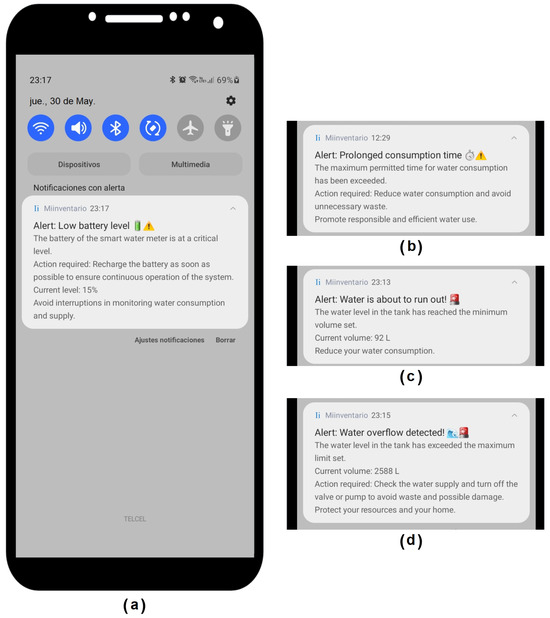 Figure 13. (a) Alert: Low battery level. (b) Alert: Prolonged consumption time. (c) Alert: Water is about to run out. (d) Alert: Water overflow detected.
 - Prolonged consumption time!: This alert is sent when the duration of a consumption event exceeds the maximum time allowed for a consumption activity, previously configured by the user (Figure 13b);
- Water is about to run out!: This alert is sent when the water volume read by the IoT device is less than or equal to the minimum volume value allowed by the user (Figure 13c);
- Water overflow detected!: This alert is sent when the water tank’s volume exceeds its maximum capacity (Figure 13d).
4. Results and Discussion
The XKC-DS1603L.V1 ultrasonic level sensor was calibrated under controlled laboratory conditions for a water column constructed from a 2-inch-diameter PVC pipe with a height of 2000 mm, with the offset calibrated to 100 mm and the scale factor to 1500 mm. The SWMMS was then evaluated using 12 tests performed at 100 mm intervals (Table 3). In each test, the measured water level was compared with the ultrasonic sensor’s measurement, which has an operating range of 50 mm to 2000 mm. The tests showed a percentage error ranging from 0% to 1.42%, with a deviation of 1 to 3 mm between the actual level and the sensor reading.
Table 3.
Comparison of real water level vs. distance measured by ultrasonic sensor.
To evaluate the performance of the SWMMS, it was implemented in a 2500-L water tank (1642 mm in diameter and 1200 mm high in the cylindrical section) in a student residence housing six people aged 20 to 32 years in the municipality of Zacatecas, Zacatecas, Mexico. A minimum volume of 600 L was set to alert users that the water supply was running low, providing a 1 to 2 day buffer before the tank emptied. This was based on the fact that a person needs to consume between 50 and 100 L of water per day to meet their needs [56]. Likewise, to alert of an overflow, a maximum volume of 2500 L and a 15-min water usage limit were established.
Table 4 presents a portion of the readings recorded by the SWMMS for consumption and supply events. Each record includes the timestamp of the reading, the state of the flow switches (sw and e-sw), the water level measured in millimeters (mm), and the battery level in percentage. When sw equals zero (sw = 0), it indicates a consumption event; conversely, when sw equals one (sw = 1), it indicates a supply event. The value of e-sw indicates the start and end of an event, with e-sw = 1 indicating the start of the event and e-sw = 0 indicating its end.
Table 4.
Excerpt from recorded readings.
Table 5 presents the consumption events (sw = 0) and supply events (sw = 1) recorded by the SWMMS between 16 April and 9 August 2025. A total of 8430 consumption events were identified, associated with 16,860 readings, while supply events were considerably fewer, with 322 events derived from 644 readings. The average duration of water consumption events was 1.3 min, ranging from 0.01 to 104.17 min. 8025 consumption events lasted less than 5 min, representing 95% of the total. 115 prolonged consumption time alerts were recorded over 115 monitoring days, after exceeding the programmed 15-min limit. Of these, 26 lasted 16–20 min, 39 lasted 21–30 min, and only 9 exceeded 30 min. Residents did not report any water leaks, resulting in a 100% false-positive rate for leak detection. Therefore, these 115 alerts correspond to either intentional prolonged water consumption or overlapping consumption activities performed simultaneously by multiple household members.
Table 5.
Summary of recorded consumption and supply events from 16 April to 9 August 2025.
Supply events exhibited a significantly longer average duration of 16.23 min, with a maximum of 361.66 min (approximately 6 h) and a minimum of 0.042 min. Multiple supply event readings were recorded on supply days, a characteristic behavior of ISW. Because the water distribution network is partially or completely emptied during periods without service [57], when water flow resumes, the pipes contain large volumes of air that are forced into homes by water pressure [8]. This causes the SWMMS to detect the air passage as a false supply event before the flow rate stabilizes.
Figure 14 shows the daily number of consumption events (blue curve) and supply events (orange curve) recorded from 16 April to 9 August 2025. During the first 40 days of monitoring (16 April to 25 May), a lower number of consumption events was observed due to a temporary change in behavior, associated with users’ awareness of being monitored, a phenomenon known as the Hawthorne effect [58,59]. After the 40 days (26 May to 15 July), an increase in the average daily number of consumption events was observed, from 55.8 to 85.9, reflecting a gradual normalization of habitual water use patterns as users become accustomed to the system and their perception of being observed decreases.
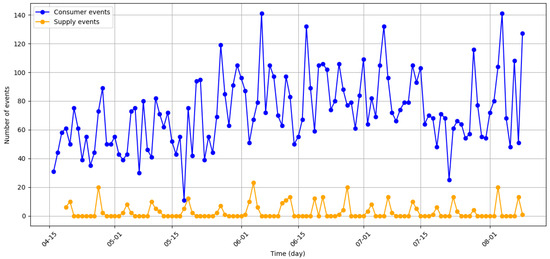
Figure 14.
Graph of the number of consumption and supply events per day, from 16 April to 9 August 2025.
Studies on water consumption in showers have shown that initial savings gradually decreased over time and disappeared completely after 4 months, returning consumption to levels prior to the installation of the shower monitors [60]. A study conducted in Valencia, Spain, analyzed 334 households equipped with smart water meters and linked to a digital feedback platform (SmartH2O). They found that approximately 47% of households achieved a sustained reduction in consumption for more than 2 years after the start of the study, particularly those receiving sub-daily information from the smart meters, while 10% experienced an initial reduction followed by gradual adaptation or a rebound effect, and 9% showed an increase in consumption in the long term [61].
The persistence of long-term water and energy conservation behavior is determined by the interaction of four main factors: consumption feedback, household characteristics, individual and social motivations, and the effort required to maintain the behavior [62]. While the developed SWMMS provides real-time consumption feedback by displaying the available volume in the water tank, the daily consumption history, and alerts for prolonged consumption and low stored water levels, a sustained reduction in long-term consumption was not achieved, and therefore, the behavior’s persistence was not consolidated. Furthermore, consumption feedback decreased the uncertainty and perceived risk of running out of water, the main incentive for households experiencing IWS to save water.
From 16 to 27 July, an average of 59.7 consumption events per day were recorded due to the summer holidays. On 18 May, 11 consumption events were recorded when the water volume reached 68 L, prompting residents to minimize consumption to avoid running out of water. The water service in the home suffered interruptions lasting more than 6 days, and supply periods of 8 h and 20 min until the water tank was filled, confirming an IWS and the importance of implementing a SWMMS to provide real-time information on the volume of water available to anticipate shortages and facilitate efficient water management.
The graph in Figure 15 shows a pattern of gradual decreases in volume (consumption), followed by an increase in volume (tank filling), clearly demonstrating IWS behavior.
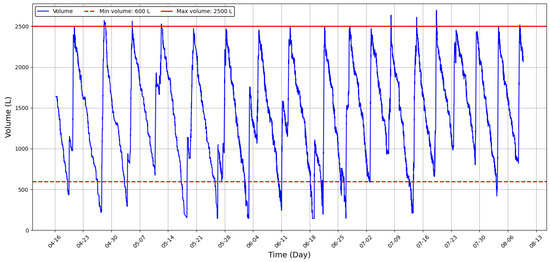
Figure 15.
Graphs of the volume of water recorded from 16 April to 9 August 2025.
The maximum capacity of the water tank (red horizontal line) of 2500 L was exceeded on seven occasions (28 April; 5 and 12 May; 8, 14, and 19 July; and 8 August), indicating the days when the water pressure was sufficient to cause the tank to overflow, resulting in water loss and damage to the float valve caused by the IWS. On the other hand, a decrease in the number of events and duration of consumption was observed when the water volume fell below 600 L (minimum volume: red dashed horizontal line) on 21 occasions.
Figure 16 shows the daily water consumption recorded only for days without water supply (72 days); the average daily consumption for the household was 392.78 L/day, with values ranging from 179.99 to 628.92 L/day. For a household of 6 people, this is equivalent to an average daily per capita consumption of 65.46 L/person/day.
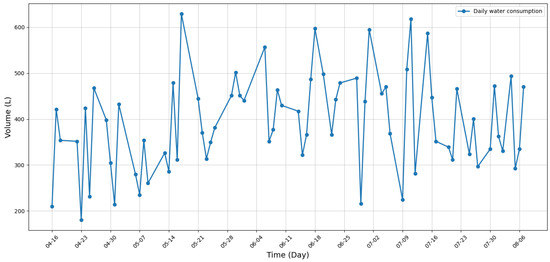
Figure 16.
Graphs of daily water consumption from 16 April to 9 August 2025.
Limitations
The proposed SWMMS has limitations in both its design and the study, which must be acknowledged to properly contextualize the results: This work has been delimited as a descriptive study focused on the implementation and characterization of a SMMMS for households with IWS. The system was evaluated in a single dwelling, which limits the generalizability of the observed consumption and supply patterns to other households, tank sizes, or urban contexts. During the 115 days of implementation, the IoT device was continuously powered by an external USB power supply to maintain the prototype’s operational stability. Therefore, the battery did not discharge, and it was not possible to evaluate its lifespan under real-world operating conditions. Water consumption and supply volumes are not measured directly but are inferred from water level variations using ultrasonic sensors. The use of binary flow switches allows for detecting water flow and reactivating the IoT device, but does not provide continuous flow information. It is not possible to reliably estimate daily water consumption on days with supply because the volume stored in the tank increases and decreases as consumption and supply events occur simultaneously. Under these conditions, the water level may rise, fall, or remain seemingly stable, making it impossible to distinguish what fraction of the volume change corresponds exclusively to a consumption event or a supply event.
Figure 17 shows a graphical representation of how the SWMMS records daily water-use activities performed by a single person (ideal scenario), where the horizontal axis corresponds to elapsed time and the vertical axis to the activities performed. The first activity (showering) is delimited between reading 1 (start: e-sw = 1) and reading 2 (end: e-sw = 0), the second activity, corresponding to flushing the toilet, is delimited by reading 3 (start: e-sw = 1) and reading 4 (end: e-sw = 0), and similarly, the third activity (washing hands) is delimited between reading 5 (start: e-sw = 1) and reading 6 (end: e-sw = 0).
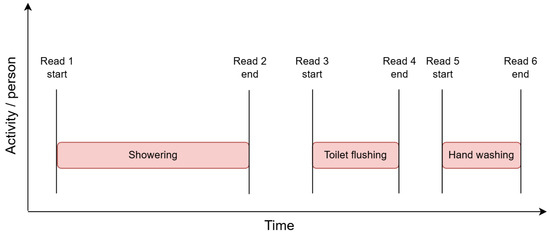
Figure 17.
Graphical representation of the record of activities performed by a person.
However, when two or more people consume water simultaneously, the SWMMS perceives it as a single, prolonged consumption activity, as shown in Figure 18. Unlike a single person, where the start and end of each consumption can be clearly identified, the temporal overlap of activities performed simultaneously by more than one person causes the system to group all activities into a single consumption event, highlighting a limitation of the SWMMS in recognizing and predicting consumption activities. To overcome this limitation, the system can operate in coordination with presence or motion sensors in a smart home environment, or the level or flow measurement at a single main measurement point can be replaced by installing flow sensors at end-use points (such as sinks, toilets, showers), allowing these events to be disaggregated and associating each water flow measurement with a specific consumption activity [27].
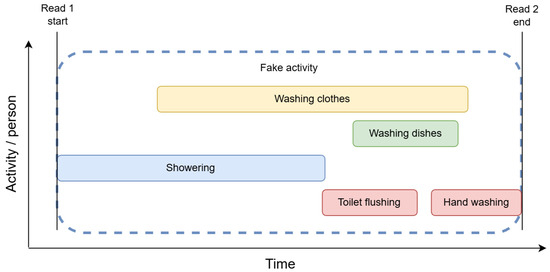
Figure 18.
Graphical representation of the record of activities performed by more than one person.
5. Conclusions and Future Work
This study developed and implemented an SWMMS for homes facing IWS. By integrating an IoT device, cloud computing services, and a mobile application as a user interface, the system successfully recorded, processed, and displayed the available water volume in the storage tank in real time, as well as sending alerts for prolonged consumption time, overflows, low water levels, and low battery. The results obtained from implementing the SWMMS for 115 days in a single home allowed for the characterization of representative temporal patterns of water consumption and supply under IWS conditions, such as daily variability in consumption events, gradual depletion of the stored volume, and irregular filling processes associated with intermittent and variable pressure in the supply network. During the initial deployment phase (first 40 days), a lower number of consumption events was observed, possibly attributable to increased user awareness regarding water consumption monitoring. This behavioral response is consistent with the Hawthorne effect and not with an efficiency improvement caused by the system.
Future work includes: extending the system evaluation to multiple homes with different tank sizes, urban contexts, and supply schemes; conducting longer monitoring periods to analyze long-term behavioral adaptation and seasonal variability; exploring monitoring parameters that combine level, flow, and pressure measurements, as well as strategies for disaggregating simultaneous consumption and supply events; incorporating artificial intelligence (AI) and machine learning (ML) techniques to identify recurring usage patterns and classify consumption activities, considering temporal, seasonal, and contextual variations; the development and integration of robust methods for detecting water leaks; long-term battery performance will be evaluated under real-world operating conditions; conducting long-term usability and reliability studies to support the system’s scalability in urban contexts in developing countries; and improving the system’s capabilities by integrating turbidity, pH, and conductivity sensors to monitor the quality of water stored in tanks.
Author Contributions
Conceptualization, J.L.T.-G., L.O.S.-S., C.L.C.-M. and M.M.-L.; methodology, J.L.T.-G., C.L.C.-M., H.A.G.-O. and G.E.-G.; software, J.L.T.-G.; validation, H.A.G.-O., G.J.-D., M.M.-L. and M.d.R.M.-B.; formal analysis, J.L.T.-G., G.E.-G., M.M.-L. and L.O.S.-S.; investigation, J.L.T.-G., G.J.-D., G.E.-G., T.I.-P. and L.O.S.-S.; resources, L.O.S.-S. and M.d.R.M.-B.; data curation, J.L.T.-G., G.J.-D., H.A.G.-O., C.L.C.-M., M.d.R.M.-B. and T.I.-P.; writing—original draft preparation, J.L.T.-G., L.O.S.-S., M.M.-L. and M.d.R.M.-B.; writing—review and editing, J.L.T.-G., L.O.S.-S., M.M.-L. and M.d.R.M.-B.; visualization, J.L.T.-G., L.O.S.-S., M.M.-L. and T.I.-P.; supervision, L.O.S.-S., G.J.-D., M.d.R.M.-B., H.A.G.-O. and G.E.-G.; project administration, L.O.S.-S., J.L.T.-G., C.L.C.-M., H.A.G.-O., G.E.-G. and T.I.-P.; funding acquisition, L.O.S.-S., M.d.R.M.-B., C.L.C.-M. and T.I.-P. All authors have read and agreed to the published version of the manuscript.
Funding
This research received no external funding.
Institutional Review Board Statement
Not applicable.
Informed Consent Statement
Not applicable.
Data Availability Statement
The data presented in this study are available on request from the corresponding author.
Acknowledgments
The authors gratefully acknowledge the support of the Laboratory of Intelligent Systems for Artificial Vision and the Secretariat of Science, Humanities, Technology and Innovation (SECIHTI by its initials in Spanish).
Conflicts of Interest
The authors declare no conflicts of interest.
Abbreviations
The following abbreviations are used in this manuscript:
| ABS | Acrylonitrile Butadiene Styrene |
| AI | Artificial Intelligence |
| API | Application Programming Interface |
| AWS | Amazon Web Services |
| BLE | Bluetooth Low Energy |
| CWS | Continuous Water Supply |
| EEPROM | Electrically Erasable Programmable Read Only Memory |
| ENDUTIH | Encuesta Nacional sobre Disponibilidad y Uso de Tecnologías de la Información en los Hogares |
| FCM | Firebase Cloud Messaging |
| FDM | Fused Deposition Modeling |
| GAS | Google Apps Scripting |
| GCP | Google Cloud Platform |
| GWP | Global Water Partnership |
| HTTPS | Hyper Text Transfer Protocol Secure |
| ICTs | Information and Communication Technologies |
| IoT | Internet of Things |
| IWS | Intermittent Water Supply |
| LED | Light Emitting Diode |
| LoRaWAN | Long Range Wide Area Network |
| LWP | Low Water Pressure |
| MQTT | Message Queuing Telemetry Transport |
| NB-IoT | Narrow Band Internet of Things |
| OLED | Organic Light Emitting Diode |
| OMS | Open Metering System |
| PCB | Printed Circuit Board |
| PETG | Polyethylene Terephthalate Glycol |
| PLA | Polylactic Acid |
| PVC | Polyvinyl Chloride |
| QR | Quick Response |
| REST | Representational State Transfer |
| SC | Smart City |
| SDK | Software Development Kit |
| SNS | Simple Notification Service |
| SPDT | Single Pole Double Throw |
| SQL | Structured Query Language |
| SSID | Service Set Identifier |
| SWMMS | Smart Water Metering and Monitoring Systems |
| TTN | The Things Network |
| UART | Universal Asynchronous Receiver Transmitter |
| UI | User Interface |
| USB | Universal Serial Bus |
| UV | Ultraviolet |
| WTG | Water Turbine Generator |
References
- Kamaruidzaman, N.S.; Rahmat, S.N. Water Monitoring System Embedded with Internet of Things (IoT) Device: A Review. IOP Conf. Ser. Earth Environ. Sci. 2020, 498, 012068. [Google Scholar] [CrossRef]
- Singh, M.; Ahmed, S. IoT Based Smart Water Management Systems: A Systematic Review. Mater. Today Proc. 2021, 46, 5211–5218. [Google Scholar] [CrossRef]
- Sushma, N.; Suresh, H.N.; Lakshmi, J.M. Smart Water Flow Meter for Improved Measurement of Water Usage in a Smart City. In Proceedings of the 2022 Second International Conference on Advances in Electrical, Computing, Communication and Sustainable Technologies (ICAECT), Bhilai, India, 21–22 April 2022; pp. 1–6. [Google Scholar] [CrossRef]
- Syrmos, E.; Sidiropoulos, V.; Bechtsis, D.; Stergiopoulos, F.; Aivazidou, E.; Vrakas, D.; Vezinias, P.; Vlahavas, I. An Intelligent Modular Water Monitoring IoT System for Real-Time Quantitative and Qualitative Measurements. Sustainability 2023, 15, 2127. [Google Scholar] [CrossRef]
- Sammaneh, H.; Al-Jabi, M. IoT-Enabled Adaptive Smart Water Distribution Management System. In Proceedings of the 2019 International Conference on Promising Electronic Technologies (ICPET), Gaza City, Palestine, 23–24 October 2019; pp. 40–44. [Google Scholar] [CrossRef]
- Ramos, E.; Bux, R.K.; Medina, D.I.; Barrios-Piña, H.; Mahlknecht, J. Spatial and Multivariate Statistical Analyses of Human Health Risk Associated with the Consumption of Heavy Metals in Groundwater of Monterrey Metropolitan Area, Mexico. Water 2023, 15, 1243. [Google Scholar] [CrossRef]
- Sarisen, D.; Koukoravas, V.; Farmani, R.; Kapelan, Z.; Memon, F.A. Review of Hydraulic Modelling Approaches for Intermittent Water Supply Systems. J. Water Supply Res. Technol.-Aqua 2022, 71, 1291–1310. [Google Scholar] [CrossRef]
- Mokssit, A.; De Gouvello, B.; Chazerain, A.; Figuères, F.; Tassin, B. Building a Methodology for Assessing Service Quality under Intermittent Domestic Water Supply. Water 2018, 10, 1164. [Google Scholar] [CrossRef]
- Taylor, D.D.J.; Slocum, A.H.; Whittle, A.J. Demand Satisfaction as a Framework for Understanding Intermittent Water Supply Systems. Water Resour. Res. 2019, 55, 5217–5237. [Google Scholar] [CrossRef]
- Wunderlich, S.; St. George Freeman, S.; Galindo, L.; Brown, C.; Kumpel, E. Optimizing Household Water Decisions for Managing Intermittent Water Supply in Mexico City. Environ. Sci. Technol. 2021, 55, 8371–8381. [Google Scholar] [CrossRef]
- Ilaya-Ayza, A.E.; Benítez, J.; Izquierdo, J.; Pérez-García, R. Multi-Criteria Optimization of Supply Schedules in Intermittent Water Supply Systems. J. Comput. Appl. Math. 2017, 309, 695–703. [Google Scholar] [CrossRef]
- Klingel, P.; Nestmann, F. From Intermittent to Continuous Water Distribution: A Proposed Conceptual Approach and a Case Study of Béni Abbès (Algeria). Urban Water J. 2014, 11, 240–251. [Google Scholar] [CrossRef]
- Ameyaw, E.E.; Memon, F.A.; Bicik, J. Improving Equity in Intermittent Water Supply Systems. J. Water Supply Res. Technol.-Aqua 2013, 62, 552–562. [Google Scholar] [CrossRef]
- Zyoud, S. Mapping and Visualizing Global Knowledge on Intermittent Water Supply Systems. Water 2022, 14, 738. [Google Scholar] [CrossRef]
- Vairavamoorthy, K.; Gorantiwar, S.D.; Pathirana, A. Managing Urban Water Supplies in Developing Countries—Climate Change and Water Scarcity Scenarios. Phys. Chem. Earth Parts A/B/C 2008, 33, 330–339. [Google Scholar] [CrossRef]
- Suribabu, C.R.; Sivakumar, P.; Sivakumar, N. Volume Driven Analysis for House Level Water Supply Assessment in an Intermittent Water Supply System. ISH J. Hydraul. Eng. 2023, 29, 459–467. [Google Scholar] [CrossRef]
- Arun Mozhi Devan, P.; Pooventhan, K.; Mukesh Kumar, C.; Midhun Kumar, R. IoT Based Water Usage Monitoring System Using LabVIEW. In Smart Technologies and Innovation for a Sustainable Future; Al-Masri, A., Curran, K., Eds.; Advances in Science, Technology & Innovation; Springer International Publishing: Cham, Switzerland, 2019; pp. 205–212. [Google Scholar] [CrossRef]
- Nguyen, K.A.; Stewart, R.A.; Zhang, H.; Sahin, O.; Siriwardene, N. Re-Engineering Traditional Urban Water Management Practices with Smart Metering and Informatics. Environ. Model. Softw. 2018, 101, 256–267. [Google Scholar] [CrossRef]
- March, H.; Morote, Á.F.; Rico, A.M.; Saurí, D. Household Smart Water Metering in Spain: Insights from the Experience of Remote Meter Reading in Alicante. Sustainability 2017, 9, 582. [Google Scholar] [CrossRef]
- Ali, A.S.; Abdelmoez, M.N.; Heshmat, M.; Ibrahim, K. A Solution for Water Management and Leakage Detection Problems Using IoTs Based Approach. Internet Things 2022, 18, 100504. [Google Scholar] [CrossRef]
- Li, X.J.; Chong, P.H.J. Design and Implementation of a Self-Powered Smart Water Meter. Sensors 2019, 19, 4177. [Google Scholar] [CrossRef]
- March, H.; Ribera-Fumaz, R. Smart Contradictions: The Politics of Making Barcelona a Self-Sufficient City. Eur. Urban Reg. Stud. 2016, 23, 816–830. [Google Scholar] [CrossRef]
- Wiig, A. The Empty Rhetoric of the Smart City: From Digital Inclusion to Economic Promotion in Philadelphia. Urban Geogr. 2016, 37, 535–553. [Google Scholar] [CrossRef]
- Jan, F.; Min-Allah, N.; Düştegör, D. IoT Based Smart Water Quality Monitoring: Recent Techniques, Trends and Challenges for Domestic Applications. Water 2021, 13, 1729. [Google Scholar] [CrossRef]
- Palermo, S.A.; Maiolo, M.; Brusco, A.C.; Turco, M.; Pirouz, B.; Greco, E.; Spezzano, G.; Piro, P. Smart Technologies for Water Resource Management: An Overview. Sensors 2022, 22, 6225. [Google Scholar] [CrossRef] [PubMed]
- Tian, K.; Chen, Z. What Roles Do Smart Sensors Play in Citizens’ Water Use? From the Perspective of Household Water-Saving. Water Supply 2022, 22, 3519–3525. [Google Scholar] [CrossRef]
- Di Mauro, A.; Di Nardo, A.; Santonastaso, G.F.; Venticinque, S. An IoT System for Monitoring and Data Collection of Residential Water End-Use Consumption. In Proceedings of the 2019 28th International Conference on Computer Communication and Networks (ICCCN), Valencia, Spain, 29 July–1 August 2019; pp. 1–6. [Google Scholar] [CrossRef]
- Koo, A.M.; Kim, J.H.; Yoo, S.H. Household Willingness to Pay for a Smart Water Metering and Monitoring System: The Case of South Korea. Util. Policy 2022, 79, 101452. [Google Scholar] [CrossRef]
- Antzoulatos, G.; Mourtzios, C.; Stournara, P.; Kouloglou, I.O.; Papadimitriou, N.; Spyrou, D.; Mentes, A.; Nikolaidis, E.; Karakostas, A.; Kourtesis, D.; et al. Making Urban Water Smart: The SMART-WATER Solution. Water Sci. Technol. 2020, 82, 2691–2710. [Google Scholar] [CrossRef]
- Obaid, S.; Hosoi, K.; Ngoc, N.M.; Inoue, T.; Yokota, K. Evaluation of Water Consumption at District Scale by Analyzing Smart Water Meter Data. IOP Conf. Ser. Earth Environ. Sci. 2024, 1414, 012070. [Google Scholar] [CrossRef]
- Chen, S.L.; Chou, H.S.; Huang, C.H.; Chen, C.Y.; Li, L.Y.; Huang, C.H.; Chen, Y.Y.; Tang, J.H.; Chang, W.H.; Huang, J.S. An Intelligent Water Monitoring IoT System for Ecological Environment and Smart Cities. Sensors 2023, 23, 8540. [Google Scholar] [CrossRef]
- Mamede, H.; Neves, J.C.; Martins, J.; Gonçalves, R.; Branco, F. A Prototype for an Intelligent Water Management System for Household Use. Sensors 2023, 23, 4493. [Google Scholar] [CrossRef]
- Nguyẽn, H.P.; Nguyẽn, V.P.; Nguyẽn, M.H.; Lê, M.P. Development and Implementation of Smart Water Metering System Based on LoRa Technology. Sci. Technol. Dev. J.–Eng. Technol. 2022, 5. [Google Scholar] [CrossRef]
- Daminato, C.; Diaz-Farina, E.; Filippini, M.; Padrón-Fumero, N. The Impact of Smart Meters on Residential Water Consumption: Evidence from a Natural Experiment in the Canary Islands. Resour. Energy Econ. 2021, 64, 101221. [Google Scholar] [CrossRef]
- Myers, T.; Mohring, K.; Andersen, T. Semantic IoT: Intelligent Water Management for Efficient Urban Outdoor Water Conservation. In Semantic Technology; Lecture Notes in Computer Science; Wang, Z., Turhan, A.Y., Wang, K., Zhang, X., Eds.; Springer International Publishing: Cham, Switzerland, 2017; Volume 10675, pp. 304–317. [Google Scholar] [CrossRef]
- Mantoro, T.; Istiono, W. Saving Water with Water Level Detection in a Smart Home Bathtub Using Ultrasonic Sensor and Fuzzy Logic. In Proceedings of the 2017 Second International Conference on Informatics and Computing (ICIC), Jayapura, Indonesia, 1–3 November 2017; pp. 1–5. [Google Scholar] [CrossRef]
- Suresh, M.; Muthukumar, U.; Chandapillai, J. A Novel Smart Water-Meter Based on IoT and Smartphone App for City Distribution Management. In Proceedings of the 2017 IEEE Region 10 Symposium (TENSYMP), Cochin, India, 14–16 July 2017; pp. 1–5. [Google Scholar] [CrossRef]
- Che Soh, Z.H.; Shafie, M.S.; Shafie, M.A.; Noraini Sulaiman, S.; Ibrahim, M.N.; Afzal Che Abdullah, S. IoT Water Consumption Monitoring & Alert System. In Proceedings of the 2018 International Conference on Electrical Engineering and Informatics (ICELTICs), Banda Aceh, Indonesia, 19–20 September 2018; pp. 168–172. [Google Scholar] [CrossRef]
- Sushma, N.; Suresh, H.N.; Lakshmi, J.M.; Srinivasu, P.N.; Bhoi, A.K.; Barsocchi, P. A Unified Metering System Deployed for Water and Energy Monitoring in Smart City. IEEE Access 2023, 11, 80429–80447. [Google Scholar] [CrossRef]
- Jan, F.; Min-Allah, N.; Saeed, S.; Iqbal, S.Z.; Ahmed, R. IoT-Based Solutions to Monitor Water Level, Leakage, and Motor Control for Smart Water Tanks. Water 2022, 14, 309. [Google Scholar] [CrossRef]
- Supriya, K.E. IoT Based Real Time Water Level Monitoring Using Texas Instruments’ CC3200. Indian J. Sci. Technol. 2020, 13, 1720–1729. [Google Scholar] [CrossRef]
- Wister, M.A.; Leon, E.; Alejandro-Carrillo, A.; Pancardo, P.; Hernandez-Nolasco, J.A. Using IoT for Cistern and Water Tank Level Monitoring. Appl. Syst. Innov. 2024, 7, 112. [Google Scholar] [CrossRef]
- Lall, A.K.; Terala, A.; Goyal, A.; Chaudhari, S.; Rajan, K.S.; Chouhan, S.S. Behavioural Analysis of Water Consumption Using IoT-Based Smart Retrofit Meter. IEEE Access 2024, 12, 113597–113607. [Google Scholar] [CrossRef]
- Wahid, S.S.A.; Azli, S.A.; Ramli, M.S.; Hasan, K.K. Intelligent Water Flow Monitoring System Based on Internet of Things for Residential Pipeline. Indones. J. Electr. Eng. Comput. Sci. 2022, 27, 20–27. [Google Scholar] [CrossRef]
- Wilhelm, S.; Kasbauer, J.; Jakob, D.; Elser, B.; Ahrens, D. Exploiting Smart Meter Water Consumption Measurements for Human Activity Event Recognition. J. Sens. Actuator Netw. 2023, 12, 46. [Google Scholar] [CrossRef]
- Alejandrino, R.S.; Diomampo, M.C.G.; Balbin, J.R. Smart Water Meter with Cloud Database and Water Bill Consumption Monitoring via SMS and Mobile Application. In Proceedings of the 2022 IEEE International Conference on Automatic Control and Intelligent Systems (I2CACIS), Shah Alam, Malaysia, 25 June 2022; pp. 90–95. [Google Scholar] [CrossRef]
- Amir, A.; Fauzi, R.; Arifin, Y. Smart Water Meter for Automatic Meter Reading. IOP Conf. Ser. Mater. Sci. Eng. 2022, 1212, 012042. [Google Scholar] [CrossRef]
- Ray, A.; Goswami, S. IoT and Cloud Computing Based Smart Water Metering System. In Proceedings of the 2020 International Conference on Power Electronics & IoT Applications in Renewable Energy and its Control (PARC), Mathura, India, 28–29 February 2020; pp. 308–313. [Google Scholar] [CrossRef]
- Fuentes, H.; Mauricio, D. Smart Water Consumption Measurement System for Houses Using IoT and Cloud Computing. Environ. Monit. Assess. 2020, 192, 602. [Google Scholar] [CrossRef]
- Fikejz, J.; Rolecek, J. Proposal of a Smart Water Meter for Detecting Sudden Water Leakage. In Proceedings of the 2018 ELEKTRO, Mikulov, Czech Republic, 21–23 May 2018; pp. 1–4. [Google Scholar] [CrossRef]
- Srihari, M.M. Intelligent Water Distribution and Management System Using Internet of Things. In Proceedings of the 2018 International Conference on Inventive Research in Computing Applications (ICIRCA), Coimbatore, India, 11–12 July 2018; pp. 785–789. [Google Scholar] [CrossRef]
- Encuesta Nacional sobre Disponibilidad y Uso de Tecnologías de la Información en los Hogares (ENDUTIH). 2024. Available online: https://www.inegi.org.mx/programas/endutih/2024/ (accessed on 21 November 2025).
- Espressif Centralized Documentation Platform (CDP)|ESP32-WROOM-32E/ESP32-WROOM-32UE Datasheet. Available online: https://documentation.espressif.com/esp32-wroom-32e_esp32-wroom-32ue_datasheet_en.pdf (accessed on 30 November 2025).
- XKC-DS1603 Ultrasonic Liquid Level Sensor. Available online: https://www.xkc-sensor.com/detail/1434.html (accessed on 30 November 2025).
- Kalaš, D.; Šíma, K.; Kadlec, P.; Polanský, R.; Soukup, R.; Řeboun, J.; Hamáček, A. FFF 3D Printing in Electronic Applications: Dielectric and Thermal Properties of Selected Polymers. Polymers 2021, 13, 3702. [Google Scholar] [CrossRef]
- Water. Available online: https://www.un.org/en/global-issues/water (accessed on 18 November 2025).
- Weston, S.L.; Loubser, C.; Jacobs, H.E.; Speight, V. Short-Term Impacts of the Filling Transition across Elevations in Intermittent Water Supply Systems. Urban Water J. 2023, 20, 1482–1491. [Google Scholar] [CrossRef]
- Schwartz, D.; Fischhoff, B.; Krishnamurti, T.; Sowell, F. The Hawthorne Effect and Energy Awareness. Proc. Natl. Acad. Sci. USA 2013, 110, 15242–15246. [Google Scholar] [CrossRef]
- Fry, D.E. The Hawthorne Effect Revisited. Dis. Colon Rectum 2018, 61, 6–7. [Google Scholar] [CrossRef]
- Stewart, R.A.; Willis, R.M.; Panuwatwanich, K.; Sahin, O. Showering Behavioural Response to Alarming Visual Display Monitors: Longitudinal Mixed Method Study. Behav. Inf. Technol. 2013, 32, 695–711. [Google Scholar] [CrossRef]
- Cominola, A.; Giuliani, M.; Castelletti, A.; Fraternali, P.; Gonzalez, S.L.H.; Herrero, J.C.G.; Novak, J.; Rizzoli, A.E. Long-Term Water Conservation Is Fostered by Smart Meter-Based Feedback and Digital User Engagement. npj Clean Water 2021, 4, 29. [Google Scholar] [CrossRef]
- Ambaum, M.; Corten, R.; Lambooij, M.; Van Der Aa, M.; Van Harreveld, F.; Buskens, V. Determinants of Long-Term Water and Energy Conservation Behavior: An Integrated Review. Sustainability 2024, 16, 4399. [Google Scholar] [CrossRef]


Disclaimer/Publisher’s Note: The statements, opinions and data contained in all publications are solely those of the individual author(s) and contributor(s) and not of MDPI and/or the editor(s). MDPI and/or the editor(s) disclaim responsibility for any injury to people or property resulting from any ideas, methods, instructions or products referred to in the content. |
© 2026 by the authors. Licensee MDPI, Basel, Switzerland. This article is an open access article distributed under the terms and conditions of the Creative Commons Attribution (CC BY) license.