1. Introduction
Air conditioning is one of the major energy consumption technologies, accounting for about 20% of the total electricity used in buildings worldwide [
1]. The global air conditioning market was about USD 119.36 billion in 2022 [
2]. Dehumidification is an important part of air conditioning systems. Air humidity needs to be well controlled to prevent excessive perspiration buildup caused by moisture saturation in the air, droplets on cold-water pipes, wetness on the surfaces of furniture and doors, mould growth, dust mite proliferation, and other moisture-related conditions. According to ASHRAE standards, a relative humidity between 30% and 60% should be maintained in occupied spaces. The average seasonal relative humidity in the UK is about 75~85% [
3]. There is a significant need for dehumidification.
Air dehumidification can also enhance the performance of evaporative cooling technologies. Evaporative cooling is one of the most cost-effective cooling technologies. It does not require a compressor or refrigerant and has low installation and maintenance costs. It is eco-friendly and energy efficient, especially in dry climates. Its global market is set for substantial growth, with a projected value of USD 6.5 billion by the end of 2024 [
4]. However, the technology is subject to ambient conditions and performs poorly in humid weather due to the reduced effectiveness of evaporative cooling. Integrating the technology with air dehumidification can overcome this limitation and unlock its potential in district, data centre, and industrial cooling applications. Common integration methods include solid desiccants, liquid desiccants, and membranes [
5].
More than 90% of air dehumidification systems are based on a moisture-condensing process, during which the air is cooled down to its dew points [
6]. Due to the overcooling and reheating of air, using a conventional mechanical vapour compression cooling cycle is not energy efficient. Isothermal membrane-based air dehumidification (MAD) is a recently emerged alternative driven by the chemical potential difference in moisture between the two sides of the membrane. It does not require heat input to the membrane and has superior thermo-economic performance than conventional dehumidification approaches [
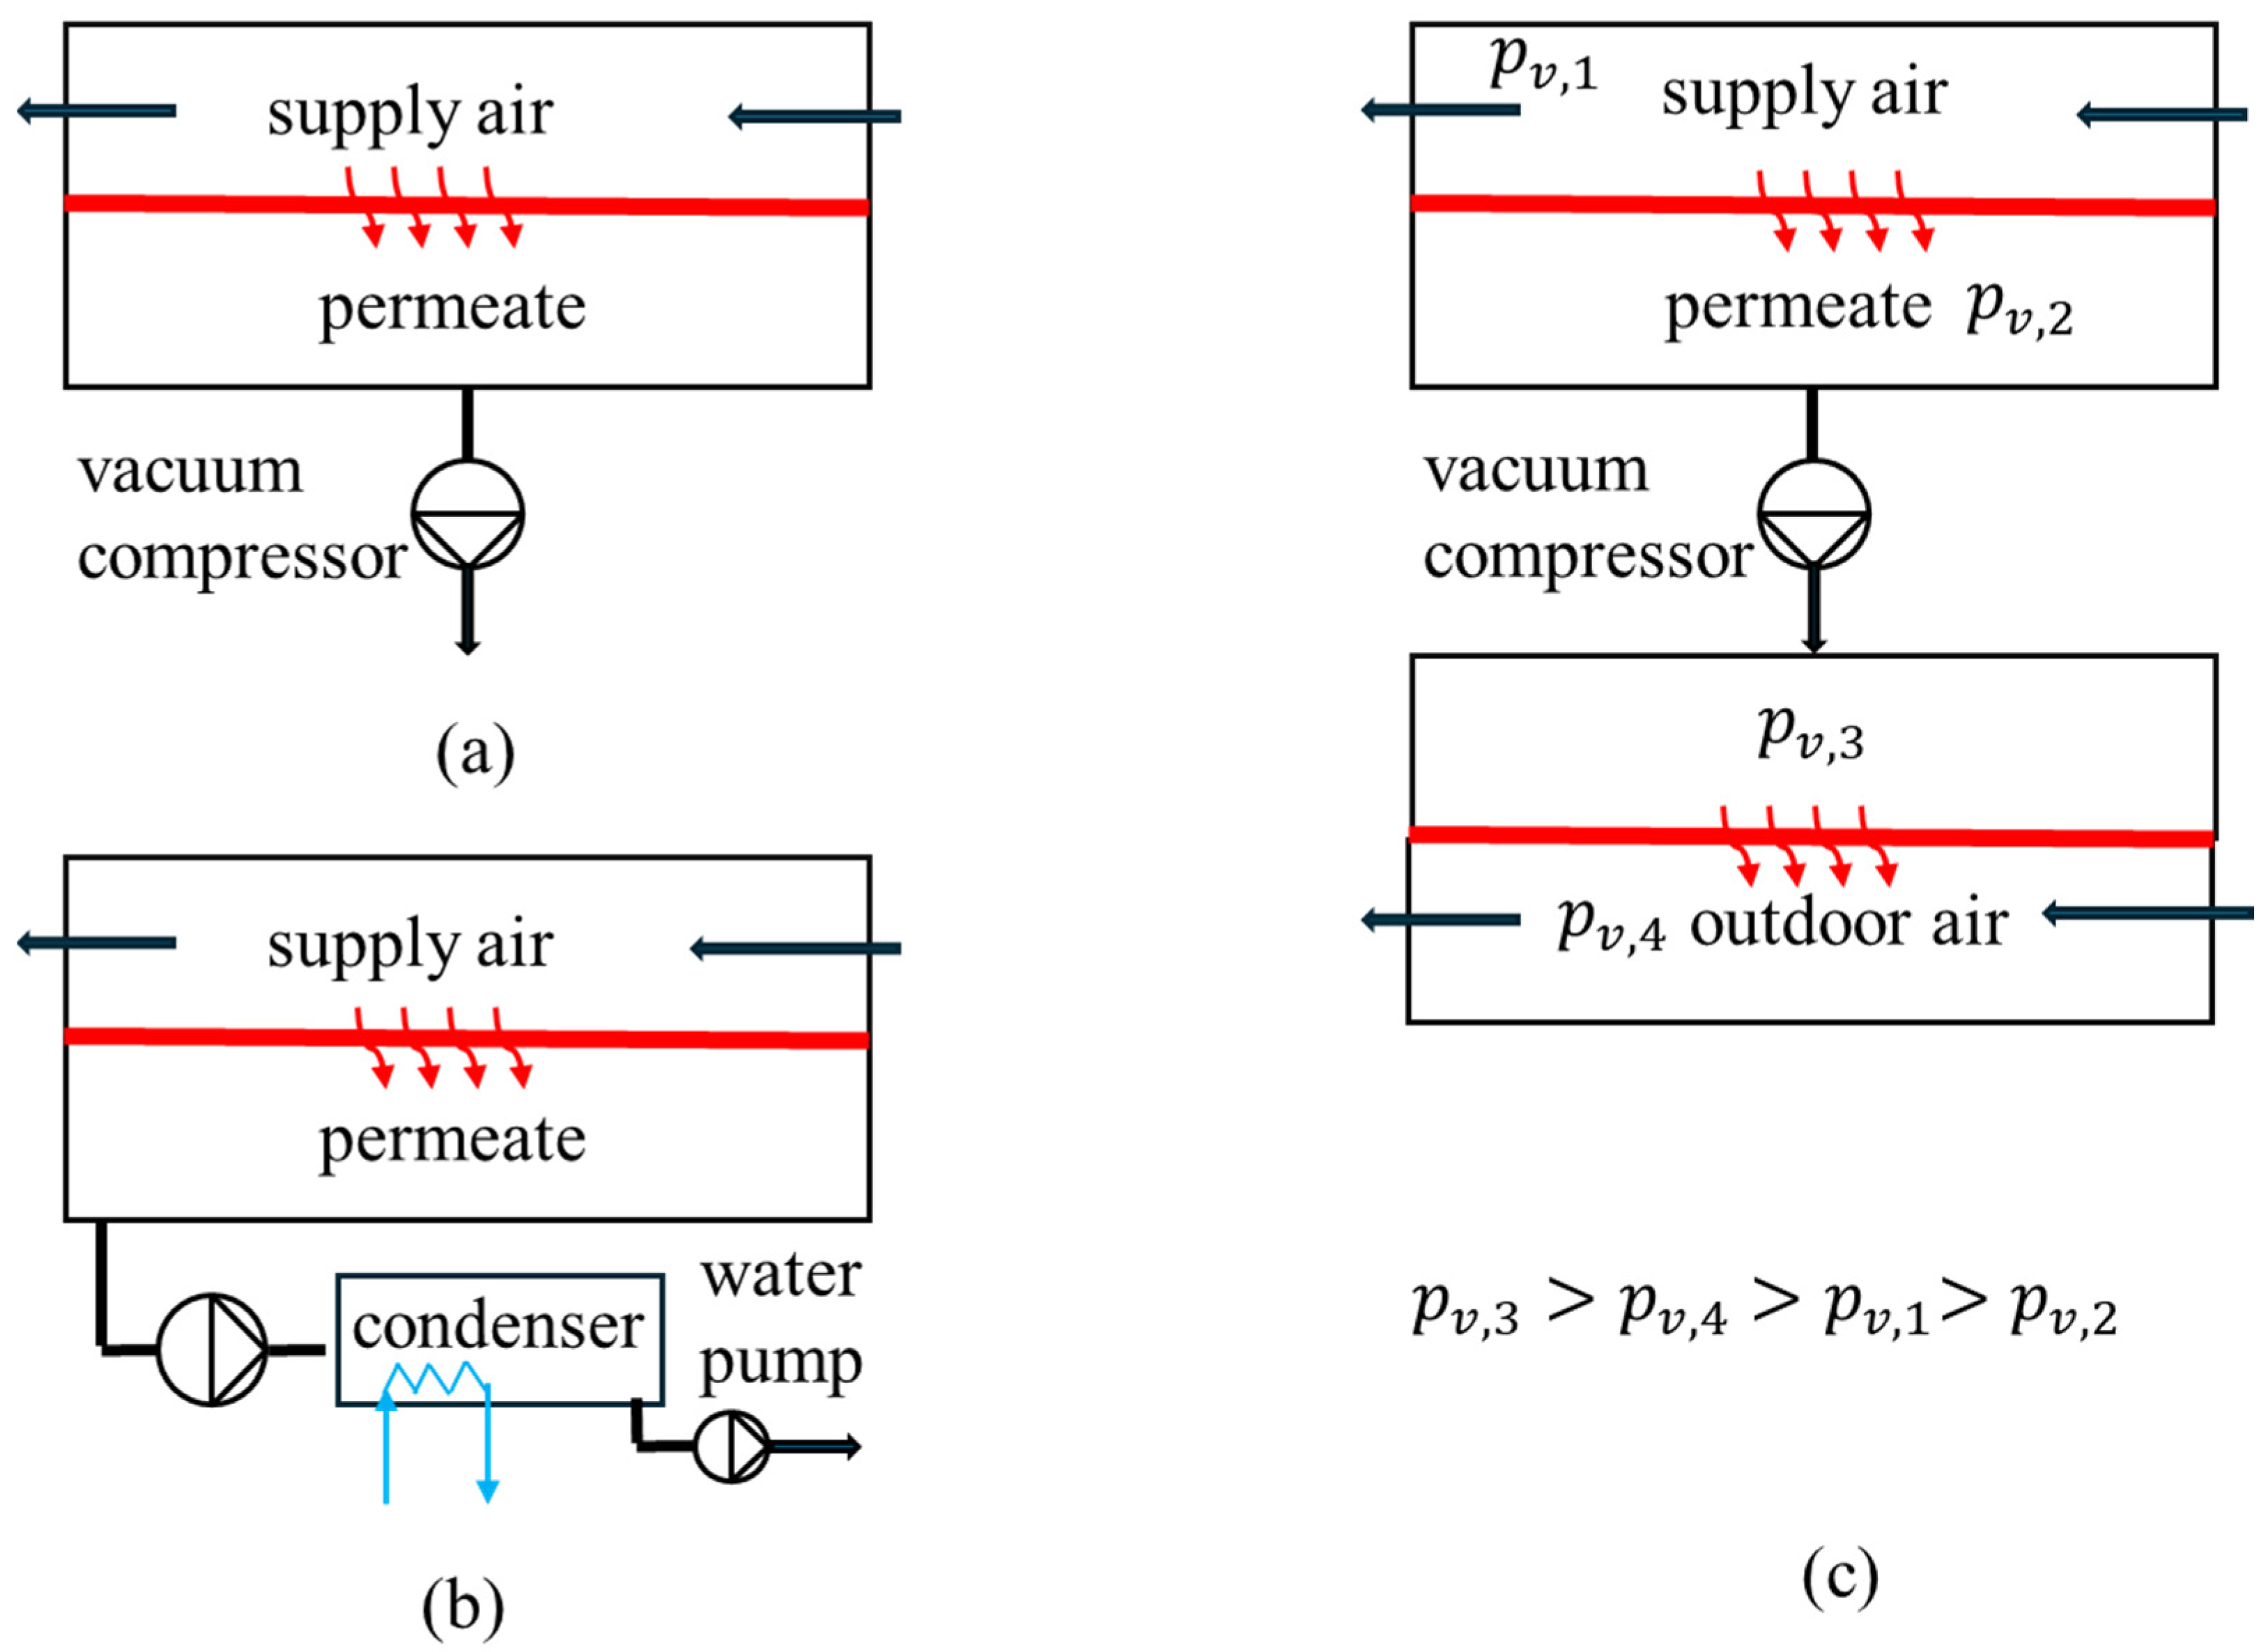
6]. During the process, a vacuum pump provides low moisture pressure, facilitating moisture transfer from the humid air through the selective membrane. There are three main methods to deal with the moisture on the permeate side and maintain a low pressure, as shown in
Figure 1: (a) moisture compression to atmospheric pressure, followed by discharge of superheated vapour; (b) moisture compression to a slightly higher pressure, followed by moisture condensation and liquid water discharge through a pump; and (c) moisture compression to a slightly higher pressure, followed by moisture permeance through other membranes and moisture discharge into the ambient air.
The first method has been investigated extensively in the past few years [
7,
8,
9]. It has a relatively simple structure but large power consumption due to the vacuum pump. The vacuum pump increases the pressure of permeating air/moisture from 1~2 kPa to atmospheric pressure. The large pressure ratio leads to a high power input. According to a pilot system, the dehumidification efficiency and electricity input were about 2.0 and 8.3 kW to dehumidify air from 25 g/kg to 15 g/kg at 30 °C with a flow rate of 2000 m
3/h [
10]. Its advantages over conventional refrigeration cycles have yet to be demonstrated. The efficiency of compressing the moisture/air mixture is limited by the high pressure ratio. As air accounts for only a small proportion of the mixture on the permeate side, an efficiency-boosting strategy has been proposed, involving two pumping steps to reduce the electricity consumption of water vapour compression [
11]. The fundamental concept is similar to that shown in
Figure 1b.
In the second method, the water vapour on the permeate side is compressed slightly above its saturation pressure. It is then condensed in a cooler and exhausted to ambient conditions using a water pump [
12,
13]. The moisture and cooling medium flow in different heat exchanger channels and are not in contact. Given that the saturation pressure of water vapour at room temperature is around 3~5 kPa, the pressure ratio and power input of the compressor are significantly reduced. Theoretically, this method has thermodynamic advantages. However, in practice, air permeance through the membrane is inevitable. The water vapour fraction in the permeate stream is about 90% to 99%, depending on the membranes’ selectivity [
7]. The volumetric flow rate of air at low pressure is large. For example, under conditions of permeating moisture and an air flow rate of 0.1 mol/s and 0.001 mol/s, the volumetric flow rate of air is about 0.6 L/s at 4 kPa. If not removed promptly, the air will accumulate in the cooler, leading to unsteady operation of the compressor, together with increasing outlet pressure and power consumption and decreasing mechanical efficiency and lifespan. If a vacuum pump is in place for air removal, then it will compress the air along with the saturated water vapour and may still have a large volumetric flow rate and power input. Re-evaporation of water in the condenser may occur. The second method has yet to tackle the challenge of air removal.
In the third method, the water vapour is compressed to a pressure higher than the partial pressure of moisture in the outdoor air and is exhausted to the ambient through a second-stage membrane. The partial pressures of moisture in the different streams are depicted in
Figure 1c. The chemical potential of moisture is highest at the compressor outlet and lowest at its inlet. This method can achieve higher efficiency through non-isothermal operation [
14,
15]. Nevertheless, it faces the challenge of air removal, especially when air penetrates through both stages of the membranes. Two extra vacuum pumps connected to the p
v,2 and p
v,3 chambers will be needed to transfer the permeating air back to the ambient and maintain sub-atmospheric pressure at the compressor’s inlet and outlet. The vacuum pumps will transfer both air and moisture. Given the air permeance rate, the mass flow rate of the mixture increases with a decreased partial pressure of the air, which will be modelled in
Section 3. The extra vacuum pumps may still contribute to high power consumption and unsteady operation.
To overcome the above obstacles and increase the applicability of MAD in a real operation environment, this paper proposes an innovative membrane-based dehumidification approach using a vacuum mixing condenser. It features the direct mixing of moisture and cooling water. The gas mixture on the permeate side is compressed under a low pressure ratio and then the compressed moisture/air is mixed with the cooling water in the vacuum condenser. The direct mixing condenser diminishes the cost and thermodynamic irreversibility of heat exchange, thus reducing the compressor power and increasing dehumidification efficiency. Given the large latent heat of moisture for condensation, the cooling water has a two orders of magnitude (102) higher mass flow rate than the permeating moisture and a 104-fold higher rate than the permeating air. The condensed moisture, air, and cooling water are then pressurized by a multiphase pump and sent to a cooling tower, facilitating continuous air removal. The significantly larger mass flow rate of water enables a low temperature and power input for the pump under quasi-isothermal conditions, as it is more efficient than a conventional adiabatic compression process. The fundamentals, mathematical models, thermodynamic analysis, and results are presented in the following sections.
2. System Description and Characteristics
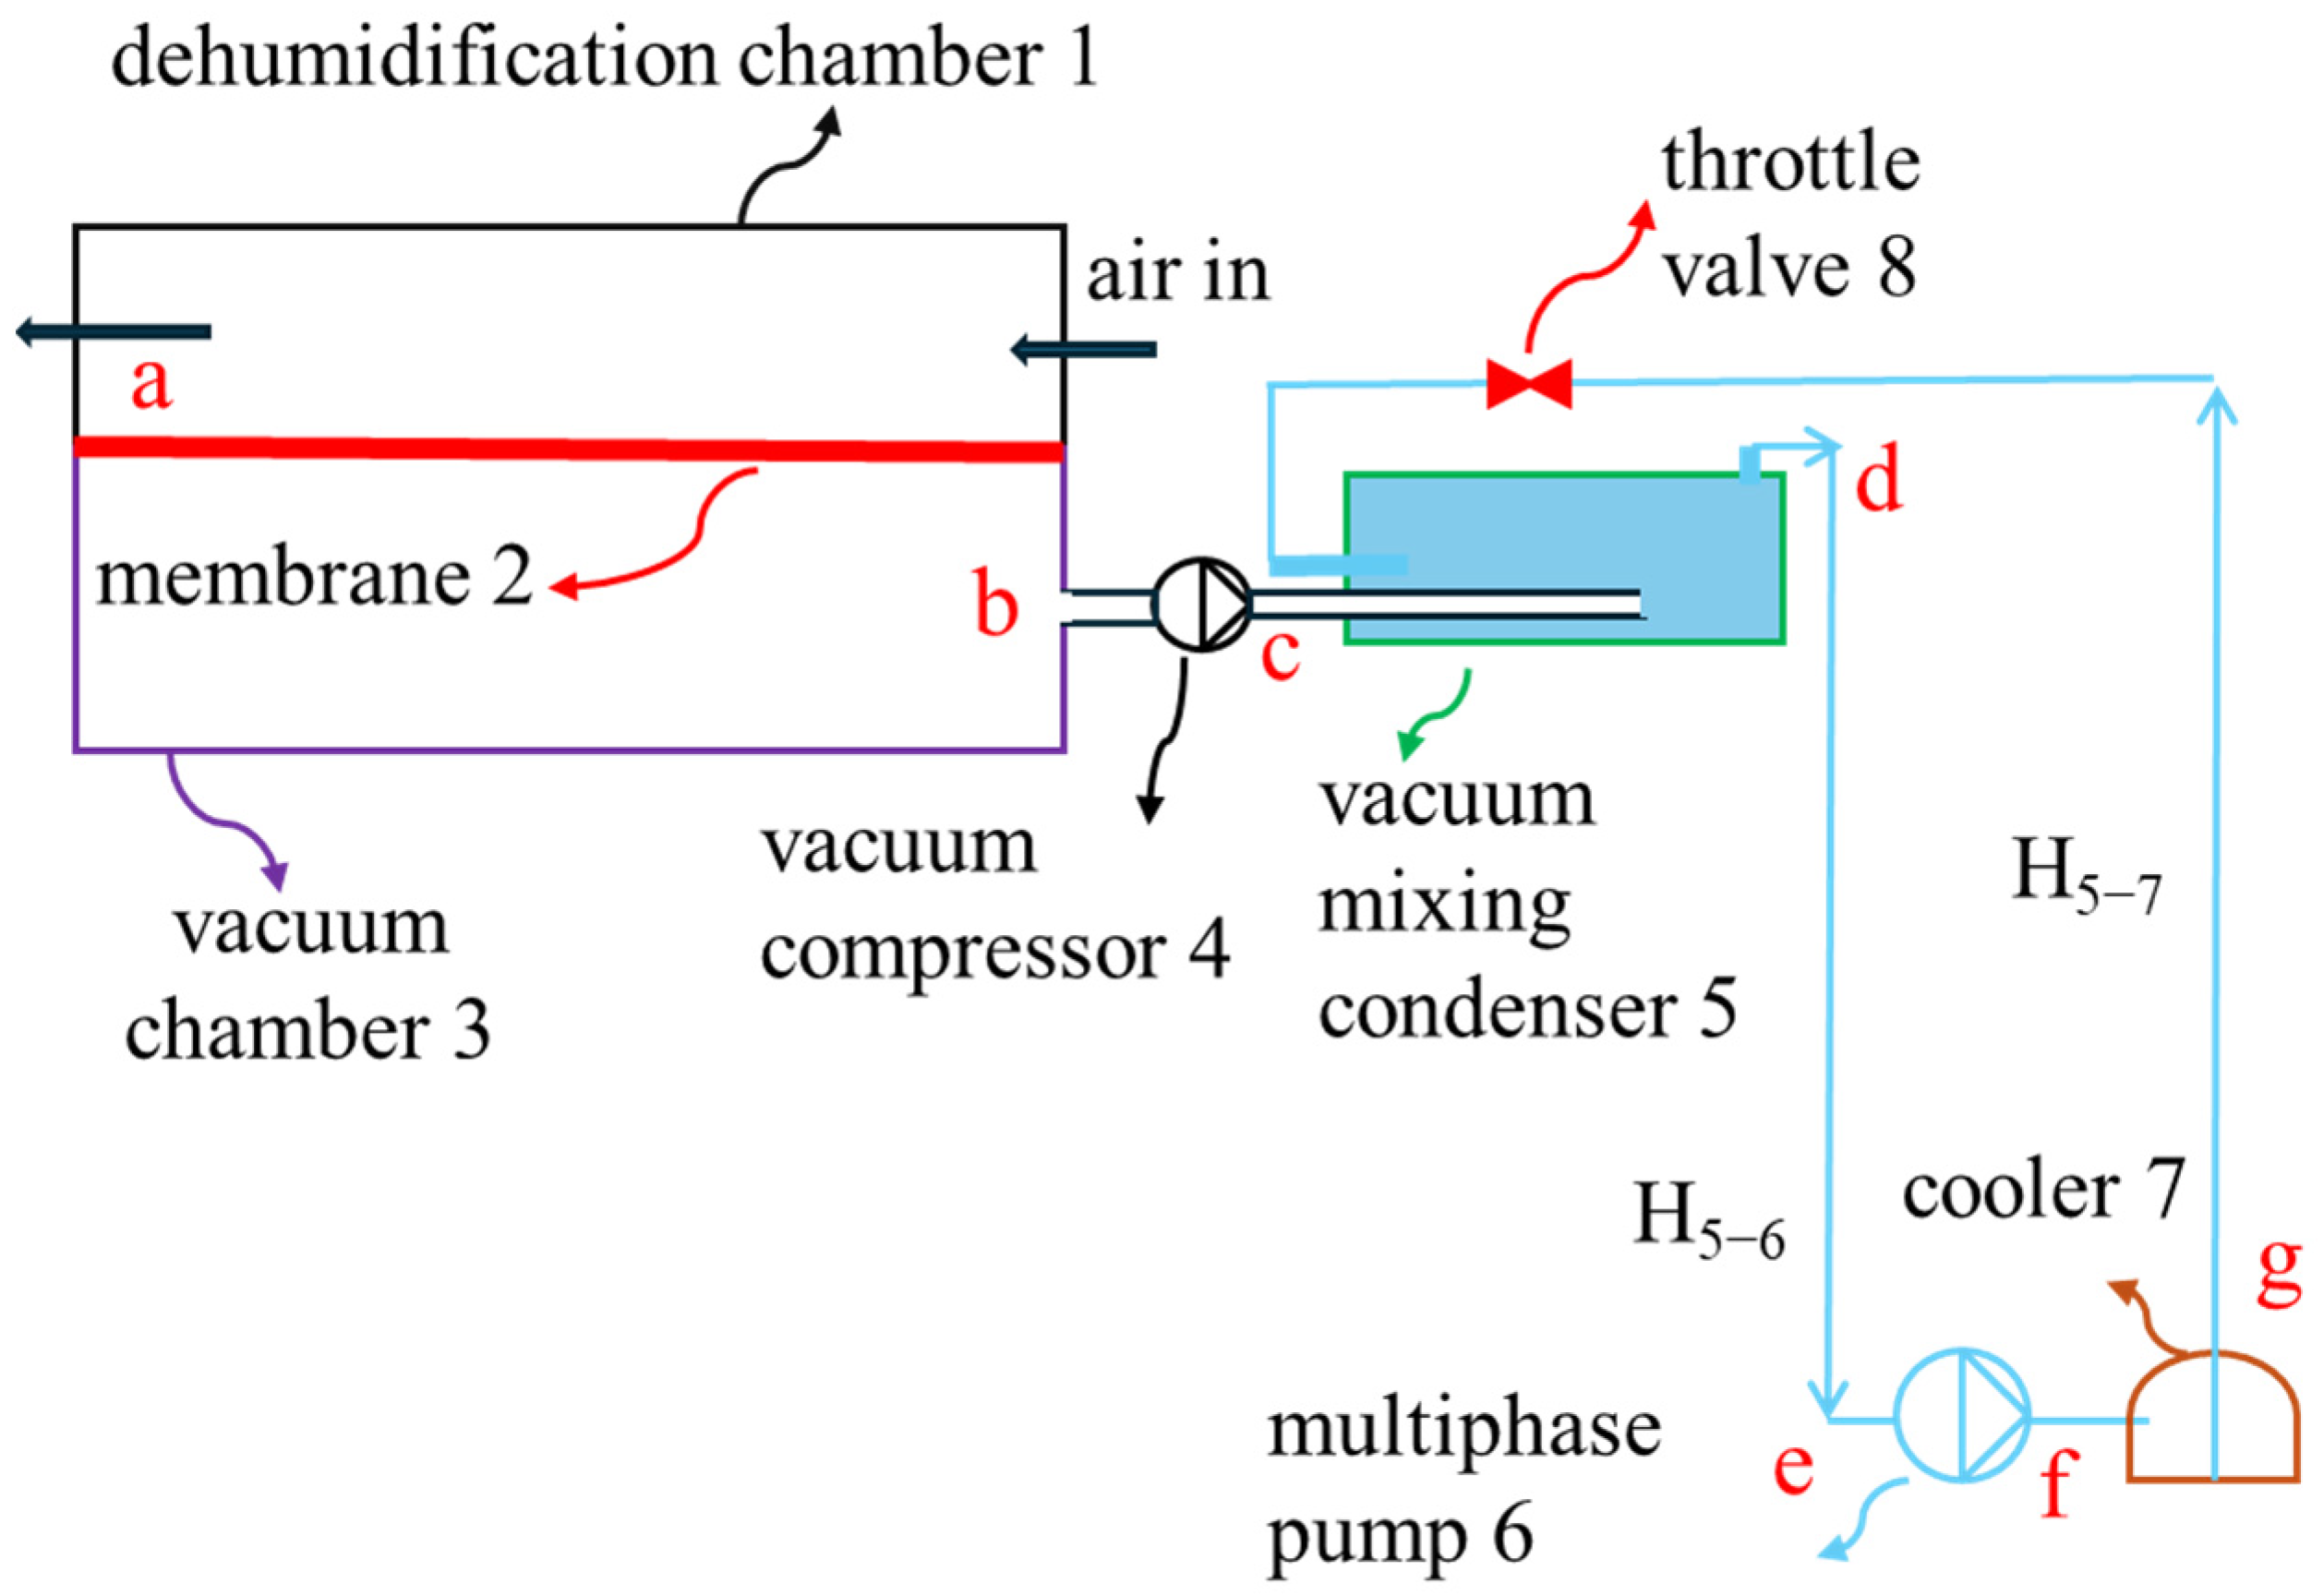
The proposed MAD system is illustrated in
Figure 2. It consists of a dehumidifier chamber (1), membrane (2), vacuum chamber (3), vacuum compressor (4), vacuum mixing condenser (5), multiphase pump (6), cooling tower (7), and throttle valve (8). H
5–6 denotes the elevation difference between the vacuum mixing condenser (5) and the multiphase pump (6), while H
5–7 represents the elevation difference between the vacuum mixing condenser (5) and cooler (7). H
5–7 is larger than H
5–6 but should be less than 10.3 m, restricted by the head at 1 atmospheric pressure. As the condenser has a sub-atmospheric pressure of several kPa and the cooler is at atmospheric pressure, the cooler can be positioned lower than the condenser without any need for pumping. The cooling water has a mass flow rate 10
4~10
5 times higher than the permeating air and a specific volume 10
−4~10
−5 times lower, making the volumetric flow rates of water and air at the outlet of the condenser comparable.
The T-s diagram of moisture is shown in
Figure 3. Points a, b, and c are in the vapour state, while the rest are liquid. Points a, b, c, d, e, f, and g represent the thermodynamic state of water at the outlets of the supply air (1), vacuum chamber (3), vacuum compressor (4), condenser (5), gas pressurization pipe (H
5–6), pump (6), and cooler (7), respectively, as indicated in
Figure 2. The temperature difference between the liquid points is usually less than 3 °C. The driving forces for the components are (a) electricity for the vacuum compressor and multiphase pump, (b) the pressure difference between the inlet and outlet for the membrane, condenser, and throttle valve, and (c) gravity for the pipe between the condenser and multiphase pump. The flow in the condenser is analogous to that in a typical refrigeration condenser. There is a slight pressure drop during the condensation process due to irreversibility, which causes a lower pressure at the outlet.
The humid air at 1 atm flows into the dehumidifier chamber, and the dehumidified air is used for ventilation or evaporative cooling purposes. The moisture penetrates through the membrane into the vacuum chamber. The low-pressure moisture and permeating air are then compressed by the vacuum compressor to a pressure of about 3~10 kPa. The compressed moisture is condensed directly in the vacuum mixing condenser by the cooling water from the cooler. The condensed moisture, cooling water, and non-condensable air from the condenser are pressurized by the multiphase pump and gravity due to the elevation difference (H5–6). The pressurized water/air mixture flows into the cooler and is cooled down. This is similar to a conventional tower cooling process. The air from the multiphase pump returns to the ambient via the cooler. The cooled water from the cooler flows to the condenser. The throttle valve reduces the water pressure if H5–7 is less than the atmospheric head. The cooling water absorbs the condensation heat of the moisture in the vacuum mixing condenser and carries away the non-condensable gas.
The position of the multiphase pump is flexible. The mixture pump can be placed at an elevation similar to that of the cooler, so that the mixture utilizes the gravitational work (gH5–6) for pressurization and increases the pump’s inlet pressure with a lower air volumetric flow rate, thereby reducing the pumping power and technical requirements. If the pump is placed at a higher elevation than the cooler, it can still use gravity to increase its inlet pressure. In this case, its outlet pressure can be less than 1 atm.
Compared with existing methods, this is the first time that a direct vacuum mixing condenser and a multiphase pump have been used for MAD. The direct condensation of moisture by the cooling water has the advantages of a decreased condensation temperature and pressure, fewer pressure drops, and a smaller condenser size. The existing methods employ an indirect heat exchanger to condense the moisture, which usually requires a minimum temperature difference between the moisture and cooling water of 5 °C for economic reasons. The heat exchanger also causes pressure drops for fluids on both sides. The direct mixing process is more efficient in heat exchange and provides a high flow rate of liquid water for isothermal pressurization of the permeating air. The air–water mixture in the condenser has a pressure of about 5 kPa and needs to be pressurized to 101 kPa for air removal back to ambient. For indirect cooling, the mixture will be in a superheated gas state during the pressurization of the vacuum pump, and the exhaust temperature will be significantly higher than the ambient temperature, negatively impacting the power consumption of the vacuum pump. It is challenging to achieve isothermal pressurization using a conventional indirect cooling method. For direct cooling, the large heat capacity of the cooling water overcomes this challenge.
The multiphase pump technology, or liquid–gas mixture pump technology, has reached a high degree of maturity. The technology has been applied in the petrochemical industry [
16], ozonated water production [
17], and subsea gas and oil production [
18], etc. Products from different companies are available [
19,
20,
21,
22]. Multiphase pumps can transport oil, gas, and water as one common mixture without separating the gas from the liquids [
23]. They can work with various gas volume fractions (GVFs), depending on the type. Centrifugal pumps are mainly used for low inlet GVFs (<10%) [
24]. Electrical submersible pumps usually handle GVFs of up to 40% [
25]. Screw pumps can deal with GVFs higher than 90% [
26]. Therefore, the multiphase pump is technically feasible for the proposed approach.
4. Results and Discussion
The dehumidification capacity is related to moisture transfer and can vary with applications. Given a moisture flow rate through the membrane, the molar fraction of permeating air, permeate pressure, flow rate of the cooling water, pressure in the vacuum mixing condenser, and height difference between the multiphase pump and condenser are five important factors for the system’s power consumption. Specifically, the permeating air, the flow rate of the cooling water, and the pressure in the vacuum mixing condenser impact the power inputs of both the compressor and the pump. The permeate pressure affects the input to the compressor, while the height difference influences the input to the pump. The direct effects of these variables are discussed in
Section 4.1,
Section 4.2,
Section 4.3,
Section 4.4 and
Section 4.6.
Table 1 summarizes the assumptions. The compressor has a low pressure ratio, e.g., <4, and its efficiency is referenced to that of conventional refrigeration compressors. The multiphase pump has a maximum pressure of 1 atm, which is lower than the pressure of conventional multiphase pumps in petroleum, chemical, and medical industry applications. Low pressure reduces leakage loss and permits high volumetric efficiency.
The novelty of the proposed dehumidifier lies in its thermodynamic cycle rather than its membrane. Therefore, the following discussion will focus on the thermodynamic performance, using the COP as a key indicator. The COP depends on the above five variables. It will be fixed once the variables are known. While the properties of the membrane do not directly affect the COP, they may influence the permeate pressure and mass transfer rate, ultimately impacting the COP, as discussed in
Section 4.5.
4.1. Molar Fraction of Permeating Air
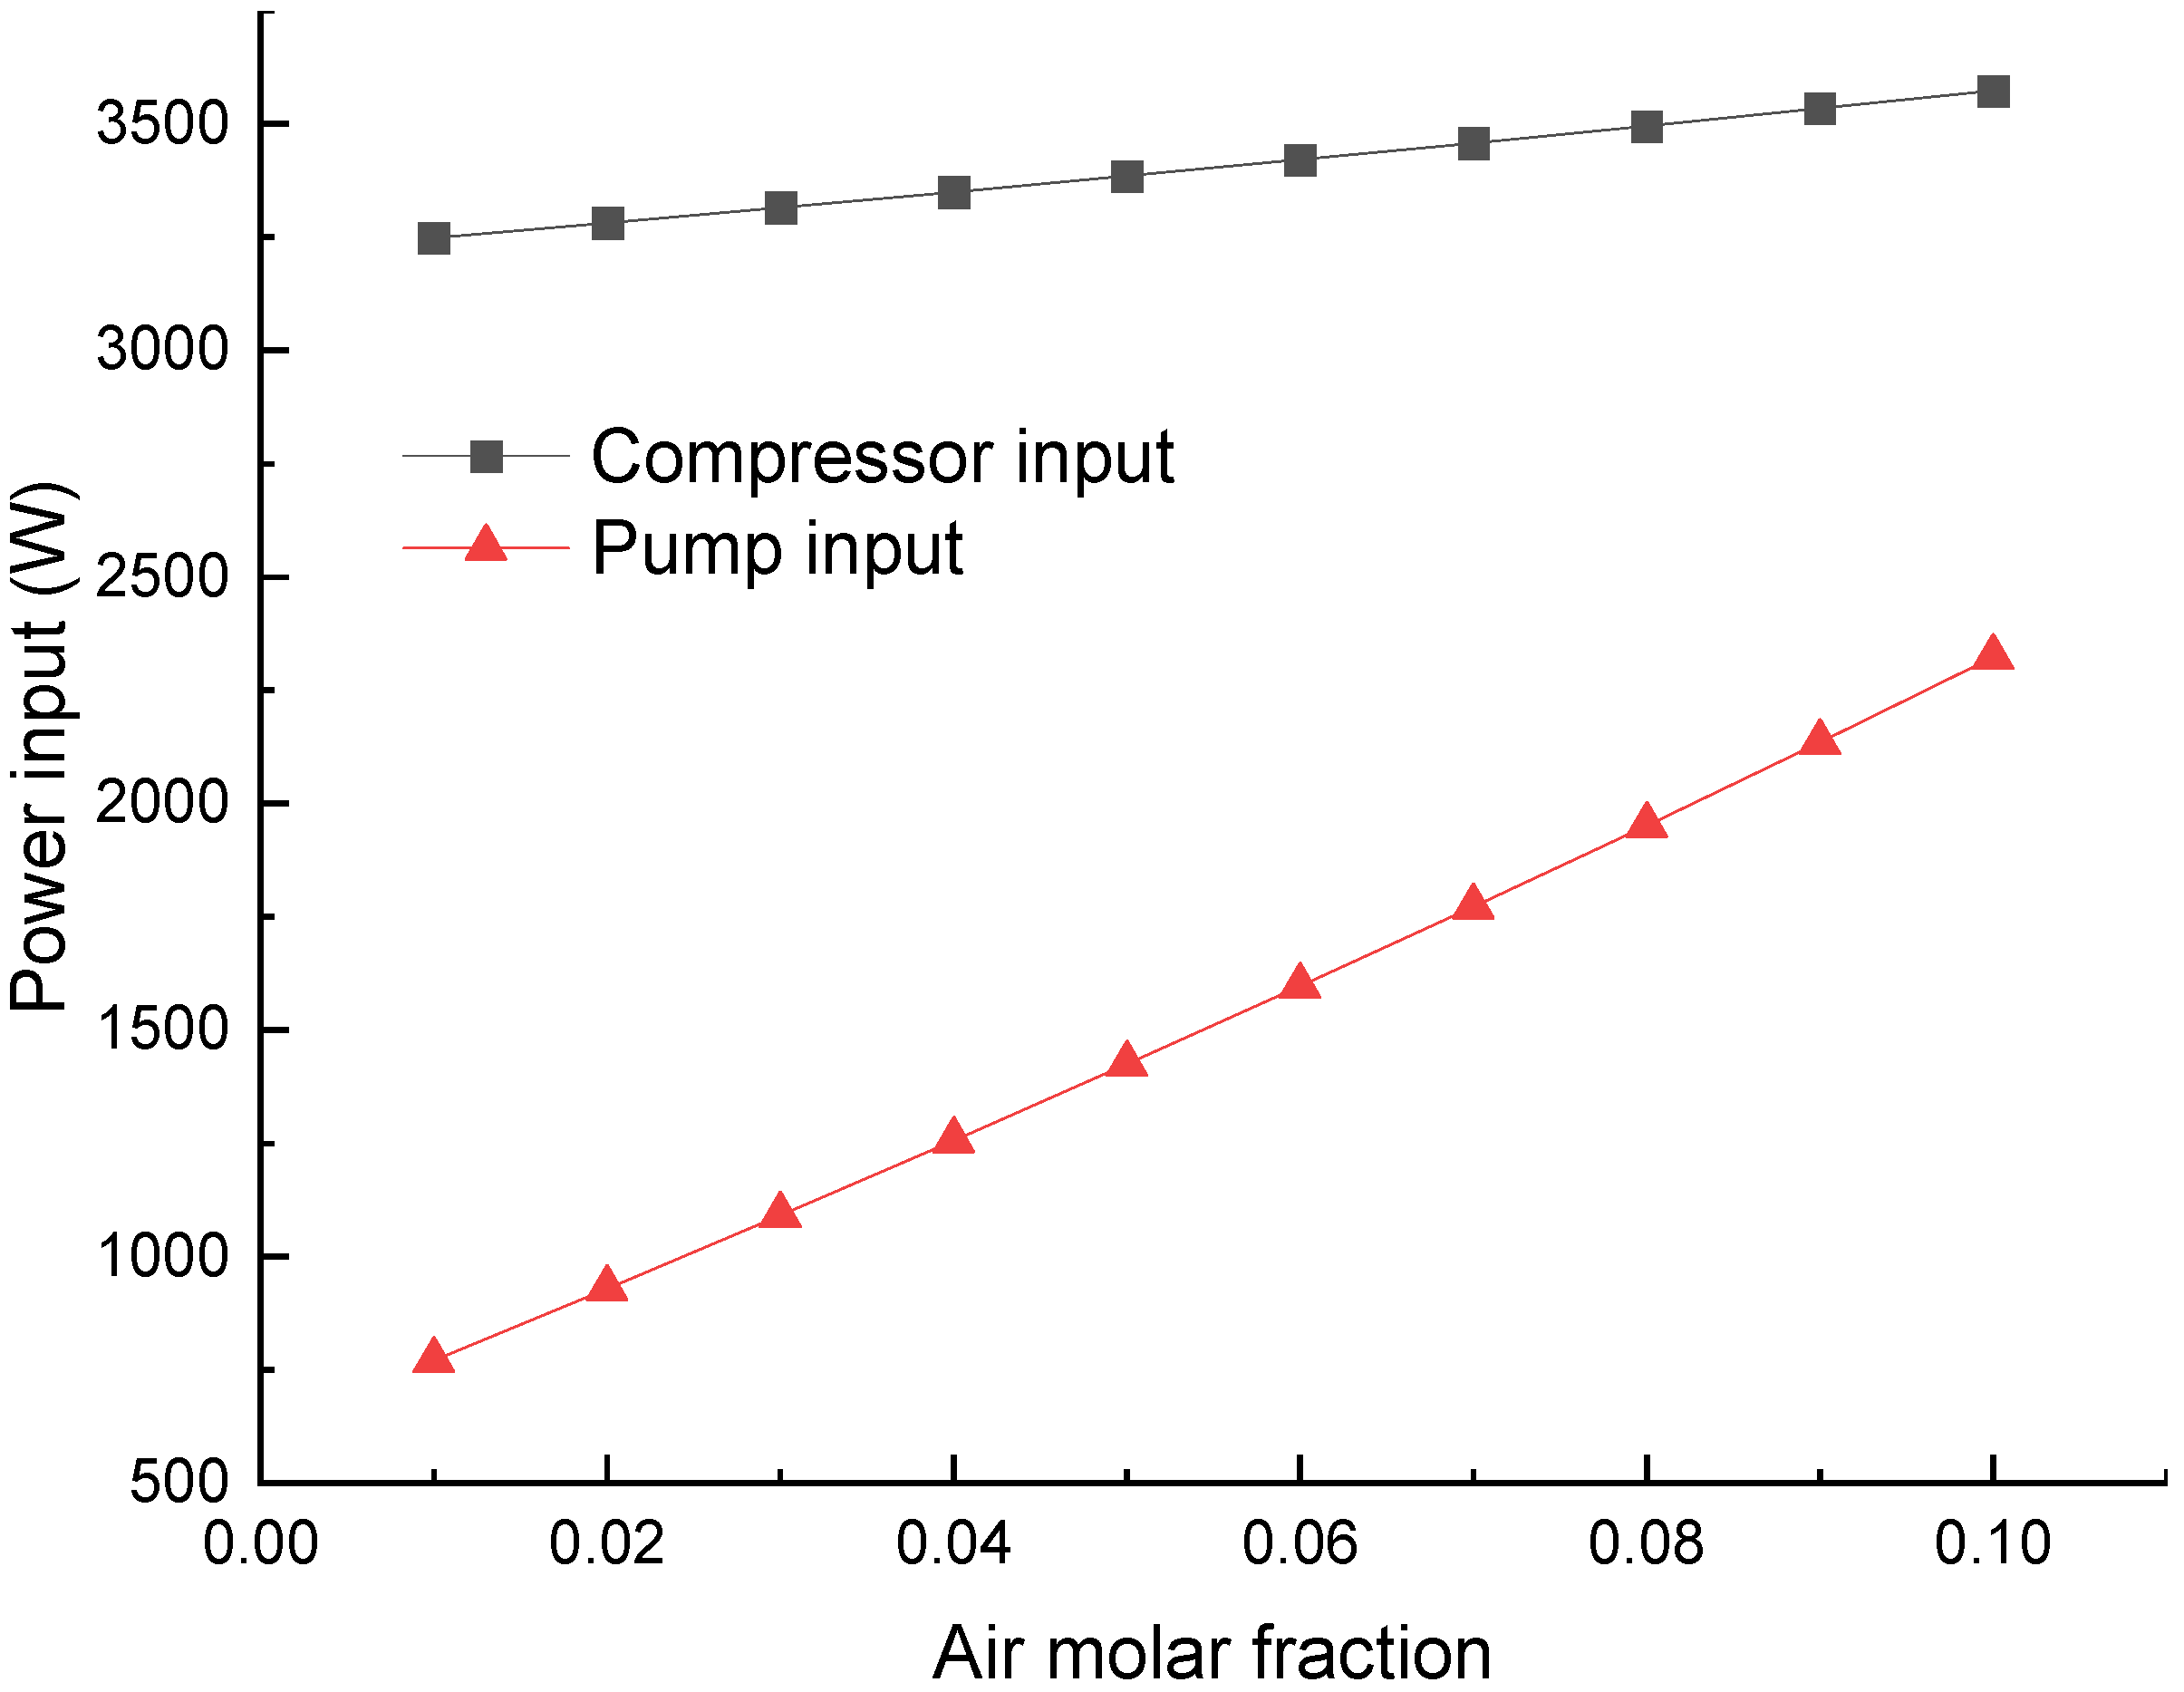
Figure 5 shows variations in the input power of the compressor and multiphase pump. On the permeate side, the total pressure of moisture and air is 1.58 kPa, and the molar fraction of air through the membrane ranges from 1% to 10%. The water from the cooler has a temperature of 25 °C and a flow rate of 3.6 kg/s, about 200 times that of the moisture. The mixture temperature in the condenser is 27.9 °C. The condenser inlet pressure is 4 kPa, which is 0.25 kPa higher than the saturation pressure of water. No gravity-driven pressurization is considered (H
5–6 = H
5–7 = 0), and the outlet pressure of the multiphase pump is 1 atm. In the simulation, if not specified, the cooling water flow rate, condenser pressure, permeate side pressure, and height difference are the same as those in this section. When investigating the influence of one variable, the other variables remain unchanged.
As the molar fraction of air increases, the power consumption of both the compressor and the multiphase pump rises. A larger air fraction leads to a higher molar flow rate of the mixture through the compressor and pump. The power increment for the pump is more significant than for the compressor due to the remarkable pressure increment (4 kPa to 101 kPa). A selective membrane may have an air permeance of 1% to 2% of the moisture permeance through the membrane. In this case, the compressor and multiphase pump consume about 3248~3281 W and 771~929 W of electricity, respectively. Although the compressor has a smaller pressure ratio, its volumetric flow rate is much larger, leading to its predominance in power consumption.
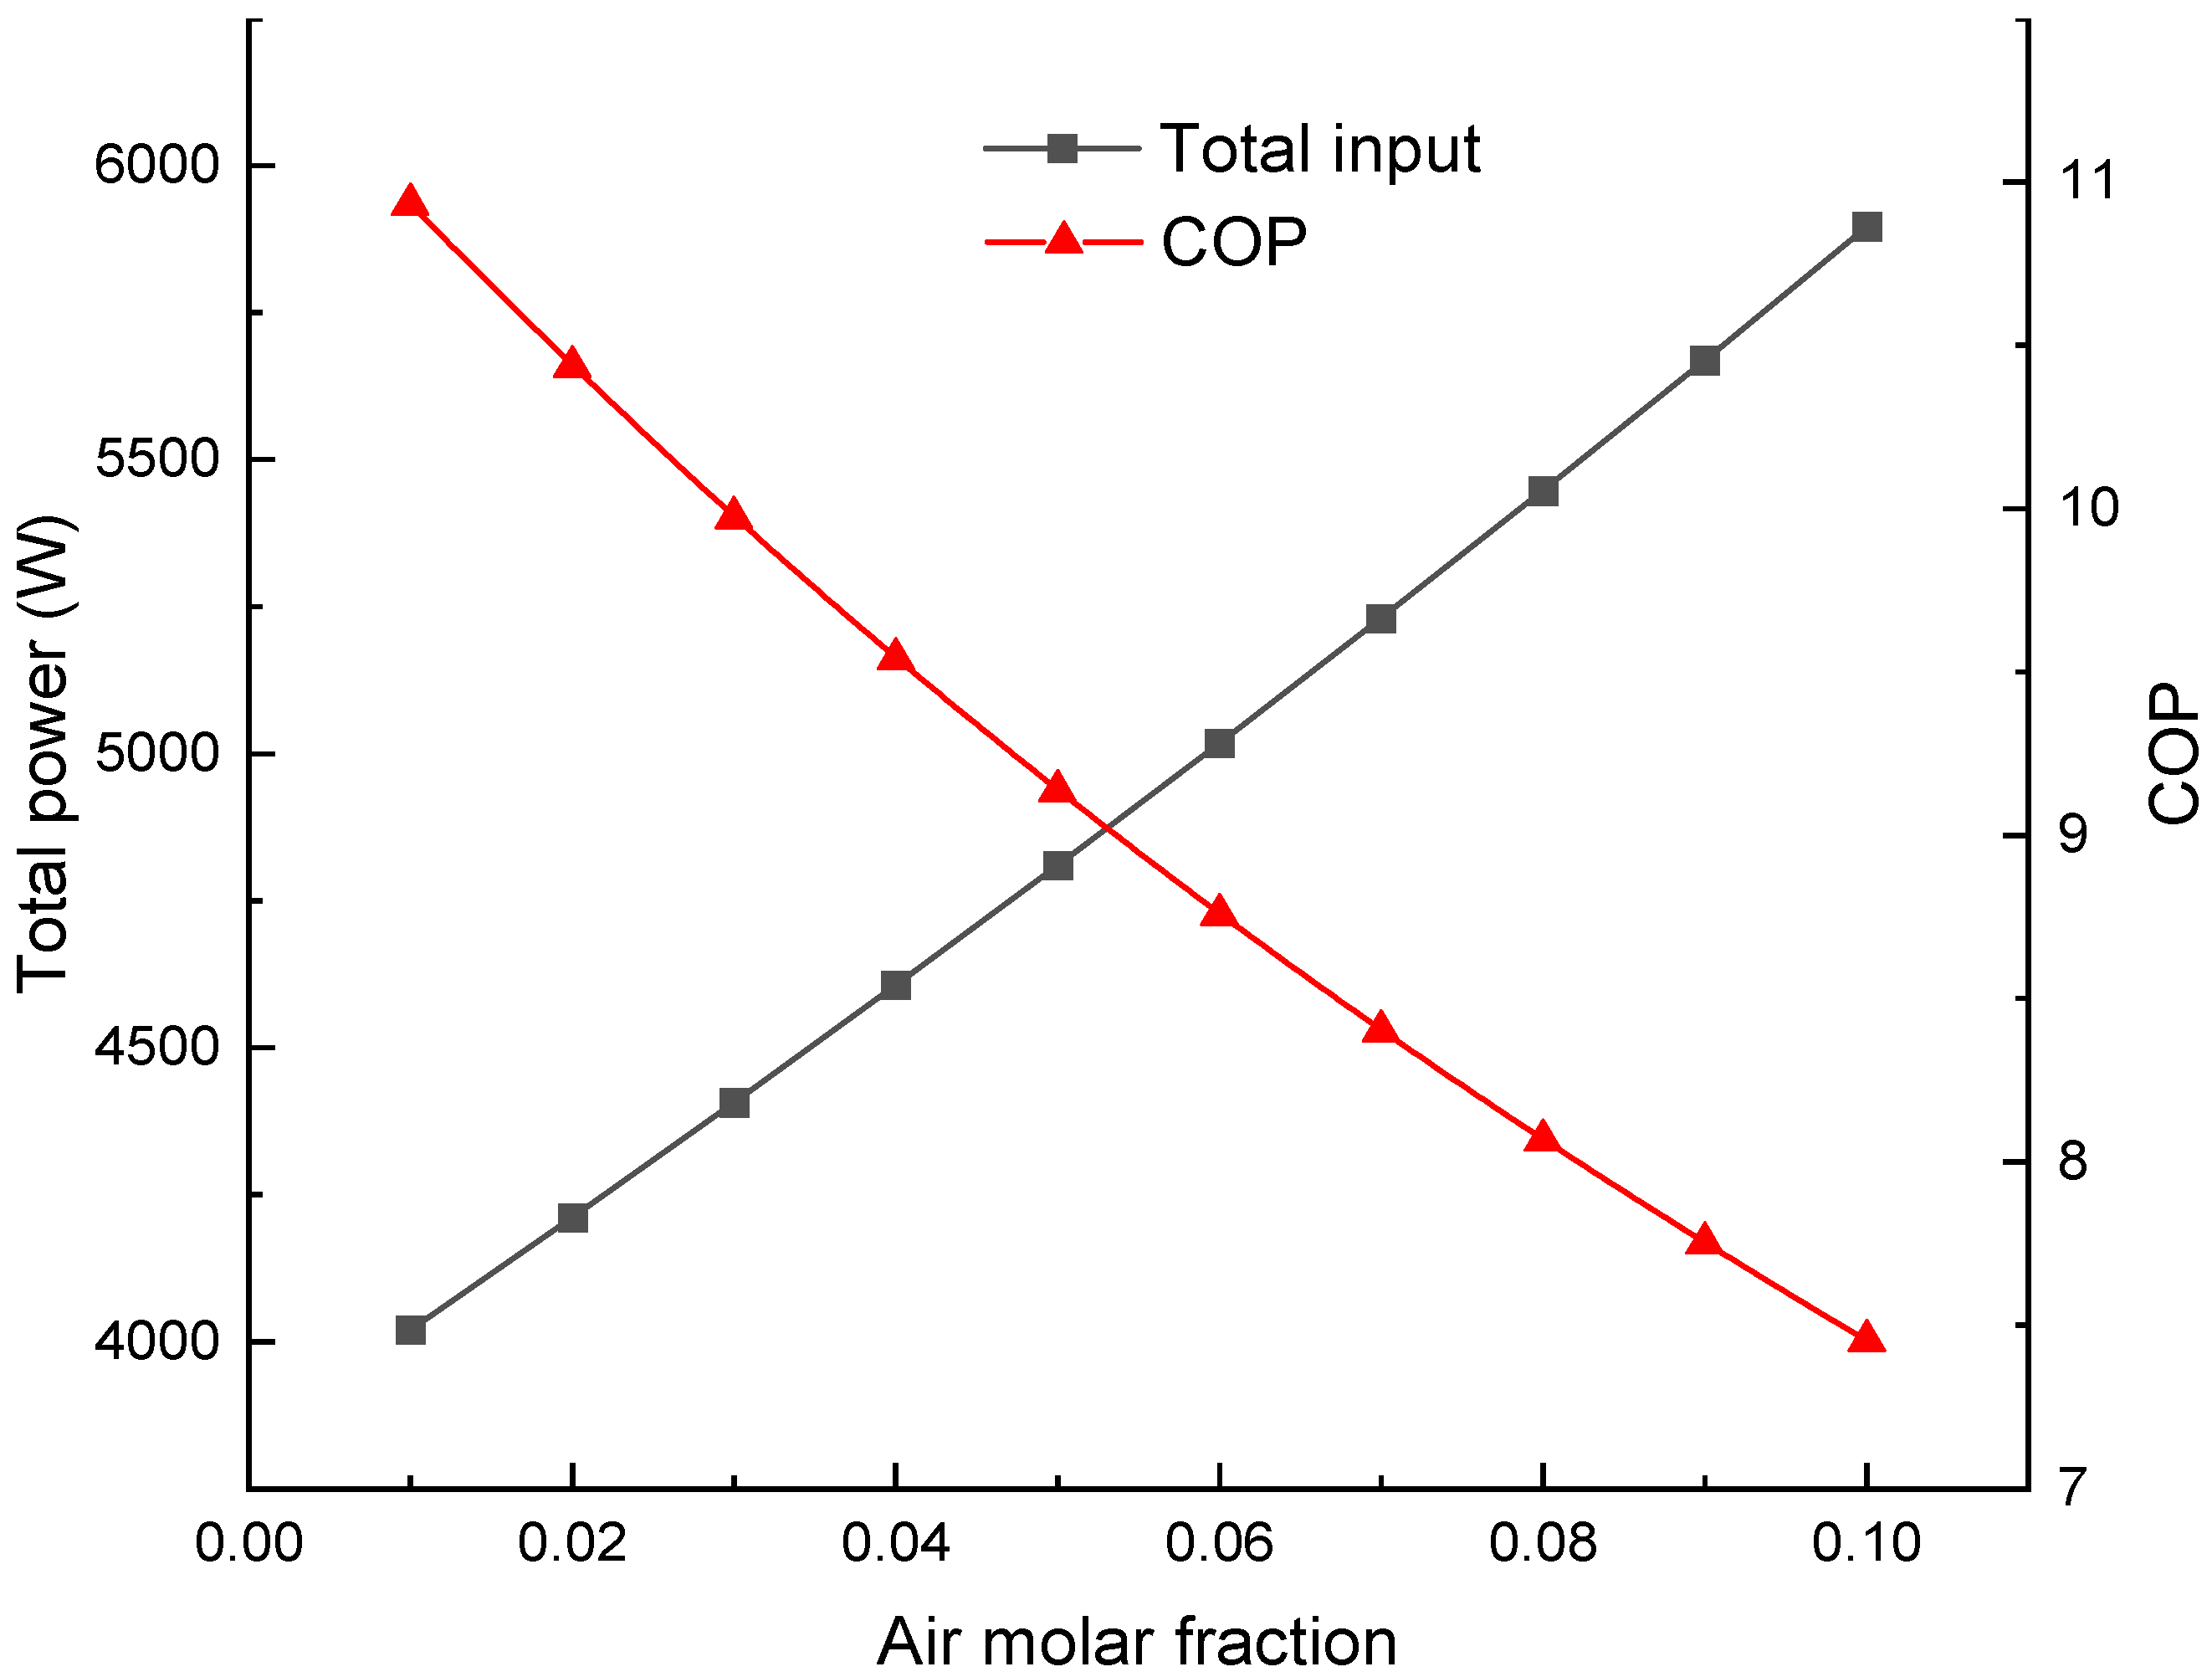
Figure 6 presents the total power consumption and the system’s COP. A higher power consumption accompanies a lower COP. When the air fraction reaches 10%, the COP is only 7.45. This efficiency is not significantly higher than that of a conventional refrigeration cycle for air dehumidification. For example, the latter may achieve a COP of about 7 with a condensation temperature of 35 °C and an evaporation temperature of 10 °C to cool the air below its dew point, under the assumption that the minimum temperature difference between air and refrigerant is 5 °C. A low air fraction through the membrane is necessary for high system efficiency.
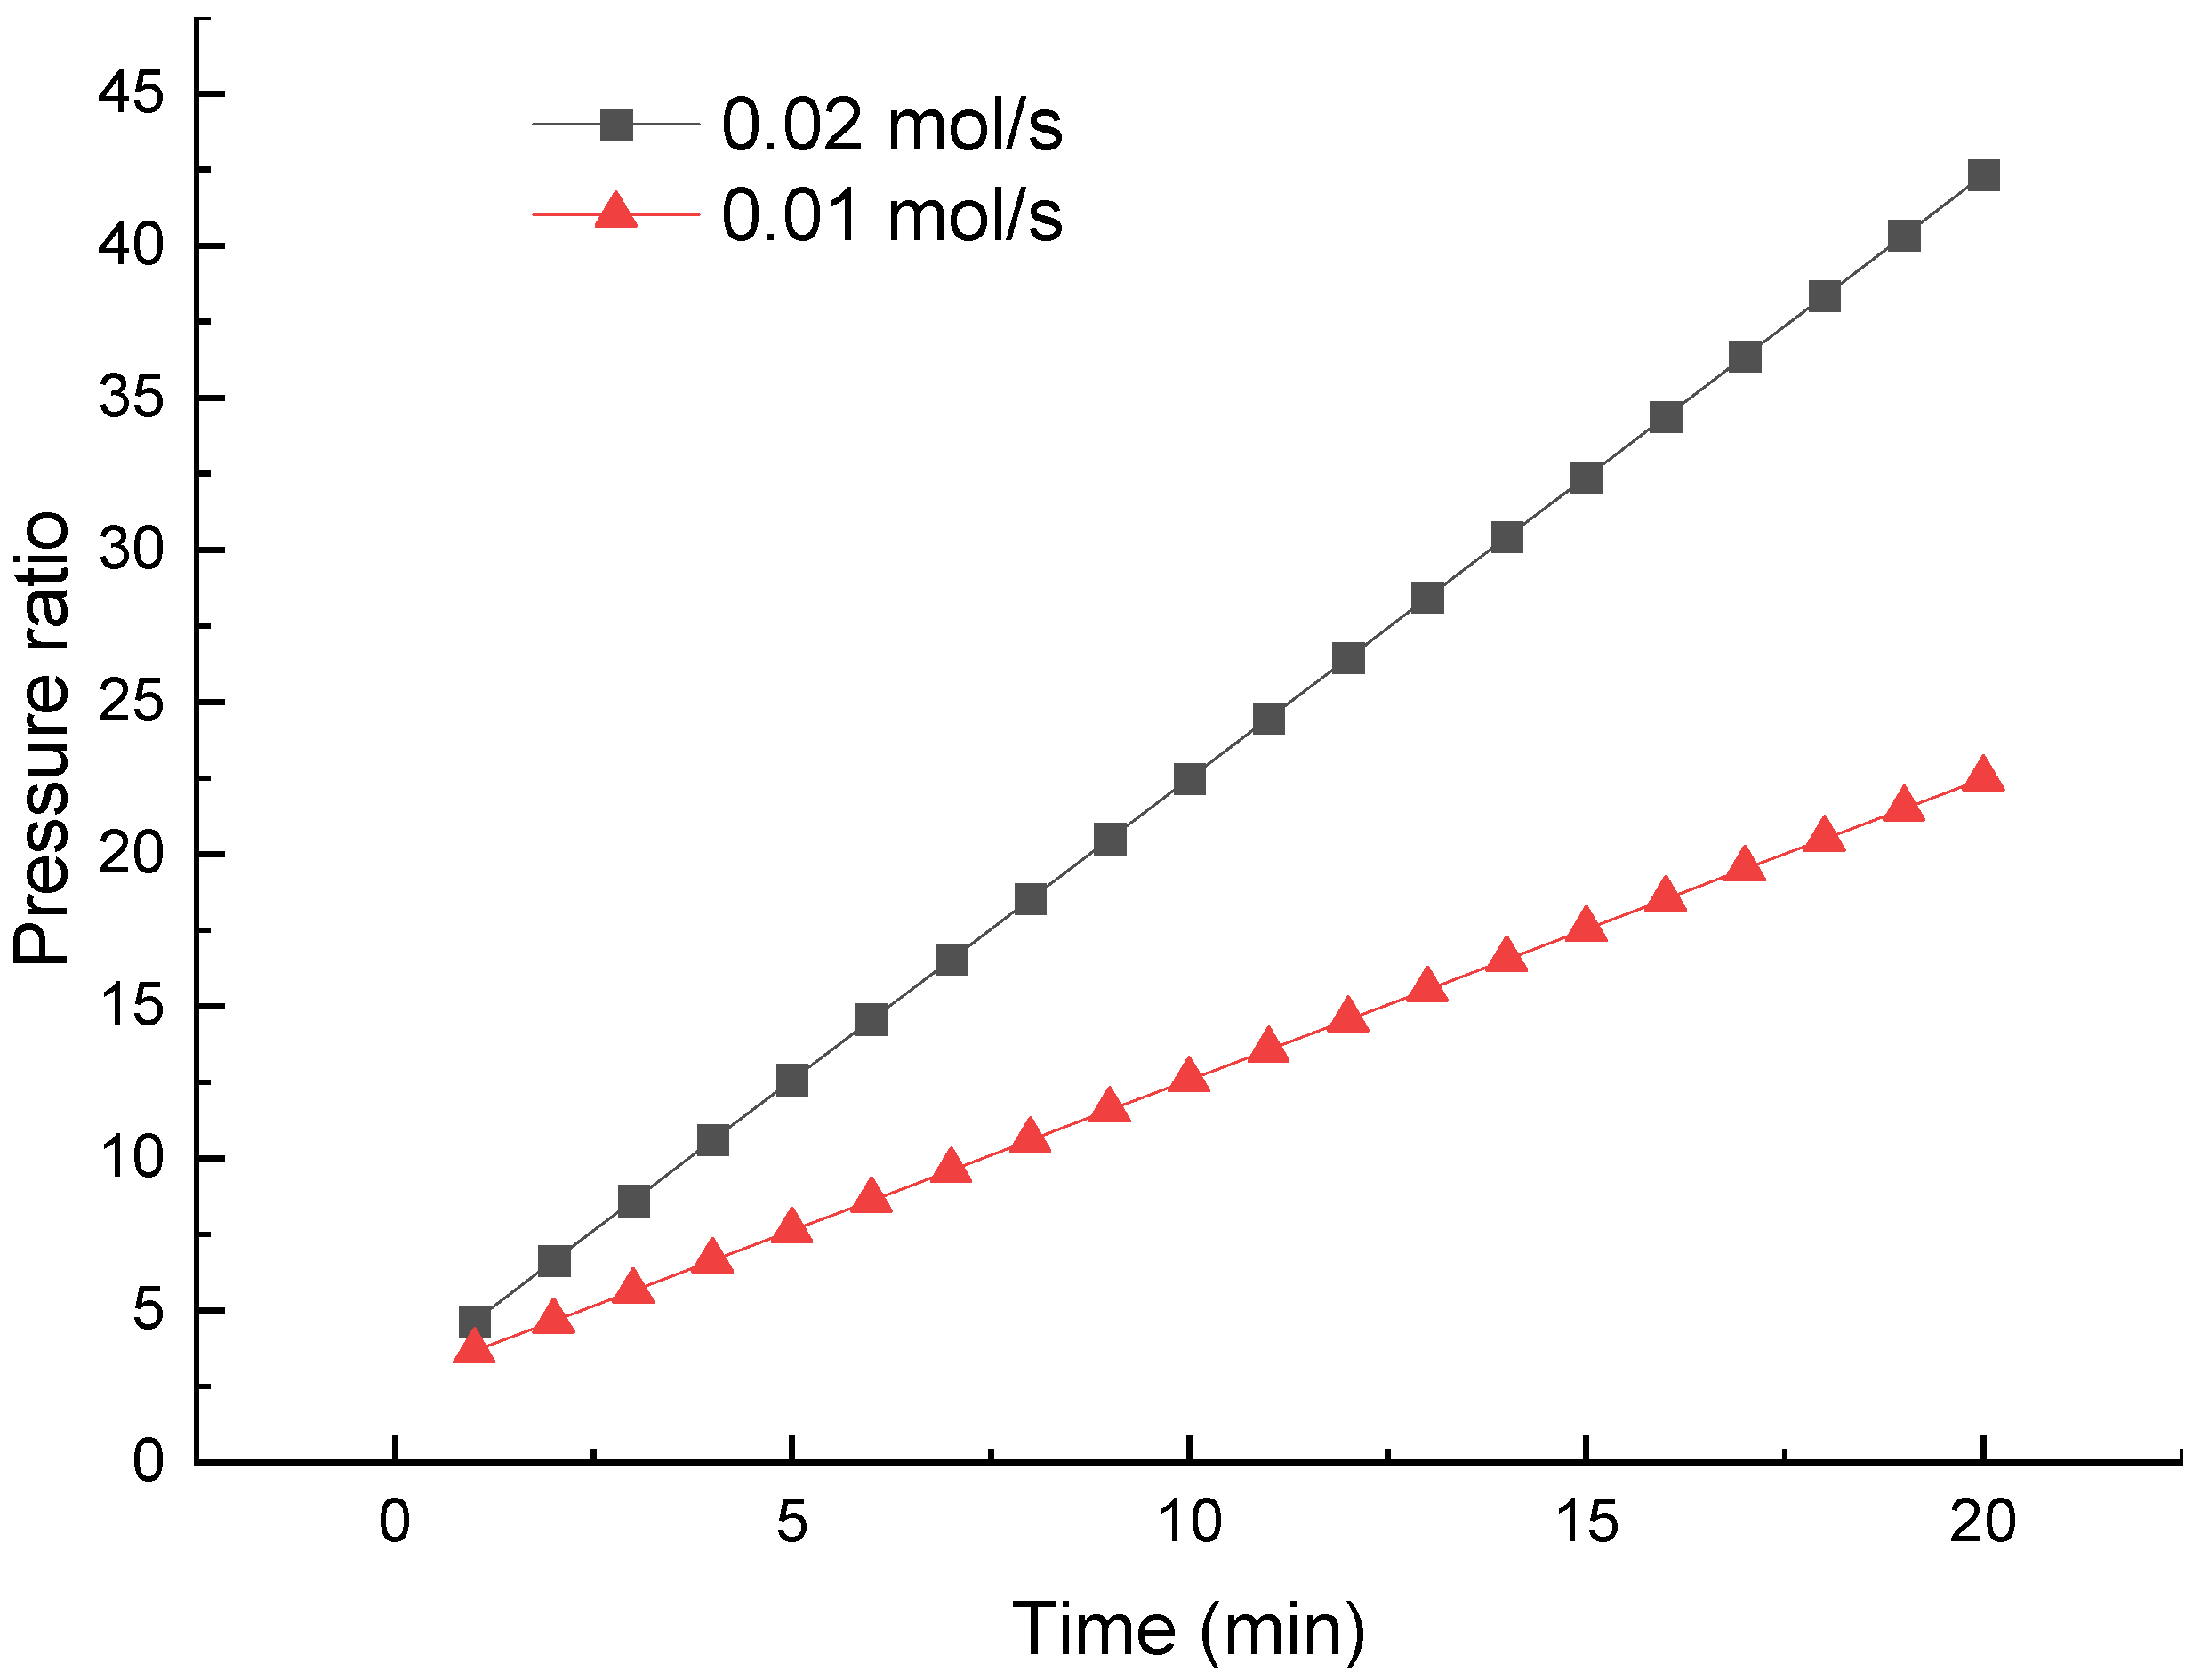
Figure 7 justifies the necessity of air removal from the condenser. Without air removal, the pressure ratio of the compressor increases steadily as the condenser pressure rises in a fixed volume of 1 m
3. The molar flow rates of air are 0.01 and 0.02 mol/s. The initial pressure ratio (
t = 0) is about 2.7, with a condenser pressure of 4 kPa. The ratio increases to about 22.5 in 20 min, even at a low air permeance rate of 1%. The increment will cause not only more power input but also off-design operation of the compressor, resulting in degraded mechanical efficiency, since a common compressor has a design pressure ratio of 3~6. The results explain why the lack of efficient air removal can hinder the application of some MAD technologies, as shown in
Figure 1.
4.2. Flow Rate of the Cooling Water
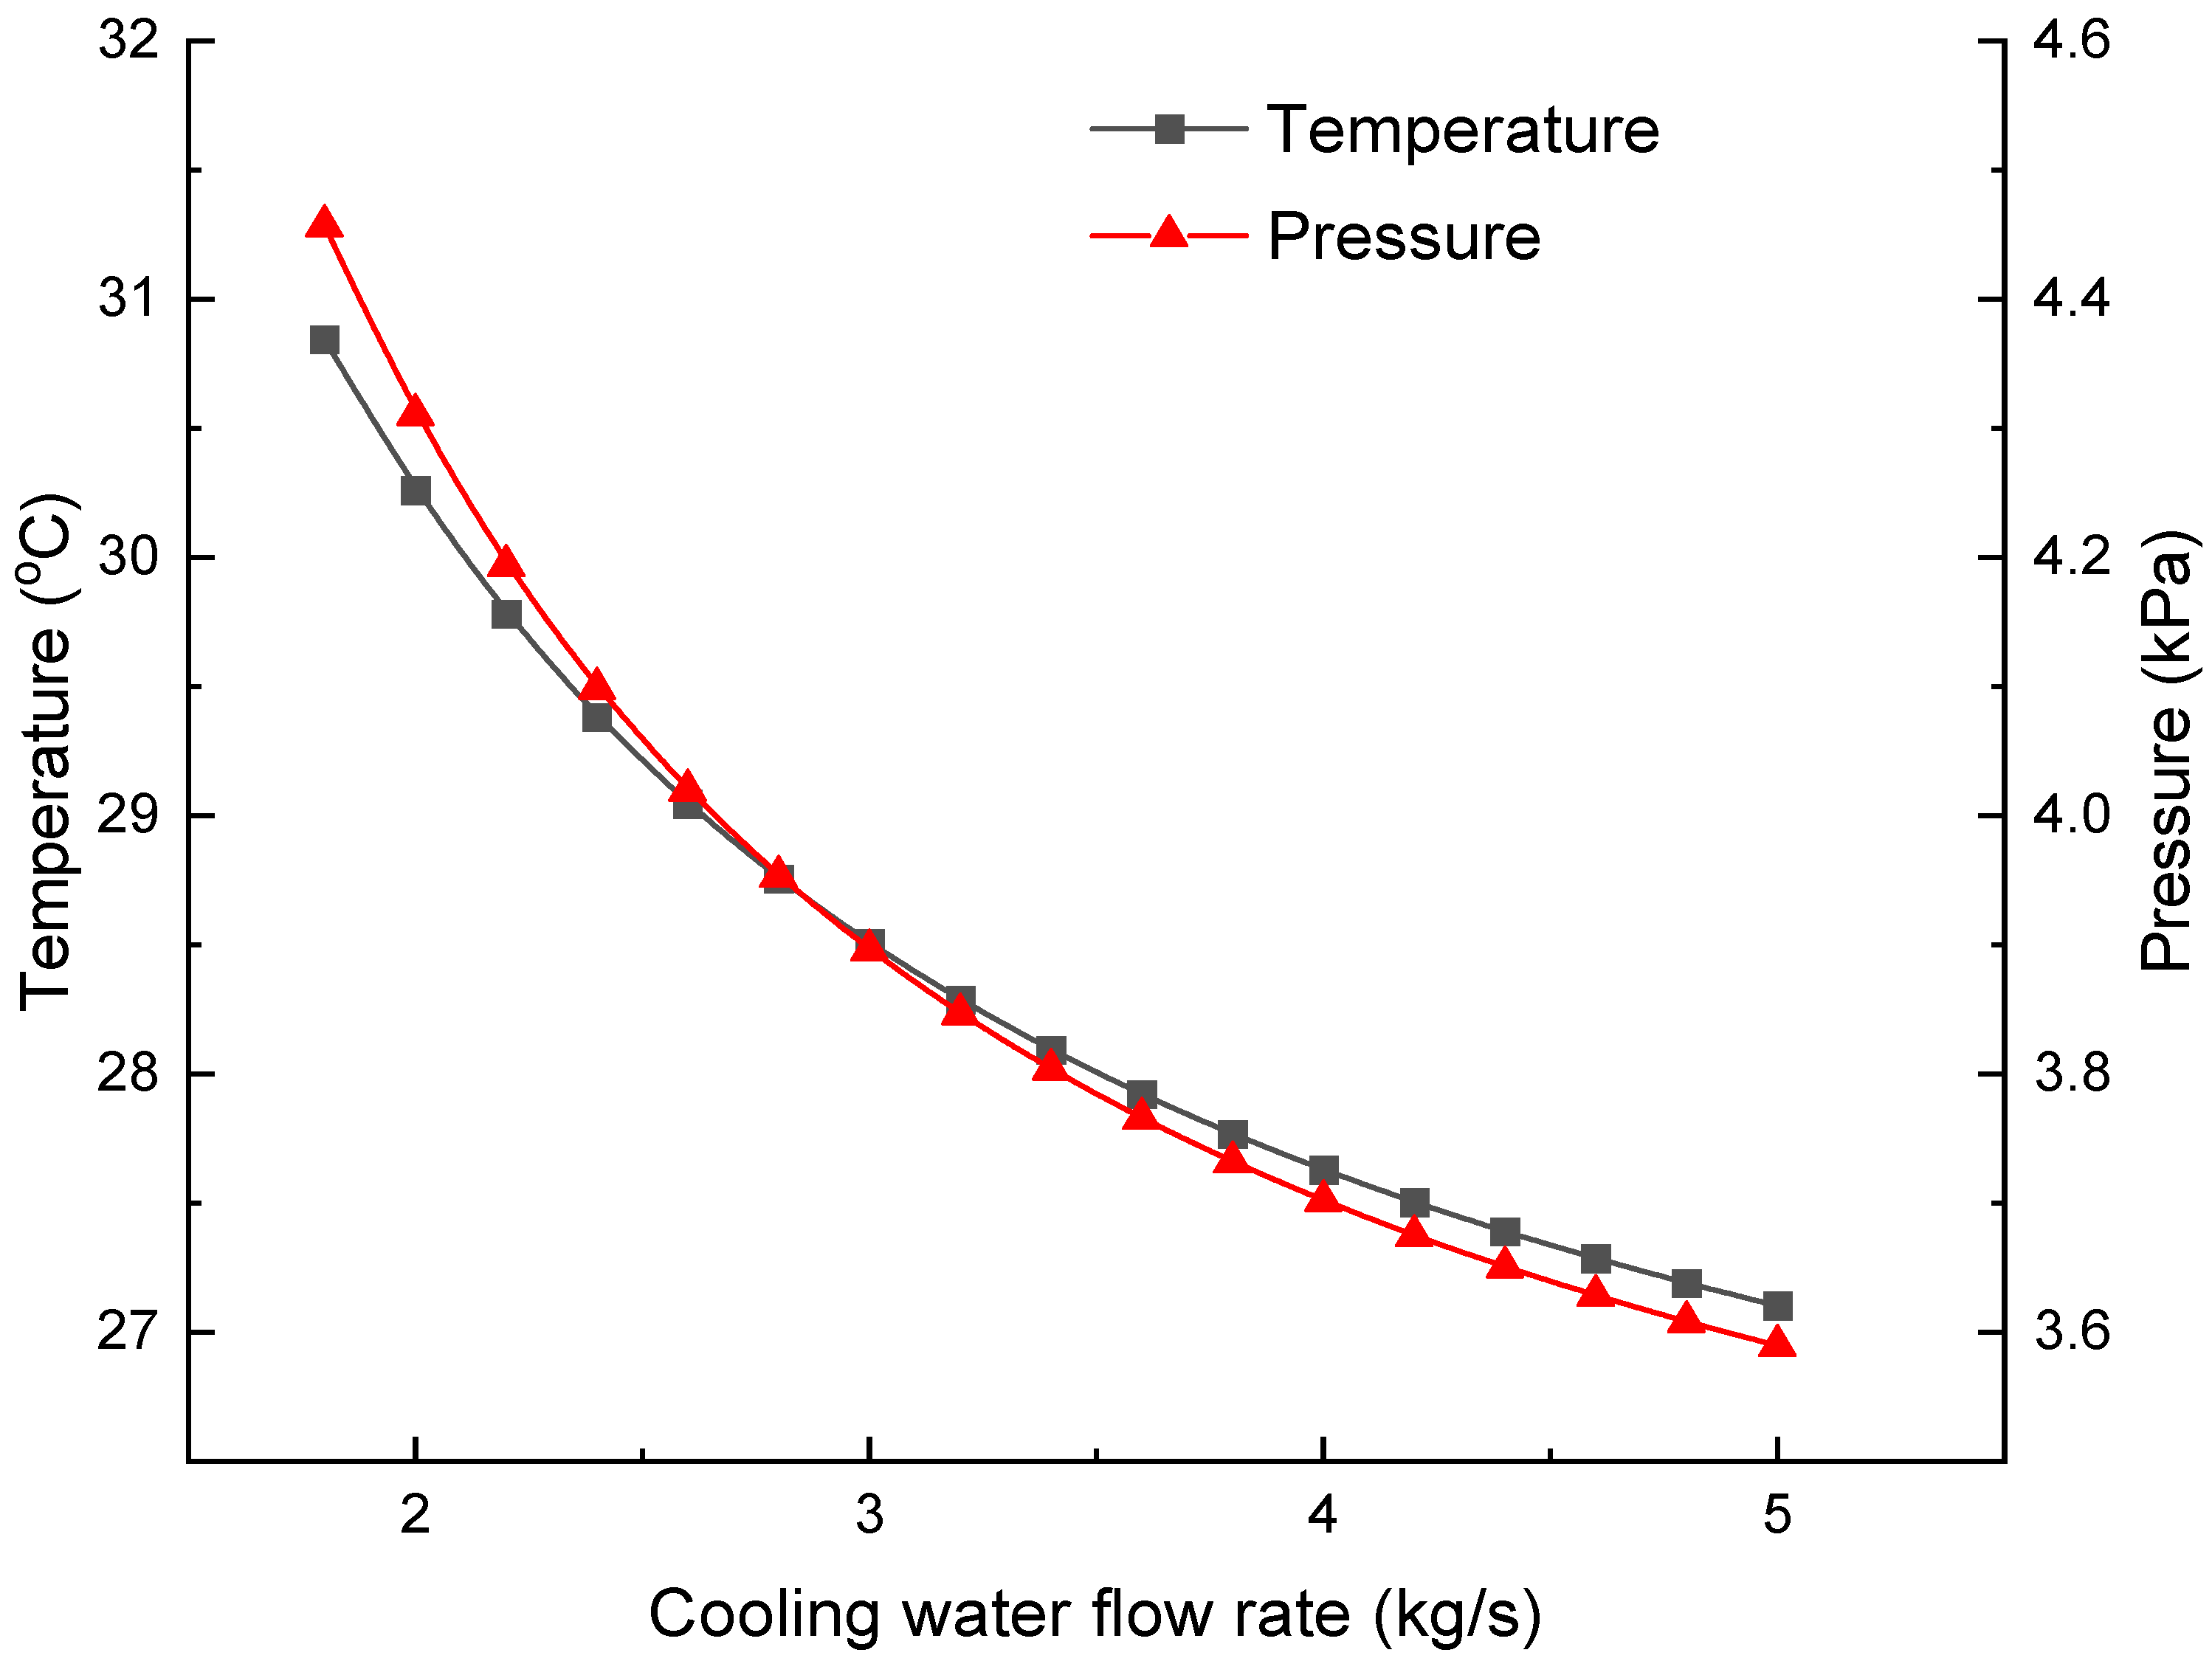
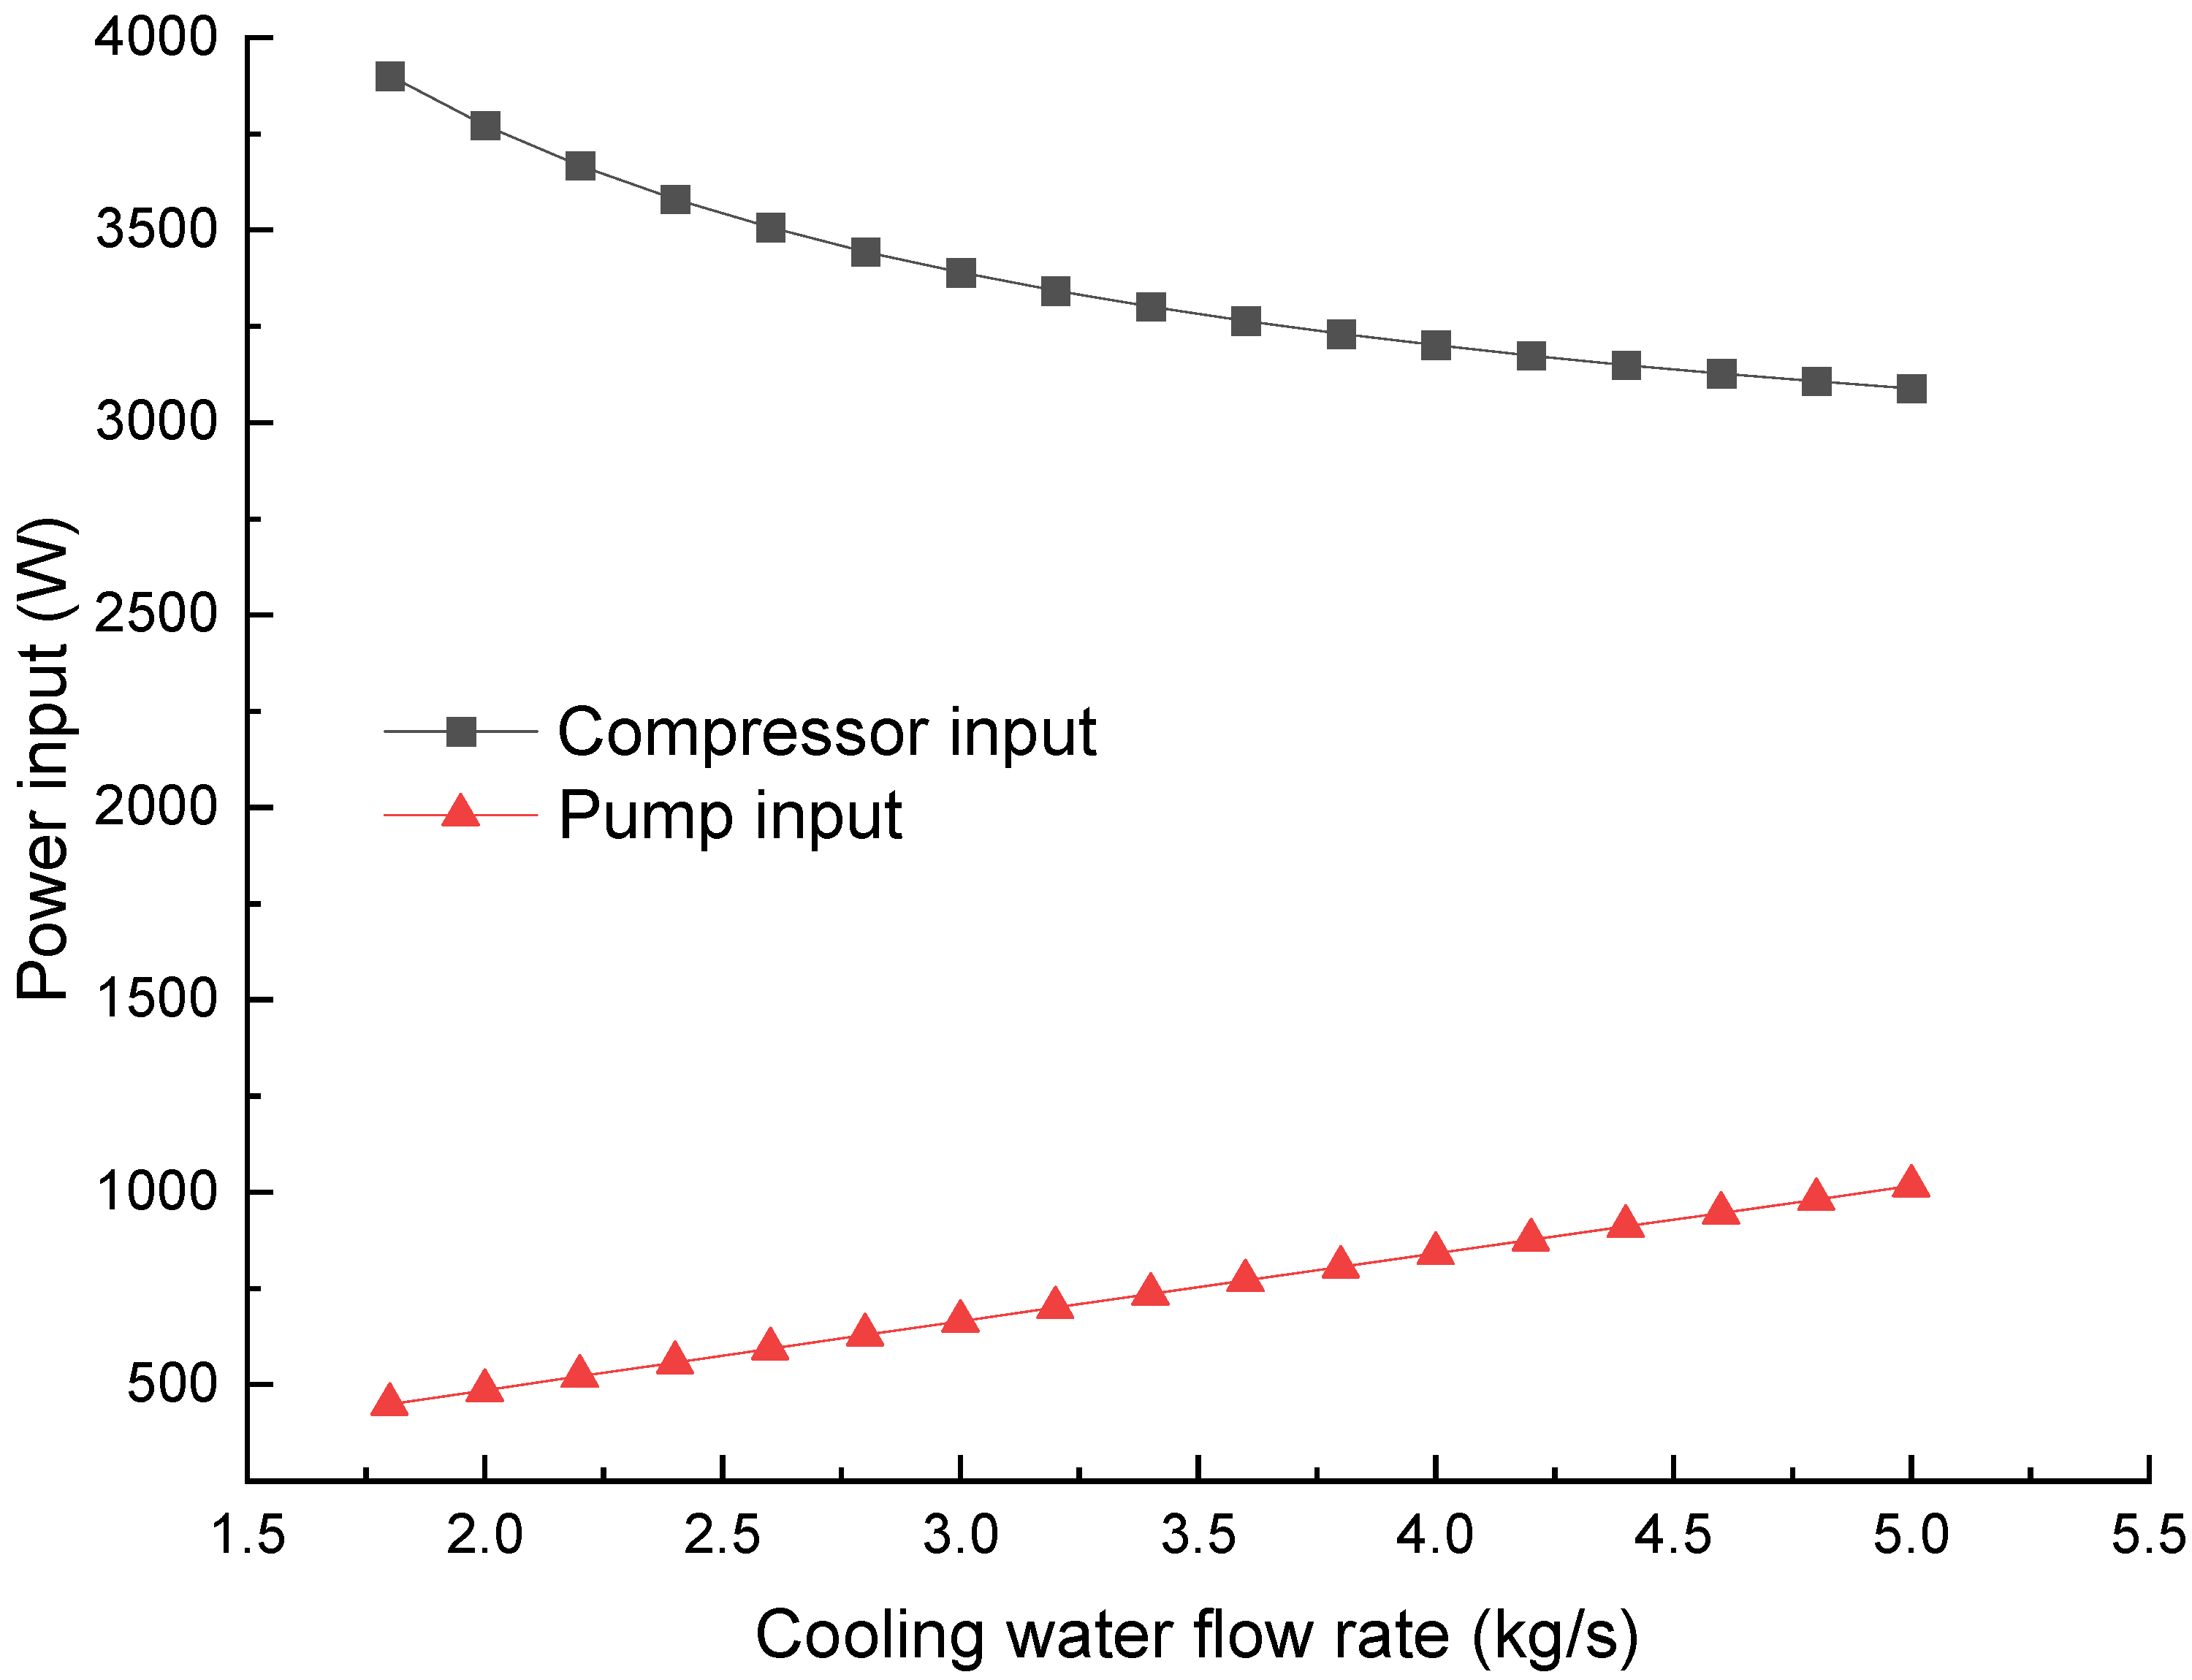
Figure 8 shows the impact of the mass flow rate of the cooling water on the mixture temperature and water saturation pressure in the condenser. The air permeance and pump outlet pressure are 1% and 1 atm. As the water flow rate goes up, the mixture temperature drops from about 30.8 °C to 27.1 °C and the corresponding saturation pressure of water decreases from 4.45 kPa to 3.58 kPa. The pressure decrement leads to a significant drop in compressor input from 3901 W to 3088 W, as shown in
Figure 9. The drop is non-linear and less appreciable at a flow rate of 4~5 kg/s. A large water flow rate is desirable from a technical viewpoint, as it can offer a lower GVF and reduce the technical requirements of the multiphase pump. However, it has a negative impact on the pump input, which increases from 448 W to 1016 W.
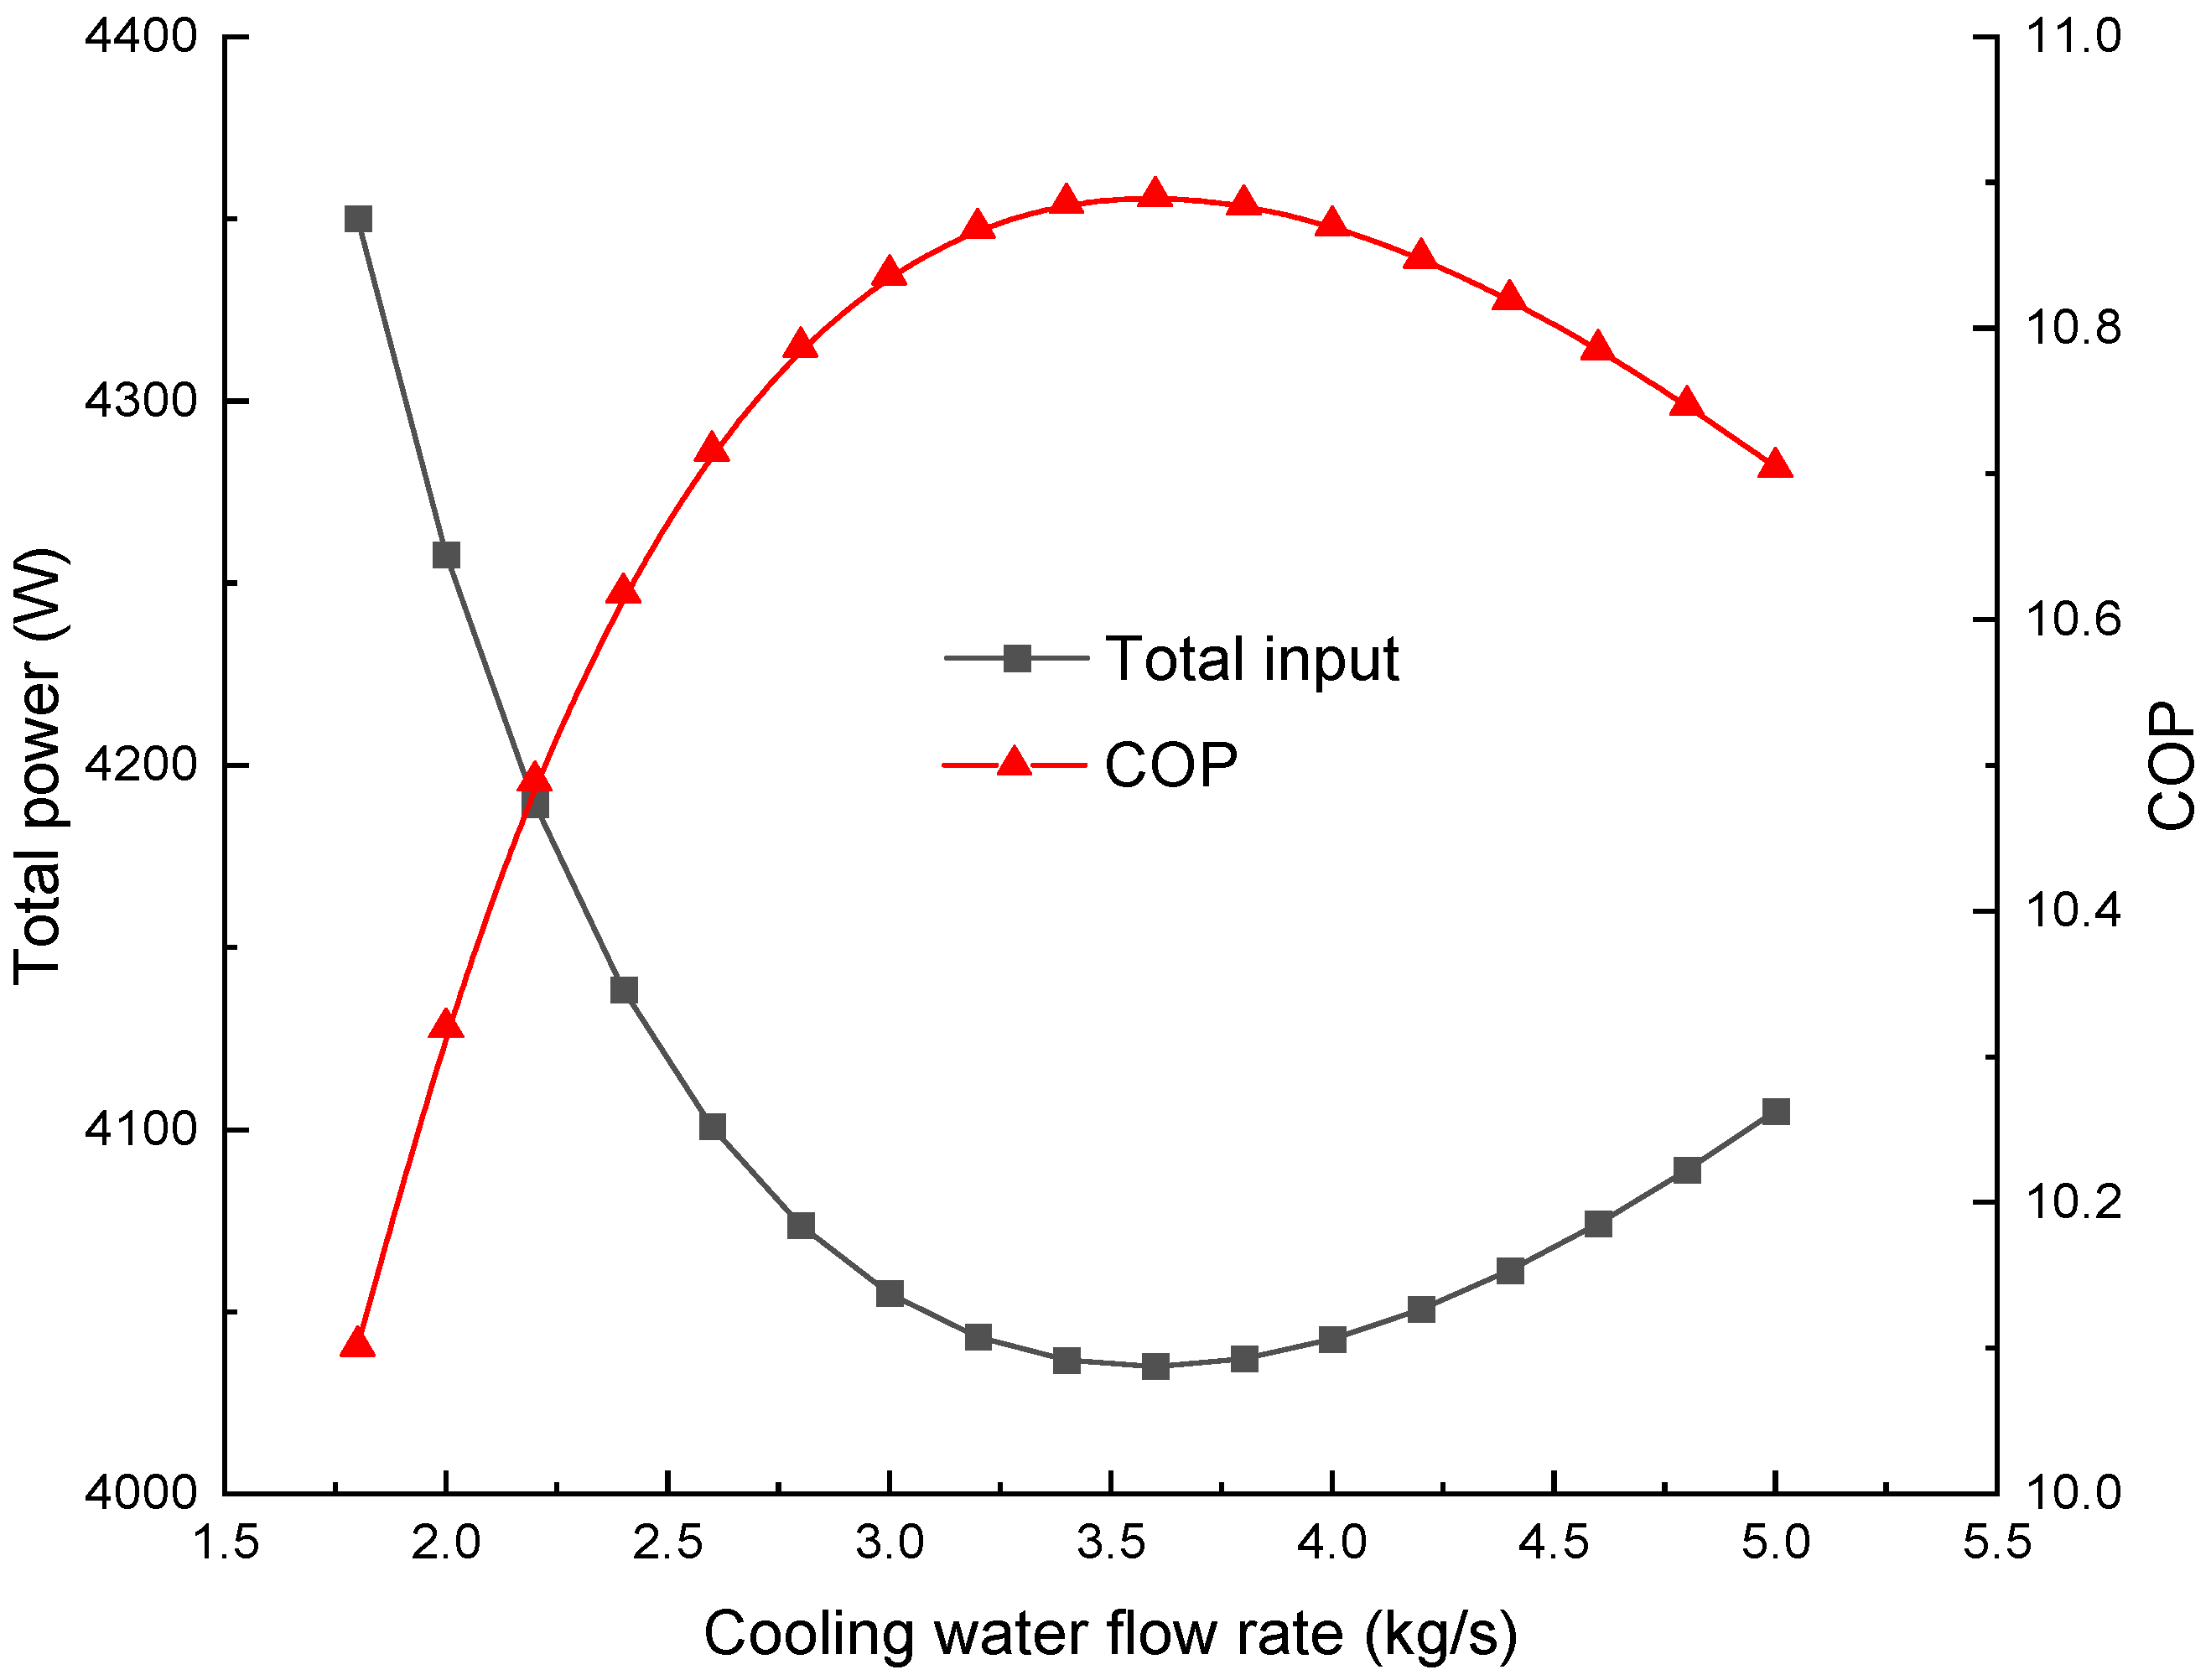
Figure 10 displays the overall power consumption and COP varying with the water flow rate. The power input first drops and then rises. There is a minimum overall power input owing to the trade-off between the consumption of the compressor and pump. As the COP is inversely proportional to the power input, it has a maximum value of about 10.9 at a water flow rate of 3.5 kg/s and a condensation temperature of 28 °C. The mass ratio between the cooling water and the permeating moisture is about 194, and the power ratio between the compressor and the pump is 4.49. The mass ratio of the cooling water and moisture in the proposed approach is similar to that of a conventional indirect cooling system using a heat exchanger. A temperature increment of the cooling water of about 3 °C through the condenser is reasonable. Given the cooling water temperature, the proposed approach avoids a secondary heat transfer between moisture and water. For instance, the moisture condensation temperature may be 5 °C higher (i.e., 33 °C) in the case of a cost-effective heat exchanger, together with a pressure increment of 1.2 kPa in the condenser. Consequently, the COP for indirect cooling will drop by about 20%, i.e., ≈8.8.
4.3. Pressure in the Condenser
In a dynamic condensation process, the condenser has a higher pressure than the water saturation pressure. Since the vapour phase and liquid phase coexist, the partial pressure of moisture in the vapour/gas mixture approximately equals the water saturation pressure. A higher condenser pressure indicates a larger volumetric fraction of air in the mixture.
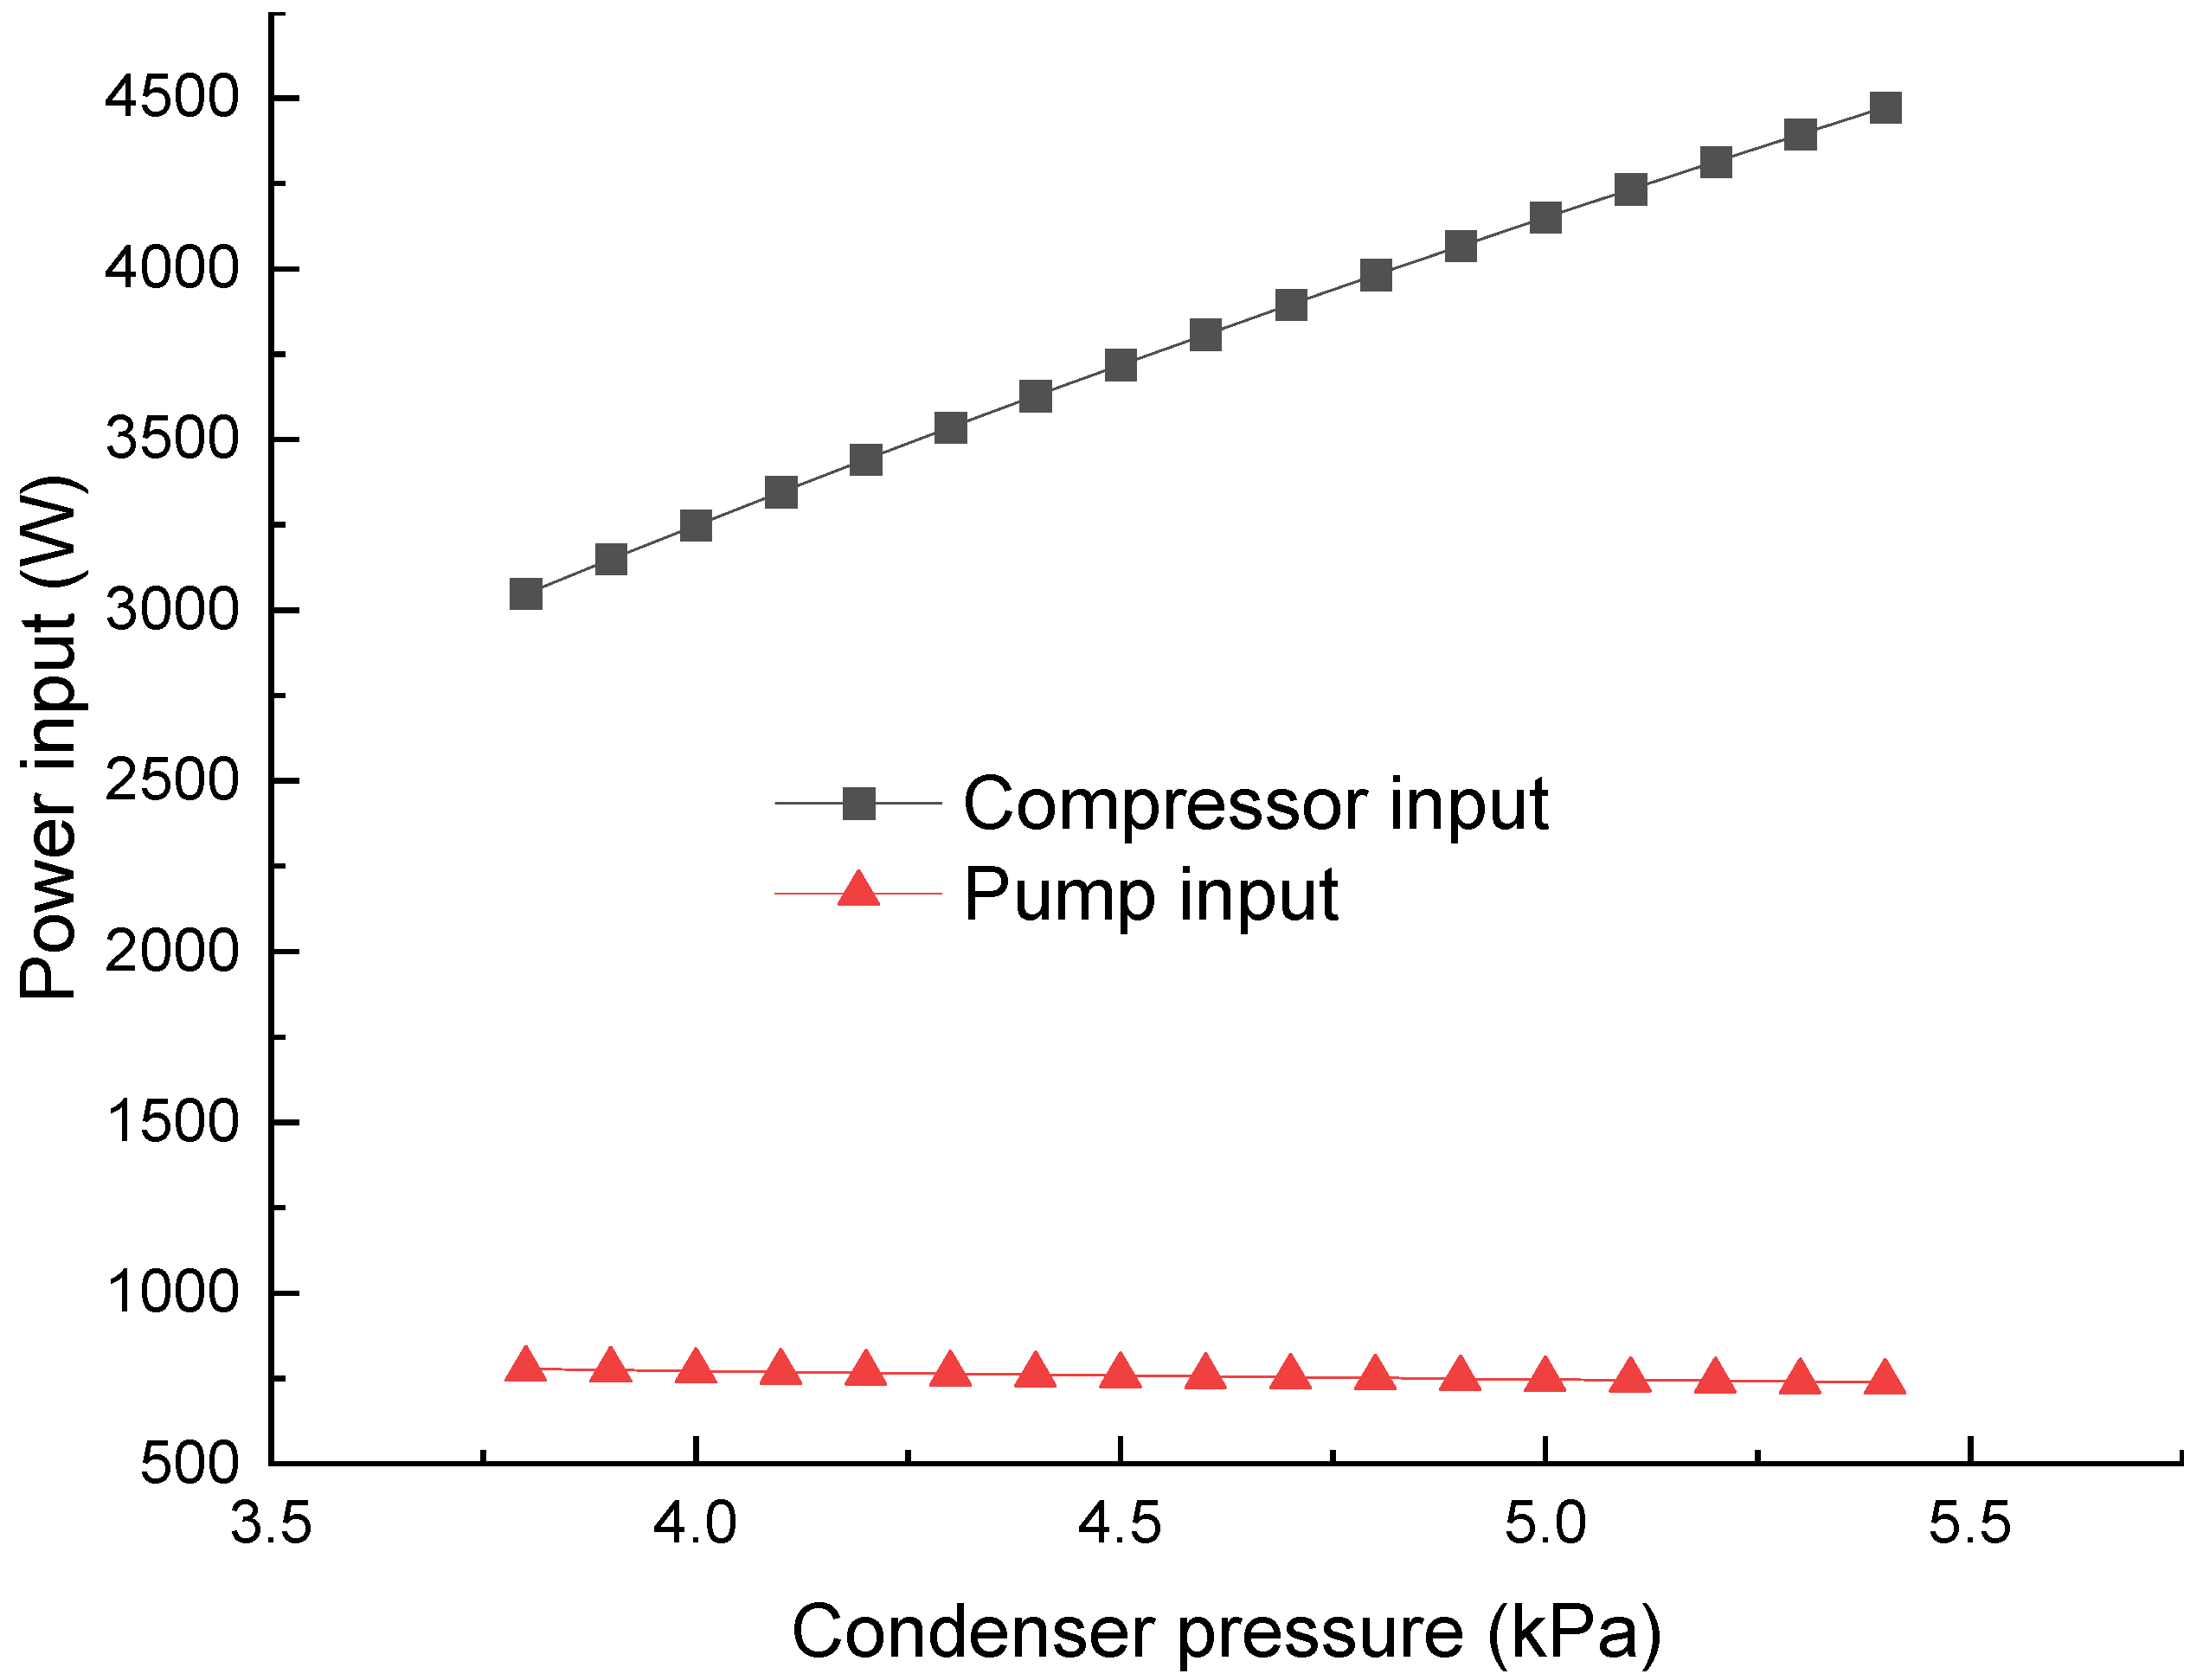
Figure 11 presents the power consumption of the compressor and multiphase pump varying with the condenser pressure. The cooling water flow is 3.6 kg/s, with an air permeance of 1% and a water saturation pressure of 3.76 kPa. There is a significant increment in the compressor power from 3048 W to 4473 W when the pressure rises from 3.8 kPa to 5.4 kPa. In contrast, the pump input decreases because of the increment in the inlet pressure. The decrement is insignificant, from 777 W to 738 W. The variation in the pump’s inlet pressure is too small compared to its outlet pressure (101 kPa).
From the trend in
Figure 11, it can be deduced that the first approach in
Figure 1 suffers from low efficiency. When the compressor outlet pressure is 101 kPa, the compressor power consumption climbs to 22,700 W, leading to a COP of about 2.0. A conventional vapour compression process is adiabatic. The vapour temperature goes up with the pressure increment. Given an outlet/inlet pressure ratio of about 20, the enthalpy increment and power input are high. External cooling for the compression process may offer a relatively low vapour temperature and specific volume and decrease the power consumption. However, it will require a large casing for the compressor with a complex design and a high cost. It is difficult to achieve a significant cooling effect because of the low heat transfer coefficient of vapour. Therefore, compressing the permeating moisture and air to atmospheric pressure has foreseeable disadvantages.
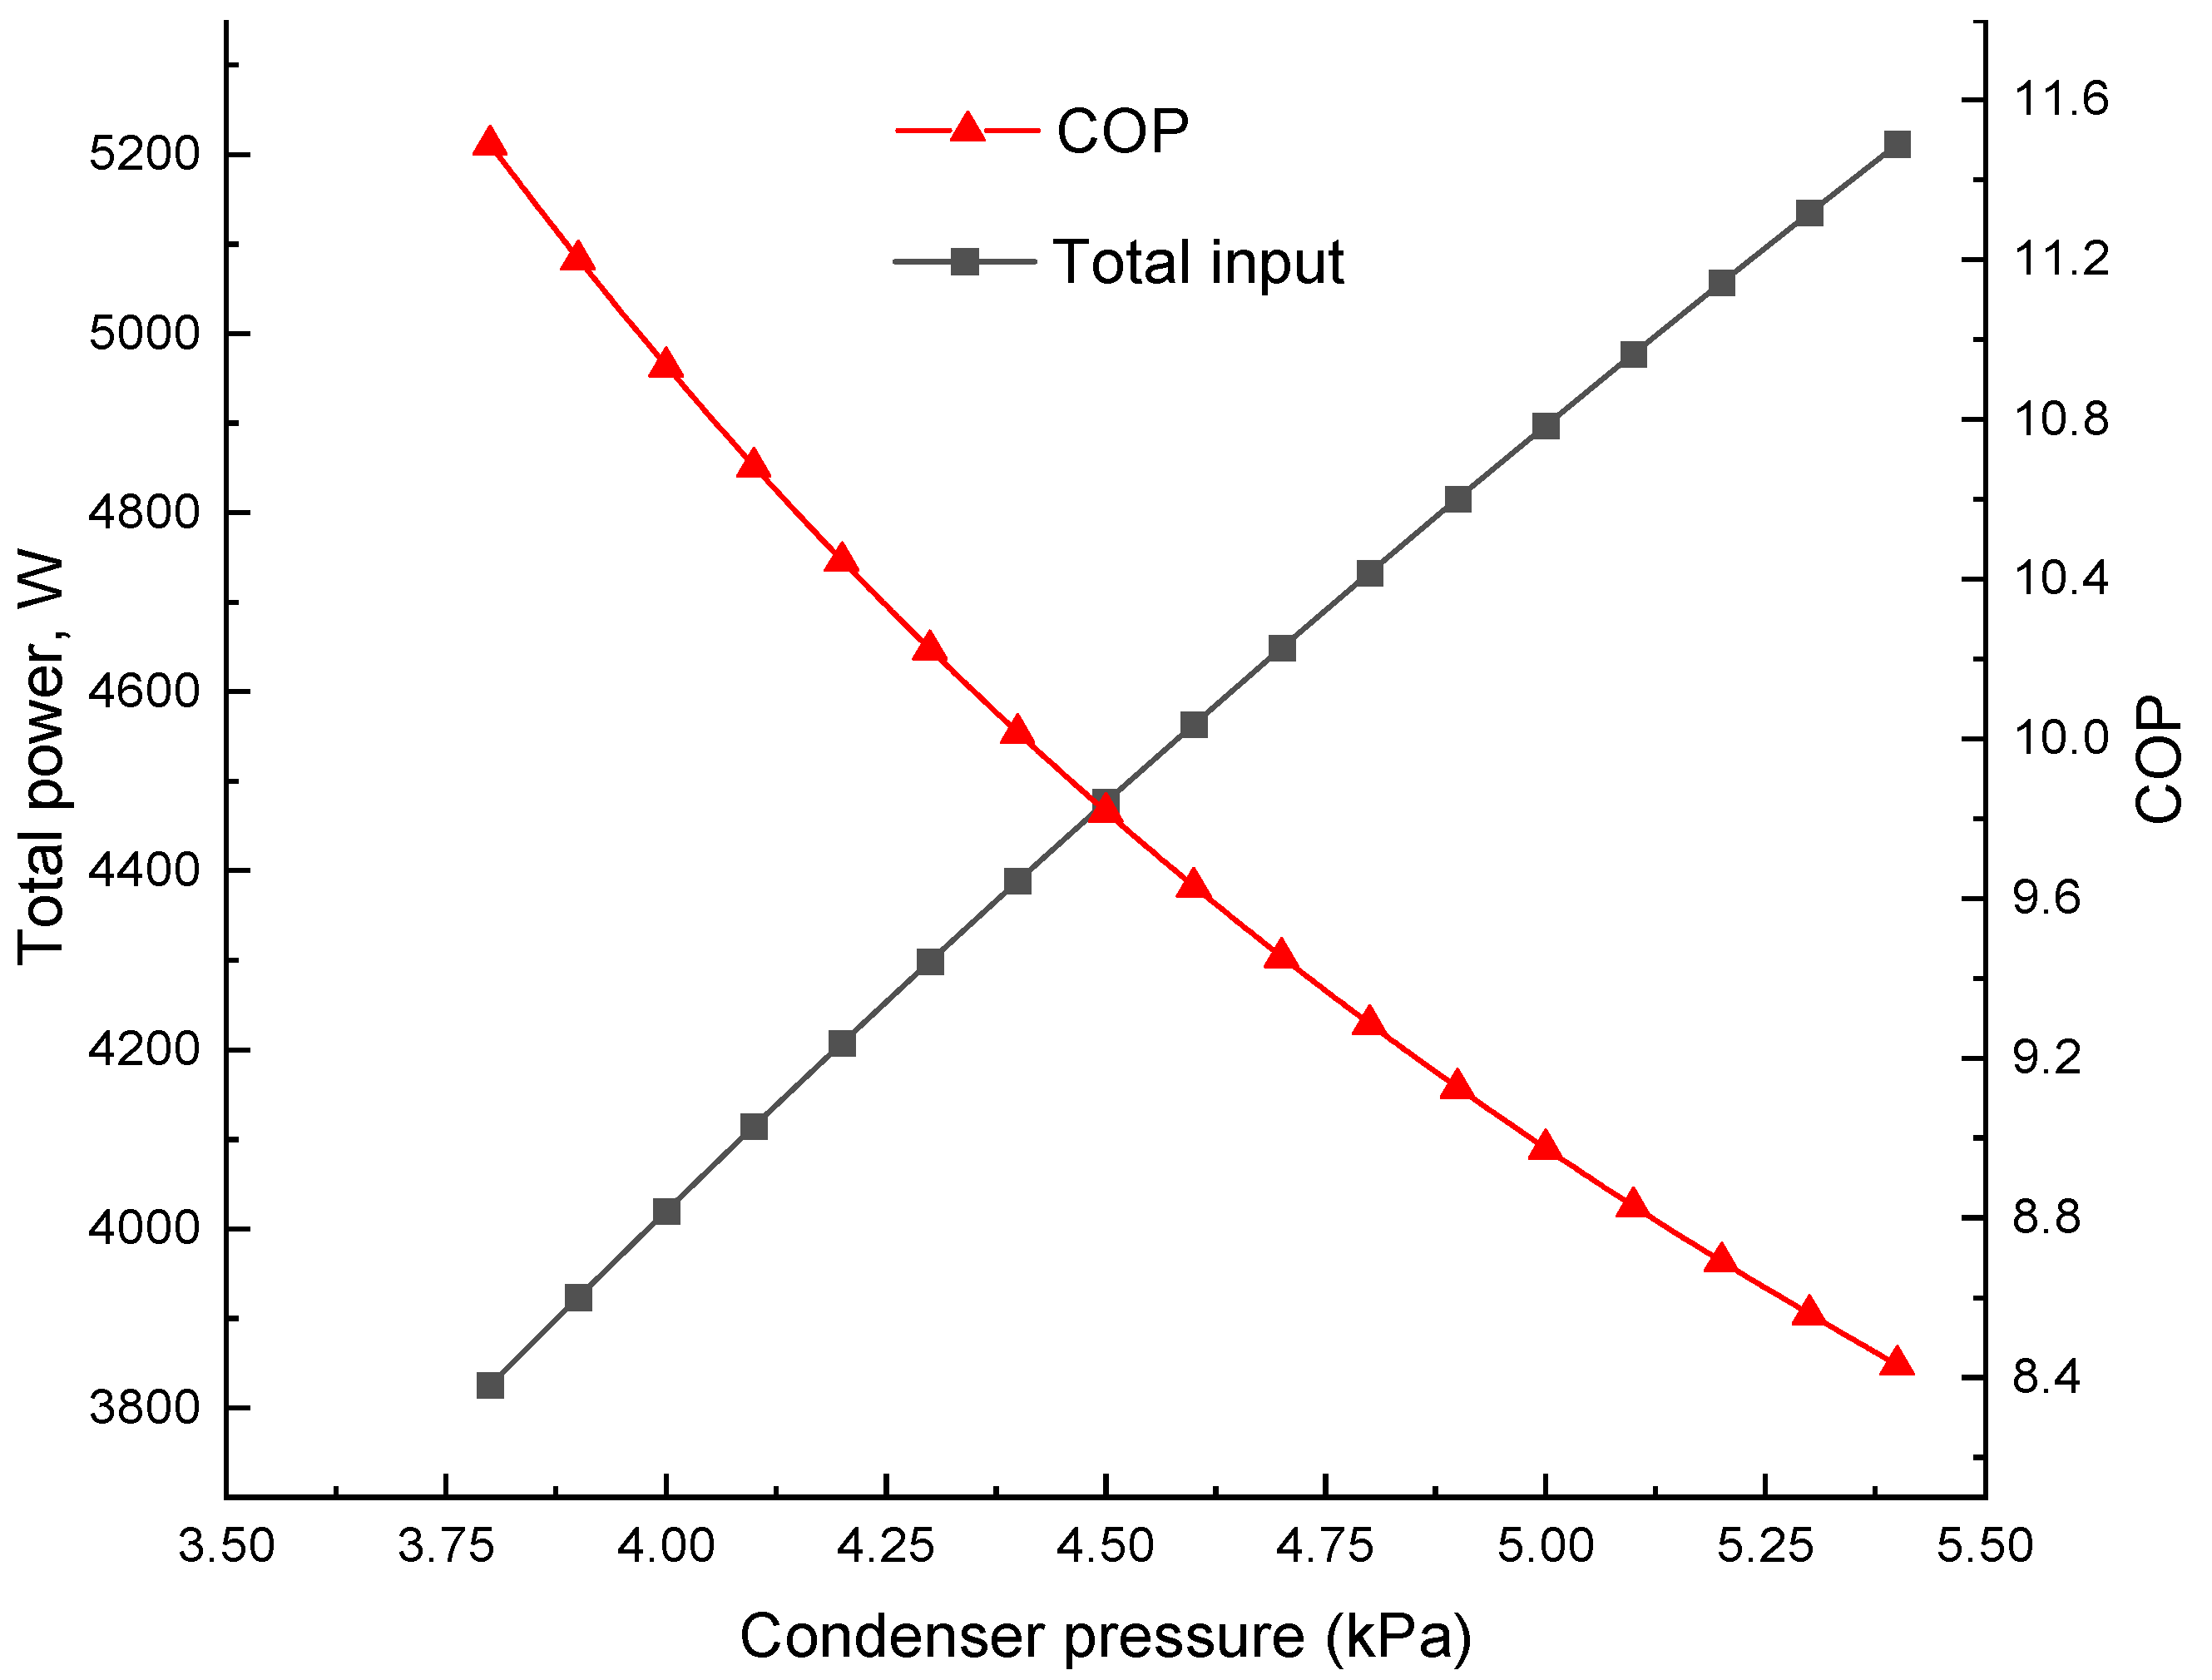
The impacts of pressure in the condenser on the overall power consumption and COP are depicted in
Figure 12. The COP is sensitive to pressure. To achieve an efficiency of more than 10, the condenser pressure should be less than 4.4 kPa.
4.4. Pressure on the Permeance Side
The permeance-side pressure (
) needs to be lower than the partial pressure of moisture in the supply air for spontaneous mass transfer through the membrane. Since the humidity of air decreases in the flow direction over the membrane during dehumidification,
is less than the partial pressure of moisture in the dehumidified air at the exit. The relative humidity of the exit air changes with application.
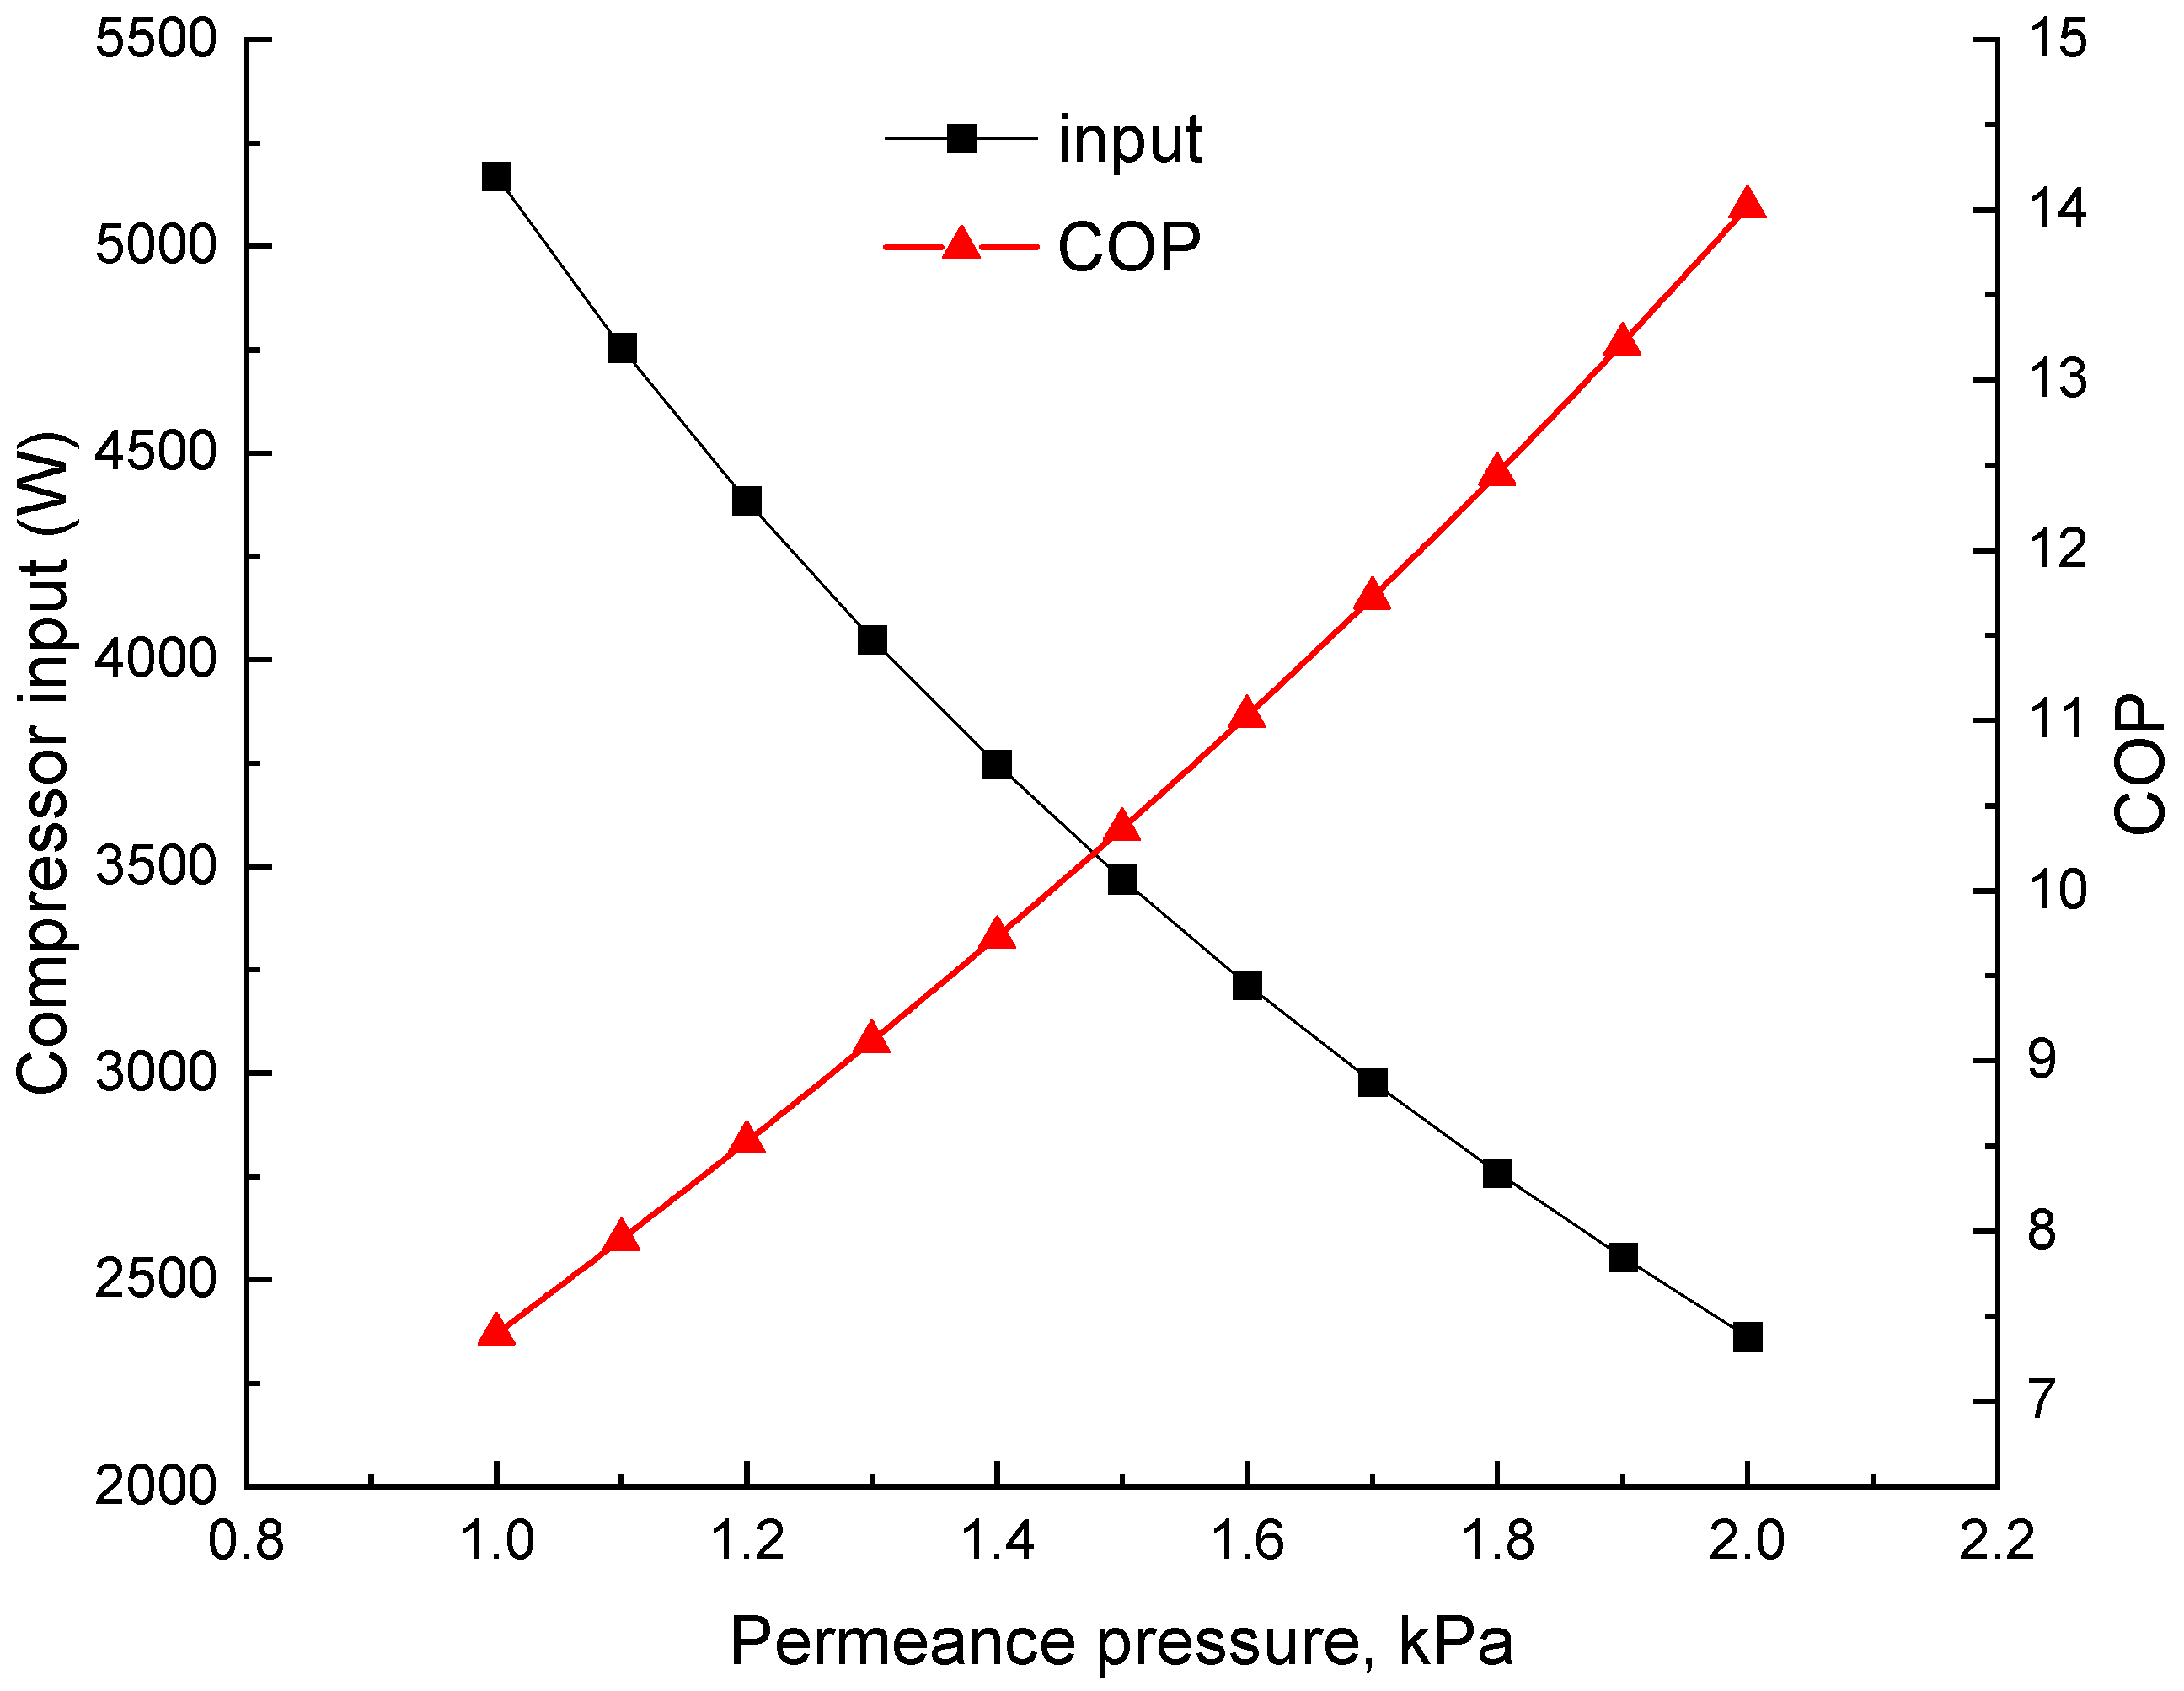
Figure 13 shows the variations in the compressor input and dehumidification COP with
. The water flow is 3.6 kg/s, with a condenser pressure of 4 kPa.
does not affect the operating conditions and performance of the multiphase pump. As the supply air temperature is 25 °C, a partial pressure of 1 kPa corresponds to a relative humidity of 31.5%. When
decreases from 2 kPa to 1 kPa, the compressor input increases from 2363 W to 5169 W, and the COP drops from 14.0 to 7.4.
has a significant impact on the dehumidification performance.
4.5. Membrane Area
Given a moisture permeance rate of 1 mol/s and a supply air temperature of 25 °C, the required membrane area is correlated with the permeate pressure. It does not influence the condenser pressure. Since the driving force through the membrane is the difference between the moisture’s partial pressure in the supply air and the permeate pressure, a larger membrane area coincides with a higher permeate pressure, as shown in
Figure 14. The supply air has a relative humidity (RH) of 90% at the inlet and is dehumidified to 50% at the outlet. The permeate pressure increases from 0.5 to 1.5 kPa as the area rises from 116 to 795 m
2. A higher permeate pressure results in a lower vacuum compressor input and a higher COP. To achieve a COP of more than 7.0, the membrane area should be more than 240 m
2. It seems to be large compared to the area for heat exchange but is in line with those in the literature. For example, for a pilot MAD system with a dehumidification capacity of 0.35 mol/s, a total membrane area of 78 m
2 was needed [
10]. To remove the moisture at a rate of 0.016 mol/s, an effective membrane surface area of 31.2 m
2 was adopted [
9].
In practical operations, the membrane area remains constant upon installation. With a membrane area of 260 m
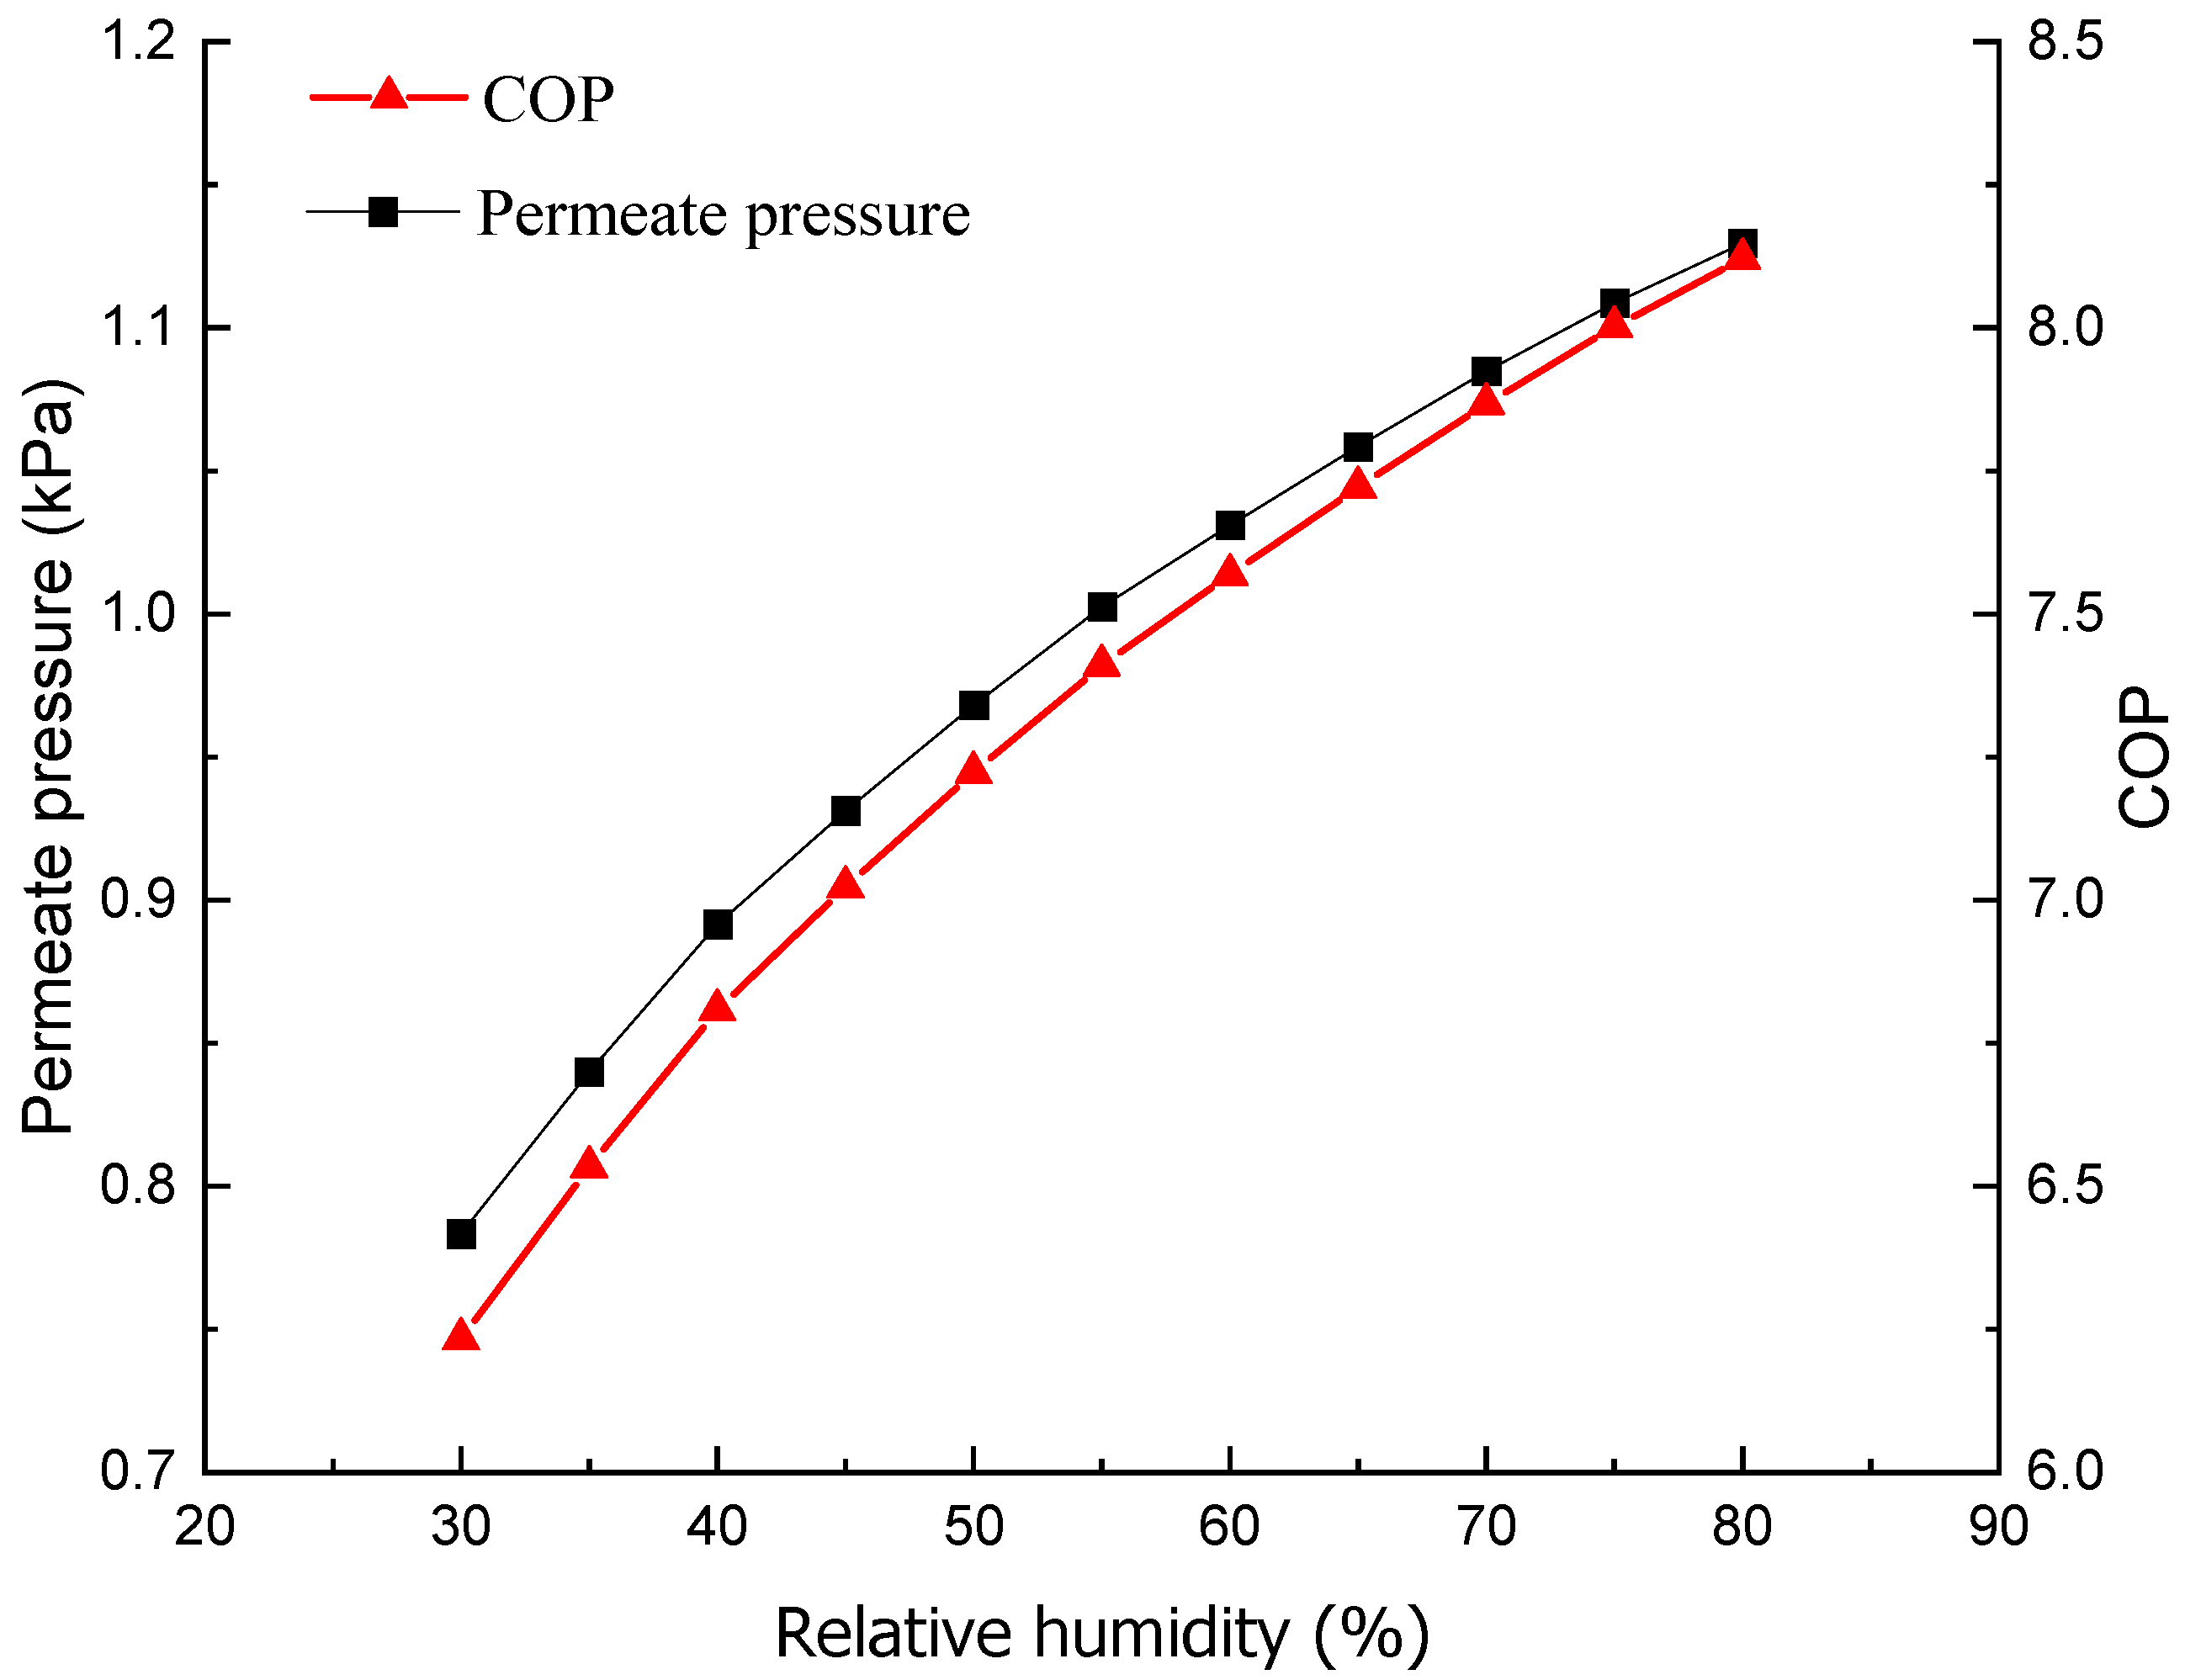
2 and a dehumidification capacity of 1 mol/s at 25 °C, the COP and permeate pressure vary with the RH of the air leaving the membrane, as illustrated in
Figure 15. The RH of the inlet air is maintained at 90%. As the pressure is nearly uniform in the vacuum chamber and the chemical potential of moisture at Point b in
Figure 2 must be lower than at Point a, the permeate pressure decreases as the RH of the dehumidified air drops. Specifically, it decreases from 1.13 kPa at 80% RH to 0.78 kPa at 30% RH. At the same time, the difference in the partial pressure of moisture between the supply side and permeate side diminishes from 1.40 kPa (=2.53 kPa–1.13 kPa) to 0.17 kPa (=0.95 kPa–0.78 kPa), indicating a significant reduction in moisture transfer resistance as the permeate pressure decreases. This reduction in permeate pressure leads to greater power consumption by the vacuum compressor and a lower COP, which falls from 8.12 at 1.13 kPa to 6.16 at 0.78 kPa.
The proposed MAD has more potential to reduce the membrane area than the existing systems in
Figure 1, because the latter cannot efficiently deal with the permeating air. Air is non-condensable at room temperature and has low thermal conductivity. A larger air fraction causes a higher degree of superheat during compression in
Figure 1a and more power consumption. Its impacts are also unfavourable for the systems in
Figure 1b,c. Membranes for moisture separation usually have a selectivity above 1100 [
15,
35,
36]. Their permeability usually drops with the increment in selectivity, and vice versa [
37]. The proposed MAD may allow membranes of selectivity below 100, as it still reaches a COP above 7 with an air permeability of 10% (i.e., selectivity of 9), as shown in
Figure 5. It possesses better compatibility with highly permeable membranes, and thus reduces the membrane area.
4.6. Gravitational Pressurization
The cooling water leaves the cooler at 1 atm and enters the condenser at a pressure of about 4–5 kPa. A throttle valve may be needed for pressure reduction, and its exergy destruction is subject to pressure loss. One way to diminish this loss is through gravity. With a height difference (
) between the cooler and condenser, the pressure of the cooling water decreases with elevation. Meanwhile, the mixture leaving the condenser can be pressurized by gravity prior to the multiphase pump.
Figure 16 shows the variations in the inlet pressure and input power of the pump with
. The condenser pressure is 4 kPa, which is independent of
. The air permeance and the cooling water flow rate are the same as those in
Section 4.4. In practice,
should have a maximum value of about 10.3 m, which is the head of water at 1 atm. Further increments in
will require additional pumping between the cooler and the condenser and will have a negative impact on the COP. As
increases, the pump’s inlet pressure rises. It is about 7.0, 11.5, 24.0, 56.0, and 74.0 kPa when
is 1, 2, 4, 8, and 10 m. The pressure increment is smoother at a smaller
. The reason is that, at the beginning of pressurization by gravity, the specific volumes of air and water vapour are high, and they drop as
and pressure increase. Since the gravitation work is approximately expressed by
, the pressure variation is more appreciable at a larger
with a smaller
.
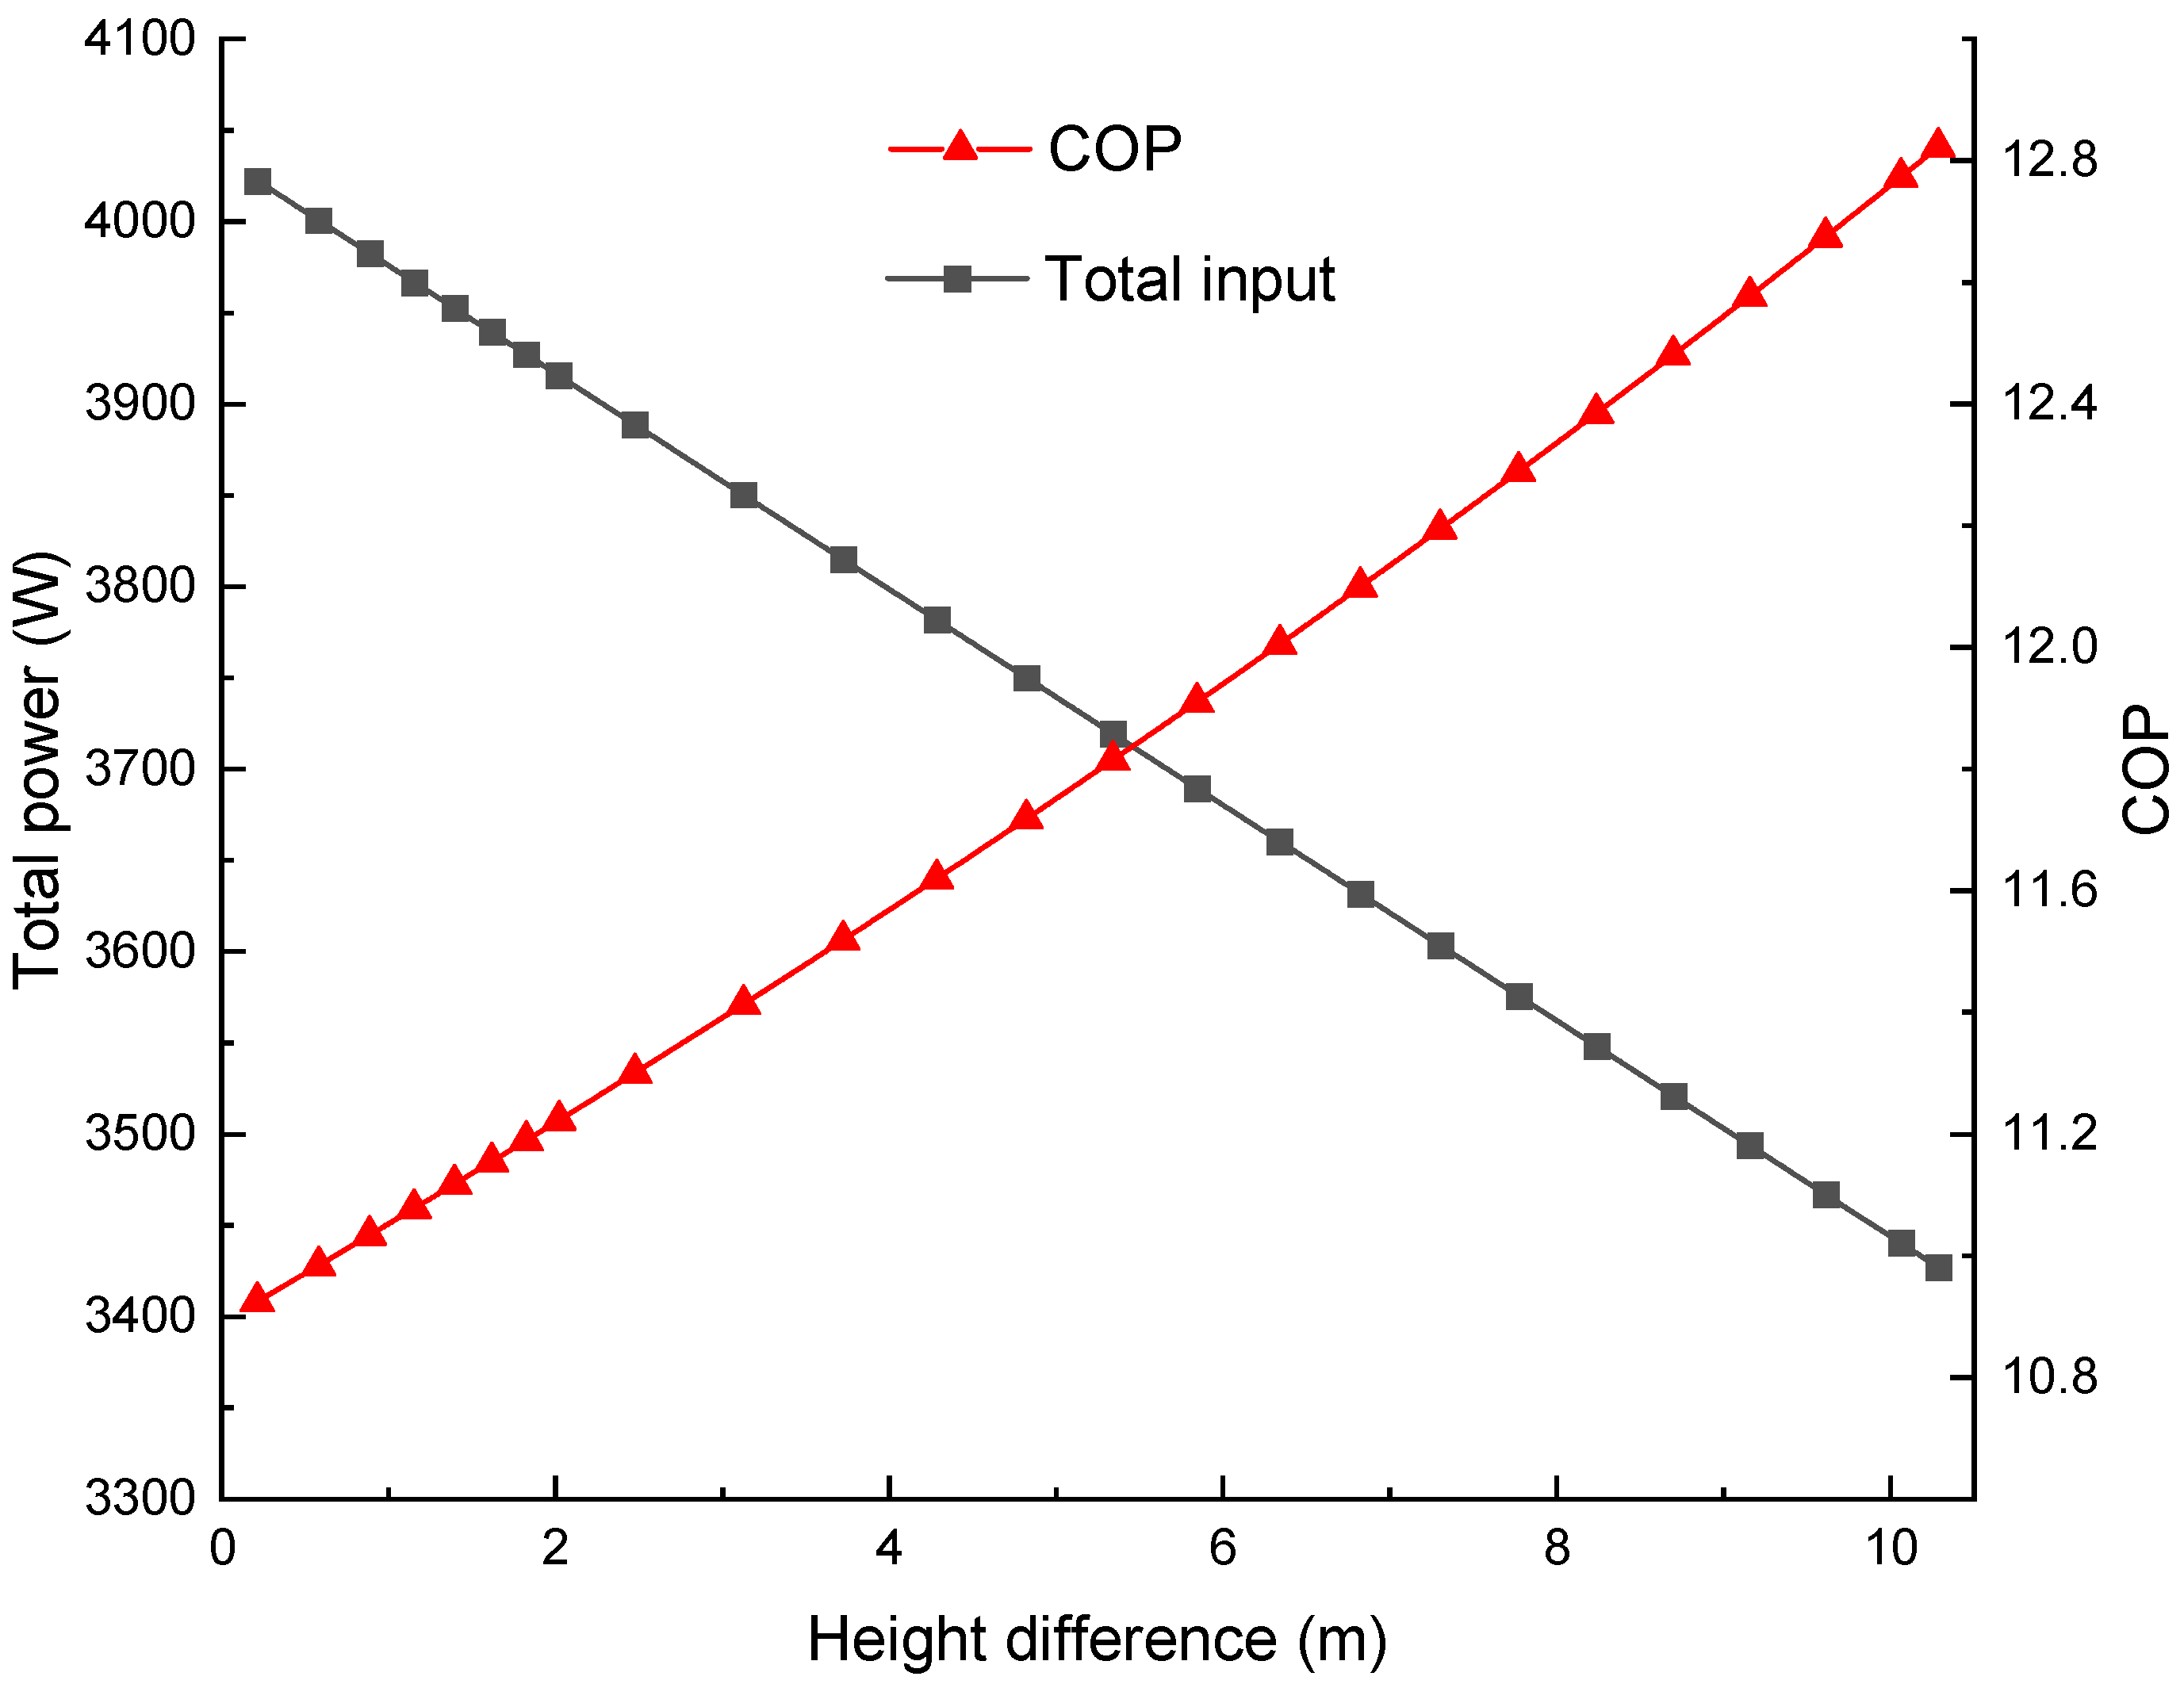
A higher inlet pressure of the pump results in lower input power. Gravity can decrease the pump power from 758 W to 176 W. The total power consumption also declines with a higher COP. As shown in
Figure 17, the COP is 12.8 at
= 10 m, which is about 20% higher than that when
. The gravity-driven pressurization is also technically beneficial for the multiphase pump. It reduces the GVF of the mixture at the pump inlet. An
of 10 m may not be available in some applications. However, a smaller
, e.g., 2~3 m, is common on site. A GVF below 50% is accessible in this height range, which can be handled by screw-type multiphase pumps.
4.7. Internal Recirculation
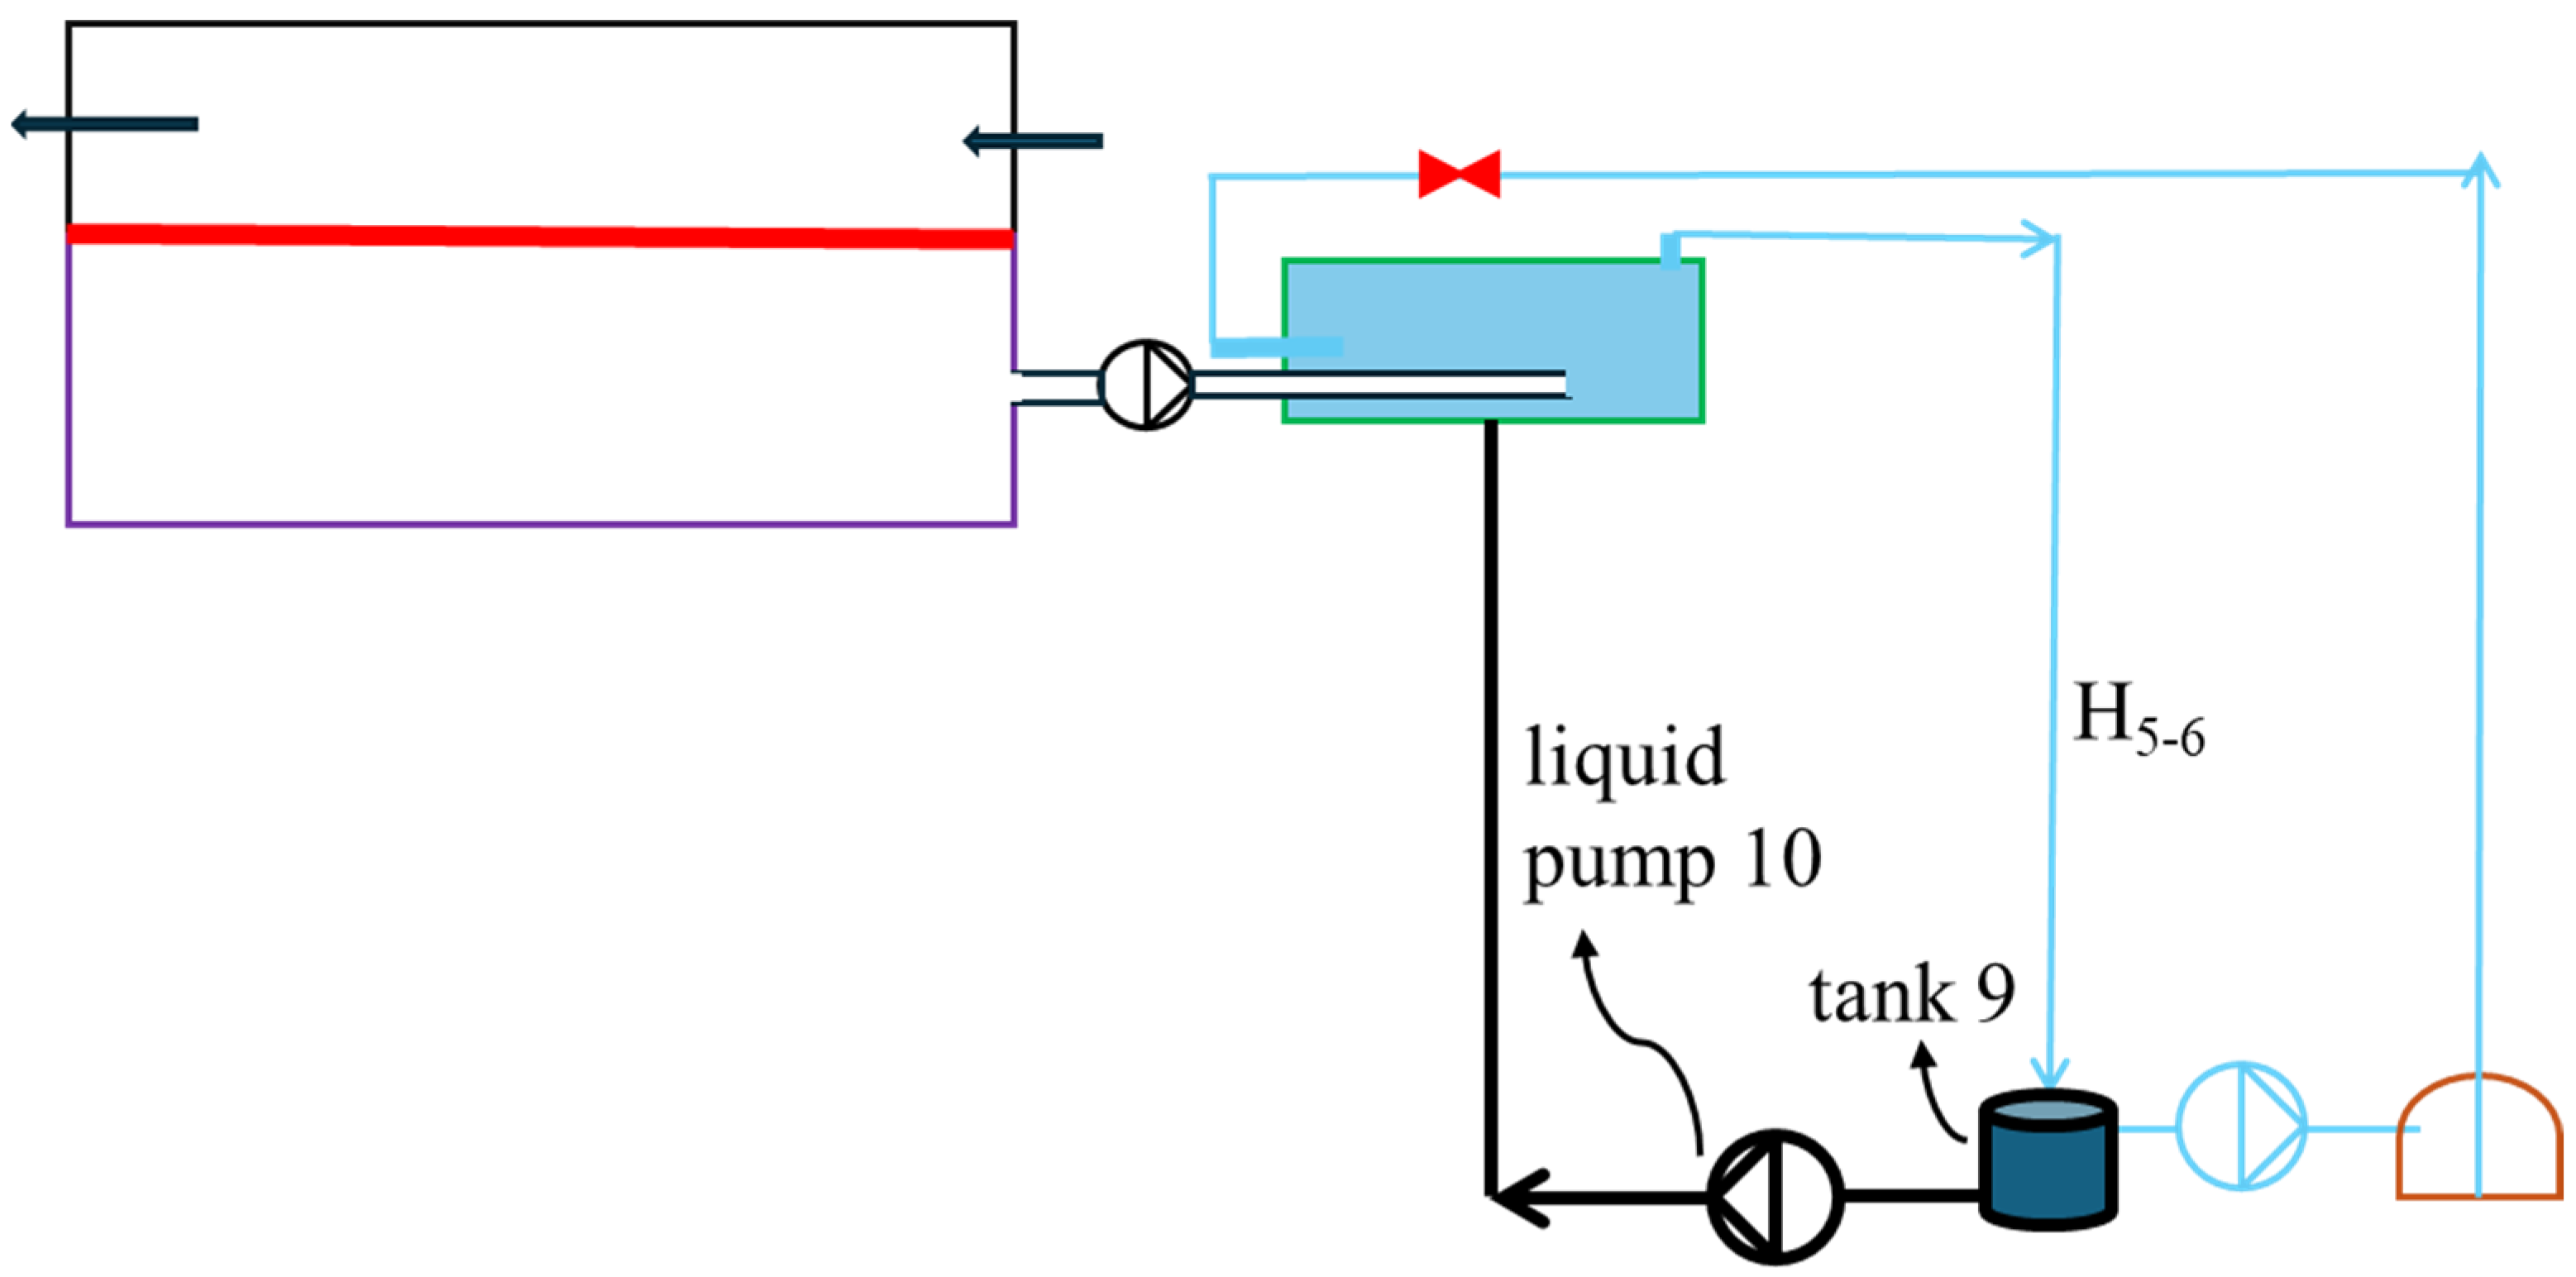
Aside from enlarging the height difference, internal water recirculation can increase the inlet pressure of the multiphase pump and reduce its GVF, as illustrated in
Figure 18. In addition to the components in
Figure 2, a liquid water recirculation pump (10) and an accumulator (9) are employed. Given the height difference H
5–6, the recirculation loop provides a larger liquid water flow rate, a lower GVF, and a higher density of the water/air mixture at the outlet of the condenser. The pressure increment by H
5–6 therefore rises, accompanied by a decreased GVF at the multiphase pump’s inlet.
Notably, GVF is an important factor in the multiphase pump’s efficiency. Many experimental studies on the impact of GVF have been carried out, and some results are summarized in
Table 2. A lower GVF is beneficial. It can increase the pump’s efficiency by diminishing vortices, air pockets, and hydraulic loss. It also elevates the critical cavitation coefficient and enables more stable operation of the rotor. Generally, the pump efficiency increases with a decrement in the GVF, as shown in
Figure 19. The pumps in the tests in
Table 2 and
Figure 19 are prototypes. Higher efficiencies are expected from commercial products.
The overall impacts of internal water recirculation through Pump (10) are presented in
Table 3. The air permeance rate, permeate pressure, cooling water flow rate, and condenser pressure are the same as those in
Section 4.6. As the water recirculation rate climbs, the inlet pressure of the multiphase pump goes up and the GVF drops. Additional power is consumed by the recirculation pump, which is 81.2 W at a flow rate of 7.2 kg/s and a height of 3 m. This power consumption is relatively small compared to the vacuum compressor’s input (3264 W). Moreover, the increased inlet pressure of the multiphase pump reduces its power input, and the total power consumption of the two pumps is almost constant. Hence, there is only a slight variation in the COP.
5. Conclusions
To overcome the challenges of air removal for vacuum membrane-based air dehumidification, this paper proposes a novel approach driven by direct moisture condensation and multiphase pumping. The permeating moisture is compressed and then condensed under a pressure slightly above the saturation pressure of the cooling water. The large flow rate of cooling water enables isothermal pressurization of the water/air mixture through a multiphase pump. Selectivity of the membrane, cooling water flow rate, permeate pressure, condenser pressure, membrane area, and gravitational work are some key factors in dehumidification performance.
The vacuum compressor accounts for about 80% of the system power consumption, which is sensitive to its inlet and outlet pressures. Its inlet pressure is influenced by the moisture partial pressure in the dehumidified air. When it changes from 1 kPa to 2 kPa, the COP increases from 7.4 to 14.0. The compressor’s outlet pressure is related to the condenser pressure, which will be close to the water saturation pressure for a high COP. A condenser pressure decrement from 5.4 to 3.8 kPa causes a COP increment from 8.4 to 11.5. On the other hand, a small difference between the condenser pressure and water saturation pressure may lead to a large GVF at the inlet of the multiphase pump. Increasing the cooling water flow and gravitational work can ease this problem.
A large flow rate of cooling water also reduces the moisture condensation temperature and compressor input. Meanwhile, it increases the pump input. There is an optimum water flow rate, at which the COP reaches the peak. It is about 3.6 kg/s with a COP of 10.9 at a moisture permeance rate of 1 mol/s. Using gravity to pressurize the water/air mixture from the condenser can increase the COP to 12.8. An elevation difference between the condenser and pump of 2~3 m is sufficient to get the GVF below 50%, which is manageable by common multiphase screw pumps. A further reduction in the GVF is achievable through a water recirculation loop, leading to increased pump efficiency and stability.
Air permeance through the membrane is challenging, and a permeance of 10% results in a large pump power consumption and offers less efficiency advantage over conventional refrigeration-driven dehumidification technologies. Although highly selective membranes are desirable, an air permeance of only 1% can still cause a significant increment in the compressor outlet pressure in 20 min if not removed. The multiphase pump provides continuous air removal with relatively low electricity consumption. It allows the use of membranes with high permeability and low selectivity and scales down the membrane area and cost.
The characteristics of the membrane have a significant impact on the COP. For instance, using a zeolite membrane, when the membrane area increases from 116 to 795 m2 with a fixed inlet RH of 90% and an outlet RH of 50% for the supply air, the permeate pressure rises from 0.5 kPa to 1.5 kPa. Consequently, the COP increases from 4.7 to 10.4. Additionally, with a membrane area of 260 m2, the COP decreases from 8.12 to 6.16 as the outlet RH drops from 80% to 30%. The proposed dehumidifier alleviates concerns about air permeance and operates more effectively when using membranes with high permeability. In the future, the performance of the dehumidifier will be examined using highly permeable membranes, which will reduce moisture transfer resistance and increase COP.
Above all, the proposed approach can reduce the thermodynamic irreversibility for air dehumidification by using a vacuum mixing condenser and multiphase pump. It is more efficient than existing MADs. The direct mixing process diminishes the temperature difference between the moisture and cooling water during heat transfer, while the multiphase pump provides isothermal pressurization around ambient temperature.
