CAD Analysis of 3D Printed Parts for Material Extrusion—Pre-Processing Optimization Method
Abstract
1. Introduction
- The second chapter will review the state of the art regarding FFF, focusing on the latest approaches.
- The third chapter will include two case studies on the optimal printing orientation. The first case study was performed on the solid structure of the part with a rectilinear infill configured in the slicer, while the second case study was performed on the same part with lattice structure.
- The fourth chapter will explore the proposed CAD analysis methods required for preparing the ME process. This chapter will also include experimental data obtained through applying the proposed analysis methods to the ME processes. The main method of evaluation used is a comparative analysis. The main criteria for the analysis are support volume and mass, material consumption, printing times, and surface quality.
- The last chapter will focus on the conclusions drawn, including future research directions.
2. State of the Art
- Process parameters: These include printing temperature, extrusion speed, layer height, printing speed, and bed temperature.
- Part design: The shape and dimensions of the part influence the preparation method, the process itself, and the printing results.
- Material: The type of material used for 3D printing affects the physical and mechanical properties of the part.
3. Materials and Methods
- Printing speed: 50 mm/s
- Infill speed: 60 mm/s
- Infill pattern: rectilinear
- Layer height: 0.2 mm
- Line width: 0.4 mm
- Printing temperature: 2100
- Build plate temperature: 600
- Retraction speed: 45 mm/s
- Retraction length: 1.2 mm
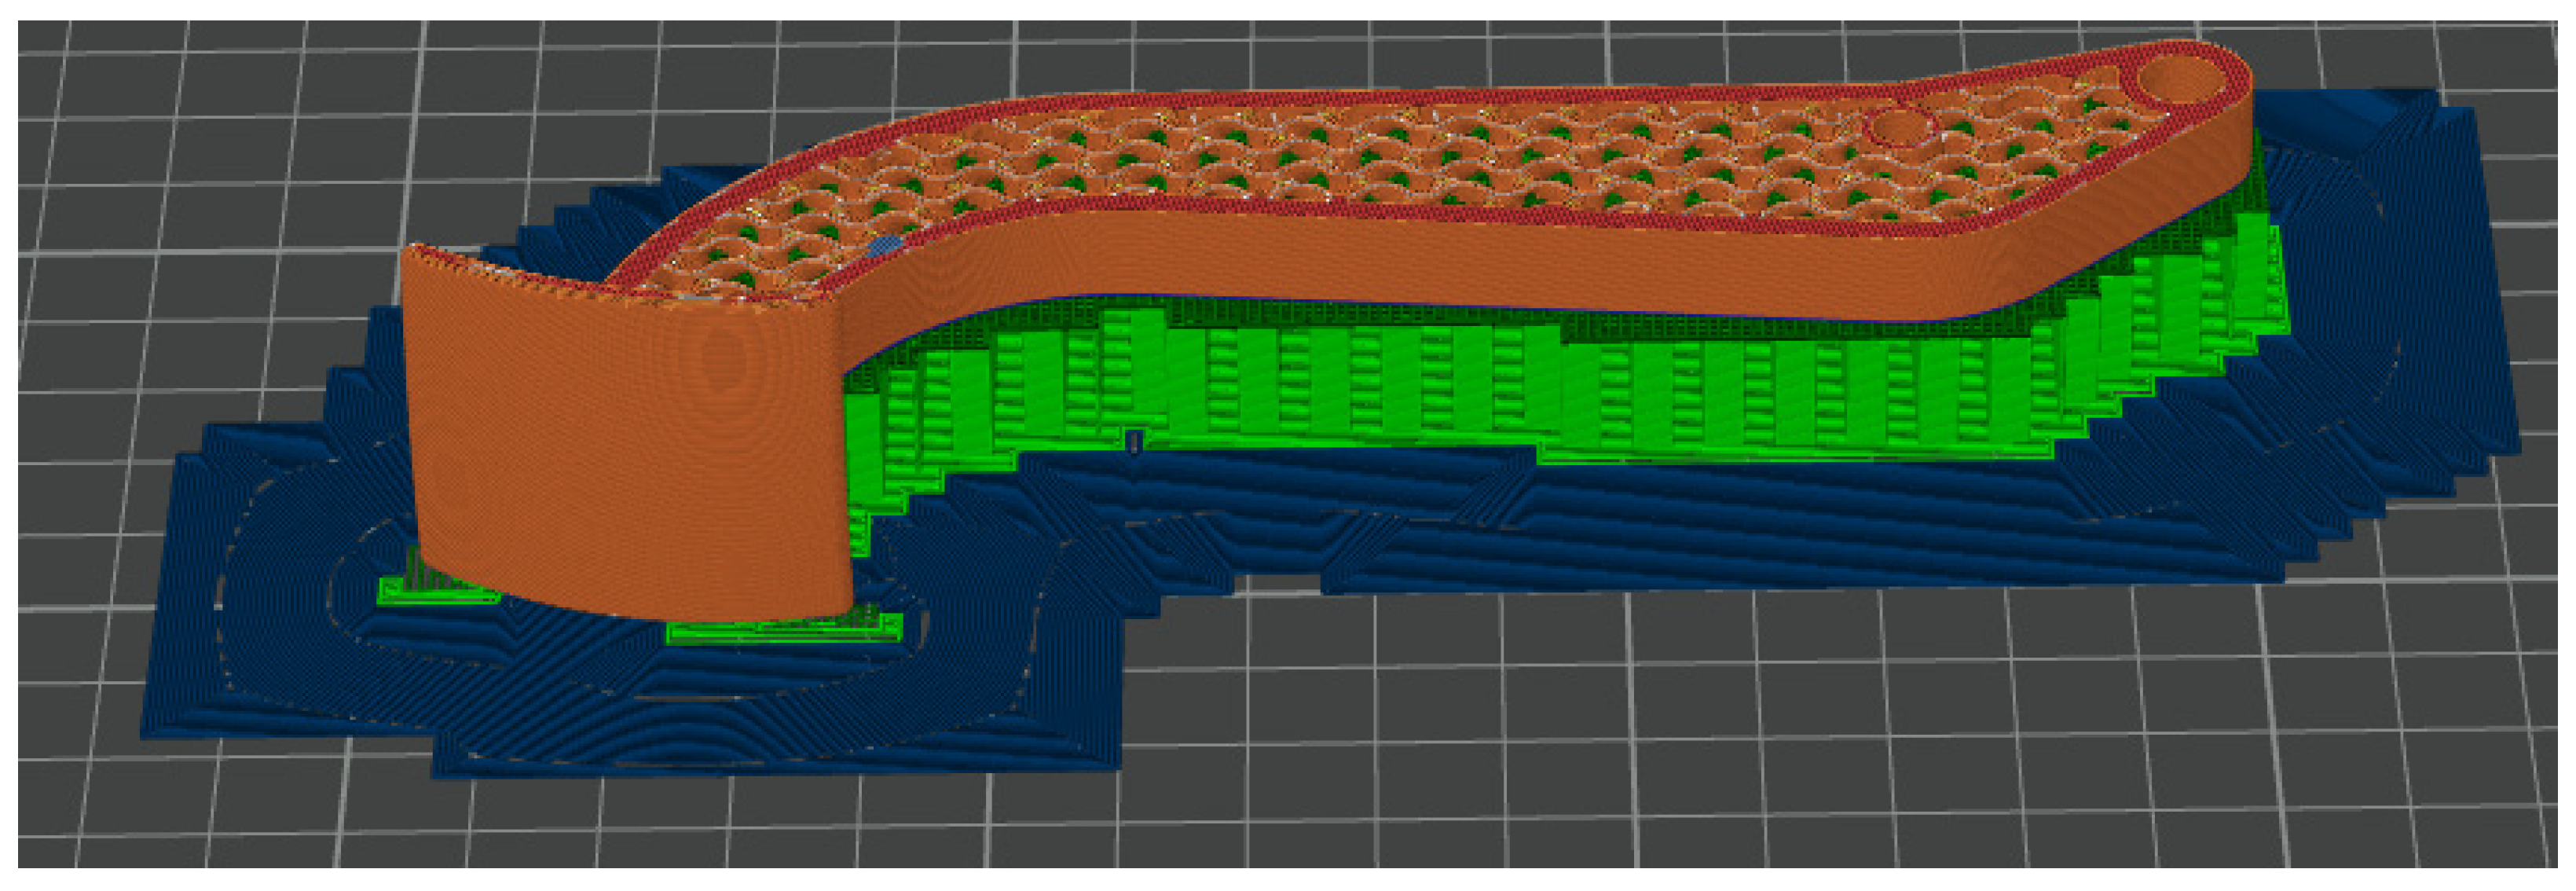
- The slicer estimates for the total printed volume, infill level and weight, support weight, print duration, and total weight.
- The experimental data, including total print measured weight, part weight without supports, supports and brim weight, and print duration.
- Furthermore, the quality of the part was assessed through visual inspection. The visual inspection was focused on finding delamination, layer shifting, stair stepping effect, overhang, and other issues.
- For the efficiency analysis, the amount of post-processing required in each case was taken into consideration.
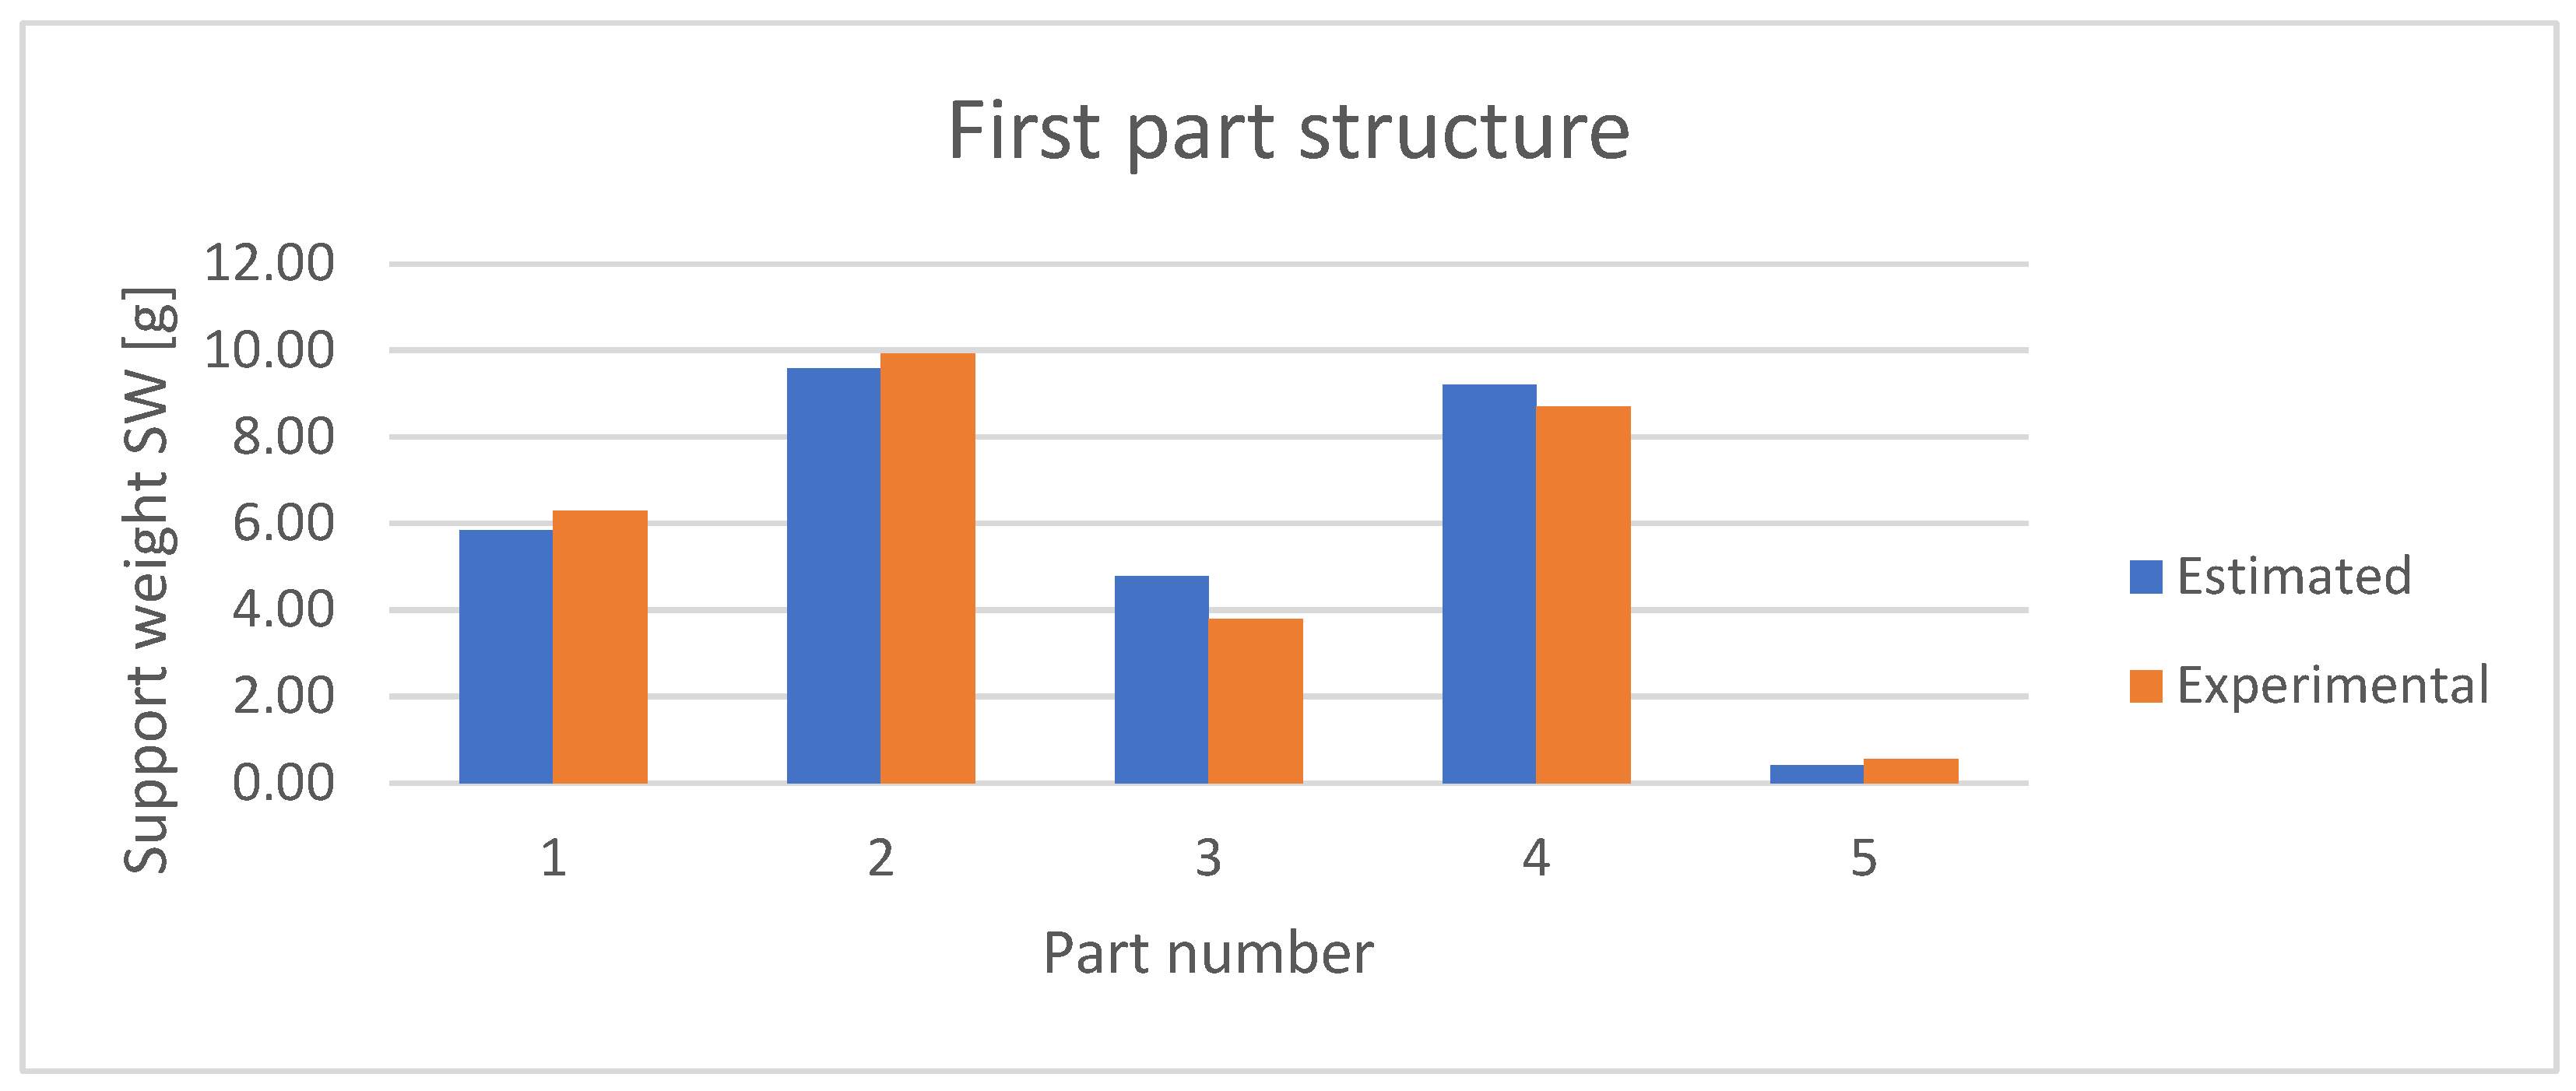
- The weight of the supports was determined by weighing the part before and after removing the extra material. Also, the estimated support weight from the slicer was noted. The support weight (expressed in grams), noted with SW, was considered as the base value of this evaluated factor. SW evaluates the support requirements of the corresponding printing orientation and thus was included in the analysis as a direct expression of the optimization criteria used by the software module.
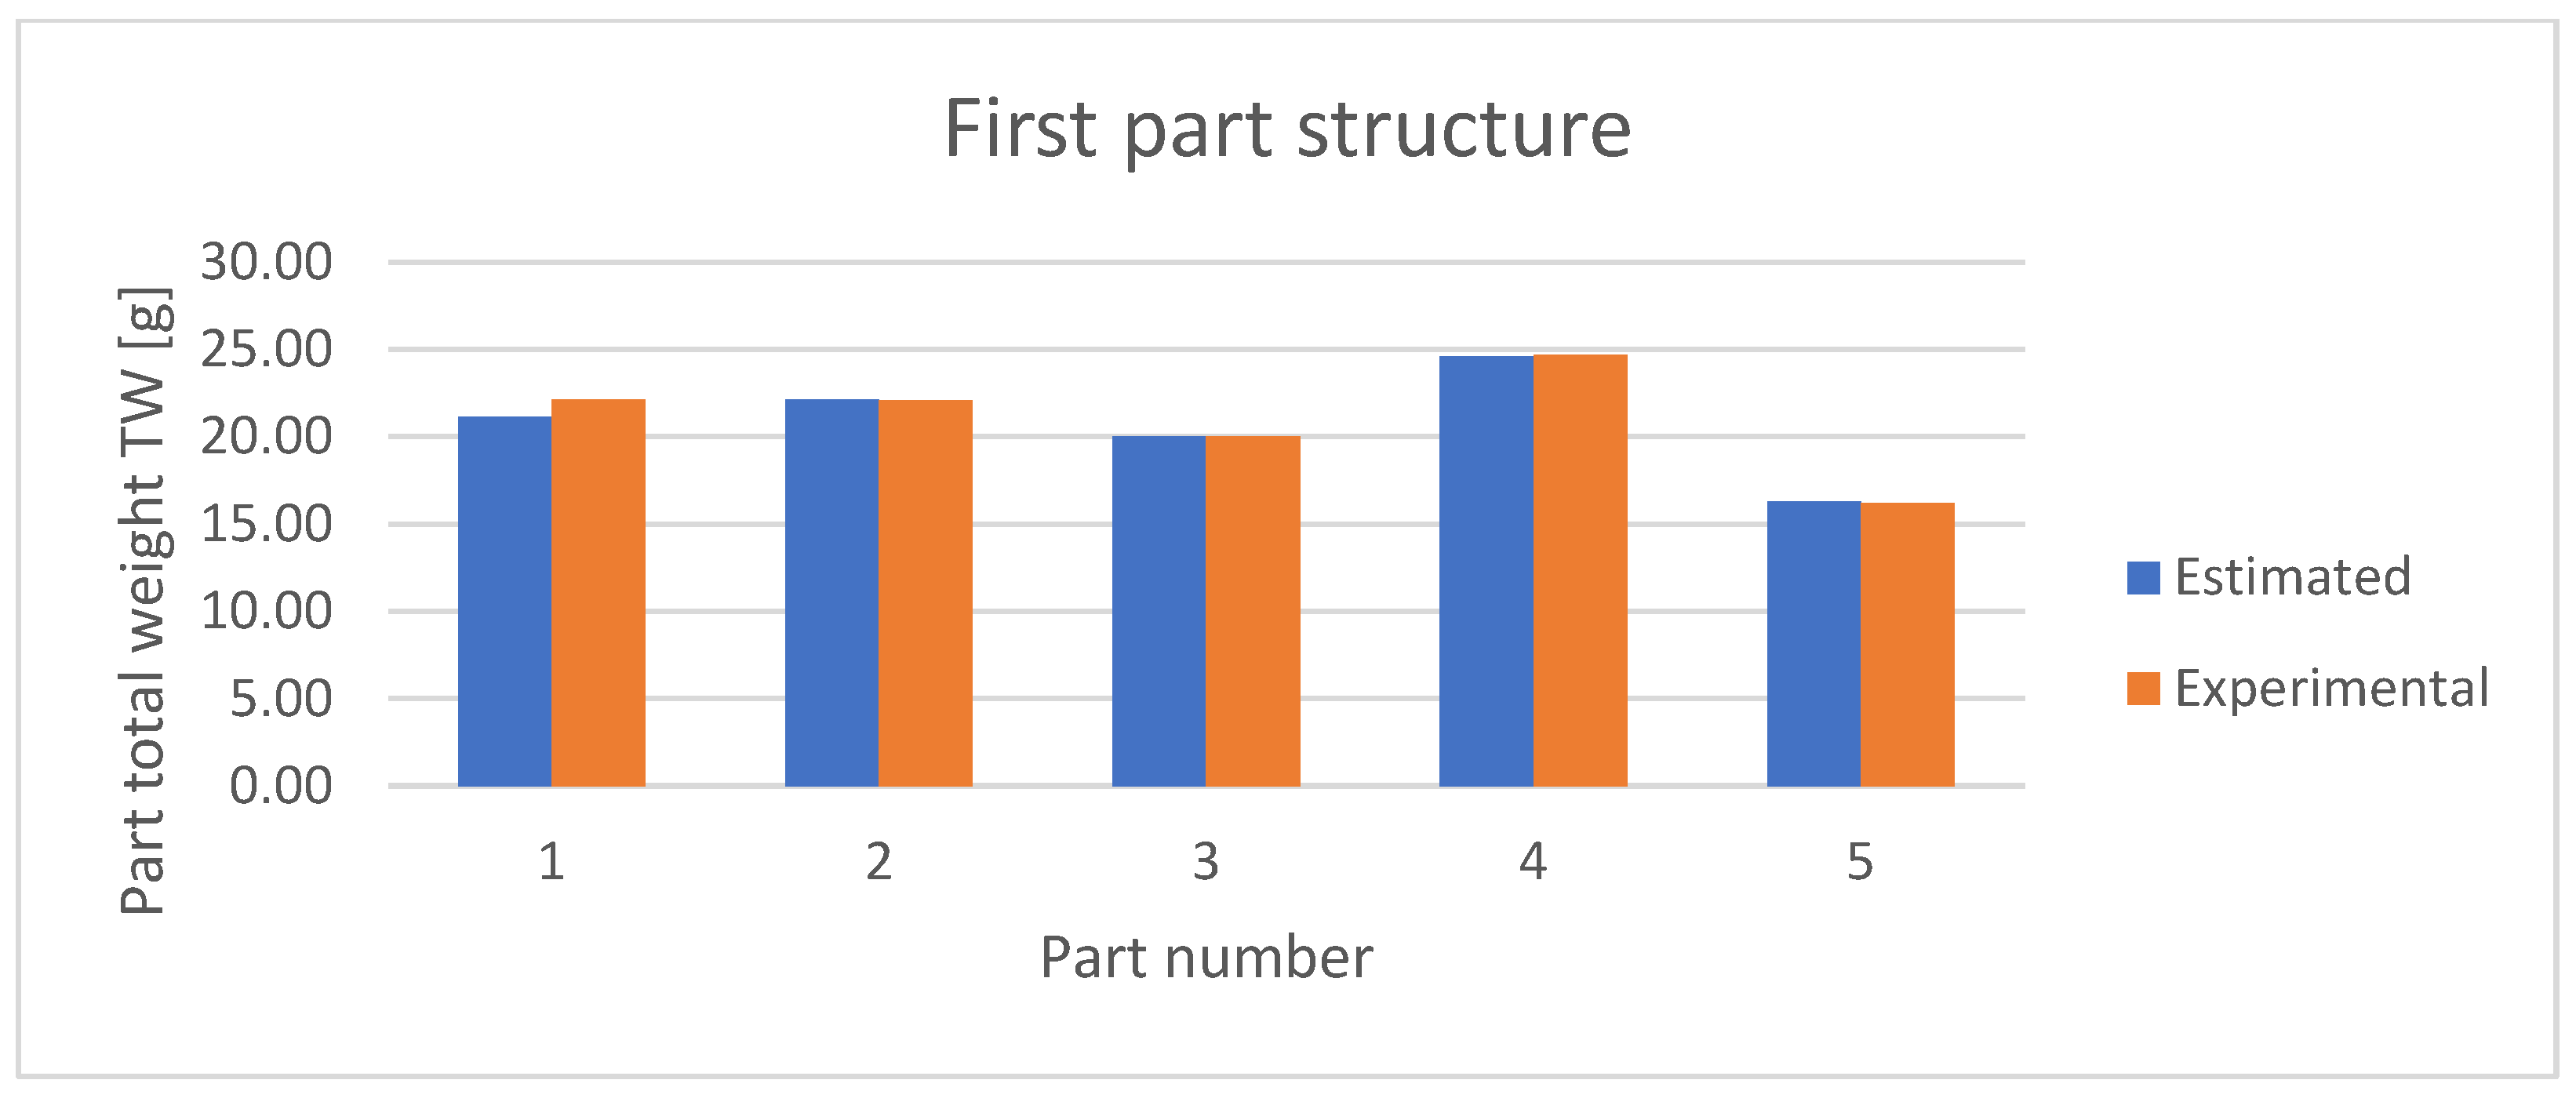
- The total weight of the part was estimated in the slicer before print. Also, the parts were weighted after the operation was completed. It must be noted that the total weight of the part (noted with TW) depends not only on support configuration but also on infill distribution. TW was included in the analysis as an expression of the total material consumption, another optimization criteria used by the software module.
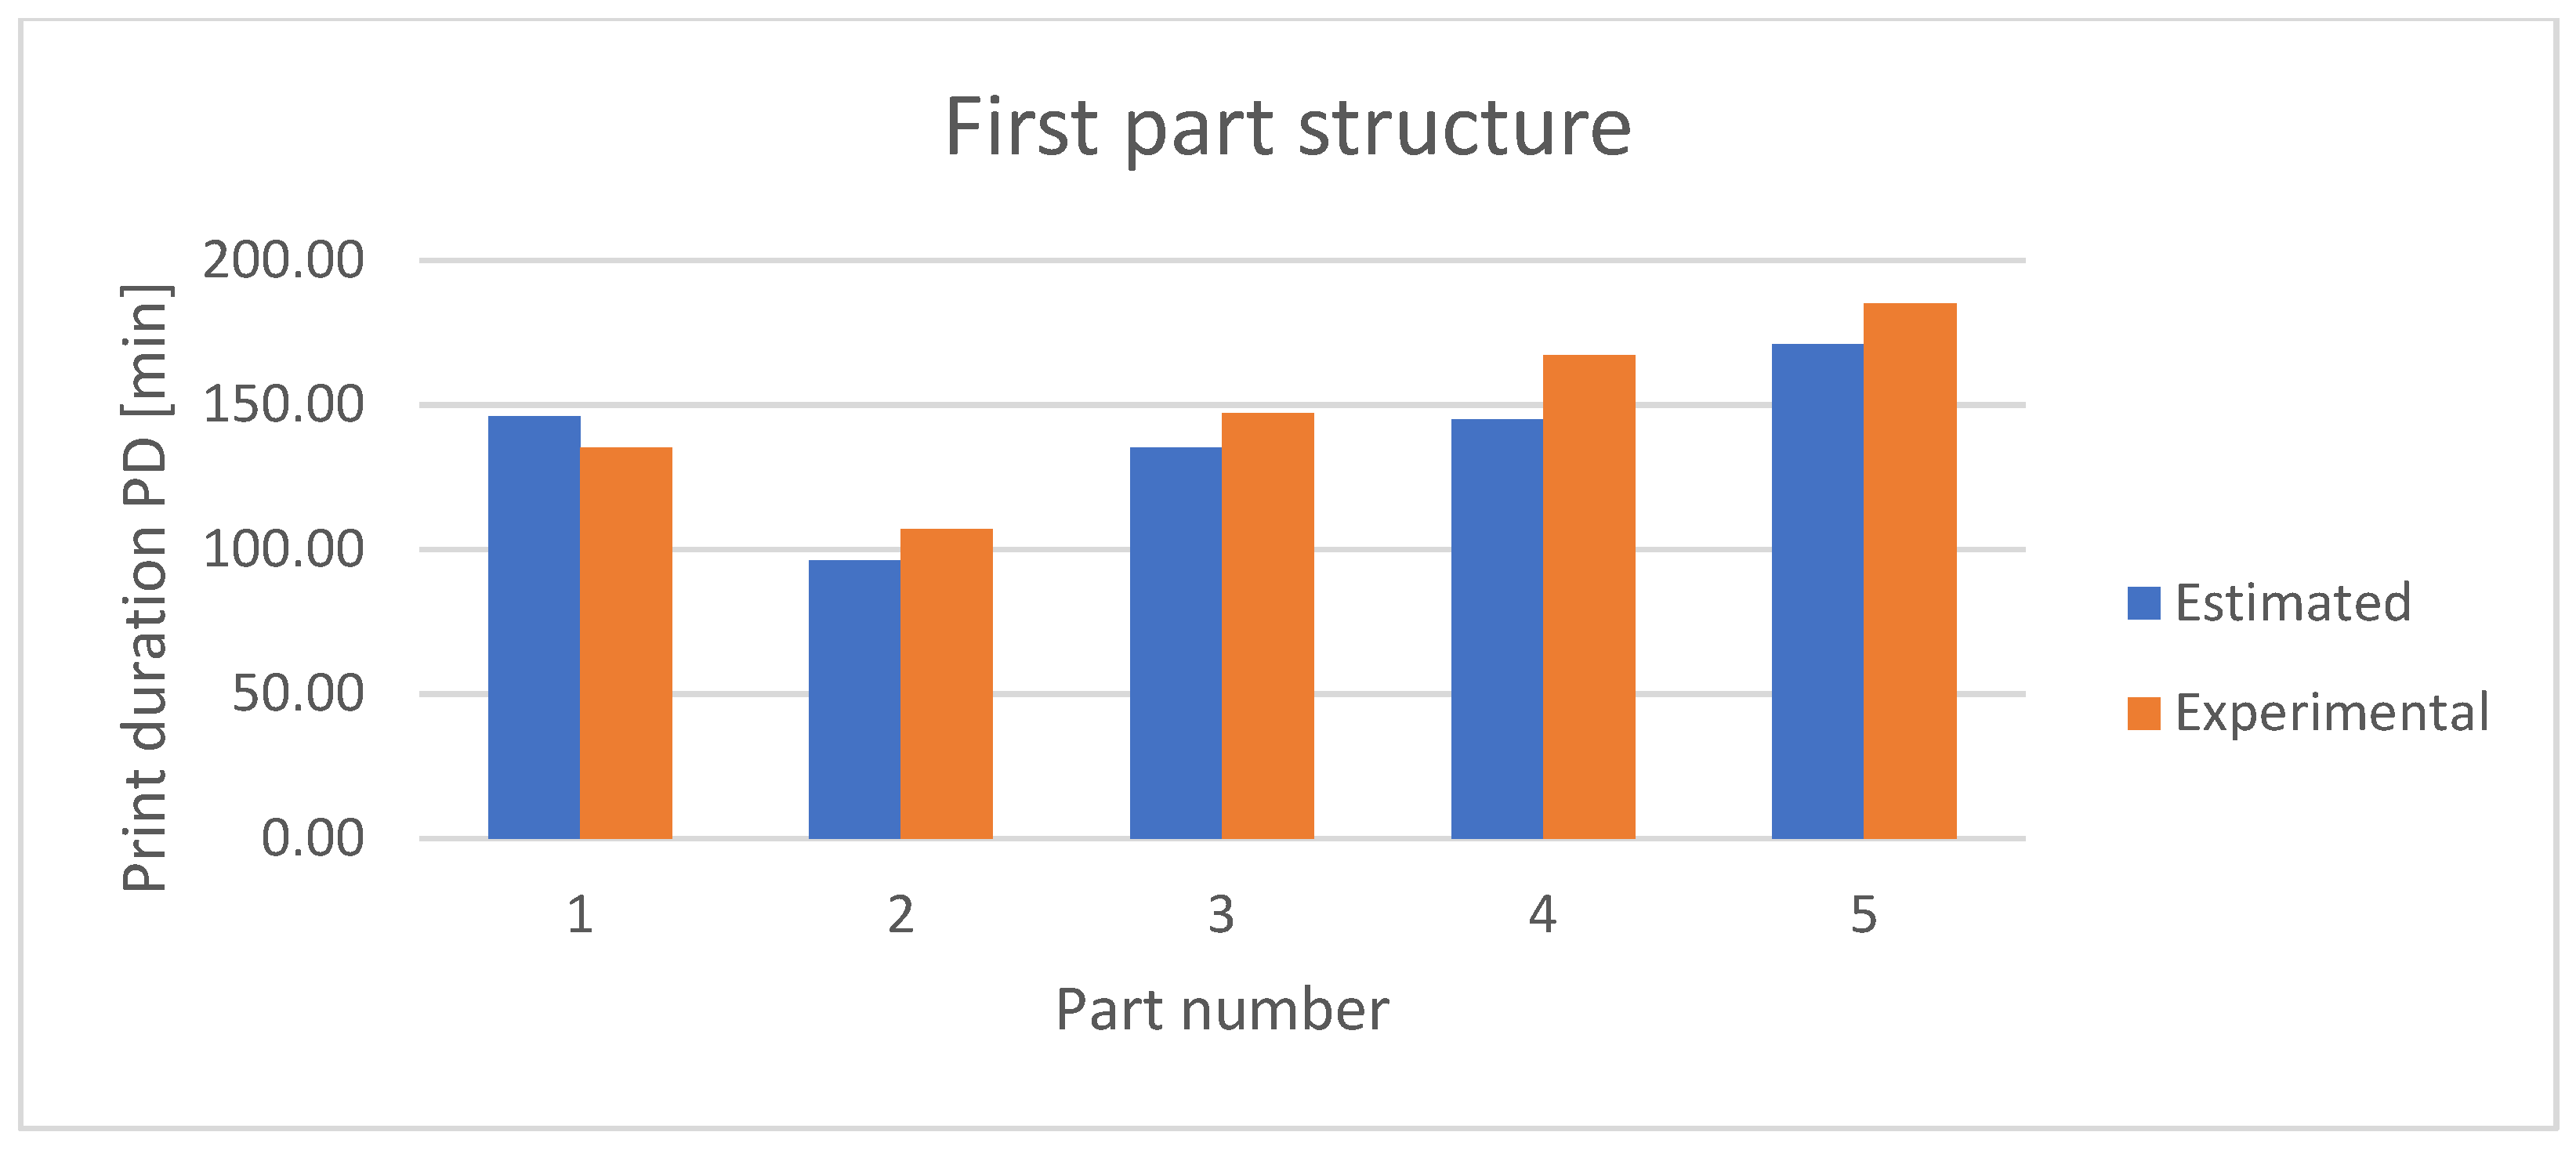
- The print duration was also taken into account (noted with PD). Since the ME process efficiency also depends on productivity, and because from a wider perspective the energy requirements should also be taken into consideration, the print duration (expressed in minutes) influences the outcome of the evaluation. Being an expression of productivity (which influences work efficiency), the print duration was included in the study after observing that the part orientation provided by the software significantly increases the printed height.
- Also linked to process efficiency and productivity, the amount of post-processing required was considered, noted with PPS. This is mainly linked to support material removal, thus being influenced by the support requirements. In order to evaluate the PPS factor, the time (expressed in minutes) required for part post-processing was taken into consideration. For a more precise calculation, the time required for post-processing was expressed using the decimal system, with intervals of 0.5. PPS was included in the analysis because it is a major factor that influences productivity, besides PD.
- Another factor included in the calculation was surface quality, noted with SQS. Effects such as delamination, layer shifting, stair-stepping effect, overhang, etc. were noted. A score of 1 was assigned for each surface that displayed issues that were noticed by visually inspecting the part after printing. For a surface with major issues, a score of 2 was assigned. For a surface with minor issues, a score of 0.5 was assigned. SQS was included in the analysis as one of the aspects that should be improved by the software module used for determining the part printing posture.
- The parameters have different value ranges. For example, typically the PD parameter (expressed in minutes) will have a much higher value than the part weight (expressed in grams), since the material flow rated in a standard FDM process is much greater than 1 g/min. This, in turn, can affect the formula efficiency, since the PD parameter will have a greater influence on the final score. To compensate for this issue, the coefficients can be used to scale the formula elements to more comparable values.
- The coefficients can also be used as adjustment tools for the formula, giving it greater flexibility. Since the analyzed parameters are more or less relevant, depending on the characteristics of the performed study, the coefficients can be modified to alter the weight of the parameters according to each study’s requirements. Thus, the formula can be adapted and used for other research projects or optimization procedures.
4. Results and Discussions
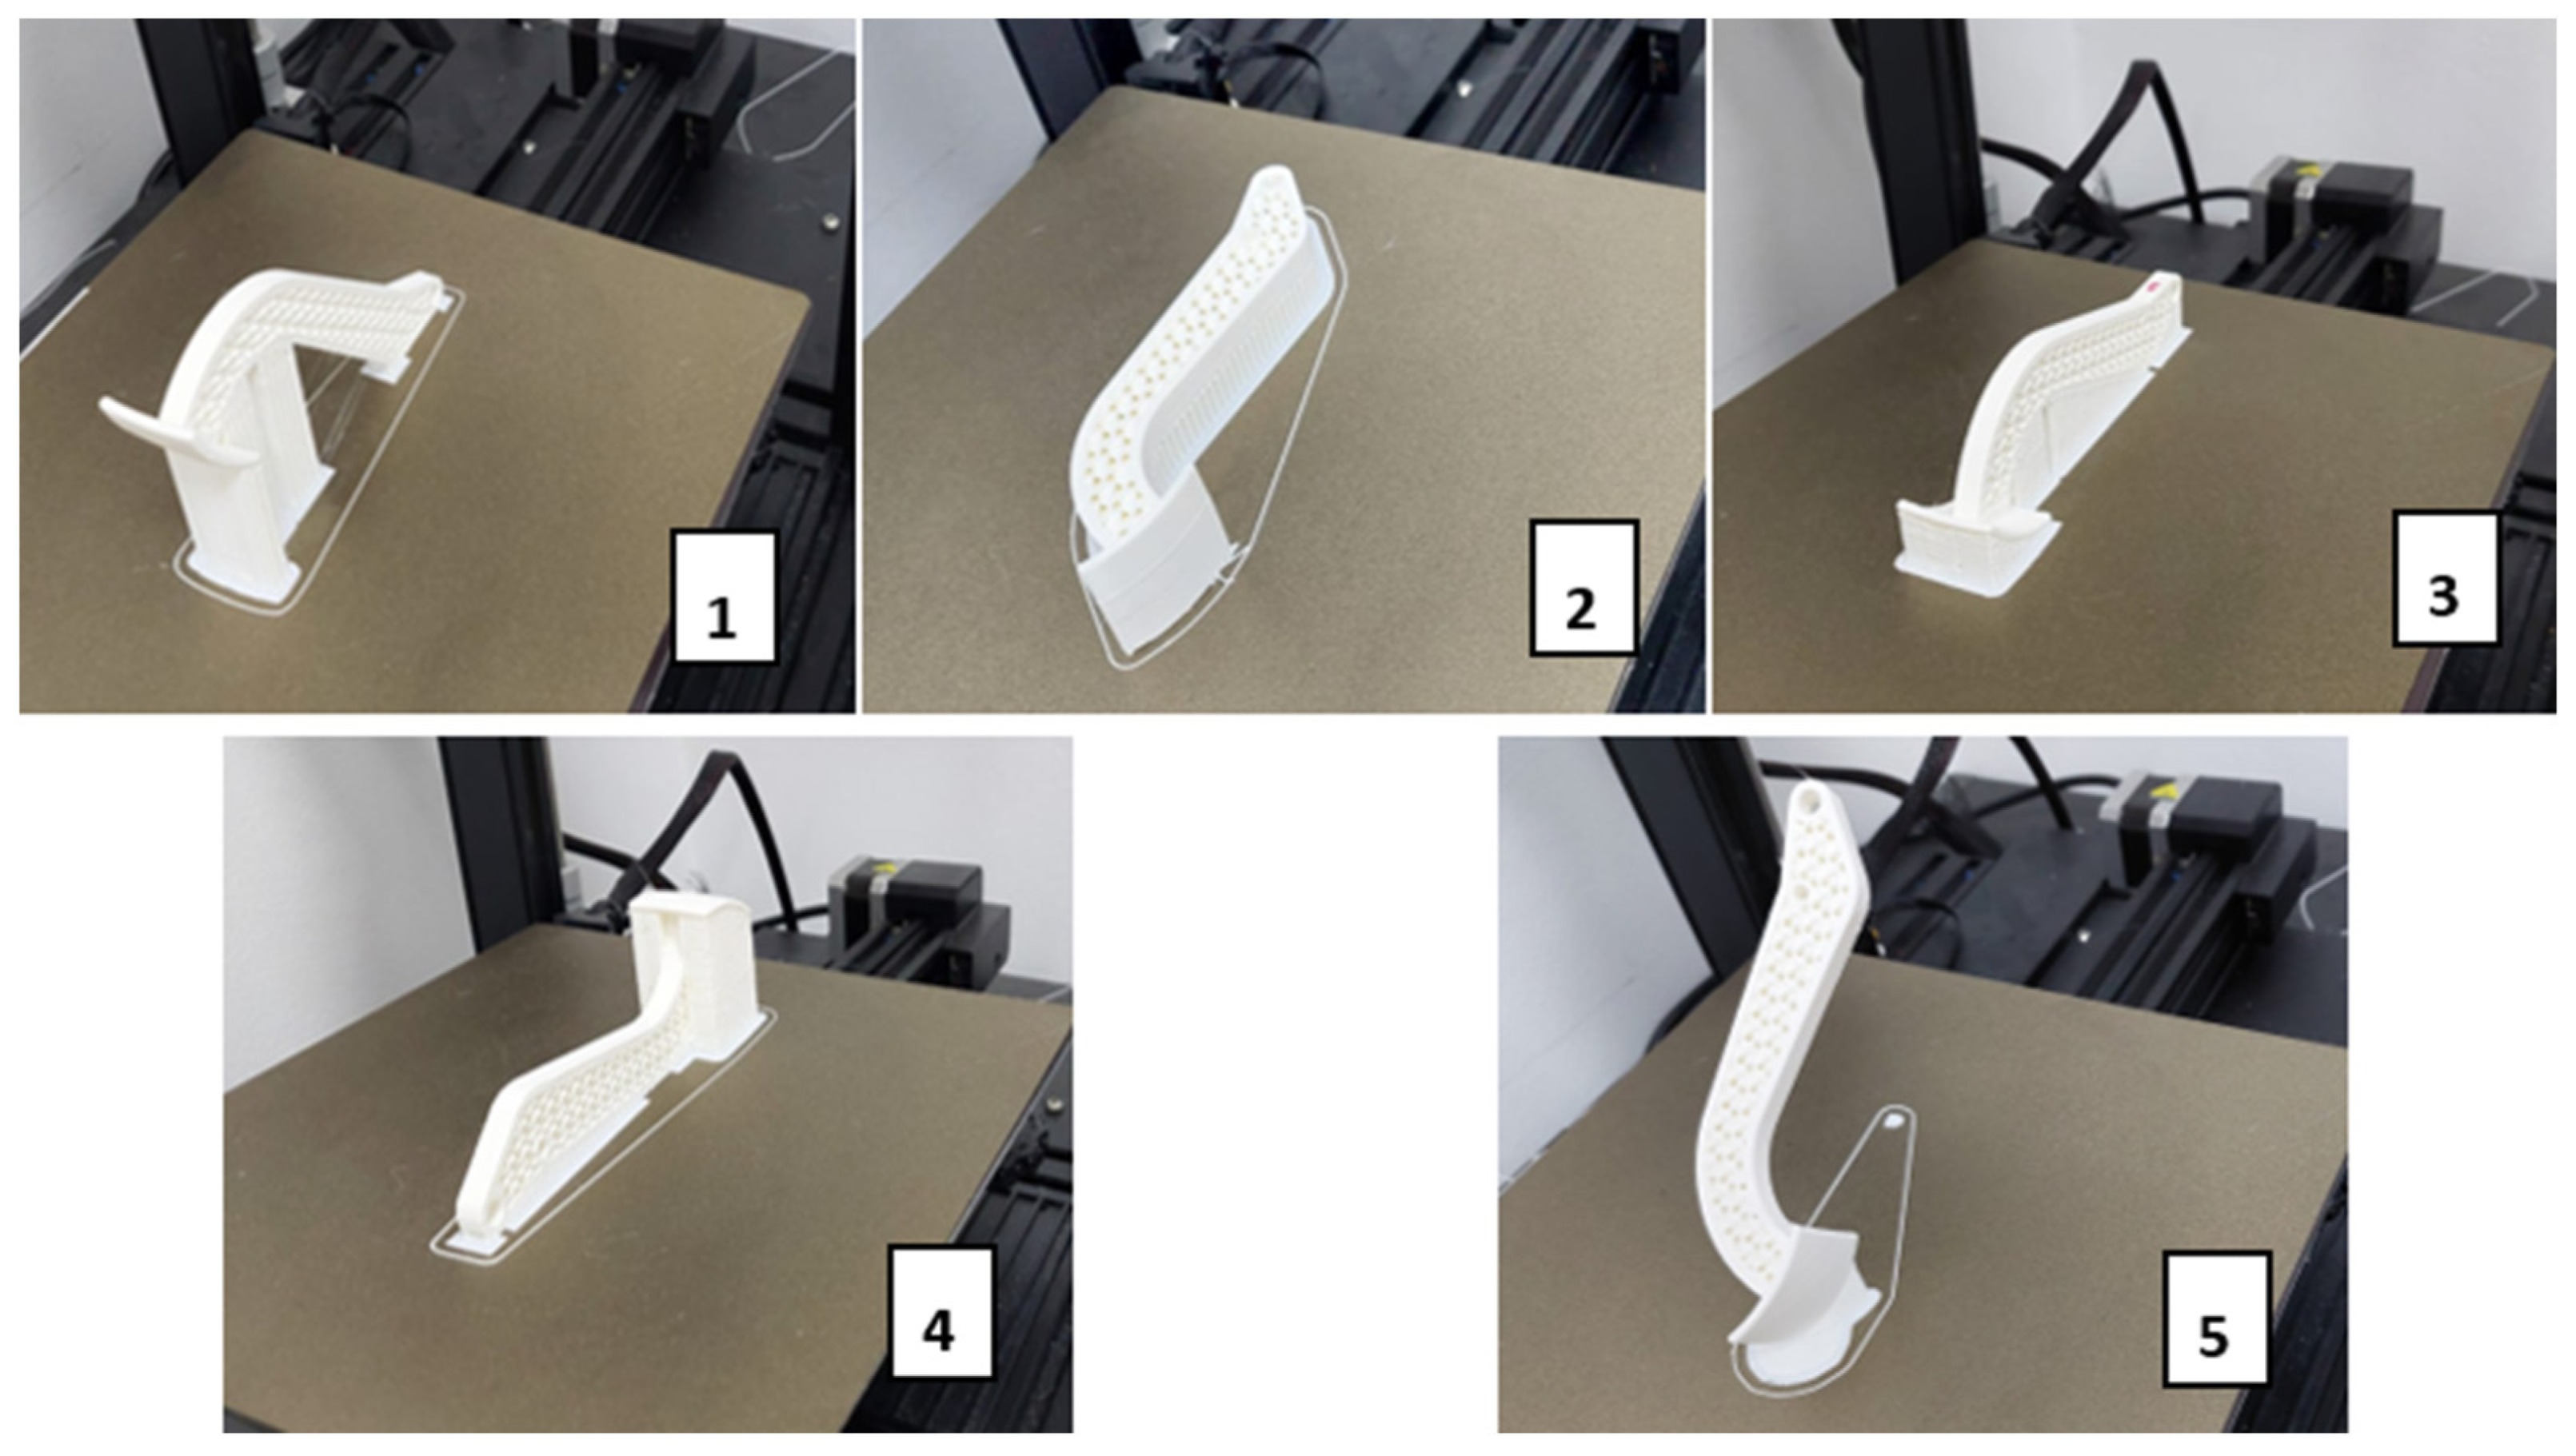
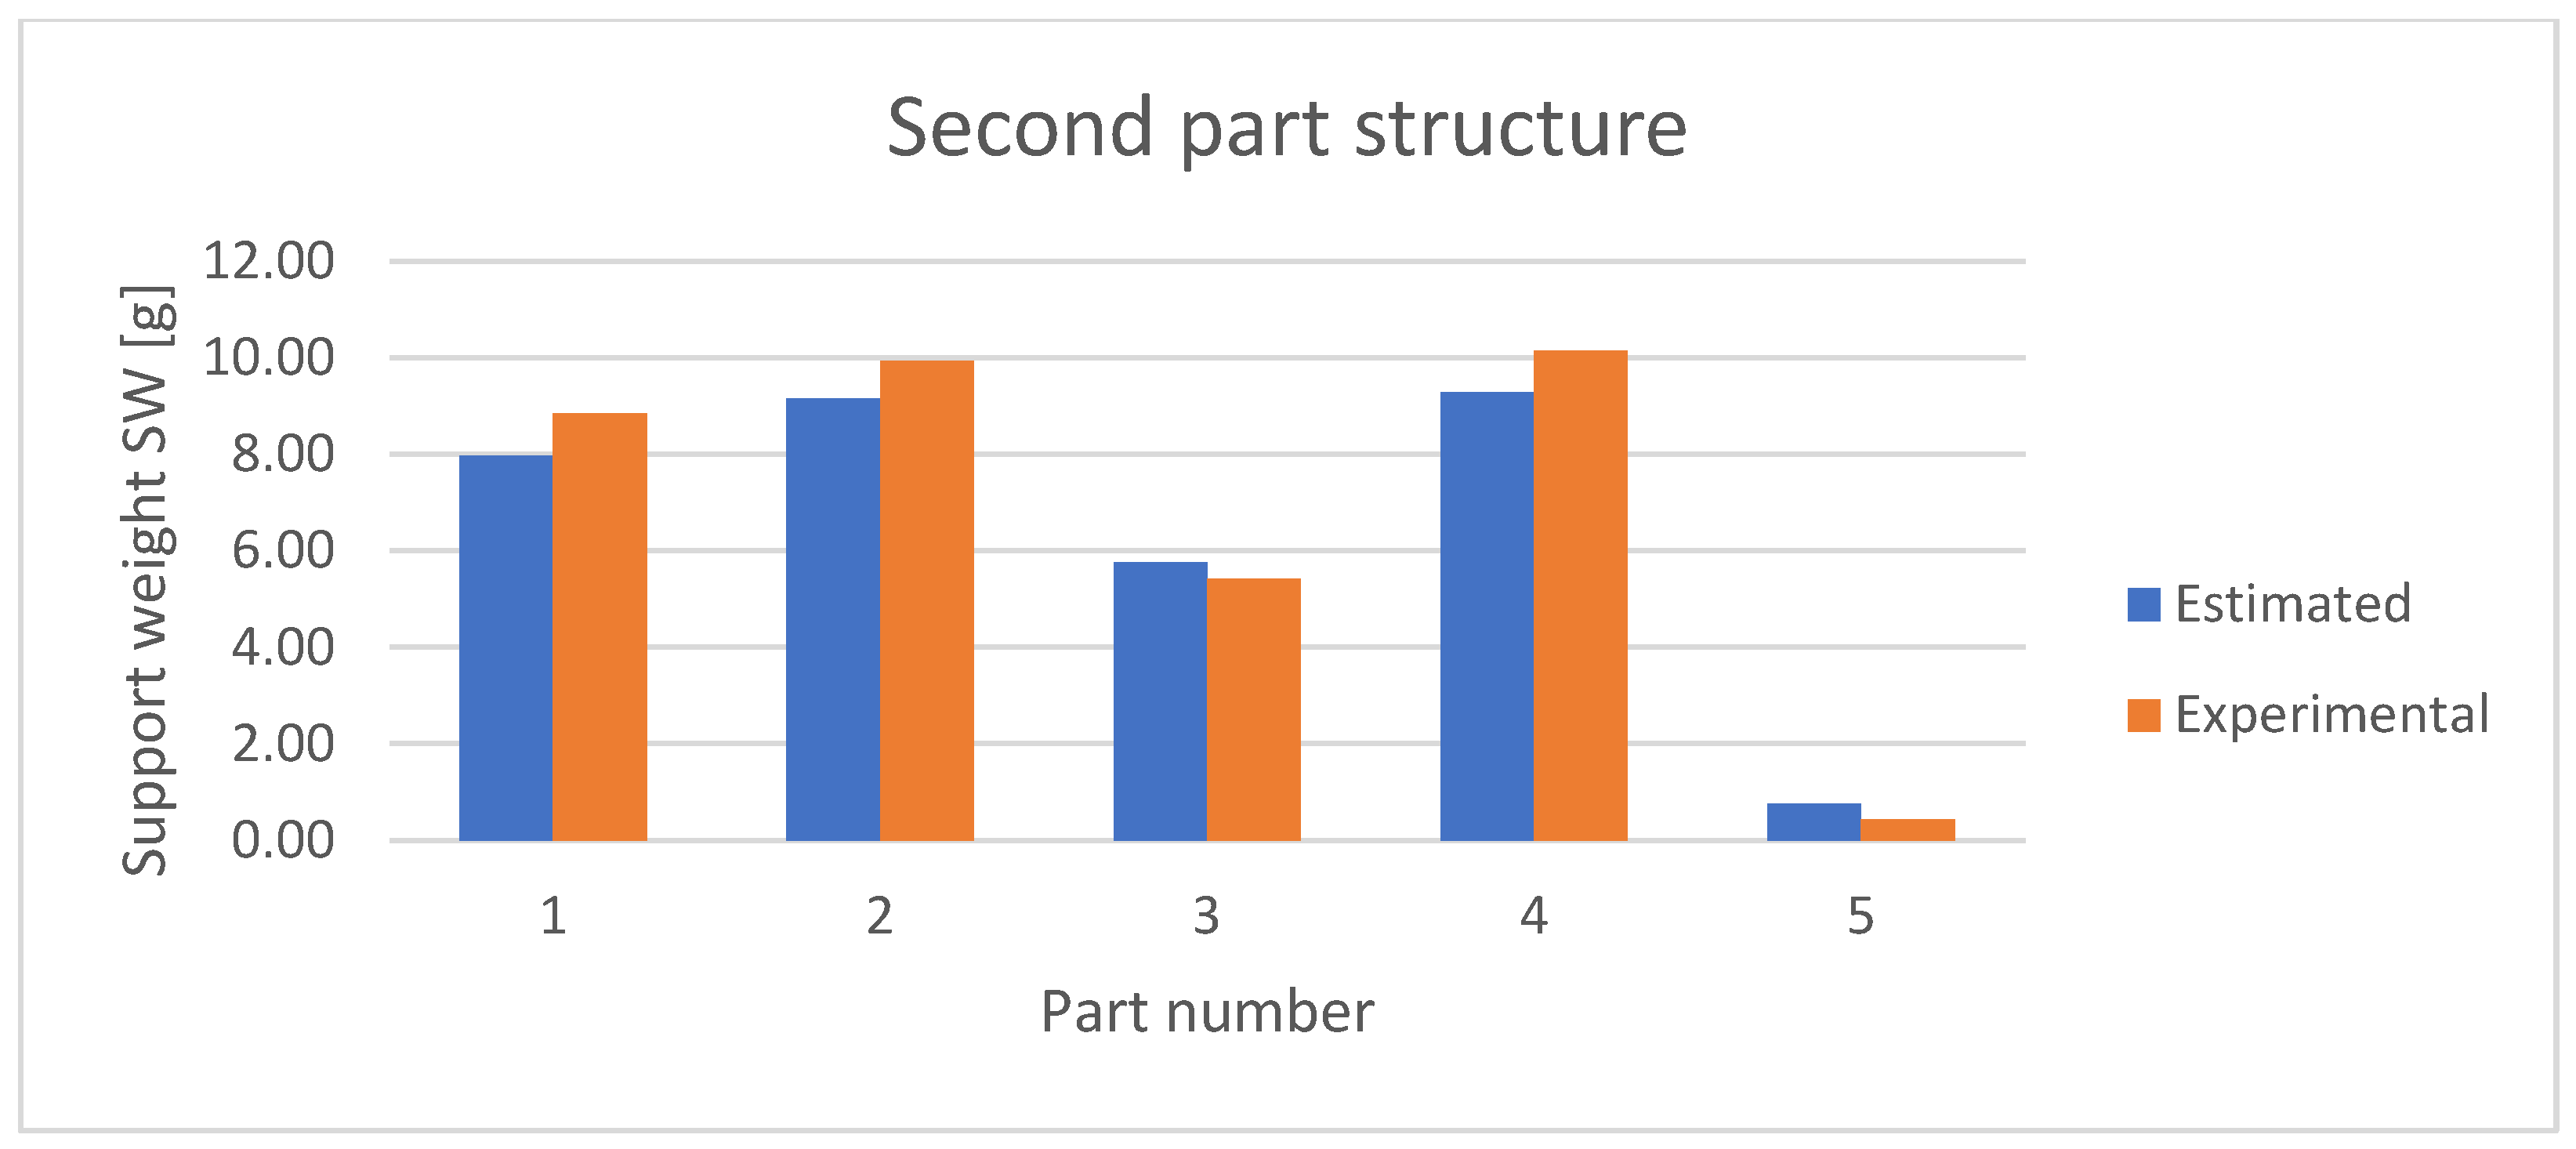
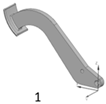
- The support weight is lower when the part is oriented with the smaller surfaces placed in a position that is close to horizontal, and the larger surfaces placed in a position that is close to vertical.
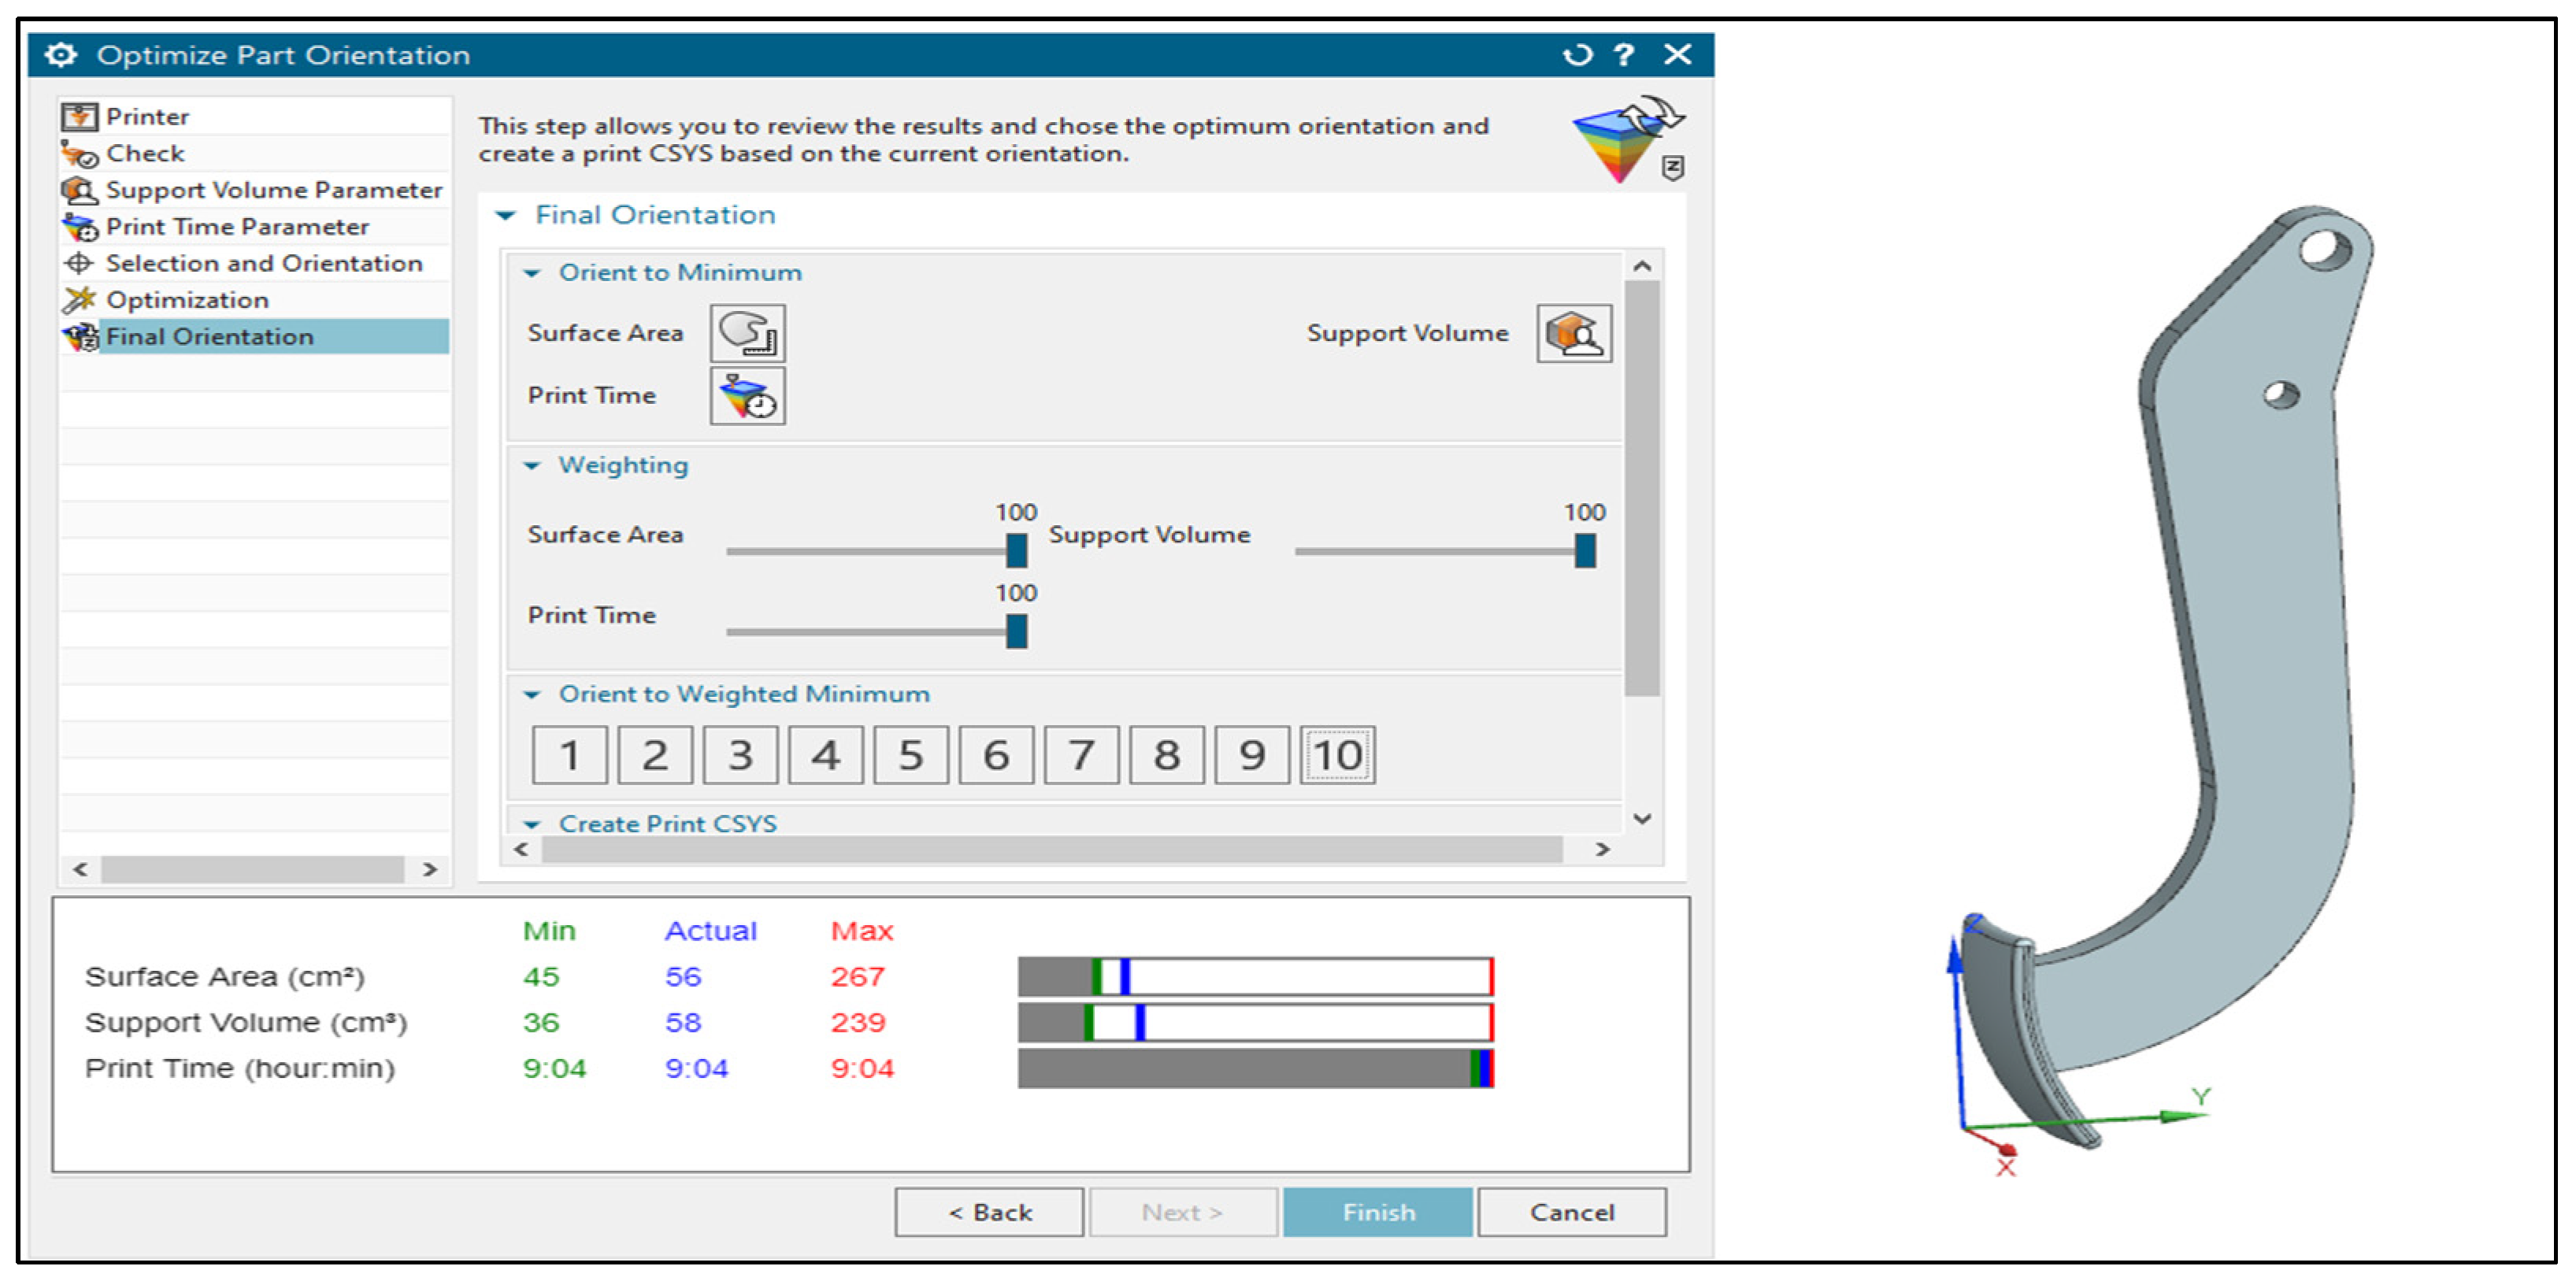
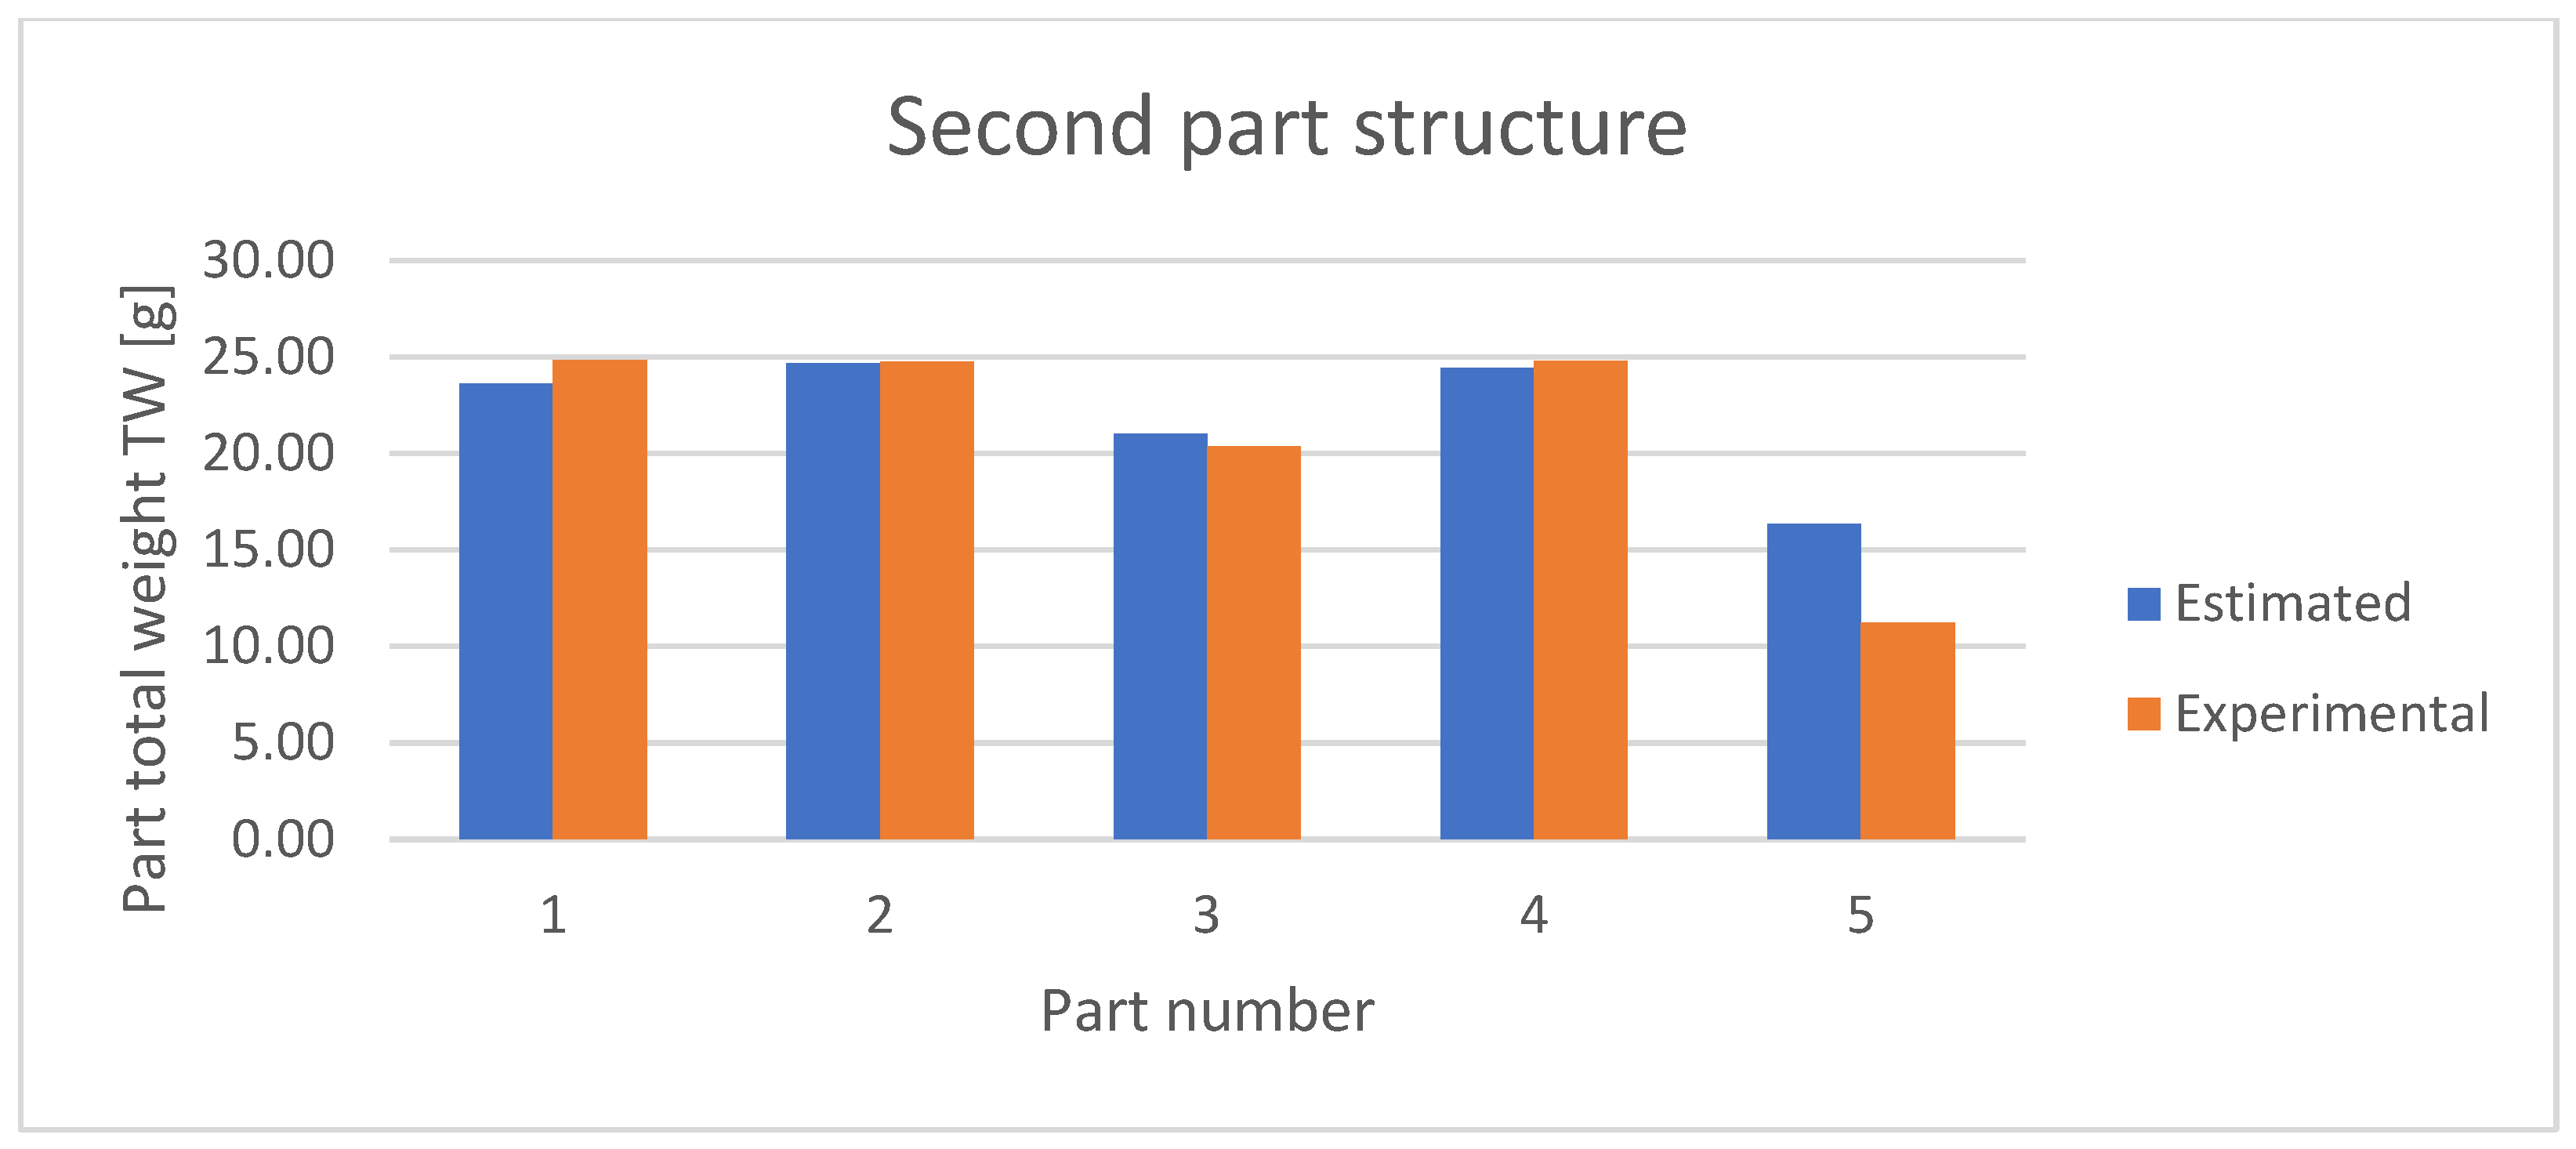
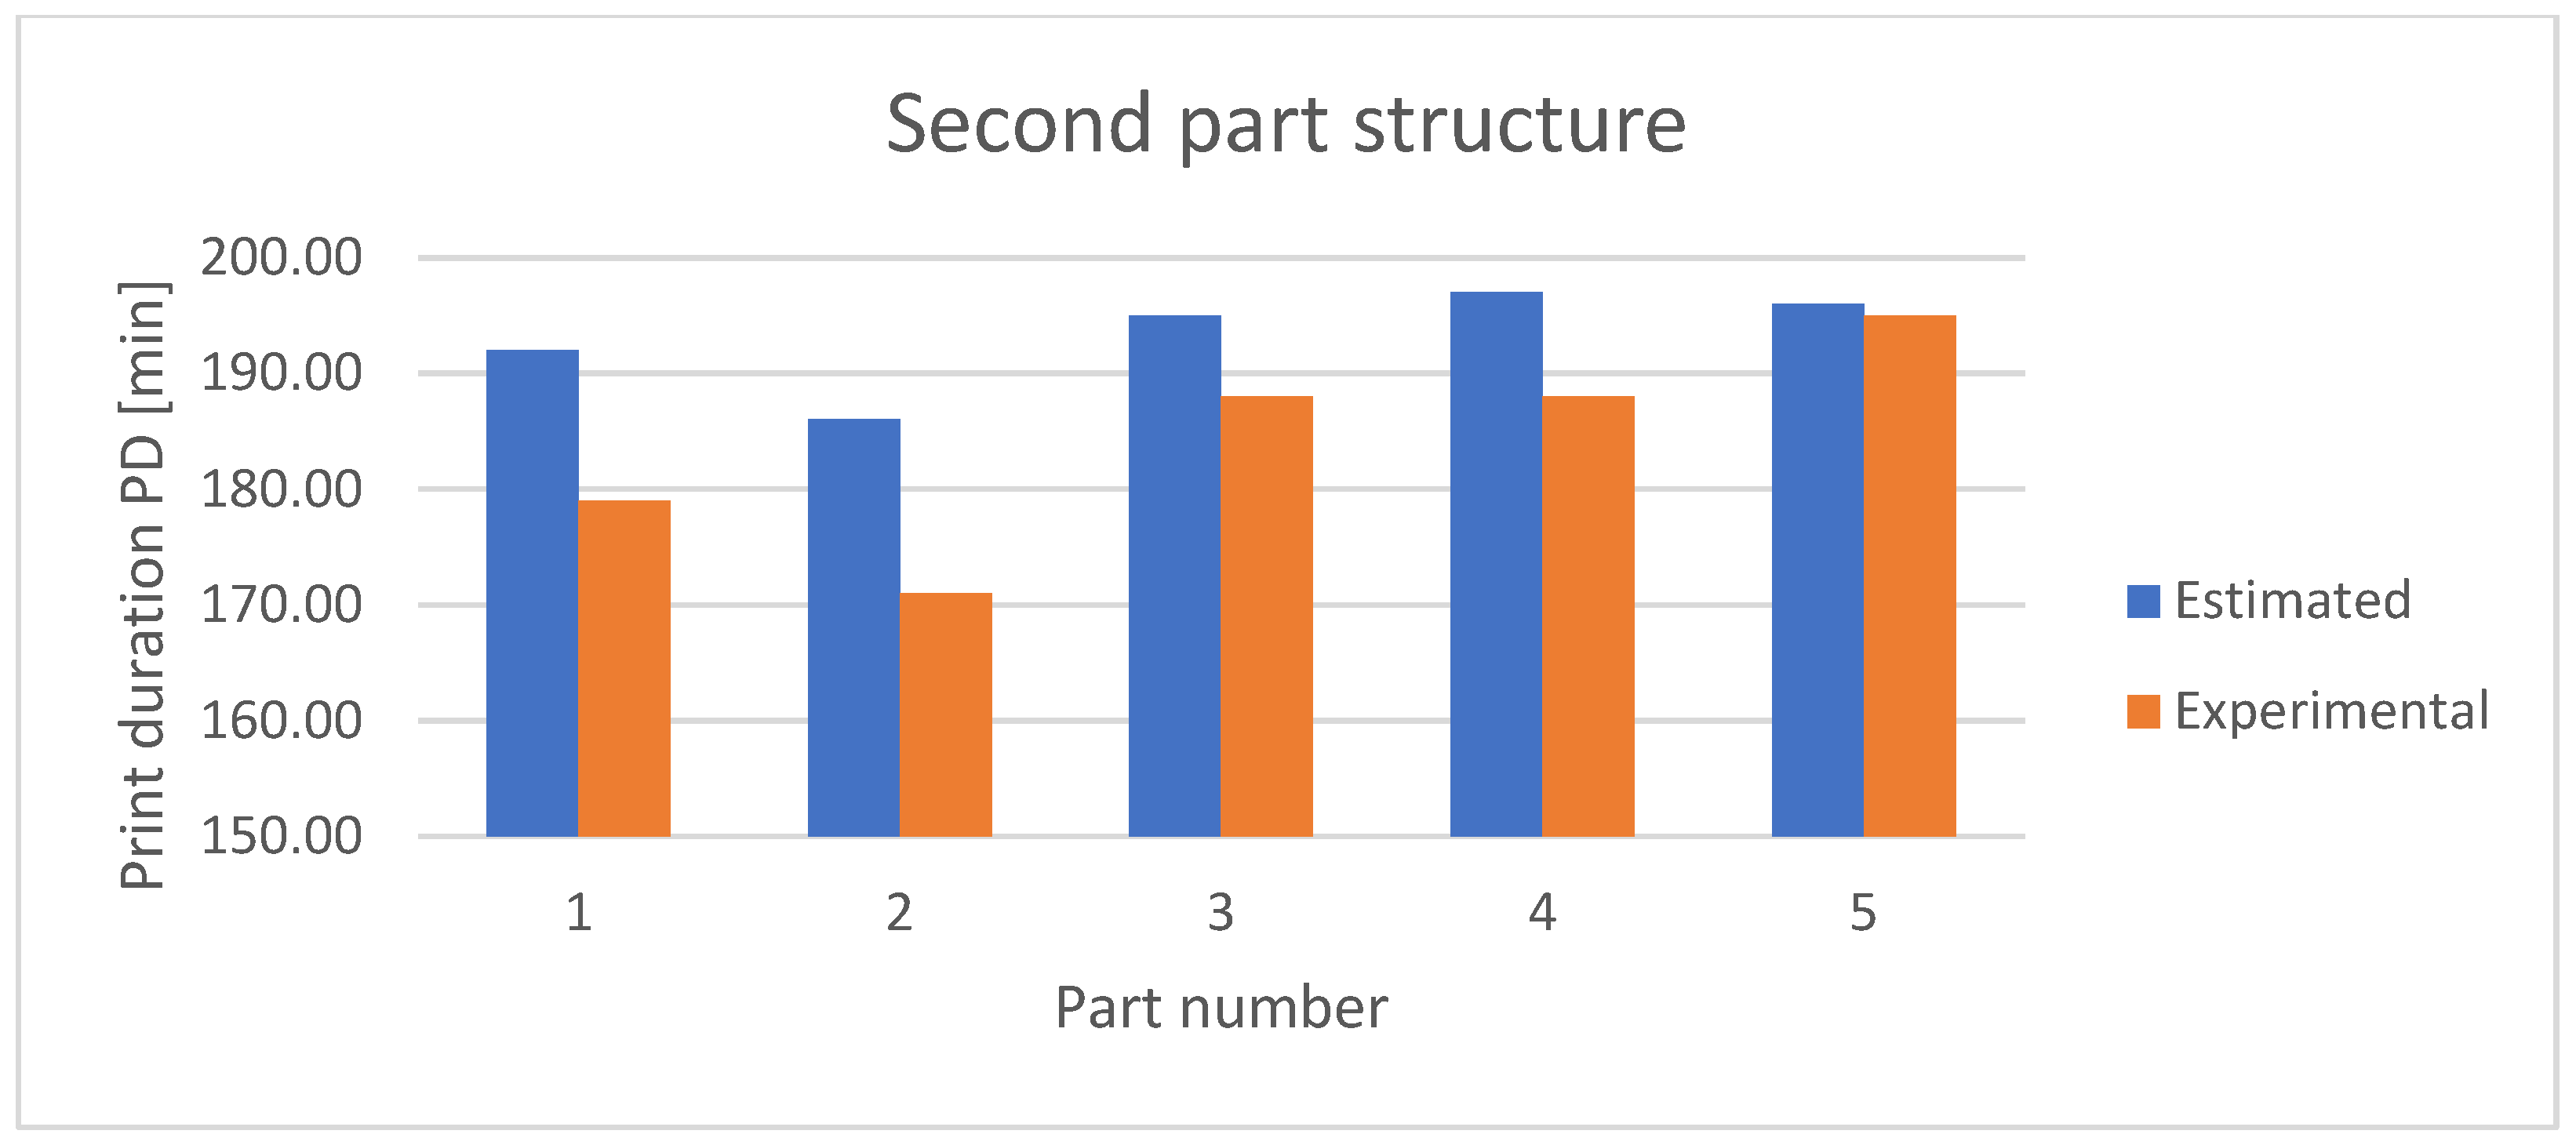
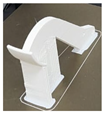
- The fifth part posture, which is the one provided by the Design for Additive Manufacturing module included in the Siemens NX software (version NX2406), provided the best results (lowest values) for all but one of the analyzed parameters—printing time.
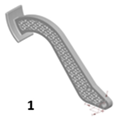
- The arithmetic mean of the SW values is 7.71 for the first structure and 8.58 for the second structure when not including the fifth part posture—experimental data. The arithmetic means for the slicer estimates are 7.35 and 8.04, respectively (also not including the fifth part posture). These values show a greater support weight for the second part structure, but also a lower estimate from the slicer data than the experimental results. The comparative analysis also shows that the largest support requirement was registered for the second part posture. This is the only posture for which an external surface with lattice structure is in direct contact with the supports.
- The arithmetic mean of the TW values is 22.23 for the first structure and 23.69 for the second structure when not including the fifth part posture—experimental data. The arithmetic means for the slicer estimates are 21.97 and 23.44, respectively (also not including the fifth part posture). The values for the part total weight are consistent, especially when taking into account the variations induced by the different support requirements, which is the main factor that influences TW. The lowest TW was observed for the fifth part structure.
- The arithmetic mean of the PD values is 139 for the first structure and 181.5 for the second structure when not including the fifth part posture—experimental data. The arithmetic means for the slicer estimates are 130.5 and 192.5, respectively (also not including the fifth part posture). The second part posture has the lowest print duration, which is correlated to the lowest number of layers. By comparison, the fifth part structure has the highest number of layers and the highest print duration.
- The second part posture has the highest post-processing score. Due to the fact that the supports are in direct contact with a surface having a lattice structure, the complex geometric pattern of the part makes the supports very difficult to remove.
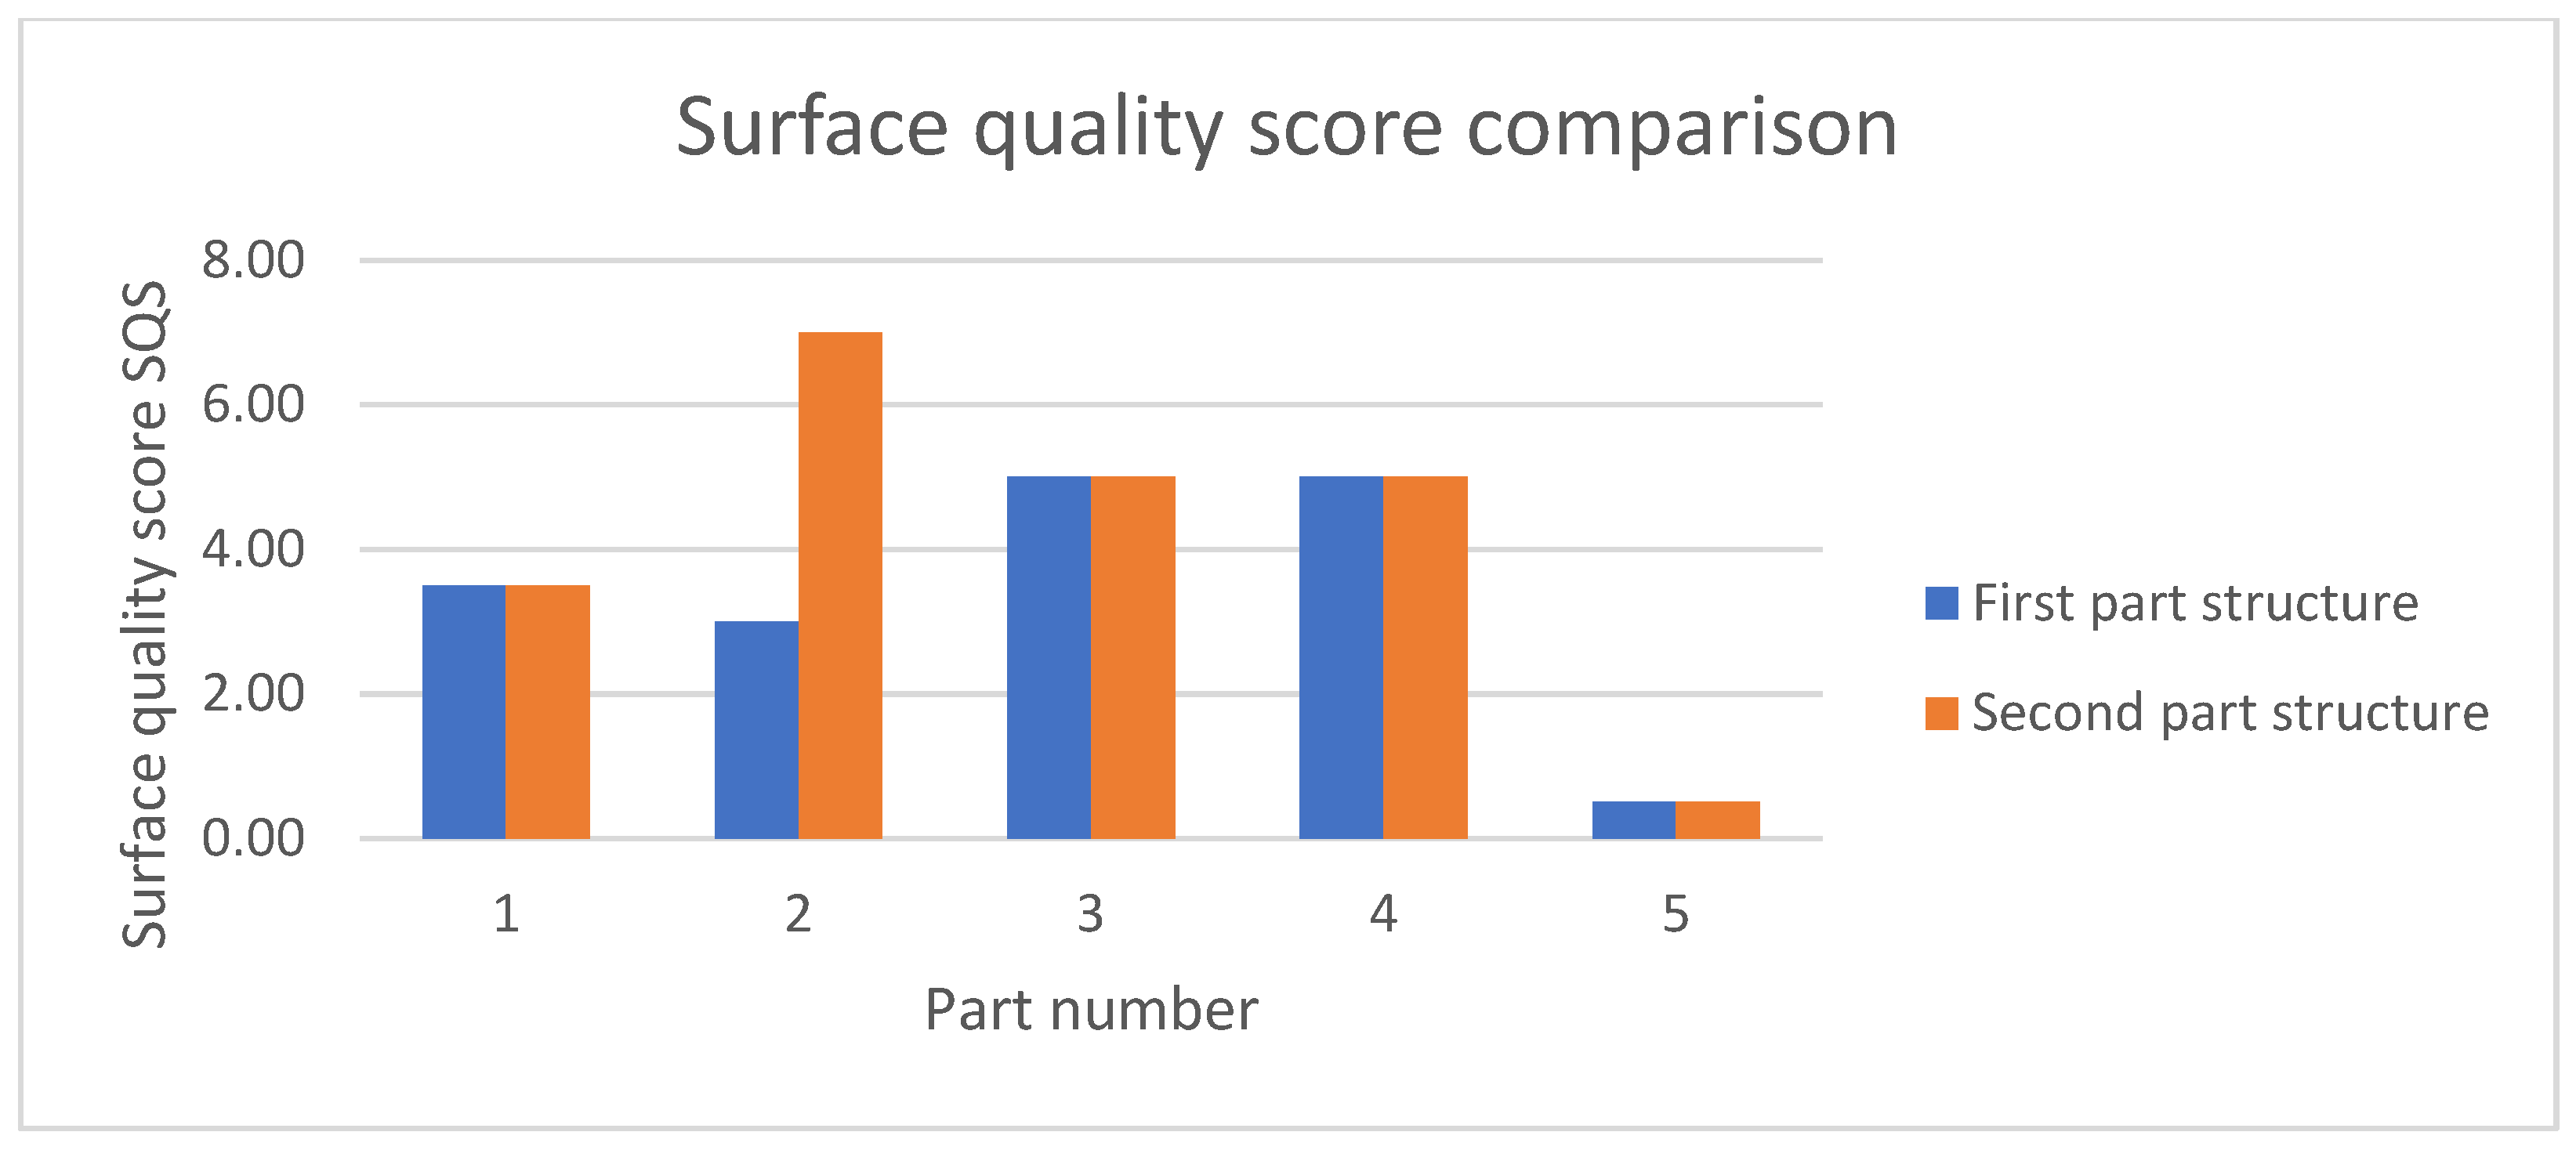
- Also, for the second part, the surface quality score was the highest, mainly for the same reasons described above, as the difficulty of removing the supports affected the quality of the supported surface.
- As a general fact, the surfaces that require support are more likely to have quality issues (since support removal can leave some surplus material attached to the part or it may affect the surface itself). This was noticed on all the printed parts, even for the fifth (optimized) posture. Since the fifth posture required very little support, the PPS and the SQS were much lower than in the other cases.
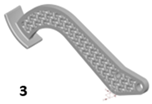
- Stepping issues affecting curved surfaces were noticed on part postures 1, 3, and 4.
- SW was chosen as a reference because it was established as the main optimization factor for the study.
- Also, the values for SW, PPS, and SQS have comparable ranges, falling within the same order of magnitude.
- The arithmetic mean for every parameter category multiplied by the corresponding coefficient must fall within a range of a maximum of 0.5 from the arithmetic mean of SW values (since SW was chosen as the reference).
- Thus, for the SW, TW, and PD parameters, the arithmetic means of all the experimental values for both part structures were determined. The values for the fifth part structure were excluded in each case, as these values greatly differ from the others.
- The arithmetic mean of the SW values was calculated at 7.88. The corresponding coefficient a was assigned the value of 1. The value of 7.88 represented the reference value to which all the other arithmetic means (for the other parameter sets) were compared. Thus, the value of 1 was assigned to coefficient a.
- The coefficients for TW and PD were adjusted such as, when applied to the arithmetic mean of these parameters, the results will be as close to the arithmetic mean of the SW values (with a maximum allowed difference of 0.5).
- The arithmetic mean of the TW values was calculated at 22.96. By applying a coefficient of 0.33, it gives a value of 7.65. The value of 0.33 was assigned to the coefficient b.
- The arithmetic mean of the PD values was calculated as 160.25. By applying a coefficient of 0.05, it gives a value of 7.63. The value of 0.05 was assigned to the coefficient c.
- Thus, the coefficients were assigned the following values: a = 1, b = 0.33, c = 0.05, d = 1, e = 1 (since PPS and SQS already have values comparable with those of SW).
5. Conclusions
Author Contributions
Funding
Institutional Review Board Statement
Informed Consent Statement
Data Availability Statement
Conflicts of Interest
References
- Patel, R.; Desai, C.; Kushwah, S.; Mangrola, M.H. A review article on FDM process parameters in 3D printing for composite materials. Mater. Today 2022, 60, 2162–2166. [Google Scholar] [CrossRef]
- Jandyal, A.; Chaturvedi, I.; Wazir, I.; Raina, A.; Ul Haq, M.I. 3D printing—A review of processes, materials and applications in Industry 4.0. Sustain. Oper. Comput. 2022, 3, 33–42. [Google Scholar] [CrossRef]
- Shahrubudin, N.; Lee, T.C.; Ramlan, R. An Overview on 3D Printing Technology: Technological, Materials, and Applications. Procedia Manuf. 2019, 35, 1286–1296. [Google Scholar] [CrossRef]
- Korium, M.S.; Roozbahani, H.; Alizadeh, M.; Perepelkina, S.; Handroos, H. Direct Metal Laser Sintering of Precious Metals for Jewelry Applications: Process Parameter Selection and Microstructure Analysis. IEEE Access 2021, 9, 126530–126540. [Google Scholar] [CrossRef]
- Ishfaq, K.; Abdullah, M.; Mahmood, M.A. A state-of-the-art direct metal laser sintering of Ti6Al4V and AlSi10Mg alloys: Surface roughness, tensile strength, fatigue strength and microstructure. Opt. Laser Technol. 2021, 143, 107366. [Google Scholar] [CrossRef]
- Syrlybayev, D.; Zharylkassyn, B.; Seisekulova, A.; Akhmetov, M.; Perveen, A.; Talamona, D. Optimisation of Strength Properties of FDM Printed Parts—A Critical Review. Polymers 2021, 13, 1587. [Google Scholar] [CrossRef] [PubMed]
- Ngo, T.D.; Kashani, A.; Imbalzano, G.; Nguyen, K.T.Q.; Hui, D. Additive manufacturing (3D printing): A review of materials, methods, applications and challenges. Compos. Part B Eng. 2018, 143, 172–196. [Google Scholar] [CrossRef]
- Blok, L.G.; Longana, M.L.; Yu, H.; Woods, B.K.S. An investigation into 3D printing of fibre reinforced thermoplastic composites. Addit. Manuf. 2018, 22, 176–186. [Google Scholar] [CrossRef]
- Ryan, J.; Dizon, C.; Espera, A.H.; Chen, Q.; Advincula, R.C. Mechanical characterization of 3D-printed polymers. Addit. Manuf. 2018, 20, 44–67. [Google Scholar] [CrossRef]
- Kuznetsov, V.; Solonin, A.; Tavitov, A.; Urzhumtsev, O.; Vakulik, A. Increasing strength of FFF three-dimensional printed parts by influencing on temperature-related parameters of the process. Rapid Prototyp. J. 2019, 26, 107–121. [Google Scholar] [CrossRef]
- Mallikarjuna, B.; Bhargav, P.; Hiremath, S.; Jayachristiyan, K.G.; Jayanth, N. A review on the melt extrusion-based fused deposition modeling (FDM): Background, materials, process parameters and military applications. Int. J. Interact. Des. Manuf. 2023, 19, 651–665. [Google Scholar] [CrossRef]
- Jayanth, N.; Jaswanthraj, K.; Sandeep, S.; Harish Mallaya, N.; Raghul Siddharth, S. Effect of heat treatment on mechanical properties of 3D printed PLA. J. Mech. Behav. Biomed. Mater. 2021, 123, 104764. [Google Scholar] [CrossRef]
- Baechle-Clayton, M.; Loos, E.; Taheri, M.; Taheri, H. Failures and Flaws in Fused Deposition Modeling (FDM) Additively Manufactured Polymers and Composites. J. Compos. Sci. 2022, 6, 202. [Google Scholar] [CrossRef]
- Gibson, I.; Rosen, D.; Stucker, B.; Khorasani, M. Additive Manufacturing Technologies; Springer: Cham, Switzerland, 2020. [Google Scholar]
- Tofail, S.A.M.; Koumoulos, E.P.; Bandyopadhyay, A.; Bose, S.; O’Donoghue, L.; Charitidis, C. Additive manufacturing: Scientific and technological challenges, market uptake and opportunities. Mater. Today 2018, 1, 1–16. [Google Scholar] [CrossRef]
- Aloyaydi, B.; Sivasankaran, S.; Mustafa, A. Investigation of infill-patterns on mechanical response of 3D printed poly-lactic-acid. Polym. Test. 2020, 87, 106557. [Google Scholar] [CrossRef]
- Bakır, A.A.; Atik, R.; Özerinç, S. Effect of fused deposition modeling process parameters on the mechanical properties of recycled polyethylene terephthalate parts. J. Appl. Polym. Sci. 2020, 138, 49709. [Google Scholar] [CrossRef]
- Tang, C.; Liu, J.; Yang, Y.; Liu, Y.; Jiang, S.; Hao, W. Effect of process parameters on mechanical properties of 3D printed PLA lattice structures. Compos. Part C Open Access 2020, 3, 100076. [Google Scholar] [CrossRef]
- Jatti, V.S.; Sapre, M.S.; Jatti, A.V.; Khedkar, N.K.; Jatti, V.S. Mechanical Properties of 3D-Printed Components Using Fused Deposition Modeling: Optimization Using the Desirability Approach and Machine Learning Regressor. Appl. Syst. Innov. 2022, 5, 112. [Google Scholar] [CrossRef]
- Kantaros, A.; Piromalis, D. Employing a Low-Cost Desktop 3D Printer: Challenges, and How to Overcome Them by Tuning Key Process Parameters. Int. J. Mech. Appl. 2021, 10, 11–19. [Google Scholar] [CrossRef]
- Gao, G.; Xu, F.; Xu, J.; Tang, G.; Liu, Z. A Survey of the Influence of Process Parameters on Mechanical Properties of Fused Deposition Modeling Parts. Micromachines 2022, 13, 553. [Google Scholar] [CrossRef] [PubMed]
- Giri, J.; Chiwande, A.; Gupta, Y.; Mahatme, C.; Giri, P. Effect of process parameters on mechanical properties of 3d printed samples using FDM process. Mater. Today Proc. 2021, 47, 5856–5861. [Google Scholar] [CrossRef]
- Raju, M.; Gupta, M.K.; Bhanot, N.; Sharma, V.S. A hybrid PSO-BFO evolutionary algorithm for optimization of fused deposition modelling process parameters. J. Intell. Manuf. 2019, 30, 2743–2758. [Google Scholar] [CrossRef]
- Górski, F.; Wichniarek, R.; Kuczko, W.; Andrzejewski, J. Experimental determination of critical orientation of abs parts manufactured using fused deposition modelling technology. J. Mach. Eng. 2015, 15, 121–132. [Google Scholar]
- Hernandez, R.; Slaughter, D.; Whaley, D.; Tate, J.; Asiabanpour, B. Analyzing the tensile, compressive, and flexural properties of 3d printed abs p430 plastic based on printing orientation using fused deposition modeling. In Proceedings of the 27th Annual International Solid Freeform Fabrication Symposium, Austin, TX, USA, 12–14 August 2019; Available online: https://hdl.handle.net/2152/89645 (accessed on 23 April 2024).
- Wang, X. Natural frequency optimization of 3D printed variable–density honeycomb structure via a homogenization–based approach. Addit. Manuf. 2017, 20, 189–198. [Google Scholar] [CrossRef]
- Nguyen, C.H.P.; Kim, Y.; Choi, Y. Design for Additive Manufacturing of Functionally Graded Lattice Structures: A Design Method with Process Induced Anisotropy Consideration. Int. J. Precis. Eng. Manuf.-Green Technol. 2021, 8, 29–45. [Google Scholar] [CrossRef]
- Gibson, L.J.; Ashby, M.F. Cellular Solids: Structure and Properties; Cambridge Solid State Science Series; Cambridge University Press: Cambridge, UK, 1997. [Google Scholar]
- McGregor, D.J.; Tawfick, S.; King, W.P. Mechanical properties of hexagonal lattice structures fabricated using continuous liquid interface production additive manufacturing. Addit. Manuf. 2019, 25, 10–18. [Google Scholar] [CrossRef]
- Zisopol, D.G.; Tănase, M.; Portoacă, A.I. Innovative Strategies for Technical-Economical Optimization of FDM Production. Polymers 2023, 15, 3787. [Google Scholar] [CrossRef] [PubMed]
- Jackson, B.; Fouladi, K.; Eslami, B. Multi-Parameter Optimization of 3D Printing Condition for Enhanced Quality and Strength. Polymers 2022, 14, 1586. [Google Scholar] [CrossRef]
- El youbi El idrissi, M.A.; Laaouina, L.; Jeghal, A.; Tairi, H.; Zaki, M. Modeling of Energy Consumption and Print Time for FDM 3D Printing Using Multilayer Perceptron Network. J. Manuf. Mater. Process. 2023, 7, 128. [Google Scholar] [CrossRef]
- 3DiM Benchmark. Available online: https://www.kaggle.com/dataset/c22f9996866156344599fd5baf48aaa8ac8ccce9a849b050ceeea36ba4e9c8f9 (accessed on 25 June 2022).
- Yang, Y.; Yang, B.; Chang, Z.; Duan, J.; Chen, W. Research Status of and Prospects for 3D Printing for Continuous Fiber-Reinforced Thermoplastic Composites. Polymers 2023, 15, 3653. [Google Scholar] [CrossRef]
- Li, N.; Guido, L.; John, J.; Morais Manuel, V.C.; Frank, H. Microwave additive manufacturing of continuous carbon fibers reinforced thermoplastic composites: Characterization, analysis, and properties. Addit. Manuf. 2021, 44, 102035. [Google Scholar] [CrossRef]
- Liu, H.; Lin, D.; Yang, L.; Wu, S.; Ren, Y.; Xiong, R.; Leng, S.; Seop Kim, H.; Yan, C.; Shi, Y. Enhanced mechanical responses and fatigue behaviors of triply periodic minimal surface lattice metamaterials by twin-oriented lattice design. Int. J. Fatigue 2025, 201, 109172. [Google Scholar] [CrossRef]
- Numan, K.; Aniello, R. A systematic review of design for additive manufacturing of aerospace lattice structures: Current trends and future directions. Prog. Aerosp. Sci. 2024, 149, 101021. [Google Scholar] [CrossRef]
- Min, K.-E.; Jang, J.-W.; Shin, J.; Kim, C.; Yi, S. Development of Prediction Method for Dimensional Stability of 3D-Printed Objects. Appl. Sci. 2023, 13, 11027. [Google Scholar] [CrossRef]
- Bassoli, E.; Defanti, S.; Tognoli, E.; Vincenzi, N.; Degli Esposti, L. Design for Additive Manufacturing and for Machining in the Automotive Field. Appl. Sci. 2021, 11, 7559. [Google Scholar] [CrossRef]
- Safali, S.; Berk, T.; Makelov, B.; Acar, M.A.; Gueorguiev, B.; Pape, H.-C. The Possibilities of Personalized 3D Printed Implants—A Case Series Study. Medicina 2023, 59, 249. [Google Scholar] [CrossRef]
- Cavallo, L.; Marcianò, A.; Cicciù, M.; Oteri, G. 3D Printing beyond Dentistry during COVID 19 Epidemic: A Technical Note for Producing Connectors to Breathing Devices. Prosthesis 2020, 2, 46–52. [Google Scholar] [CrossRef]
- Simion, I.; Arion, A. Dimensioning rules for 3D printed parts using additive technologies (FDM). U.P.B. Sci. Bull. Ser. D 2016, 78, 79–92. [Google Scholar]
- PolyTerraTM PLA Technical Data Sheet. Available online: https://c.cdnmp.net/490505258/custom/prod/1_fisa_tehnica_2517.pdf?rv=1695896359 (accessed on 5 January 2024).
- Talanga, A.; Hadar, A.; Dragoi, M.V.; Nisipeanu, I.; Ali, H.A.; Suciu, C. YOLO-v8 in capturing imperfections generated by changing 3D printer parameters. U.P.B. Sci. Bull. Ser. C 2024, 86, 253–266. [Google Scholar]




 | Support weight SW [g] | 5.84 |
| Total weight TW [g] | 21.12 | |
| Print duration PD [min] | 146 | |
| Post-processing score PPS | - | |
| Surface quality score SQS | - | |
 | Support weight SW [g] | 9.58 |
| Total weight TW [g] | 22.14 | |
| Print duration PD [min] | 96 | |
| Post-processing score PPS | - | |
| Surface quality score SQS | - | |
 | Support weight SW [g] | 4.77 |
| Total weight TW [g] | 20.02 | |
| Print duration PD [min] | 135 | |
| Post-processing score PPS | - | |
| Surface quality score SQS | - | |
 | Support weight SW [g] | 9.2 |
| Total weight TW [g] | 24.6 | |
| Print duration PD [min] | 145 | |
| Post-processing score PPS | - | |
| Surface quality score SQS | - | |
 | Support weight SW [g] | 0.4 |
| Total weight TW [g] | 16.27 | |
| Print duration PD [min] | 171 | |
| Post-processing score PPS | - | |
| Surface quality score SQS | - |
 | Support weight SW [g] | 7.96 |
| Total weight TW [g] | 23.61 | |
| Print duration PD [min] | 192 | |
| Post-processing score PPS | - | |
| Surface quality score SQS | - | |
 | Support weight SW [g] | 9.16 |
| Total weight TW [g] | 24.68 | |
| Print duration PD [min] | 186 | |
| Post-processing score PPS | - | |
| Surface quality score SQS | - | |
 | Support weight SW [g] | 5.76 |
| Total weight TW [g] | 21.01 | |
| Print duration PD [min] | 195 | |
| Post-processing score PPS | - | |
| Surface quality score SQS | - | |
 | Support weight SW [g] | 9.28 |
| Total weight TW [g] | 24.44 | |
| Print duration PD [min] | 197 | |
| Post-processing score PPS | - | |
| Surface quality score SQS | - | |
 | Support weight SW [g] | 0.76 |
| Total weight TW [g] | 16.36 | |
| Print duration PD [min] | 196 | |
| Post-processing score PPS | - | |
| Surface quality score SQS | - |
 | Support weight SW [g] | 6.29 |
| Total weight TW [g] | 22.14 | |
| Print duration PD [min] | 135 | |
| Post-processing score PPS | 4 | |
| Surface quality score SQS | 3.5 | |
 | Support weight SW [g] | 9.91 |
| Total weight TW [g] | 22.09 | |
| Print duration PD [min] | 107 | |
| Post-processing score PPS | 5 | |
| Surface quality score SQS | 3 | |
 | Support weight SW [g] | 3.78 |
| Total weight TW [g] | 20 | |
| Print duration PD [min] | 147 | |
| Post-processing score PPS | 6.5 | |
| Surface quality score SQS | 5 | |
 | Support weight SW [g] | 8.69 |
| Total weight TW [g] | 24.68 | |
| Print duration PD [min] | 167 | |
| Post-processing score PPS | 8 | |
| Surface quality score SQS | 5 | |
 | Support weight SW [g] | 0.54 |
| Total weight TW [g] | 16.2 | |
| Print duration PD [min] | 185 | |
| Post-processing score PPS | 1 | |
| Surface quality score SQS | 0.5 |
 | Support weight SW [g] | 8.85 |
| Total weight TW [g] | 24.83 | |
| Print duration PD [min] | 179 | |
| Post-processing score PPS | 4 | |
| Surface quality score SQS | 3.5 | |
 | Support weight SW [g] | 9.94 |
| Total weight TW [g] | 24.77 | |
| Print duration PD [min] | 171 | |
| Post-processing score PPS | 13 | |
| Surface quality score SQS | 7 | |
 | Support weight SW [g] | 5.41 |
| Total weight TW [g] | 20.36 | |
| Print duration PD [min] | 188 | |
| Post-processing score PPS | 6.5 | |
| Surface quality score SQS | 5 | |
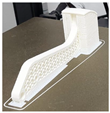 | Support weight SW [g] | 10.15 |
| Total weight TW [g] | 24.8 | |
| Print duration PD [min] | 188 | |
| Post-processing score PPS | 8 | |
| Surface quality score SQS | 5 | |
 | Support weight SW [g] | 0.43 |
| Total weight TW [g] | 11.23 | |
| Print duration PD [min] | 195 | |
| Post-processing score PPS | 1 | |
| Surface quality score SQS | 0.5 |
| First part structure | SW | TW | PD | PPS | SQS | Score |
| 1 | 6.29 | 22.14 | 135 | 4 | 3.5 | 27.60 |
| 2 | 9.91 | 22.09 | 107 | 5 | 3 | 30.37 |
| 3 | 3.78 | 20 | 147 | 6.5 | 5 | 28.95 |
| 4 | 8.69 | 24.68 | 167 | 8 | 5 | 37.87 |
| 5 | 0.54 | 16.2 | 185 | 1 | 0.5 | 16.25 |
| Second part structure | ||||||
| 1 | 8.85 | 24.83 | 179 | 4 | 3.5 | 33.15 |
| 2 | 9.94 | 24.77 | 171 | 13 | 7 | 46.34 |
| 3 | 5.41 | 20.36 | 188 | 6.5 | 5 | 32.65 |
| 4 | 10.15 | 24.8 | 188 | 8 | 5 | 40.37 |
| 5 | 0.43 | 11.23 | 195 | 1 | 0.5 | 14.96 |
| Arithmetic mean | 7.88 | 22.96 | 160.25 | |||
| Adjusted arithmetic mean | 7.88 | 7.65 | 7.63 | |||
| a | b | c | d | e | ||
| Coefficients value | 1.00 | 0.33 | 0.05 | 1.00 | 1.00 |
Disclaimer/Publisher’s Note: The statements, opinions and data contained in all publications are solely those of the individual author(s) and contributor(s) and not of MDPI and/or the editor(s). MDPI and/or the editor(s) disclaim responsibility for any injury to people or property resulting from any ideas, methods, instructions or products referred to in the content. |
© 2025 by the authors. Licensee MDPI, Basel, Switzerland. This article is an open access article distributed under the terms and conditions of the Creative Commons Attribution (CC BY) license (https://creativecommons.org/licenses/by/4.0/).
Share and Cite
Ivan, A.M.; Cristoiu, C.A.; Parpala, L.F. CAD Analysis of 3D Printed Parts for Material Extrusion—Pre-Processing Optimization Method. Technologies 2025, 13, 398. https://doi.org/10.3390/technologies13090398
Ivan AM, Cristoiu CA, Parpala LF. CAD Analysis of 3D Printed Parts for Material Extrusion—Pre-Processing Optimization Method. Technologies. 2025; 13(9):398. https://doi.org/10.3390/technologies13090398
Chicago/Turabian StyleIvan, Andrei Mario, Cozmin Adrian Cristoiu, and Lidia Florentina Parpala. 2025. "CAD Analysis of 3D Printed Parts for Material Extrusion—Pre-Processing Optimization Method" Technologies 13, no. 9: 398. https://doi.org/10.3390/technologies13090398
APA StyleIvan, A. M., Cristoiu, C. A., & Parpala, L. F. (2025). CAD Analysis of 3D Printed Parts for Material Extrusion—Pre-Processing Optimization Method. Technologies, 13(9), 398. https://doi.org/10.3390/technologies13090398


