Abstract
This paper presents the design, optimization, and performance evaluation of a Satellite-Based Augmentation System (SBAS) ground segment tailored to Colombia’s air navigation infrastructure, with emphasis on ionospheric anomalies in equatorial latitudes. The configuration comprises six Reference Stations (RIMS), strategically sited via geometric dilution of precision (GDOP) minimization and airspace demand models from ADS-B data. A simulation suite—integrating STK®, Radio Mobile™, and Stanford-ESA certified monitors—quantifies service volume, link margins, and protection level compliance. Ionospheric threat characterization uses regional scintillation datasets (σln ≈ 0.36, ROTI95 ≈ 85 mm/km), informing GIVE inflation and dual-frequency pseudorange integrity validation. Simulations confirm the system sustains ≥ 99.8% APV-I availability over the CAR/SAM FIR, with Horizontal and Vertical Protection Levels (HPL/VPL) bounded below 28 m and 46 m. Uplink integrity and GEO broadcast continuity are modelled under worst-case masking and multipath, confirming ICAO Annex 10 SARPs compliance. The architecture achieves a high performance-to-cost ratio, enabling nationwide SBAS coverage with a 65% cost reduction versus legacy navaids. The system is forward-compatible with dual-frequency multi-constellation SBAS (DFMC), supporting future APV-II scalability. These results position Colombia as a regional node for GNSS augmentation, fostering safety, efficiency, and procedural harmonization.
1. Introduction
The Colombian air-transport market illustrates the operational pressure behind the global transition toward performance-based navigation [1,2,3,4]. A compiled arrival log for Bogotá–El Dorado (SKBO) reports 127,886 arrivals between January and September 2024, corresponding to 14,210 ± 370 movements per month with limited seasonal variability [5]. Although domestic flights account for approximately 69% of operations, a persistent baseline of 4.1–4.6 k international arrivals per month highlights the need for seamless regional and cross-border navigation performance within the CAR/SAM FIR [5,6,7,8,9].
Spatially, traffic demand is strongly concentrated along a limited number of high-density corridors. As shown in Figure 1, three major feeders—Rionegro (SKRG), Cali (SKCL), and Cartagena (SKCG)—account for a substantial fraction of inbound flows to SKBO. Although the SKCG–SKBO corridor is relevant in terms of traffic volume, its geometry is largely redundant with the SKRG and SKCL axes from an SBAS integrity and GDOP perspective [10,11,12]. Therefore, the design optimization focused on the SKRG–SKBO and SKCL–SKBO corridors, which represent the worst-case geometry and ionospheric stress conditions for terminal operations [13]. These corridors also correspond to the most geometry-critical terminal and approach phases and are subject to strong equatorial ionospheric gradients [4]. This concentration of demand motivates prioritizing the SKRG–SKBO and SKCL–SKBO axes in the SBAS ground-segment design, such that RIMS placement is driven not only by geometric dilution of precision (GDOP) considerations but also by the need to ensure robust integrity monitoring and protection-level performance in the busiest airspace sectors, even under disturbed ionospheric conditions [1,3].
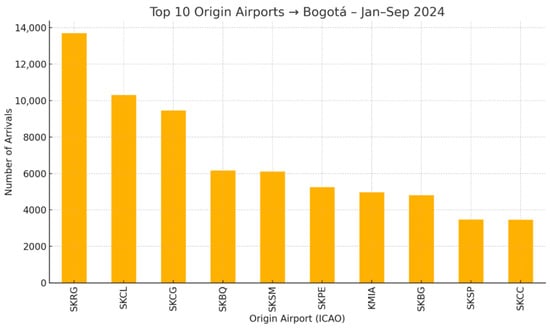
Figure 1.
Main Origin Airports Contributing to Arrivals at Bogotá (SKBO), January–September 2024.
Accordingly, the proposed architecture is dimensioned to sustain at least 99.5% availability during peak operational demand, in line with the Aeronáutica Civil’s service continuity objectives defined in the Plan de Navegación Aérea para Colombia [5].
2. GNSS Integrity, SBAS Architectures, and Equatorial Ionospheric Constraints
Standalone Global Navigation Satellite Systems (GNSSs) do not meet the integrity, continuity, and availability requirements for safety-of-life aviation, particularly in low-latitude regions where ionospheric disturbances dominate positioning errors [14,15,16,17,18,19]. SBAS mitigates these limitations through ground-based monitoring, correction, and integrity bounding broadcast via GEO satellites in accordance with ICAO Annex 10, enabling operations such as APV-I under stressed conditions [20,21,22,23]. In equatorial regions, including Colombia, the Equatorial Ionisation Anomaly and post-sunset plasma instabilities produce rapid TEC gradients and scintillation that challenge smooth ionospheric models and increase under-bounding risk, motivating denser RIMS networks and enhanced threat models [15,24,25,26,27,28]. These threats are commonly characterized using ROT/ROTI metrics and handled operationally through conservative GIVE inflation and masking strategies [29,30,31,32], with equatorial regions widely recognized as worst-case environments for SBAS [33,34,35,36,37]. Observations from South America and Southeast Asia confirm frequent post-sunset disturbances and performance degradation [38,39,40], while systems such as GAGAN and SDCM illustrate the benefits of tailored threat models and multi-constellation augmentation [41,42,43,44,45]. SBAS performance is assessed via HPL/VPL against ICAO alert limits and integrity, availability, and continuity requirements [16,22,44,46,47], and ongoing DFMC developments aim to extend capability toward CAT-II/III [48]. In Colombia, key gaps remain in localized threat modelling, national RIMS infrastructure, and system-level design trades, which this work addresses [49,50].
3. SBAS Ground Segment Architecture and System Design
The ICAO Global Air Navigation Plan (2016–2030) calls for a shift to satellite-based navigation, yet Colombia still relies heavily on ground aids, leading to high maintenance costs and uneven coverage. With rising traffic, airspace congestion and potential saturation by 2030 make modernization essential [50].
3.1. Airspace Demand and Route Prioritisation
El Dorado International Airport is Colombia’s main air traffic hub and one of the busiest in Latin America [51], with national traffic growing by ~186% between 2013 and 2024 [52]. Traffic is highly concentrated, with over 65% of movements occurring on a few trunk routes, notably Bogotá–Medellín, Bogotá–Cartagena, and Bogotá–Cali [53]. These high-density corridors dominate SBAS ground-segment siting and performance requirements and, due to pronounced peak periods, impose stringent availability and continuity constraints, especially in terminal and approach phases [53,54].
Two key design requirements follow. First, redundant RIMS coverage in central and northern Colombia is needed to maintain favourable geometry during approach phases, ensuring compliance with VAL constraints through a triangulated layout around SKBO (e.g., Cali, Bucaramanga, and Carepa) and improved monitoring of equatorial ionospheric gradients [50]. Second, link-budget robustness must be ensured under adverse conditions, as seasonal convection in the Llanos and Andes requires conservative fade margins and resilient modulation/coding to preserve continuity during peak traffic and scintillation-prone periods [50].
3.2. Evaluation of Ionospheric Conditions
The SBAS ground-segment design is driven by the equatorial ionospheric constraints described in Section 2, which are characterized by strong post-sunset scintillation and fast TEC gradients over Colombia. Accordingly, the analysis in this section focuses on quantifying these conditions and assessing their impact on geometry, integrity, and continuity margins, rather than reintroducing the underlying physical mechanisms.
3.3. Proposed Distribution of RIMSs
To meet ICAO PBN requirements in Colombian airspace, a six-RIMS network is proposed to optimize GDOP, monitor ionospheric gradients, and ensure continuous SBAS coverage over the CAR/SAM FIR. The design follows international siting guidelines recommending inter-station spacing of ≥500 km, with denser placement near complex terrain and major terminals, as adopted in equatorial systems such as GAGAN [55]. A weighted multi-criteria objective function combining area-averaged GDOP and normalized traffic coverage was used to rank candidate layouts (four to eight RIMSs), prioritizing geometric robustness while accounting for demand along the busiest corridors (SKRG–SKBO and SKCL–SKBO) [41,52,54,55]. Under ICAO APV-I availability and continuity constraints, the six-RIMS configuration emerged as the minimum network achieving nationwide coverage and adequate ionospheric observability without the diminishing returns of denser deployments [55].
The selection of RIMS station sites was guided by factors such as air traffic concentration, geographic coverage, and ionospheric monitoring needs in equatorial regions. This approach reflects international best practices and adapts them to Colombia’s FIR characteristics. Table 1 presents the six proposed locations along with their respective strategic functions in supporting SBAS performance and integrity, while Figure 2 displays the RIMS range.

Table 1.
Proposed RIMS Station Locations in Colombia.
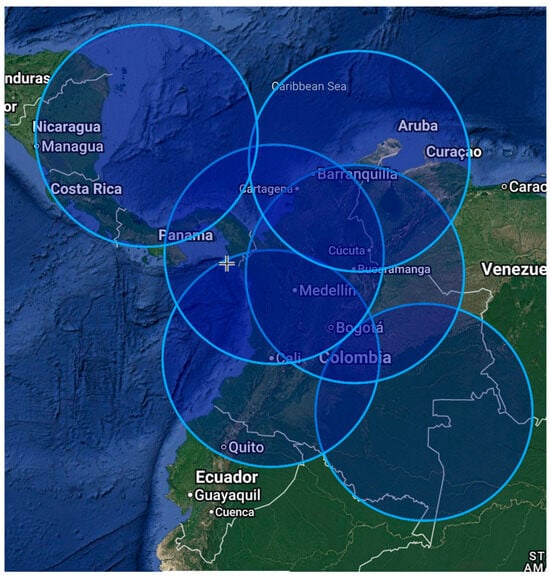
Figure 2.
Distance between RIMS antennas in Colombia, Google Earth.
The RIMS layout focuses on Colombia’s busiest corridors to maximize availability [52,54], optimizes geometry to reduce positioning error [19,54], and enables continuous monitoring of equatorial ionospheric disturbances [41,58]. Geographic redundancy ensures compliance with APV-I continuity requirements [46], consistent with systems such as GAGAN and EGNOS [19,46].
3.3.1. Rationale and Trade-Off Analysis for RIMS Network Size
In equatorial conditions, RIMS number is a critical SBAS trade-off between performance and cost [19]. Analysis of four to eight stations shows that six RIMS are the minimum needed to meet GDOP and ICAO APV-I availability and continuity requirements, as confirmed by Radio Mobile and STK simulations [46,50,51,52,53,54].
3.3.2. Checklist for the Deployment of the Six Selected Reference Stations
Based on the reverse-engineering analysis and the characteristics of Colombian airspace, a network of six reference stations was identified as sufficient to provide nationwide SBAS coverage (Table 2). To ensure site reliability, each location will be evaluated using a verification checklist and considered acceptable if it meets at least 50% of the FAA recommendations, with each assessment supported by a technical justification.
Table 2.
Proposed RIMS Sites and System-Level Roles.
3.4. Required Supporting Infrastructure
Each Colombian SBAS RIMS site must provide reliable power with backup, redundant telecommunications to the MCC, and adequate physical and environmental protection, particularly in tropical and coastal regions [19,46,57,58]. These requirements, consistent with equatorial SBAS deployments such as GAGAN, are essential to meeting ICAO availability and continuity targets under challenging geographic conditions [19].
3.5. Simulation in Radio Mobile in Colombian Zones (CAR/SAM)
Based on ICAO criteria and the selected number and placement of antennas, Radio Mobile simulations were performed to assess SBAS coverage over three regions: CAR–COL, SAM–CENTRO/COL, and SAM–SUR/COL. Table 3 summarizes the geographic locations of each antenna together with their geomagnetic coordinates.
Table 3.
Coverage Zones in CAR-COL and SAM-COL Regions.
Three RIMSs are assigned to the CAR region to ensure coverage of northern Colombian airspace and adjacent maritime areas. San Andrés extends coverage over the Caribbean, Riohacha secures the continental northern sector and major overflight routes, and Carepa provides coverage of the northern Western Andes while bridging the CAR and SAM regions. Figure 3 shows the Radio Mobile coverage simulation for this configuration.
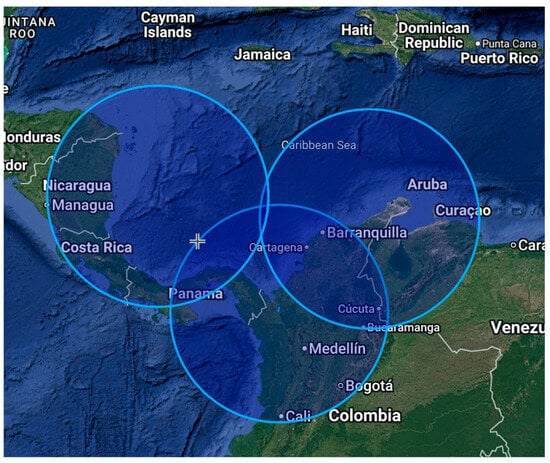
Figure 3.
RIMS Antenna Locations for CAR Coverage, RadioMobile Simulation: Riohacha, Carepa, San Andrés.
The Piedecuesta RIMS, sited near an existing VOR, covers central Andean airspace and the high-density Eastern Andes corridor, as Bogotá is excluded by ICAO spacing constraints (Figure 4). The Cali RIMS complements this by covering south-western Colombia and key overflight routes between South America and Central/North America.
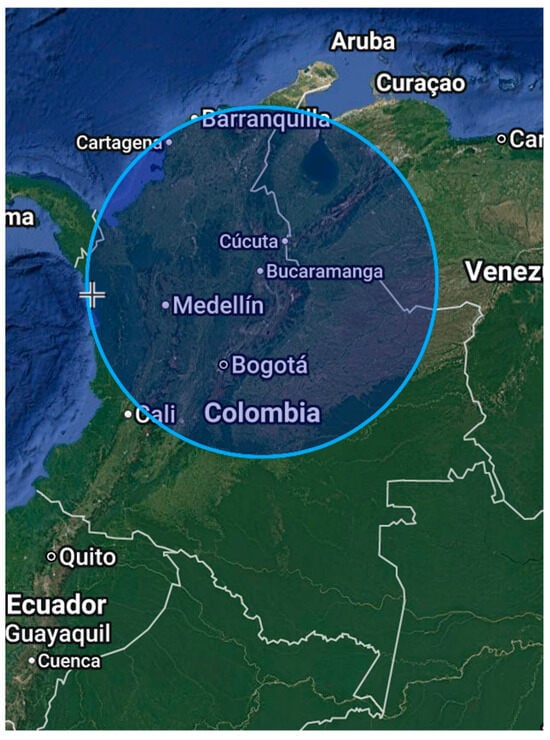
Figure 4.
RIMS Antenna Location for SAM-CENTRO/COL Coverage, RadioMobile Simulation: Piedecuesta Site.
The location of the Mitú antenna provides coverage for the south-eastern region of the country. This area is strategically important for ensuring connectivity with flights arriving from Brazil. Figure 5 illustrates the coverage of these two antennas within the SAM region.
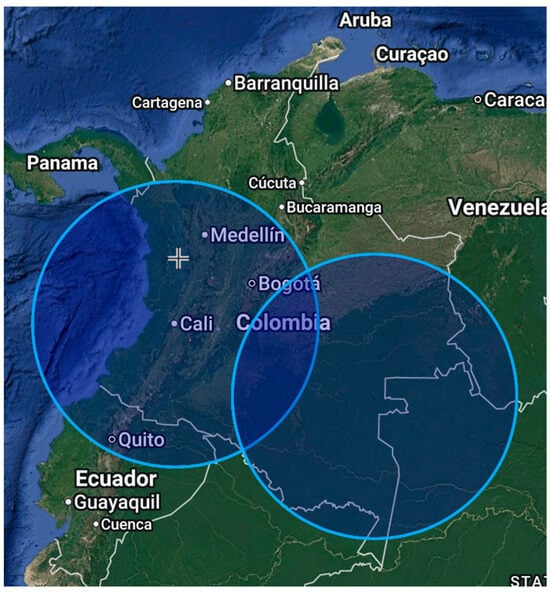
Figure 5.
RIMS Antenna Locations for SAM Region Coverage, RadioMobile Simulation: Cali and Mitú.
The six proposed RIMS antennas provide nationwide coverage and comply with ICAO siting standards [59]. Locations were selected at international airports or near VOR stations, such as in Piedecuesta and Carepa. Figure 6 illustrates the overall coverage and regional connectivity these stations offer across Central and South America, based on RadioMobile simulations.
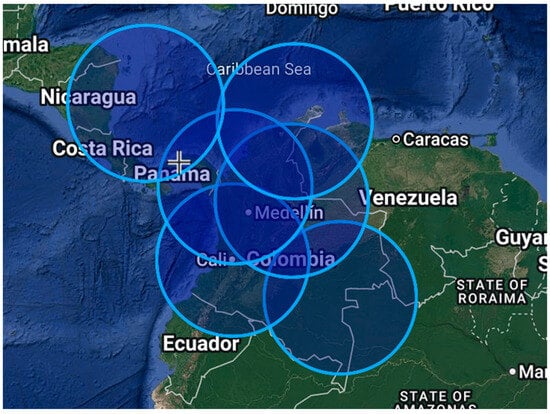
Figure 6.
Location of the Six RIMS Antennas for Coverage of Colombian Territory and SAM/CAR Regions, RadioMobile Simulation.
3.6. Master Station
The MCC processes measurements from the RIMS network to estimate satellite clock and orbit corrections and generate the regional ionospheric model, providing timing alignment and integrity support for SBAS users [60]. To ensure continuous operation, the system implements hot and cold standby architectures [19]. For the GEO link, earlier Colombian studies used Inmarsat 3F-4 [61], but following its replacement, Inmarsat 3F-5 is adopted here (Figure 7) [62,63]. GEO coverage over the equatorial region was analysed using Orbitron, confirming availability for the Colombian RIMS network (Figure 8).
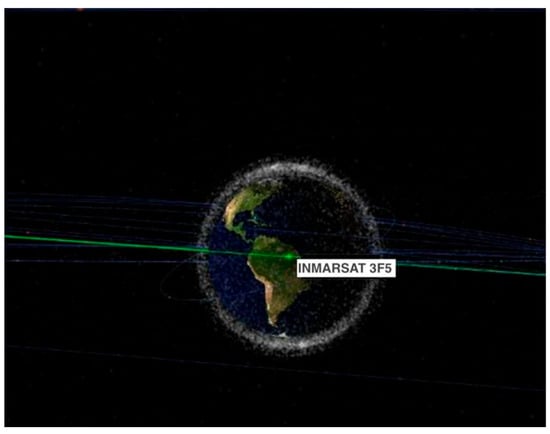
Figure 7.
Orbit of the Inmarsat 3F-5 communications satellite.
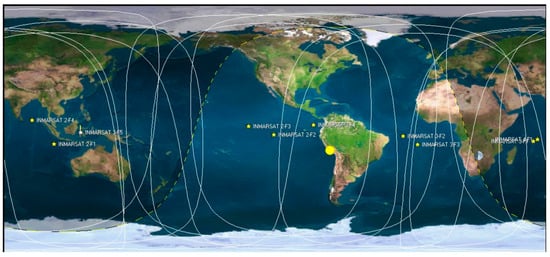
Figure 8.
Coverage of GEO satellites in the equatorial region.
Link performance and geometry were assessed using STK, with the six RIMSs placed at the selected coordinates (Table 1), yielding nationwide coverage (Figure 9).
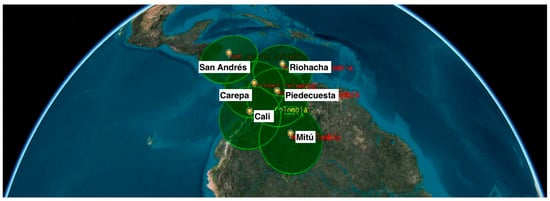
Figure 9.
Coverage area of RIMS antennas deployed across Colombia, as simulated in STK.
The resulting end-to-end SBAS architecture, with GPS signals received by the RIMS and relayed to the MCC in Bogotá, is shown in Figure 10.
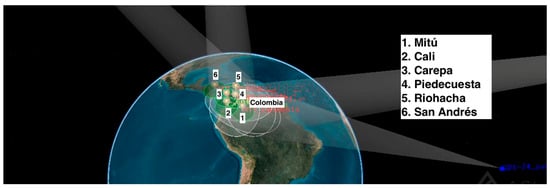
Figure 10.
Complete architecture of the SBAS Colombia system showing GPS transmission and reception via RIMS antennas and data relay to the master station in Bogotá.
Figure 11 illustrates a representative communication geometry for the Riohacha site and the GPS constellation, together with the preliminary reference-station layout.
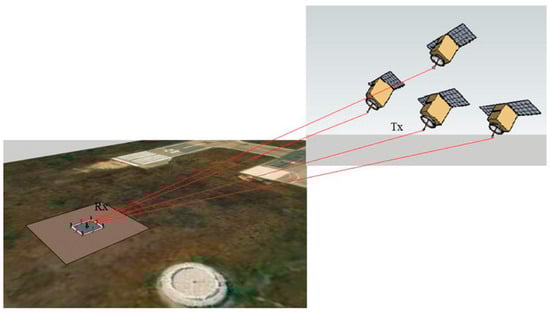
Figure 11.
Communication architecture between the RIMS antenna at Riohacha airport terminal boundary and the GPS constellation, including preliminary design for the reference station.
3.7. STK Simulation of Communication Between the Ground Link Station and the Inmarsat Satellite
To simulate the uplink signal from the link station to the SBAS satellite, a probe was used to transmit data in the simulation. This uplink signal carries the SBAS message encoded in the C-band, which the SBAS satellite then retransmits. Using data extracted from tracking the Inmarsat satellites, the orbital characteristics were determined to simulate the downlink transmission to the user segment via STK. This process is illustrated in Figure 12.
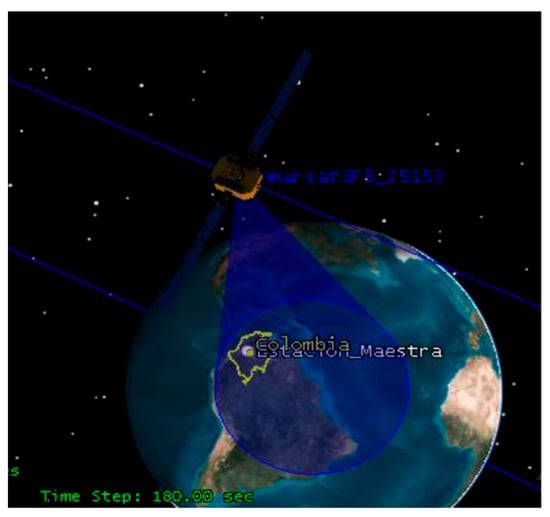
Figure 12.
Simulation of downlink data transmission from a GEO orbit satellite.
Figure 13 shows the results of the STK simulation. The SBAS message transmitted by the ground link station is represented in blue, while the downlink signal, received by the ABAS equipment installed on the aircraft, is shown in white.
Figure 13.
STK simulation results illustrating the SBAS uplink signal (blue) and the downlink signal received by aircraft ABAS equipment (white).
3.8. Continuity Risk Assessment Under Peak Ionospheric Conditions
The APV-I continuity requirement (≤1 × 10⁻⁵ per 15 s) was assessed under worst-case post-sunset equatorial scintillation using inflated pseudorange noise, conservative GIVE values, and reduced satellite availability in STK end-to-end simulations. No service interruptions were observed, and the inferred continuity risk remained below the ICAO threshold, confirming that the six-RIMS architecture preserves continuity under stressed ionospheric conditions.
4. Equatorial Ionospheric Threat Characterization and Experimental Validation
This section presents the observational datasets used to characterize post-sunset ionospheric conditions over Colombia and examines their implications for SBAS geometry, integrity, and continuity performance. The emphasis is placed on data-driven assessment and inter-dataset correlation, providing the basis for evaluating the robustness of the proposed ground-segment configuration under stressed equatorial conditions.
4.1. Classification of Scintillation Intensity
Scintillation severity is assessed using the amplitude index S4, with ITU thresholds defining weak (<0.3), moderate (0.3–0.6), and strong (>0.6) regimes [38]. S4 is used because SBAS performance is mainly driven by signal power fades, C/N0 degradation, and loss-of-lock events, while phase scintillation metrics (σφ) are receiver-dependent and are therefore only implicitly accounted for in the performance simulations (Figure 14).
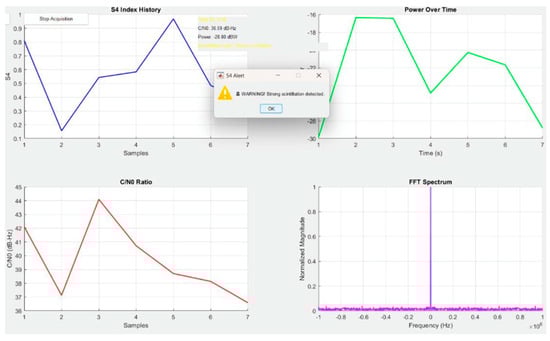
Figure 14.
Message Alarm Monitoring Station [38].
Scintillation alert systems use visual indicators to classify disturbance severity and support aviation operations. During weak scintillation (S4 < 0.3), signal amplitude fluctuations are minimal and have negligible impact on GNSS performance, and are therefore flagged using non-critical visual cues (e.g., yellow indicators) to maintain operator awareness without triggering system-level actions. Figure 15 illustrates this yellow alert state for minor amplitude disturbances [38].
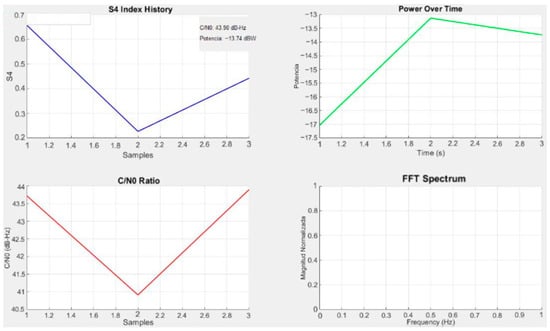
Figure 15.
Yellow Alarm—Weak Scintillation [38].
As ionospheric conditions degrade and S4 enters the 0.3–0.6 range, the risk of loss-of-lock and positioning error increases, triggering a transition to a moderate alert state. This regime may prompt pre-emptive mitigation actions, such as increased monitoring or reversion to non-precision modes, to preserve continuity and integrity—particularly in equatorial regions characterized by rapid TEC gradients. The corresponding moderate-alert state is illustrated in Figure 16, which shows the orange warning generated under these conditions [38].
Figure 16.
Orange Alarm—Moderate Scintillation [38].
4.2. Experimental Results and Analysis of the Scintillation Monitoring Campaign in Colombia
Ionospheric monitoring is critical in Colombia due to the strong impact of low-latitude plasma irregularities on GNSS and SBAS performance [38]. Although four LISN stations were deployed, only Leticia remains operational in 2025, while Bogotá, Popayán, and Santa Marta are offline (Table 4), leaving major regions without real-time monitoring and underscoring the need to strengthen national observation capabilities [38].
Table 4.
Operational Status of LISN GPS Monitoring Stations in Colombia.
Complementing LISN, the IGS BOGT00COL station in Bogotá provides continuous multi-constellation GNSS data for monitoring TEC variability and scintillation near the geomagnetic equator. Additional optical context is provided by the Boston University all-sky imager in Villa de Leyva, part of the Boston University Optical Network (Figure 17).
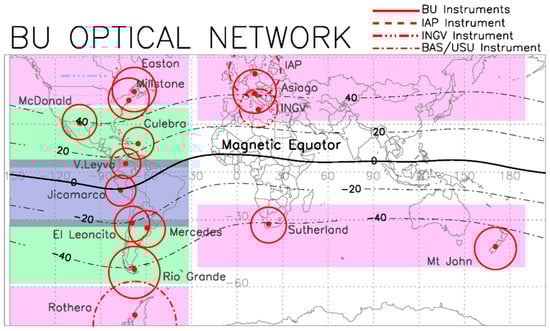
Figure 17.
Boston University Optical Network.
This instrument observes key airglow emissions (e.g., 5577 Å, 6300 Å, and 7774 Å) associated with plasma instabilities and large-scale ionospheric dynamics, offering independent evidence of disturbance morphology and temporal evolution relevant to SBAS risk assessment. An example of these observations is shown in Figure 18, illustrating the capability of the system to capture low-latitude ionospheric structures. Data acquisition at this site continued until 10 March 2024.
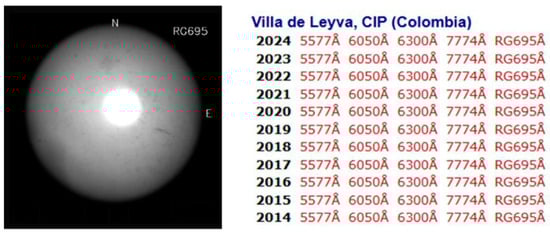
Figure 18.
Image and data from Villa de Leyva All-Sky Imager.
4.3. Colombia’s Geophysical Position Within the EIA
Colombia lies in the low-latitude ionosphere between the northern and southern crests of the EIA, placing it in a transition region dominated by equatorial electrodynamics and post-sunset plasma instabilities. As a result, GNSS signals over Colombian airspace are frequently affected by steep TEC gradients and strong amplitude and phase scintillation after dusk. This geophysical setting is therefore key to understanding the ionospheric disturbances that drive SBAS integrity, availability, and continuity performance.
4.3.1. LCSL Data Results
The LCSL campaign assessed scintillation at Bogotá, Cartagena, and Santa Marta (Figure 19) using measurements from 18:00 to 06:00 LT (UTC−5) analysed in two-hour intervals. Two phases were conducted: an initial VHF/SDR campaign with machine-learning analysis, followed by an L-band phase using cognitive radio techniques to improve robustness. Together, these observations provide a representative characterization of equatorial scintillation over northern Colombia.
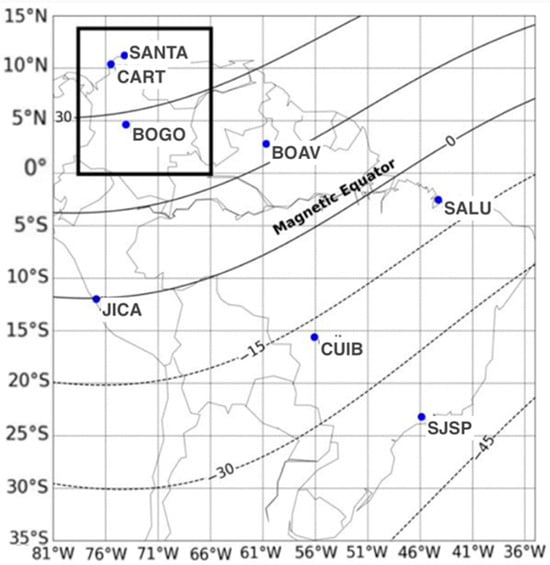
Figure 19.
Limits of the LCSL monitoring stations in Colombia [38].
Two requirements emerge: redundant RIMS coverage around SKBO to ensure favourable geometry and meet VAL constraints, using a triangulated layout (e.g., Cali, Bucaramanga, Carepa) [50] as seen in Table 5; and robust link budgets with conservative fade margins to preserve continuity under seasonal convection and scintillation, especially during peak traffic periods [50].
Table 5.
Frequency of CubeSats passing over Colombia.
4.3.2. Analysis of ROTI in Bogotá and Its Relationship with Ionospheric Scintillation
The ROTI quantifies short-term TEC variability and is widely used as an indicator of ionospheric irregularities associated with scintillation in GNSS signals. In this study, ROTI over Bogotá was derived from TEC measurements at the BOGT00COL IGS station located at the National University of Colombia. In the absence of dedicated S4 scintillation sensors at this site, ROTI provides a practical proxy for disturbance monitoring, supported by its documented correlation with the phase scintillation index σφ [64].
Ionospheric Behaviour in Bogotá (13 December 2024)
Figure 20 shows a clear post-sunset increase in ROTI on the GNSS L1 band, with peaks between approximately 19:00 and 01:00 LT, consistent with equatorial plasma bubbles driven by post-dusk Rayleigh–Taylor instabilities [65]. The elevated ROTI values indicate strong electron density fluctuations capable of degrading GNSS tracking and positioning. Agreement with LCSL observations confirms the presence of scintillation-related disturbances and supports the use of ROTI for SBAS ionospheric risk assessment in Colombian airspace.
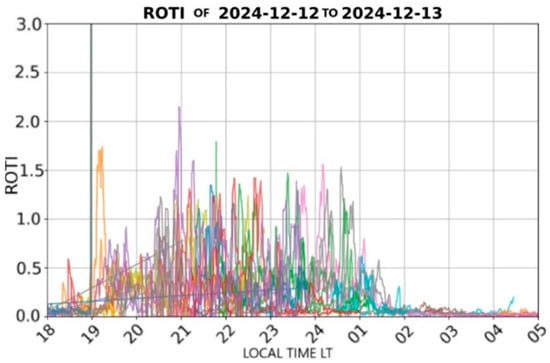
Figure 20.
Rate of TEC Index (ROTI) time series over Bogotá derived from the IGS station BOGT00COL for DOY 348 (12–13 December 2024). ROTI is expressed in TECU/min and shows a clear post-sunset enhancement associated with equatorial ionospheric irregularities [38].
LCSL Data Collection and Processing in Bogotá (13 December 2024)
Figure 21 and Figure 24 show enhanced S4 variability over Bogotá in the early evening (≈18:00–22:00 LT), indicating stronger ionospheric disturbances, followed by more stable late-night conditions with S4 remaining in the weak-to-moderate range (≈0.02–0.4). A data gap after ~01:00 LT reflects temporary measurement loss but does not alter the overall trend.
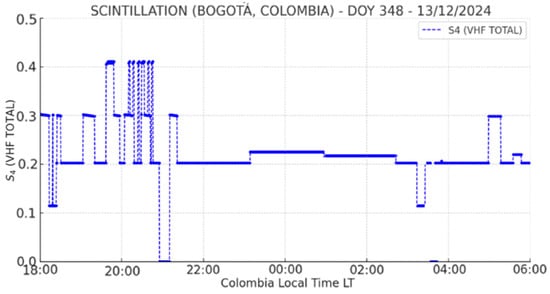
Figure 21.
Data observed at the BOG VHF LCSL—Station [38].
Correlation of LCSL and Madrigal VTEC Data over Bogotá (13 December 2024)
The S4 index over Bogotá (18:00–06:00 LT) shows moderate variability, indicating disturbed ionospheric conditions. This is consistent with enhanced TEC in the Global VTEC map (Figure 22) and elevated ROTI, pointing to conditions conducive to moderate-to-strong scintillation, even though measured S4 levels remained relatively low.
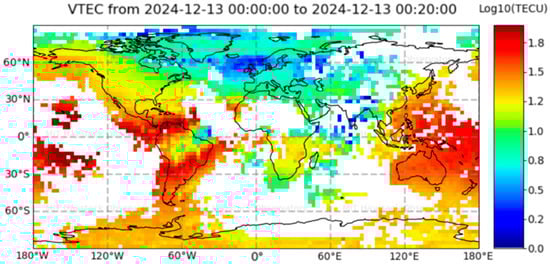
Figure 22.
VTEC map for 13 December 2024 (00:00–00:20 UTC). The color scale represents log10(TECU). Data from the MIT/Haystack Observatory Madrigal database [66].
LCSL and IGPJICAMARCA Data Correlation–Bogotá (13 December 2024)
For completeness, Figure 23 shows an RTI map from the Jicamarca Incoherent Scatter Radar, revealing plasma bubble signatures between 20:00 and 23:00 LT (UTC−5). During this interval, Bogotá S4 values (0.019–0.4) indicate moderate perturbations and closely align in timing with the Jicamarca irregularities, suggesting region-wide moderate equatorial plasma turbulence [67].
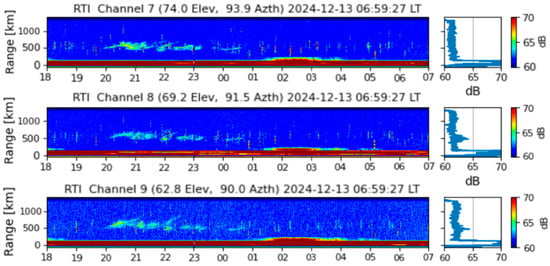
Figure 23.
IGP Equatorial Spread F [RTI], 13 December 2024 [38].
LCSL Data and INCT NavAer (Ex-CIGALA/CALIBRA) Correlation (13 December 2024)
A comparison between INCT NavAer and Bogotá data on 13 December 2024 shows a clear correlation in S4 variability between Bogotá and Boa Vista, indicating region-wide scintillation. Both datasets exhibit strong fluctuations between 00:01 and 01:53 LT that later stabilize (Figure 24), confirming the consistency and regional extent of the disturbance.
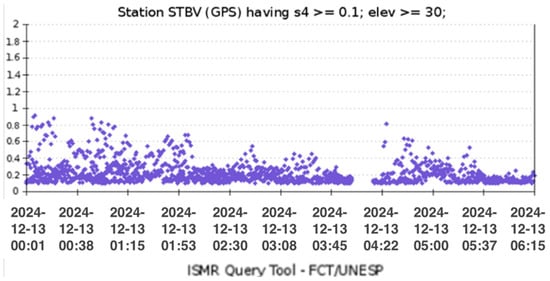
Figure 24.
INCT NavAer S4, 13 December 2024 [38].
Summary Data in Bogotá, Colombia (13 December 2024)
On 13 December 2024, Bogotá experienced moderate scintillation (S4 = 0.1–0.4 between 18:00 and 23:00 LT), while stronger disturbances were observed in Boa Vista and Jicamarca, with TEC data from MIT Haystack highlighting regional variability. As the Bogotá measurements were obtained in the VHF band and are more susceptible to instrumental effects, these results (Table 6) support the need to transition to L-band GNSS observations to improve ionospheric modelling and service reliability in equatorial regions.
Table 6.
Summary Data in Bogotá, Colombia (13 December 2024).
4.3.3. Ionospheric Behaviour in Cartagena (17–18 December 2024)
ROTI in the GNSS L1 band shows a clear post-sunset increase, with peaks between ~19:00 and 23:00 LT, indicating equatorial ionospheric irregularities. Agreement with LCSL data confirms scintillation-related signal degradation, and in the absence of a local receiver in Cartagena, ROTI from the IGS Bogotá station is used as a regional proxy. The observed trends are shown in Figure 25.
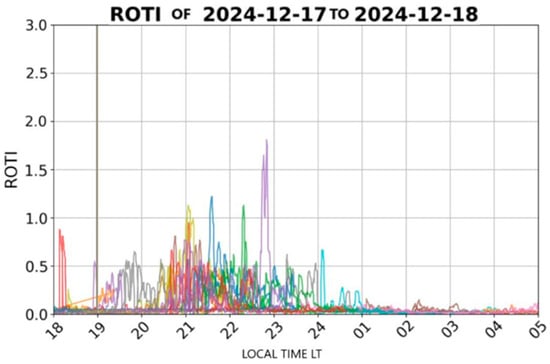
Figure 25.
ROTI time series over Bogotá derived from the IGS station BOGT00COL for DOY 352 (17–18 December 2024). ROTI is expressed in TECU/min and shows enhanced post-sunset ionospheric variability [38].
No ROTI values exceeded 1 TECU/min, indicating the absence of severe ionospheric disturbances. However, the 130 instances of ROTI values ranging between 0.5 and 1 suggest the presence of moderate ionospheric irregularities. These fluctuations have the potential to impact the performance and reliability of satellite-based communication and navigation systems. A summary of these occurrences is presented in Table 7.
Table 7.
ROTI Statistics for Cartagena (DOY 352, 17–18 December 2024).
TEC variability was low, with a maximum dTECsg of 0.99 TECU and a mean near zero, indicating only moderate, localized irregularities. A late-night S4 peak (>0.4) is likely due to noise. Overall, these results suggest limited small-scale ionospheric structuring and a low integrity impact during the observation period.
LCSL Data Collection and Processing in Cartagena (17 December 2024)
S4 in Cartagena varies between 18:00 and 04:00 LT, with the strongest activity from ~20:00 to 00:00 LT (S4 ≈ 0.10–0.45), indicating weak-to-moderate scintillation. After midnight, S4 decreases to below 0.10, suggesting weaker residual disturbances. As shown in Figure 26, this pattern is consistent with nocturnal plasma irregularities, though VHF data may be affected by noise and multipath [68].
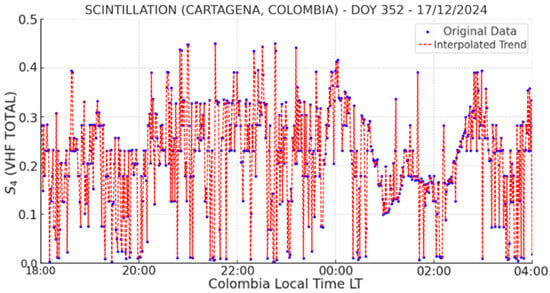
Figure 26.
Scintillation observed at the CTG VHF LCSL Station [38].
LCSL Data and IGP JICAMARCA Data Correlation—Cartagena (17 December 2024)
Ionospheric scintillation data from Cartagena on 17 December 2024 showed notable post-sunset disturbances, particularly between 20:00 and 23:00 LT. However, low-level activity at Jicamarca and potential VHF noise at Cartagena suggest caution in interpreting the results. This highlights the importance of rigorous noise filtering and calibration in VHF-based ionospheric monitoring (Figure 27).
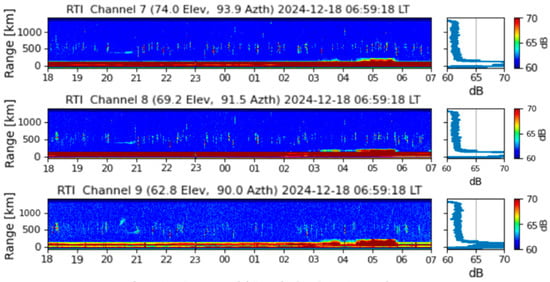
Figure 27.
IGP, Equatorial Spread F [RTI], 17 December 2024 [38].
LCSL Data and MIT/Haystack Observatory (CEDAR Madrigal Database) Data Correlation with Global VTEC Conditions—Cartagena (17 December 2024)
The S4 scintillation index at Cartagena showed variable activity, peaking between 20:00 and 00:00 LT (01:00–05:00 UTC). Elevated TEC values over Colombia, shown in Figure 28, reveal a well-developed EIA crest in the region, which is known to coincide with increased ionospheric scintillation. Moderate TEC levels were observed over Jicamarca, supporting regional variability in ionospheric conditions [66,69].
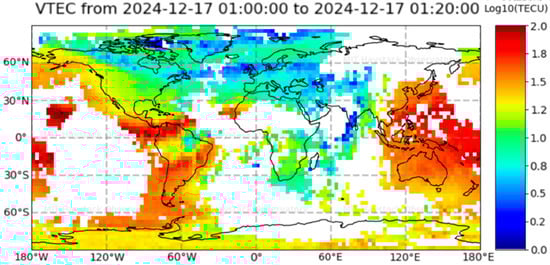
Figure 28.
Global VTEC Conditions (17 December 2024/01:00–01:20 UTC) [66].
LCSL and INCT NavAer, Data Correlation—Cartagena (17 December 2024)
INCT NavAer (Boa Vista) and Cartagena data show correlated S4 variations (Figure 29), indicating region-wide scintillation. Boa Vista exhibits sustained activity from 00:24 to 07:30 (UTC−4), while Cartagena shows a similar post-sunset trend from ~23:00 (UTC−5), consistent with eastward-drifting equatorial irregularities. Peak S4 in Boa Vista exceeds 1.5 between 00:00 and 01:00 (UTC−4), indicating intense scintillation capable of significantly degrading GNSS and VHF signals.
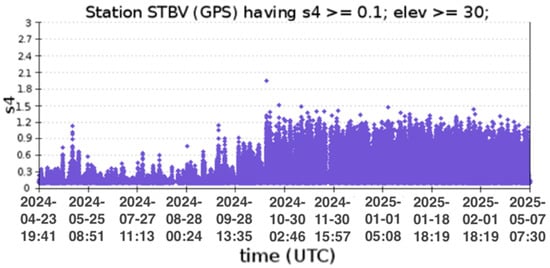
Figure 29.
INCT NavAer S4, 17 December 2025 [38].
Summary Data in Cartagena (17 December 2024)
On 17 December 2024, Cartagena experienced moderate scintillation (S4 ≈ 0.14–0.45 between 20:00 and 00:00 LT, with a late-night peak > 0.40), while INCT NavAer reported stronger, sustained activity (S4 > 1.5 from 00:00 to 07:30 LT) and Jicamarca observed only minor perturbations. MIT/Haystack VTEC maps show enhanced TEC over Colombia during 01:00–07:30 UTC, and the consistency across datasets supports the ionospheric origin of the disturbances. The results are summarized in Table 8 and illustrate the value of coordinated GNSS-based monitoring for regional modelling and forecasting [69].
Table 8.
Summary Data in Cartagena, Colombia (17 December 2024).
4.3.4. Ionospheric Behaviour in Santa Marta (24 December 2024)
As shown in Figure 30, ROTI in the GNSS L1 band exhibits a clear post-sunset increase, with pronounced peaks between 19:00 and 23:30 LT, indicating strong electron density fluctuations associated with ionospheric scintillation. Cross-comparison with Software-Defined Radio (SDR) GNU Radio version 3.10.6.0 (2024 release) data confirms the corresponding degradation of VHF signal integrity. In the absence of a local GNSS receiver in Santa Marta, ROTI from the IGS station in Bogotá is used as a regional proxy, leveraging the spatial coherence typical of low-latitude disturbances to enable a preliminary assessment of ionospheric conditions over the Caribbean coast.
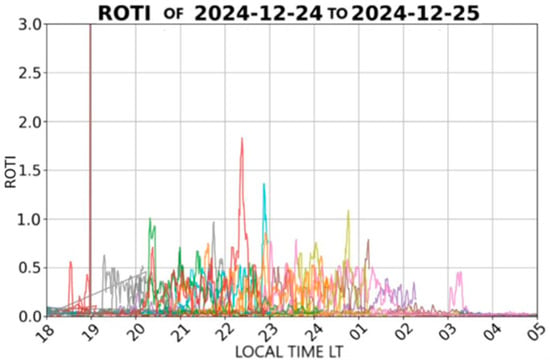
Figure 30.
ROTI time series over Bogotá derived from the IGS station BOGT00COL for DOY 359 (24–25 December 2024). ROTI is expressed in TECU/min [38].
LCSL Data Collection and Processing in Santa Marta, Colombia (24 December 2024)
The monitoring station in Santa Marta recorded the highest scintillation activity during the campaign, as illustrated in Figure 31. The S4 index reached values approaching 1.0, indicating extreme scintillation conditions capable of significantly degrading signal accuracy. Given the magnitude of the observed peaks, the potential contribution of measurement noise or localized interference should also be considered.
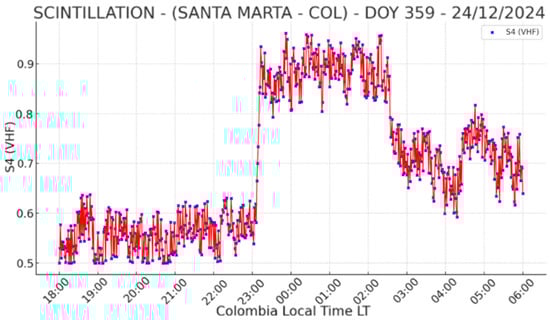
Figure 31.
Scintillation observed at the SMR VHF Station [38].
Several measurements exceeded S4 = 0.9, with peaks approaching 1.0 around 23:00 and 03:00 LT, indicating severe disturbances affecting GNSS and VHF communications. A sustained interval of moderate scintillation persisted from approximately 03:00 to 06:00 LT, with S4 remaining above 0.6. The temporal variability indicates highly dynamic and localized ionospheric activity affecting multiple signal paths.
Analysis of Ionospheric Scintillation Intensity over Bogotá on 24 December 2024 Using IGS ROTI Measurements
The correspondence between ROTI variations (Table 9) and observed scintillation events highlights the impact of ionospheric disturbances on signal integrity. As shown in Figure 32, ROTI values in the GNSS L1 band increase markedly after sunset, indicating enhanced electron density fluctuations. During this interval, scintillation became particularly pronounced after 23:00 LT, supporting the use of ROTI as a practical precursor indicator of severe scintillation and associated signal degradation.
Table 9.
ROTI-Derived Ionospheric Irregularity Metrics for Santa Marta (DOY 359).
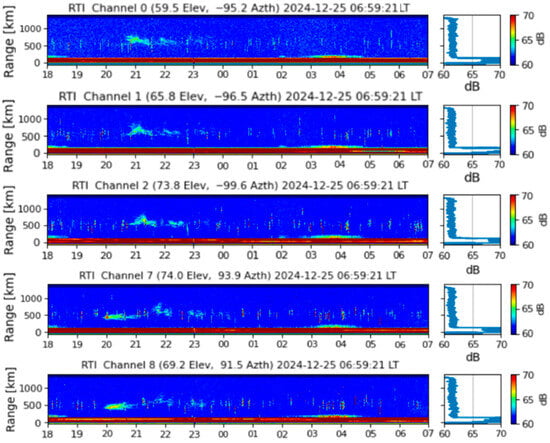
Figure 32.
IGP, Equatorial Spread F [RTI], 24 December 2025 [38].
LCSL and IGP JICAMARCA Data Correlation—Santa Marta (24 December 2024)
On 24 December 2024, Santa Marta recorded extreme scintillation between 23:00 and 03:00 LT (S4 > 0.9, peaks ≈1.0; Figure 32). Concurrent plume activity at Jicamarca (Figure 32 shows strong regional post-sunset disturbances, confirming the spatial coherence of equatorial ionospheric activity and the value of multi-site monitoring.
Correlation of LCSL and Madrigal VTEC Data over Santa Marta (24 December 2024)
The Santa Marta station recorded the highest scintillation levels of the campaign, particularly between 23:00 and 03:00 LT, with S4 values approaching 1.0, indicating severe scintillation capable of strongly degrading GNSS accuracy (Figure 19). Consistently, the Global VTEC map (Figure 33) shows elevated TEC over Colombia during 04:00–04:20 UTC, especially near ±20° magnetic latitude, consistent with Santa Marta’s location. This agreement supports the interpretation that enhanced plasma density and associated irregularities drove the observed scintillation. Given the extreme S4 levels, additional validation using multi-frequency GNSS data and improved noise filtering is recommended.
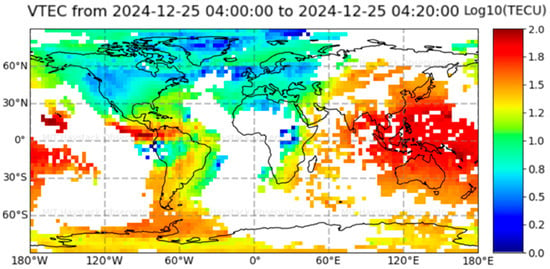
Figure 33.
Global VTEC Conditions (25 December 2024/04:00–04:20 UTC) [66].
4.3.5. Ionospheric Behaviour in Bogotá (19–20 February 2025)
Figure 34 shows a clear post-sunset ROTI enhancement in the GNSS L1 band, with peaks between ~19:00 and 23:30 LT, consistent with equatorial ionospheric scintillation. Agreement with LCSL data confirms signal degradation, while IGS observations from the Universidad Nacional de Colombia provide reliable local monitoring of these regionally coherent disturbances.
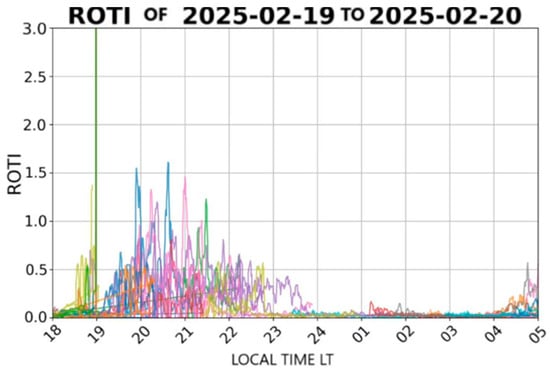
Figure 34.
Rate of TEC Index (ROTI) time series over Bogotá derived from the IGS station BOGT00COL for DOY 50 (19–20 February 2025). ROTI is expressed in TECU/min [38].
LCSL Data Collection and Processing in Bogota D.C, Colombia in L1 Band
Figure 35 shows that on 19 February 2025, Bogotá experienced moderate to severe ionospheric scintillation throughout the night. The S4 index peaked at around 0.7 between 22:00 and 02:00 LT, indicating strong fluctuations that could disrupt GNSS signals. After a brief decline, scintillation resumed at moderate levels until early morning. These patterns are typical of post-sunset equatorial plasma instabilities, such as the Rayleigh-Taylor instability, which frequently affect satellite navigation near the EIA.
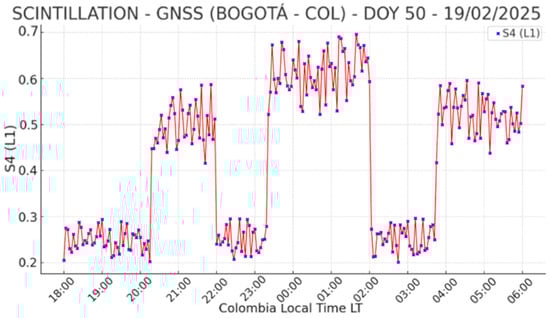
Figure 35.
Scintillation observed at the BOG in L1 band LCSL Station [38].
LCSL and IGS Data Correlation Bogotá (19 February 2025)
On 19 February 2025, Bogotá experienced moderate ionospheric irregularities, with 275 ROTI instances between 0.5 and 1.0 TECU/min, but no severe disturbances (ROTI > 1.5). TEC remained largely stable, showing no signs of large-scale plasma structures. S4 values peaked between 0.6 and 0.7, with common fluctuations in the 0.3–0.5 range, indicating moderate scintillation. Although conditions were generally stable, the observed perturbations may affect GNSS performance under certain conditions and merit further analysis in relation to geomagnetic or solar activity.
Correlation Between LCSL and IGP Jicamarca Data over Bogotá (19 February 2025)
Figure 36 indicates moderate ionospheric activity at both Bogotá and Jicamarca, with ROTI (~0.5–1.0 TECU/min) and S4 (~0.3–0.7) values consistent across sites, suggesting region-wide, moderate disturbances. The absence of extreme ROTI (>1.5 TECU/min) or strong scintillation peaks implies limited impact on GNSS stability, while late-night Bogotá peaks are likely influenced by measurement artefacts.
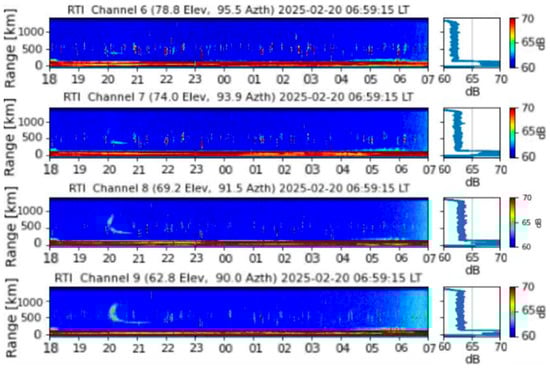
Figure 36.
Equatorial Spread F [RTI] 19 February 2025 [38].
LCSL and MIT/Haystack Observatory (CEDAR Madrigal Database) Data Correlation with Global VTEC Conditions—Santa Marta (19 February 2025)
The S4 scintillation index observed in Bogotá indicates moderate to high activity, with peak values of 0.6–0.7 on GPS L1, reflecting significant amplitude fluctuations in GNSS signals. For most of the night, scintillation remained moderate (S4 ≈ 0.3–0.5). The Global VTEC map (Figure 37) corroborates these results, showing elevated TEC over Colombia at 01:00 UTC (20:00 LT) [66,70]. Together, these observations indicate ionospheric conditions conducive to scintillation and a potential degradation of GNSS signal reliability over Bogotá.
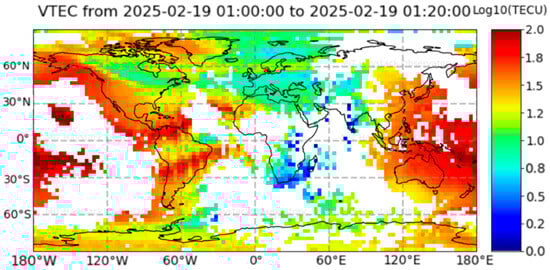
Figure 37.
Global VTEC Conditions (19 February 2025/01:00 UTC) [66].
The Madrigal scintillation map for 20 February 2025 (Figure 38) shows enhanced activity in the surrounding region. The locally recorded scintillation over Bogotá is consistent with the regional activity observed in the Madrigal dataset for the same period [66], supporting the representativeness of the measurements used in this study.
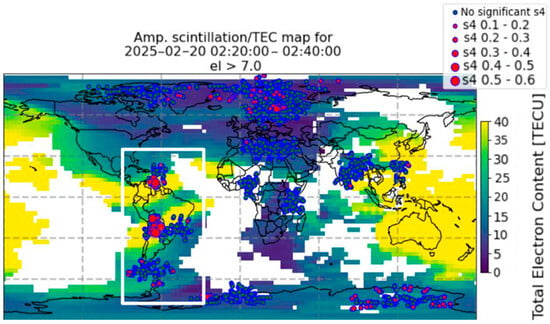
Figure 38.
Madrigal scintillation map from 20 February 2025 (02:20–02:40 UT/21:00 LT in Colombia) [66].
LCSL and INCT NavAer, Data Correlation—Bogotá (19–20 February 2025)
INCT NavAer data (Figure 39) show pronounced temporal variability in S4, with sustained elevations (>1.2) between 00:00 and ~04:30 UTC and peak activity around 00:00–01:00 UTC (~20:00 LT), indicating moderate-to-strong ionospheric disturbances. Observations from 19 February 2025 confirm this pattern, with moderate scintillation over Bogotá and stronger events over Boa Vista (S4 > 1.2), highlighting the regional variability of the disturbance.
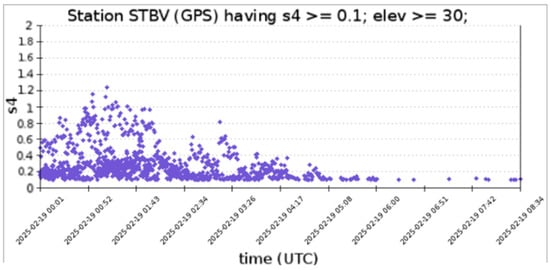
Figure 39.
INCT NavAer S4, 19 December 2025 [38].
4.3.6. LCSL Data Collection Campaign
Figure 40 presents the time series of S4 and ROTI over 19:00–23:00 UTC, showing a clear post-sunset enhancement in both metrics. S4 rises from background levels (~0.15–0.25) to peaks above 0.6, while ROTI increases concurrently to ~0.8–1.0 TECU/min, confirming the coupling between electron density gradients and signal amplitude fluctuations under equatorial conditions. Both indices peak near 21:00 UTC, consistent with post-sunset plasma irregularities, and then decrease toward background levels. Their sustained elevation for over an hour indicates a coherent ionospheric disturbance rather than an isolated fluctuation.
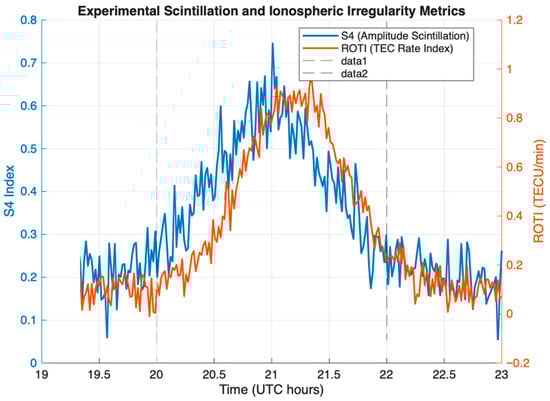
Figure 40.
Time series of the amplitude scintillation index (S4) and the rate of TEC index (ROTI) during the experimental observation window (19:00–23:00 UTC), illustrating the post-sunset enhancement of ionospheric irregularities and their impact on GNSS signal conditions.
5. Discussion
While Section 3 addressed nominal performance, Section 4 examines ionospheric scintillation as the main equatorial threat to SBAS and its impact on integrity, availability, and continuity, with emphasis on post-sunset EIA-related disturbances.
5.1. Lessons from the Indian GAGAN SBAS Architecture
The Indian SBAS (GAGAN) provides a relevant reference for implementing an SBAS in Colombia due to comparable low-latitude operational constraints and ionospheric variability. GAGAN has demonstrated that a strategically designed ground segment can achieve high availability and integrity despite severe ionospheric gradients. The proposed Colombian SBAS adopts a similar design philosophy, including optimized RIMS siting, dual-frequency monitoring, and a central MCC [71].
Figure 41 shows the GAGAN SBAS ground segment, which follows FAA RIMS siting guidelines and provides nationwide coverage with 15 stations, making it a benchmark for equatorial SBAS design. A reverse-engineering analysis of coverage geometry and inter-station spacing (Figure 42a,b) confirms compliance with the recommended 500–1000 km separation criteria, supporting GAGAN as a viable reference architecture for equatorial SBAS deployments.
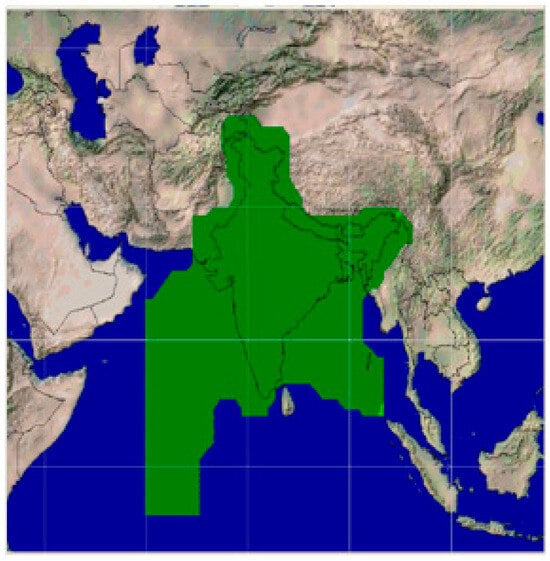
Figure 41.
The GAGAN system coverage.
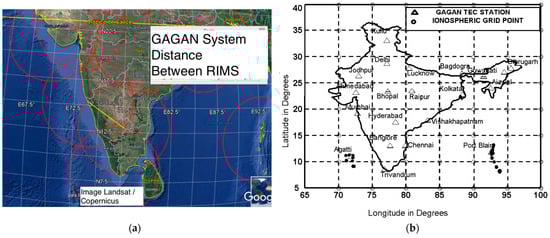
Figure 42.
(a) RIMS network coverage geometry and inter-station baselines across the Indian region; (b) Spatial distribution of GAGAN TEC monitoring stations and ionospheric grid points [72]. Reverse-engineering assessment of baseline lengths indicates compliance with the recommended 500–1000 km inter-station separation criteria for equatorial SBAS ionospheric observability and redundancy.
In low-latitude environments, increased RIMS density is required to ensure adequate ionospheric observability. Accordingly, the GAGAN system adopts an inter-station spacing of approximately 500 km, consistent with FAA siting recommendations. With 15 reference stations distributed across India, this configuration provides continuous national coverage. The resulting inter-station distances are shown in Figure 43, confirming compliance with both geometric coverage and monitoring requirements.
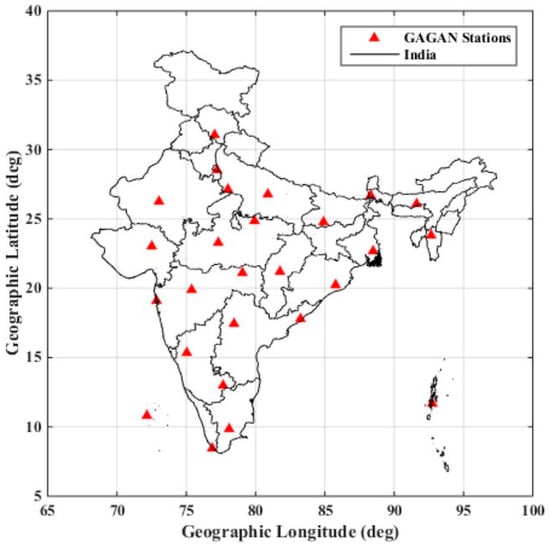
Figure 43.
GAGAN network comprising 26 dual frequency GPS station locations (Adapted from: [73]).
To reproduce GAGAN’s coverage performance, the 15 RIMS were modelled in Radio Mobile v3 with a nominal coverage radius of 500 km per station. The simulation results (Figure 44) show that the combined footprints provide continuous regional coverage, validating the suitability of the layout for national-scale SBAS service.
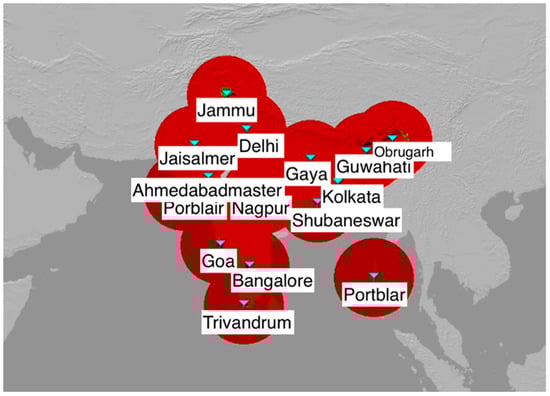
Figure 44.
Simulation of the 15 GAGAN Reference Stations Using Radio Mobile.
Based on this benchmark, the Colombian antenna siting was refined to ensure compliance with FAA spacing guidelines. An initial set of ten candidate locations, all separated by less than 500 km, was evaluated considering airspace demand, proximity to major international airports, the reverse-engineered GAGAN configuration, and equatorial ionospheric conditions. From this set, six optimal sites were selected for the Colombian SBAS RIMS network. The final configuration, with 500 km nominal coverage radii, is shown in Figure 45.
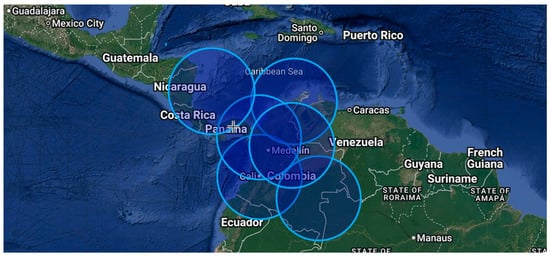
Figure 45.
Distance between RIMS in Colombia.
Figure 46 compares the geographical extent of India and Colombia and contrasts the 15 GAGAN RIMS locations with the six proposed Colombian sites, illustrating the analogous coverage philosophy adapted to Colombia’s smaller territory.
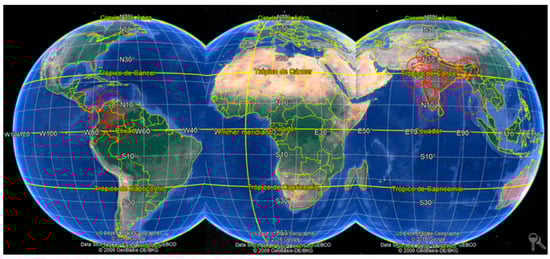
Figure 46.
Comparison between GAGAN and SBAS Colombia.
5.1.1. Key Design Parameters and Adaptations
GAGAN serves as a benchmark for the proposed Colombian SBAS. A six-RIMS layout (Figure 8) was selected to capture equatorial gradients along major corridors, using GIVE-based ionospheric bounding complemented by ROTI statistics from local campaigns. The system adopts hot-standby MCC and redundant uplinks to meet ICAO continuity (≤10−5 per 15 s for APV-I). Radio Mobile™ and STK™ simulations confirm nationwide coverage and availability comparable to GAGAN (≥99.5%).
5.1.2. Broader Comparative Insights
Table 10 compares GAGAN and the proposed Colombian SBAS. GAGAN covers a broader latitude range (~5–25° N) with 15 RIMS and dual-redundant MCCs, whereas the Colombian design is centred near ~10° N, uses six RIMS, and adopts a single MCC with hot-standby backup. The space segment also differs (GSAT-8/10 for GAGAN versus Inmarsat-3F5 for Colombia). Ionospheric modelling reflects regional needs: GAGAN applies Indian TEC models with GIVE bounding, while Colombia uses ROTI- and S4-based threat indicators within a Stanford ESA-style framework. These differences show how the Colombian system adapts the GAGAN concept to a smaller service area and distinct operational context.
Table 10.
Comparative Technical Features of GAGAN and the Proposed Colombian SBAS.
The estimated 65% cost reduction relative to the legacy VOR/DME network is based on a bottom-up comparison of ground infrastructure, considering the number of installations, representative capital costs, and operation and maintenance expenses. The baseline is Colombia’s 51 VOR/DME sites, compared with a proposed SBAS segment comprising six RIMS, one Master Control Centre, and one Uplink Station; using normalized figures from public SBAS benchmarks and civil aviation maintenance data, and limiting the scope to ground navigation aids, the reduced site count and elimination of routine flight inspections for most conventional aids yield an approximate 65% saving. Although simulations used the GPS constellation, the architecture is directly extendable to DFMC SBAS, since core functions are constellation-agnostic and DFMC primarily improves geometry, availability, and ionospheric mitigation without changing the ground segment structure.
5.2. Ionospheric Scintillation Research in India and Its Implications for Colombia
Extensive low-latitude ionospheric research conducted in support of GAGAN provides a well-established empirical basis for defining conservative SBAS stress scenarios under post-sunset scintillation conditions [71]. Rather than repeating the underlying physics and climatology, this study uses those results as contextual support for selecting representative disturbance level [74].
Accordingly, the severe post-sunset conditions adopted here (σln ≈ 0.36 and ROTI95 ≈ 85 mm·km−1) are derived from the regional observations presented in Section 4 and from long-term low-latitude GNSS monitoring campaigns. In this context, σln represents the upper tail of the amplitude scintillation distribution (S4 > 0.6), while ROTI95 captures worst-case but operationally realistic ionospheric gradient conditions. These parameters are therefore used to stress the SBAS integrity and continuity algorithms under conservative yet credible equatorial scenarios [75].
5.3. Performance Under Equatorial Scintillation: Comparison with South American Studies
5.3.1. Limitations Reported in South American Low-Latitude GNSS and SBAS Studies
Previous studies as shown in [76] in South America and other low-latitude regions consistently emphasize the severity of ionospheric scintillation and its detrimental impact on GNSS performance. In particular, the CIGALA/INCT NavAer measurement campaigns over Brazil and Latin America have shown that equatorial scintillation frequently causes signal fading, loss of lock, and degradation of positioning accuracy, integrity, and availability, especially near the EIA crests and during post-sunset hours. Climatological analyses based on the CIGALA dataset further demonstrate that the Brazilian and adjacent low-latitude ionosphere is especially efficient at generating scintillation-producing irregularities, confirming that sustained service availability under such conditions is intrinsically challenging. In this body of literature, the prevailing conclusion is that equatorial ionospheric conditions impose a fundamental limitation on GNSS and SBAS performance, often leading to reduced availability and increased risk of service interruptions during disturbed periods.
Unlike these studies, which primarily focus on characterizing degradation and operational limitations, the present work demonstrates that a traffic-adaptive SBAS ground-segment architecture can preserve aviation-grade performance under conservative equatorial threat assumptions. Using stressed post-sunset conditions representative of the upper tail of regional observations (S4 > 0.6 and ROTI95 ≈ 85 mm·km−1), the proposed six-RIMS configuration maintains APV-I–compatible protection levels, achieves service availability ≥ 99.5%, and satisfies the ICAO continuity requirement (≤1×10⁻⁵ per 15 s) in end-to-end STK simulations. This result indicates that, while equatorial scintillation remains a dominant environmental threat—as documented by CIGALA/INCT NavAer and related South American studies—its operational impact can be mitigated through appropriate RIMS geometry, corridor-focused station placement, and conservative integrity bounding. Consequently, the Colombian SBAS concept does not contradict the limitations highlighted in previous work, but rather shows that, under realistic yet conservative assumptions, a targeted and cost-efficient ground-segment design can achieve robust APV-I service in a challenging low-latitude environment.
In South America, Brazil is currently the only country with extensive SBAS-related research activities (e.g., CIGALA/INCT NavAer), yet no ICAO-certified operational SBAS providing APV services exists in the region. Most published results therefore focus on characterizing performance degradation under equatorial scintillation rather than on demonstrating an operationally viable SBAS service.
5.3.2. Mitigation Through Ground-Segment Design: Performance of the Proposed Colombian SBAS
In this context, much of the existing literature shown in [77] highlights the operational limitations of GNSS and SBAS in equatorial regions, including reduced availability and an increased risk of service interruptions during scintillation events. These studies, largely based on South American and low-latitude observations, emphasize signal fading, loss of lock, and integrity stress during post-sunset equatorial disturbances, reinforcing the view that equatorial environments represent a worst-case scenario for SBAS operations.
Unlike these works, which primarily focus on characterizing degradation and performance limitations, the present study demonstrates that a carefully designed six-RIMS SBAS ground segment can preserve APV-I continuity and availability under conservative but realistic equatorial threat assumptions. Specifically, under stressed post-sunset conditions (S4 > 0.6 and elevated ROTI), the proposed configuration maintains continuity risk below 1 × 10⁻⁵ per 15 s and satisfies protection level requirements, owing to improved geometry, redundant ionospheric observability, and conservative integrity bounding. This result indicates that, while equatorial ionospheric conditions remain intrinsically challenging, appropriate ground-segment densification, traffic-adaptive station placement, and threat modelling can significantly mitigate their operational impact and enable robust SBAS performance over Colombia.
6. Conclusions
This study has presented a comprehensive system-level design and validation of a SBAS ground segment tailored to the unique operational and ionospheric conditions of Colombian airspace. By integrating traffic-weighted geometry optimization, equatorial ionospheric risk modelling, and multi-tool simulation (STK®, Radio Mobile™, and certified integrity monitors), the work advances SBAS design beyond conventional mid-latitude assumptions and provides new insight into augmentation feasibility in EIA environments.
A central outcome of this research is the demonstration that APV-I-compliant SBAS service can be sustained over equatorial regions with a limited, strategically placed RIMS network, provided that ionospheric threat characterization is explicitly incorporated into the integrity design. Despite severe post-sunset scintillation conditions (σln ≈ 0.36, ROTI95 ≈ 85 mm km−1), the proposed six-station architecture consistently maintained Horizontal and Vertical Protection Levels below 28 m and 46 m, respectively, achieving ≥ 99.8% availability across the CAR/SAM Flight Information Regions. These results confirm that ionospheric non-stationarity—rather than satellite geometry—is the dominant integrity driver in low-latitude SBAS, and that this threat can be effectively bounded through GIVE inflation and regional monitoring density rather than brute-force infrastructure expansion.
Continuity was also verified under post-sunset peak scintillation conditions, with the inferred interruption probability remaining below the ICAO requirement of 1 × 10⁻⁵ per 15 s, confirming the operational robustness of the proposed six-RIMS architecture in equatorial environments.
From a systems-engineering perspective, the study demonstrates that traffic-adaptive RIMS siting provides a superior performance-to-cost ratio compared with uniform geographic spacing. By prioritizing high-density corridors such as SKBO–SKRG and SKBO–SKCL, the architecture simultaneously minimizes GDOP during critical approach phases and maximizes sensitivity to fast ionospheric gradients where operational risk is highest. This approach enables a 65% reduction in ground-based navigation infrastructure costs relative to legacy VOR/DME networks, while delivering superior integrity and continuity performance.
Importantly, the proposed SBAS ground segment is not a terminal solution but a scalable, forward-compatible architecture. The integrity framework, monitoring topology, and uplink design are directly extensible DFMC SBAS, positioning Colombia to support future APV-II and LPV-200 operations as ICAO standards evolve. In this context, the Colombian case study provides a transferable blueprint for other equatorial and low-latitude states seeking to modernize navigation services without incurring the complexity and cost of first-generation SBAS deployments such as GAGAN.
In broader terms, this work establishes that equatorial SBAS deployment is no longer a prohibitive integrity problem but a solvable system-design challenge, provided that ionospheric risk is treated as a primary design variable rather than a residual error source. By closing the gap between ionospheric physics, traffic demand, and aviation integrity requirements, the study positions SBAS as a viable cornerstone of performance-based navigation in tropical regions and supports Colombia’s emergence as a regional reference node for GNSS augmentation in the Americas.
Author Contributions
Conceptualization, J.E.O. and S.V.; methodology, J.E.O. and S.V.; software, S.V. and F.R.; validation, J.E.O., S.V. and C.L.; formal analysis, S.V.; investigation, S.V., F.R. and J.M.; resources, J.E.O. and C.R.; data curation, S.V. and F.R.; writing—original draft preparation, S.V.; writing—review and editing, J.E.O., C.L. and C.R.; visualization, S.V. and J.M.; supervision, J.E.O.; project administration, J.E.O.; funding acquisition, N/A. All authors have read and agreed to the published version of the manuscript.
Funding
This research received no external funding.
Data Availability Statement
The datasets generated and analyzed during the current study are available from the corresponding author on reasonable request. Publicly available source data are cited in the reference list.
Acknowledgments
The authors gratefully acknowledge that the Fundación Universitaria Los Libertadores provided financial support by covering the article’s publication processing fee. During the preparation of this manuscript, the authors used Grammarly language refinement, and editorial assistance. The authors have reviewed, validated, and edited all generated content and take full responsibility for the final version of this publication.
Conflicts of Interest
The authors declare no conflicts of interest.
Abbreviations
The following abbreviations are used in this manuscript:
| SBAS | Satellite-Based Augmentation System |
| EIA | Equatorial Ionospheric Anomaly |
| RIMS | Ranging and Integrity Monitoring Station |
| HPL/VPL | Horizontal/Vertical Protection Level |
References
- Kaplan, E.D.; Hegarty, C.J. Understanding GPS: Principles and Applications, 2nd ed.; Artech House: Norwood, MA, USA, 2006. [Google Scholar]
- Escobar Nieto, L.F.; Falla Rubiano, A.; Báez Gómez, J.J.; Ortegón Vega, D.E.; Rodríguez Jiménez, J.A.; Penagos Medina, C.F.; Quisoboni Solarte, J.A. Conocimientos Aeronáuticos Para el Piloto Militar; Escuela Militar de Aviación “Marco Fidel Suárez” (EMAVI): Santiago de Cali, Colombia, 2022; Volume I. [Google Scholar]
- Brocard, D.; Maier, T.; Busquet, C. EGNOS ranging and integrity monitoring stations (RIMS). In Proceedings of the GNSS 2000 Conference, Edinburgh, UK, 2–4 May 2000; pp. 1–13. [Google Scholar]
- Universal Avionics. Operating in Satellite-Based Augmentation System (SBAS) Airspace; Universal Avionics: Tucson, AZ, USA, 2013. [Google Scholar]
- Aeronáutica Civil de Colombia. Plan de Navegación Aérea para Colombia: Volumen II—Instalaciones y Servicios; Aerocivil: Bogotá, Colombia, 2017. [Google Scholar]
- Unidad Administrativa Especial de Aeronáutica Civil. Boletines Operacionales. Available online: https://www.aerocivil.gov.co (accessed on 29 January 2025).
- El Tiempo. Las Nuevas Rutas Aéreas Internacionales en Colombia. Available online: https://www.eltiempo.com/ (accessed on 7 October 2019).
- Augmentation. India’s satellite-based augmentation system GAGAN—Redefining navigation over the Indian region. Inside GNSS 2016, 2016, 42–48. [Google Scholar]
- Belabbas, B. Integrity Assessment of Augmented GNSS for Reliable Navigation. Ph.D. Thesis, Université Paris-Est, Paris, France, 2017. [Google Scholar]
- Misra, P.; Enge, P. Global Positioning System: Signals, Measurements, and Performance, 2nd ed.; Ganga-Jamuna Press: Lincoln, MA, USA, 2011. [Google Scholar]
- Li, Z.; Zhao, X.; Hu, F.; Zhao, Z.; Carrera Villacres, J.L.; Braun, T. SoiCP: A Seamless Outdoor–Indoor Crowdsensing Positioning System. IEEE Internet Things J. 2019, 6, 8626–8644. [Google Scholar] [CrossRef]
- Zhu, L.; Zhang, H.; Li, X.; Zhu, F.; Liu, Y. GNSS timing performance assessment and results analysis. Sensors 2022, 22, 2486. [Google Scholar] [CrossRef] [PubMed]
- Brown, A.T. Ionospheric Scintillation Effects on GPS: Correlation with Solar Cycle and Seasonal Variability. Master’s Thesis, University of California, Los Angeles, CA, USA, 2011. [Google Scholar]
- Kaplan, E.D.; Hegarty, C.J. Understanding GPS/GNSS: Principles and Applications, 3rd ed.; Artech House: Norwood, MA, USA, 2017. [Google Scholar]
- Steenburgh, R.A.; Smithtro, C.G.; Groves, K.M. Ionospheric scintillation effects on single-frequency GPS. Space Weather 2008, 6, S04006. [Google Scholar] [CrossRef]
- ICAO. Annex 10 to the Convention on International Civil Aviation, Volume I: Radio Navigation Aids, 8th ed.; ICAO: Montreal, QC, Canada, 2018. [Google Scholar]
- Hamilton, R. Global positioning system: Signals, measurements and performance. In Proceedings of the 11th Meeting of the UN International Committee on GNSS, Sochi, Russia, 7–11 November 2016. [Google Scholar]
- Langley, R.B. Dilution of precision. GPS World 1999, 10, 52–59. [Google Scholar]
- European Union Agency for the Space Programme. EGNOS Safety of Life Service Definition Document; Issue 3.0; EUSPA: Prague, Czech Republic, 2021. [Google Scholar]
- Bernhardt, P.A.; Siefring, C.L. Low-latitude ionospheric scintillations and TEC obtained with CITRIS. Adv. Space Res. 2010, 45, 1535–1540. [Google Scholar] [CrossRef]
- European Union Agency for the Space Programme. LPV Implementation Guidelines for Airport Operators; Version 2.0; EUSPA: Prague, Czech Republic, 2021. [Google Scholar]
- RTCA. Minimum Operational Performance Standards for GPS/WAAS Airborne Equipment (DO-229E); RTCA: Washington, DC, USA, 2016. [Google Scholar]
- Van Diggelen, F. A-GPS: Assisted GPS, GNSS, and SBAS; Artech House: Boston, MA, USA, 2009; ISBN 978-1-59693-374-3. [Google Scholar]
- Abdu, M.A. Equatorial spread F/plasma bubble irregularities under storm-time disturbance electric fields. J. Atmos. Sol.-Terr. Phys. 2012, 75–76, 44–56. [Google Scholar] [CrossRef]
- Mannucci, A.J.; Wilson, B.D.; Yuan, D.N.; Ho, C.H.; Lindqwister, U.J.; Runge, T.F. A global mapping technique for GPS-derived ionospheric total electron content measurements. Radio Sci. 1998, 33, 565–582. [Google Scholar] [CrossRef]
- Walter, T.; Enge, P.; DeCleene, B. Integrity lessons from the WAAS integrity performance panel. In Global Navigation Satellite Systems; National Academies Press: Washington, DC, USA, 2012. [Google Scholar] [CrossRef]
- Vilà-Valls, J.; Linty, N.; Closas, P.; Dovis, F.; Curran, J.T. Survey on signal processing for GNSS under ionospheric scintillation. Navigation 2020, 67, 511–536. [Google Scholar] [CrossRef]
- Aguiar, C.R.; Monico, J.F.G.; Moraes, A.O. Impact of ionospheric scintillations on GNSS availability and precise positioning. Space Weather 2025, 23, e2024SW004217. [Google Scholar] [CrossRef]
- Kintner, P.M.; Ledvina, B.M.; de Paula, E.R. GPS and ionospheric scintillations. Space Weather 2007, 5, S09003. [Google Scholar] [CrossRef]
- Basu, S.; Groves, K.M.; Quinn, J.M.; Doherty, P. A comparison of TEC fluctuations and scintillations at Ascension Island. J. Atmos. Sol.-Terr. Phys. 1999, 61, 1219–1226. [Google Scholar] [CrossRef]
- Pi, X.; Mannucci, A.J.; Lindqwister, U.J.; Ho, C.M. Monitoring of global ionospheric irregularities using GPS. Geophys. Res. Lett. 1997, 24, 2283–2286. [Google Scholar] [CrossRef]
- Cueto-Felgueroso, G.; Cueto, M.; Cezón, A.; Ostolaza, J. SBAS performance analysis in equatorial regions. In Proceedings of the 28th International Technical Meeting of the Satellite Division of The Institute of Navigation (ION GNSS+ 2015), Tampa, FL, USA, 14–18 September 2015; pp. 1741–1753. [Google Scholar]
- Kelley, M.C. The Earth’s Ionosphere: Plasma Physics and Electrodynamics, 2nd ed.; Academic Press: San Diego, CA, USA, 1989. [Google Scholar]
- Burke, W.J.; Gentile, L.C.; Huang, C.Y.; Valladares, C.E.; Su, S.Y. Longitudinal variability of equatorial plasma bubbles observed by DMSP and ROCSAT-1. J. Geophys. Res. Space Phys. 2004, 109, A12301. [Google Scholar] [CrossRef]
- Basu, S.; Basu, S.; Groves, K.M.; Yeh, H.-C.; Su, S.-Y.; Rich, F.J.; Sultan, P.J.; Keskinen, M.J. Response of the equatorial ionosphere to the July 2000 magnetic storm. Geophys. Res. Lett. 2001, 28, 3577–3580. [Google Scholar] [CrossRef]
- Zhao, D.; Cui, S.; Zhang, X.; Li, L.; Sun, P.; Bian, C.; Ban, W.; Hancock, C.M.; Wang, Q.; Zhang, K. Analysis of Global Ionospheric Scintillation and GPS Positioning Interference Triggered by Full-Halo CME-Driven Geomagnetic Storm: A Case Study. Adv. Space Res. 2024, 74, 2492–2509. [Google Scholar] [CrossRef]
- Kil, H.; Lee, W.K.; Kwak, Y.-S.; Zhang, Y.; Paxton, L.J.; Milla, M. The Zonal Motion of Equatorial Plasma Bubbles Relative to the Background Ionosphere. J. Geophys. Res. Space Phys. 2014, 119, 5943–5950. [Google Scholar] [CrossRef]
- Orduy Rodriguez, J.E. A Cognitive Radio Approach for Ionospheric Scintillation Detection and Monitoring. Ph.D. Thesis, INPE, São José dos Campos, Brazil, 2025. [Google Scholar]
- Takahashi, H.; Wrasse, C.M.; Otsuka, Y.; Ivo, A.; Gomes, V.; Paulino, I.; Medeiros, A.F.; Denardini, C.M.; Sant’Anna, N.; Shiokawa, K. Plasma bubble monitoring by TEC and airglow imaging. J. Atmos. Sol.-Terr. Phys. 2015, 130–131, 151–158. [Google Scholar] [CrossRef]
- Vishnu Vardhan, A.; Pasumarthi, B.S.H.; Ratnam, D.V.; Upadhayaya, A.K. Low-latitude ionospheric response to the March 2015 storm. Astrophys. Space Sci. 2020, 365, 192. [Google Scholar] [CrossRef]
- European Space Agency. GAGAN (GPS Aided GEO Augmented Navigation). Available online: https://gssc.esa.int/navipedia/index.php/GAGAN (accessed on 8 July 2025).
- Krasuski, K.; Ciecko, A.; Bakuła, M.; Grunwald, G. Accuracy examination of SDCM in aerial navigation. Energies 2022, 15, 7776. [Google Scholar] [CrossRef]
- Federal Aviation Administration. WAAS Performance Analysis Report #85; FAA William J. Hughes Technical Center: Atlantic City, NJ, USA, 2023. [Google Scholar]
- European Union Agency for the Space Programme. EGNOS Safety of Life Service Definition Document; Issue 3.6; EUSPA: Prague, Czech Republic, 2024. [Google Scholar]
- Rajavarathan, J.; Dammalage, T.; Retscher, G.; Kealy, A. Performance analysis of GAGAN and Trimble RTX. In Proceedings of the International Global Navigation Satellite Systems Association (IGNSS 2020), Sydney, Australia, 5–7 February 2020. [Google Scholar]
- Federal Aviation Administration. Global Positioning System Wide Area Augmentation System Performance Standard; FAA: Washington, DC, USA, 2008. [Google Scholar]
- Airports Authority of India. Space Weather Effects on GAGAN; ICAO ISTF/4–WP/11; Airports Authority of India: New Delhi, India, 2014; Available online: https://canadacommons.ca/artifacts/28550824/space-weather-effects-on-gagan/29450677/ (accessed on 13 January 2026).
- European Satellite Services Provider. EGNOS Service Implementation Roadmap; ESSP: Toulouse, France, 2025. [Google Scholar]
- Sunda, S.; Sridharan, R.; Vyas, B.M.; Khekale, P.V.; Parikh, K.S.; Ganeshan, A.S.; Sudhir, C.R.; Satish, S.V.; Bagiya, M.S. Satellite-based augmentation systems: A novel and cost-effective tool for ionospheric and space weather studies. Space Weather 2015, 13, 6–15. [Google Scholar] [CrossRef]
- Panda, S.K.; Rajana, S.S.K.; Vivek, C.G.; Dabbakuti, J.R.K.K.; Jamir, W.; Jamjareegulgarn, P. Multi-Instrument Analysis of Ionospheric Equatorial Plasma Bubbles over the Indian and Southeast Asian Longitudes During the 19–20 April 2024 Geomagnetic Storm. Remote Sens. 2025, 17, 1100. [Google Scholar] [CrossRef]
- ACI-LAC. The 10 Busiest Airports in Latin America and the Caribbean. Available online: https://ala.aero/ (accessed on 16 May 2025).
- Aerocivil. 2024: Récord Histórico En Pasajeros y Carga Aérea. Available online: https://www.aerocivil.gov.co/ (accessed on 29 January 2025).
- Aeronáutica Civil de Colombia. Boletines Operacionales de Movilización Aérea—Rutas Domésticas 2024; Aeronáutica Civil de Colombia: Bogotá, Colombia, 2024. Available online: https://www.aerocivil.gov.co/publicaciones/4142/cerca-de-26859000-pasajeros-se-movilizaron-por-via-aerea-en-colombia-durante-primer-semestre-de-2024/ (accessed on 29 January 2025).
- Mosquera Medina, J.M.; Rincón García, C.Y. Propuesta de Emplazamiento para un Sistema SBAS en Colombia. Master’s Thesis, Fundación Universitaria Los Libertadores, Bogotá, Colombia, 2019. [Google Scholar]
- Singh, A.; Ramalingam, K.; Reddy, D.C.; Parayitam, L. Placement of WAAS reference stations for Indian airspace. In Proceedings of the Asian GPS Conference, New Delhi, India, 29–30 October 2001; pp. 85–90. [Google Scholar]
- ICAO. Global Air Navigation Plan 2016–2030, 5th ed.; Doc 9750; ICAO: Montreal, QC, Canada, 2016. [Google Scholar]
- Vani, B.C.; de Oliveira Moraes, A.; Salles, L.A.; Breder, V.H.F.; Freitas, M.J.D.S.; Monico, J.F.G.; de Paula, E.R. Monitoring ionospheric scintillations in South America. In GPS and GNSS Technology in Geosciences; Elsevier: Amsterdam, The Netherlands, 2021; pp. 255–280. [Google Scholar]
- Arenas, J.; Sardón, E.; Sainz, A.; Ochoa, B.; Magdaleno, S. Low-latitude ionospheric effects on SBAS. Radio Sci. 2016, 51, 603–618. [Google Scholar] [CrossRef]
- International Civil Aviation Organization (ICAO). Doc 9613: Performance-Based Navigation (PBN) Manual, 5th ed.; ICAO: Montreal, QC, Canada, 2023. [Google Scholar]
- Fellner, R. Analysis of EGNOS/GNSS parameters in Polish transport. Transp. Probl. 2014, 9, 16–38. [Google Scholar]
- Cezón, A.; Cueto, M.; Hidalgo, I.; Andrada, L. SACCSA—SBAS in the CAR/SAM regions. In Proceedings of the 23rd International Technical Meeting of the Satellite Division of The Institute of Navigation (ION GNSS 2010), Portland, OR, USA, 21–24 September 2010. [Google Scholar]
- Gunter’s Space Page. Inmarsat-3. Available online: https://space.skyrocket.de/ (accessed on 23 May 2025).
- Martinis, C.; Baumgardner, J.; Wroten, J.; Mendillo, M. All-sky imaging for ionospheric research. Adv. Space Res. 2017, 61, 1809–1819. [Google Scholar] [CrossRef]
- Li, W.; Song, S.; Jin, X. Ionospheric scintillation monitoring with ROTI. Radio Sci. 2022, 57, e2021RS007420. [Google Scholar] [CrossRef]
- Basu, S.; Groves, K.M.; Basu, S.; Sultan, P.J. Specification and forecasting of scintillations in communication/navigation links: Current status and future plans. J. Atmos. Sol.-Terr. Phys. 2002, 64, 1745–1754. [Google Scholar] [CrossRef]
- Rideout, W.; Cariglia, K. CEDAR Madrigal Database. Available online: https://cedar.openmadrigal.org (accessed on 12 December 2024).
- Gao, S.; Xiong, C.; Cai, H.; Pan, Q.; Zhan, W.; Zhang, H.; Zheng, Y. Predicting equatorial spread F at JICAMARCA sector via supervised machine learning. Space Weather 2025, 23, e2024SW004214. [Google Scholar] [CrossRef]
- Joshi, L.M.; Tsai, L.C.; Su, S.Y.; Caton, R.G.; Lu, C.H.; Groves, K.M. VHF scintillation and drift studied using spaced receivers in southern Taiwan. Radio Sci. 2019, 54, 455–467. [Google Scholar] [CrossRef]
- Zhang, Z.; Wang, N.; Liu, A.; Li, Z.; Li, A.; Wang, L.; Zhang, Y. Assessing 1-second ROTI for ionospheric perturbation monitoring using real-time multi-GNSS data in China. Space Weather 2025, 23, e2024SW004187. [Google Scholar] [CrossRef]
- International GNSS Service. Data Access and Distribution. Available online: https://igs.org/ (accessed on 28 December 2025).
- Dammalage, T.; De Silva, D.N.; Satirapod, C. Performance analysis of GAGAN over Sri Lanka. Eng. J. 2017, 21, 305–314. [Google Scholar] [CrossRef]
- Ratnam, D.V.; Sarma, A.D. Modeling of Indian Ionosphere Using MMSE Estimator for GAGAN Applications. J. Indian Geophys. Union 2006, 10, 303–312. [Google Scholar]
- Harsha, P.B.S.; Ratnam, D.V.; Nagasri, M.L.; Sridhar, M.; Raju, K.P. Kriging-Based Ionospheric TEC, ROTI and Amplitude Scintillation Index (S4) Maps for India. IET Radar Sonar Navig. 2020, 14, 1827–1836. [Google Scholar] [CrossRef]
- Panda, S.K.; Moses, M.; Ansari, K.; Walo, J. Ionospheric scintillation characteristics over Indian region from latitudinally-aligned geodetic GPS observations. Earth Sci. Inform. 2023, 16, 2675–2691. [Google Scholar] [CrossRef]
- Ghafoori, F.; Skone, S. Impact of equatorial ionospheric irregularities on GNSS receivers. Radio Sci. 2015, 50, 294–317. [Google Scholar] [CrossRef]
- Atabati, A.; Jazireeyan, I.; Alizadeh, M.; Langley, R.B. Prediction of Ionospheric Scintillation with ConvGRU Networks Using GNSS Ground-Based Data across South America. Remote Sens. 2024, 16, 2757. [Google Scholar] [CrossRef]
- Marques, H.A.; Monico, J.F.G.; Marques, H.A.S.; Susi, M.; Borio, D.; Park, J.; Wȩzka, K. Evaluating GPS and Galileo Precise Point Positioning (PPP) Under Various Ionospheric Conditions During Solar Cycle 25. Remote Sens. 2025, 17, 3169. [Google Scholar] [CrossRef]


Disclaimer/Publisher’s Note: The statements, opinions and data contained in all publications are solely those of the individual author(s) and contributor(s) and not of MDPI and/or the editor(s). MDPI and/or the editor(s) disclaim responsibility for any injury to people or property resulting from any ideas, methods, instructions or products referred to in the content. |
© 2026 by the authors. Licensee MDPI, Basel, Switzerland. This article is an open access article distributed under the terms and conditions of the Creative Commons Attribution (CC BY) license.