Abstract
Kapton and Mylar film materials are used to manufacture space inflatable antenna reflectors; therefore, their mechanical characteristics are considered important parameters for the design of inflatable antenna reflectors. This paper mainly introduces a series of experiments on the mechanical properties of Kapton VN and Kapton HN, and Mylar I and II film specimens, including film tensile tests, film seam tests with tape bonding and glue bonding, and skirt edge joint tests. Therefore, failure modes, stress versus strain curves, ultimate tensile strength, and extension at break are obtained for these specimens of Kapton VN and Kapton HN and Mylar I and II films. Based on these measured data, stress conditions of models with 12 and 18 sections using ANASYS are compared to identify the effect of different sections and pressures on the force of inflatable antenna reflectors.
1. Introduction
In recent years, demand for large-aperture, high-gain antennas in space missions has continued to grow. Traditional rigid antennas are limited by their large volume and weight, making it difficult to meet the demands of modern spacecraft for more lightweight structures and higher storage ratios [1,2]. Therefore, inflatable deployable membrane antennas have emerged as highly promising solutions due to their extremely low mass, exceptional folding/stowage efficiency, and relatively straightforward deployment mechanisms [3,4]. These antennas primarily rely on membrane materials being tensioned under pressure upon inflation to form specific reflective surfaces (e.g., paraboloids) or planar structures [5]. The latter often maintains its operational configurations with the aid of Miura Natori folding and unfolding mechanisms or multi-layer tensioning systems [6]. As the core functional component of the antenna, the performance of the membrane material directly determines the shape and position accuracy, electromagnetic performance, space environment tolerance, and overall service life of the antennas [5].
Inflatable antenna technology involves many different technical fields, including structure, mechanical engineering, material engineering, chemistry, surface engineering, engineering measurement, and space environment. The key technologies involved are mainly related to inflatable membrane material technology, inflatable antenna manufacturing technology, inflatable deployment technology of inflatable membrane material, and design and analysis technology of antenna structure. Among the numerous candidate materials, polyester film (e.g., Mylar) and polyimide film (e.g., Kapton) are widely used due to their excellent specific strength, weather resistance, and electrical properties, such as the high dielectric strength of Kapton [7,8]. It is indicated that as Kapton film has particularly outstanding low-temperature adaptability, it has become an ideal choice for working in the low-temperature environment of deep space [9]. However, although Mylar has a lower cost, its potential performance disparities and signal attenuation issues in high-frequency applications limit its use in certain high-performance scenarios [10]; its thermal, mechanical, and electrical properties are also highly dependent on processing techniques and handling conditions.
The mechanical properties of thin films are the critical foundation for the design and analysis of inflatable antenna structures. Firstly, precise parameters such as the elastic modulus, tensile strength, and elongation at break are prerequisites for load analysis and prediction of structural response. Secondly, after film form-finding, it is cut and sewn together to assemble a spatial curved surface. Since polymer films are not ideal elastic materials, significant residual strains and creep effects could occur during tensioning and long-term service. If these time-dependent effects are not fully considered during cutting, they will lead to relaxation of the film surface and tension loss after installation, consequently affecting the geometric accuracy and load-bearing performance of antenna [11]. Therefore, actual cutting patterns require shrinkage compensation design based on the tensile properties, creep characteristics, and structural stress state of the film material. Furthermore, thin films in actual structures are typically under a biaxial stress state, and their mechanical response may differ from those tested in uniaxial tests [12]. Also, thin film materials face challenges such as being prone to wrinkling and complexity of force at connection joints [13]. There have been numerous studies on the mechanical properties of Kapton and Mylar films. A study by Liu [9] demonstrated that Kapton polyimide foil exhibits highly nonlinear curves without a distinct yield point during uniaxial tensile tests conducted across the temperature range of −70 °C to +170 °C. When films are exposed to the orbital environment for a long time, they can undergo complex thermal cycling challenges. Research by V. A. Lototskaya [11] revealed the effects of long-term exposure at room temperature (simulating an orbital operation time range from 5 to 10 years) on the tensile mechanical properties of amorphous and partially crystalline Kapton H-type polyimide films of different thicknesses and produced by different manufacturers. It is shown that all the mechanical performance parameters tested, such as conditional elastic limit, fracture stress, total deformation, and elastic modulus, have changed, and variation patterns vary due to the differences in the crystallization state, thickness, and manufacturer of the film Spivack [12] compared the uniaxial and biaxial tensile properties of various polymer films, including Mylar, and pointed out that polyester films have limitations in terms of strength and ductility. Conversely, a study by Nowak [10] highlighted the decisive influence of flexible substrate materials (Kapton vs. Mylar) on the reliability of interconnections. Kapton has superior dimensional stability and interface strength retention after thermal aging.
Researchers are attempting to integrate various advanced materials into thin film systems to achieve more comprehensive performance enhancements. For instance, Wang [14] demonstrated that depositing Al/Si nanolaminated films on Kapton substrates could significantly enhance the resistance to plastic shear of material, and also exhibited a unique wrinkling failure mode under compressive loads. Furthermore, Oliva [15] demonstrated that the thermoresistive and piezoresistive properties of gold nanofilms have been successfully applied in real-time monitoring systems for MEMS devices. To enhance the functional diversity of thin films, various surface modification techniques have been introduced. For example, Hsu [16] proposed that after transferring aluminum–gallium–nitrogen/gallium nitride heterojunction (called AlGaN/GaN) films to a flexible Kapton substrate, they still maintained good performance on the flexible Kapton substrate. Similarly, Robert [17] proposed to prepare an alumina coating on the surface of Kapton by dry mist deposition, which not only significantly enhanced the hardness and wear resistance of Kapton, but also improved its radiation resistance and oxidation resistance. The study suggests that such multifunctional films are expected to play a significant role in future space missions.
Multi-scale challenges exist in the reliability of connection nodes of inflatable antenna films faces: at the process level, porosity in aluminum alloy welding is caused by hydrolysis of oxide film to produce hydrogen, while the risk of air tightness in the connection of polymer film materials mainly comes from the obstruction of the diffusion of interface molecular chains. Although the mechanisms are different, the surface control logic is the same [18]. In terms of strength optimization, as for the effect of knitted PU film thickness [19], domestic E-310 film materials can compensate for strength loss by increasing the width of laser welds. At the level of failure mechanism, similar to the study of aerospace composite joints, performance of connection nodes of inflatable antenna film materials is also jointly affected by the strength of the material itself and the stress distribution at the interface. It is shown [20] that failures under tensile loads mostly occur in the material itself rather than the bonding layer, which suggests that the design of film connections should focus on the accurate characterization of the mechanical properties of the substrate; Mahon pointed out that the mechanical behavior of polymer thin films at low temperatures is significantly different from that at room temperature, but the low-temperature test equipment for thin film samples is still a cutting-edge research direction. This poses a key challenge to material selection for inflatable antennas for deep space exploration. As this research on polymer dielectrics in superconducting electronic devices indicates, low-temperature environments significantly alter the mechanical responses of polymer films. However, the current low-temperature testing techniques for thin film materials are still not mature—this technological gap also restricts the reliability design of space-inflated antenna films [4]. The reliability of thin-film connecting nodes not only depends on the mechanical properties of the substrate (such as tensile strength), but is also controlled by the interface fracture toughness [21], which poses a risk for the design of inflatable antennas with high-order folding; Li, in his study, explains the phenomenon of crack resistance in a connection node of 0.05 mm thick Kapton HN, which is 22% higher than that of 0.025 mm thick samples in the test; this originated from the crack passivation effect of the thick-film nanocrystalline structure. Wang [22] used uniaxial tensile tests to quantify the membrane body properties and assessed the interfacial reliability through the shear test of a joint node (analogous to double lap shear) system.
As films of Kapton and Mylar are widely used in inflatable antennas, and they play a decisive role in the mechanical properties on antenna design and manufacture [23], this deployable antenna test successively adopted several different membrane materials including Kapton and Mylar, and can provide a comparison of the mechanical performances of these materials to some degree for the design parameters of such membrane materials. This experiment is mainly aimed at the manufacturing technology of inflatable antenna. Firstly, several kinds of film materials commonly used in the production of inflatable antenna are selected, including Kapton HN polyester film with a thickness of 0.025 mm, 0.05 mm thick Kapton IV polyester film, and Mylar polyester film with a thickness of 0.025 mm, and 0.050 mm for uniaxial tensile tests. The reflective surface is produced using a high-precision template to cut out 18 films and then connect them to explore effect of the different film connection methods on the mechanical performance of film materials by experimental testing. Finally, mechanical performance testing of the connection between the reflective surface film and the peripheral skirt was carried out.
2. Experiments
2.1. Film Tensile Test
2.1.1. Test Preparation
As the actual stress state of the membrane material in the structure is a biaxial stress state, theoretically, results measured by biaxial tensile test are closer to the actual values. However, due to the limitations of test equipment, a uniaxial tensile test scheme is adopted in this paper. This experiment was carried out in the central laboratory of Shanghai Taiyo Kogyo Company, Shanghai, China. Reflector film is the basis for the development of inflatable antennas. Although 0.025 mm thick Kapton HN, 0.05 mm thick Kapton IV polyimide film, and 0.025 mm thick Mylar polyester film have good space environment stability, they have been widely applied in aerospace, and no detailed experiment on their mechanical properties has been performed systematically. Therefore, in this paper, film deformation curve and mechanical feature analysis of Kapton and Mylar films were possible. The specimen is a long strip with a total length of L = 300 mm (manufacture error of less than 5 mm) and width of B = 50 mm (manufacture error of less than 1 mm), and the effective length was L = 200 mm. The Kapton polyamide film is considered to be an isotropic material, while the NAR light film requires two different sets of specimens in the longitudinal and latitudinal directions. The longitudinal specimen means that the length direction of the specimen is parallel to the warp direction of the film, and the latitudinal specimen means that the length direction of the specimen is parallel to the weft direction of the film. The specimen size is shown in Figure 1. The type and number of specimens are shown in Table 1.

Figure 1.
Dimension of the film specimen under uniaxial tensile test (mm).

Table 1.
Types and numbers of film specimens.
The test was carried out at a temperature of 20 °C, a humidity of 65%, and an atmosphere under pressure. Each specimen was pretensioned at first, the pretension force was 0.5 kN, and the preload speed was 5 mm/min. After that, the specimen was tensioned at a constant speed until failure and the moving speed of the was 200 mm/min. This test was performed by using the CHA-20KN Japanese MINEBEA tensile strength testing machine. The testing machine could carry out three kinds of tests, including tensile, peeling, and tearing. The length of the fixture as 75 mm and the width as 50 mm, which met the test requirements. The experiment equipment is shown in Figure 2.
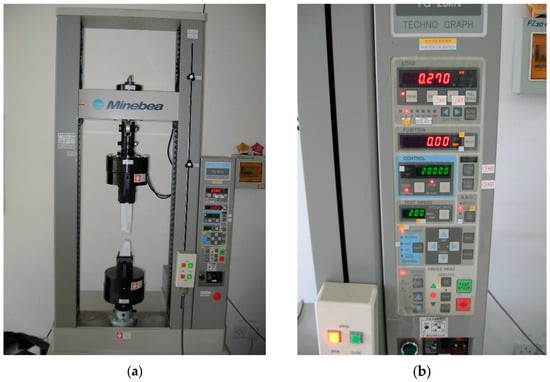
Figure 2.
Tensile strength testing machine: MINEBEA. (a) Tensile testing; (b) control panel.
2.1.2. Results and Discussion
Kapton Film
The Kapton HN technical parameters provided by the manufacturer are shown in Table 2. Figure 3 shows a comparison of Kapton HN, Kapton VN, and Kapton E-310 film specimens before and after experiment. The Kapton HN film specimens exhibit regular brittle fracture characteristics, with fractured fragments approximating a long strip shape, sharp and straight fracture edges, and no obvious signs of plastic deformation. The failure mode of Kapton VN films is a composite feature of fragmentation and local adhesion. After rupture, the Kapton E-310 film specimens show a tendency of irregular ductile fracture, with rough fracture edges accompanied by fine tearing traces, which form a significant difference from the straight fracture of HN films. Figure 4 displays the stress–strain curves of Kapton HN, Kapton VN, and Kapton E-310 film specimens during the failure process, and the ultimate tensile strength and elongation at break obtained from the three film tests, as provided by the manufacturers, are shown in Table 2 and Table 3. According to the tests of the above three types of polyamide membrane materials, the loading process of this kind of membrane material is obviously elastic–plastic to failure. According to the failure modes of Kapton HN and Kapton VN as shown in Figure 3, fracture of the two groups of specimens both occurred at the fixture. The reason for this phenomenon may be mainly due to the friction between the membrane specimen and the fixture. Fixtures generally have twill to increase friction. If the fixture is in direct contact with the film material, surface of the specimen in contact with the fixture will be damaged and thinned during the test, which leads to the failure of some specimens at the fixture.

Table 2.
Ultimate tensile strength and elongation at break obtained from three film tests.
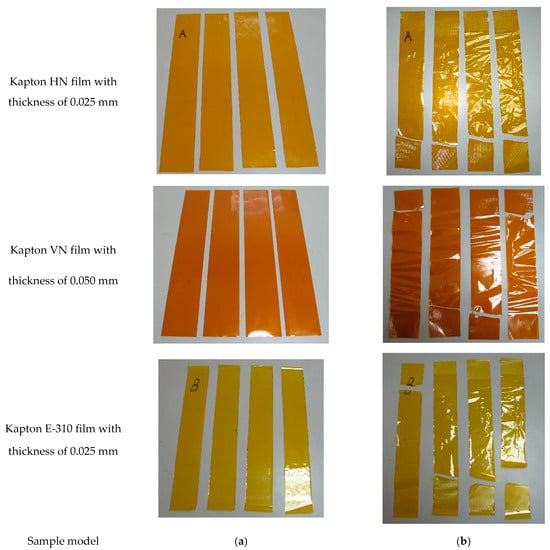
Figure 3.
Comparison of Kapton HN, Kapton VN, and Kapton E-310 film specimens before and after experiment. (a) Before test; (b) after test.

Figure 4.
Stress–strain curve of the specimens during the failure process. (a) Kapton HN; (b) Kapton VN; (c) E-310.

Table 3.
Ultimate tensile strength of Kapton 100HN film provided by manufacturers.
According to the experimental data of Kapton HN and Kapton VN, as shown in Table 2, the ultimate tensile strength and fracture elongation of Kapton VN are much larger than those of Kapton HN. From the failure modes of Kapton HN and E-310 with the same thickness, fracture of the two groups of membrane materials also occurred at the fixture. From the experimental data of Kapton HN and E-310, the ultimate tensile strength of Kapton HN is much greater than that of E-310, whereas the fracture elongation is roughly equal. According to Table 2, the average value of ultimate tensile strength of Kapton HN film in the experiment is much lower than the value provided by the manufacturer. This may be due to the manufacturer using a test specimen with a length of 150 mm and width of 25 mm, whereas this experiment tests a specimen length of 300 mm and width of 50 mm, so their sizes are different. Secondly, the moving speed of the fixture tested by the manufacturer is 50 mm/min different to the moving speed of the fixture in this experiment, at 200 mm/min. Thirdly, the specimen breaks at the fixture and does not really reach the failure strength of specimen material itself. Fourthly, the batches of specimens in the two tests are not the same, which may cause some differences in the data. Furthermore, the trends in each group of curves are close and in good agreement in terms of stress–strain curves. It can be said that experiments are very successful and the obtained parameters are relatively reliable.
Mylar Film
A comparison of Mylar I and Mylar II film specimens before and after the experiment is given in Figure 5. After the experiment, for Mylar I, local areas of the film were damaged, with obvious wrinkles on the surface. However, the overall structure roughly retained the long-strip-shaped matrix outline, and the fracture is not completely dispersed, showing the characteristic of localized concentrated damage. After the experiment, for Mylar II, the film had multi-segment fragmentation, and there was adhesion residue between some segments, presenting a segmented fracture morphology. Both of them had their original structural integrity damaged due to the action of external forces. Figure 6 displays that stress–strain curves of Mylar I and Mylar II film specimens during the failure process. The ultimate tensile strength and elongation at break of Mylar I and Mylar II film specimens are shown in Table 4. According to Figure 5, fracture of the two groups of membrane materials also occurs at the fixture, which may be mainly caused by the friction between the specimens and the fixture. From the above-mentioned Mylar tensile tests as shown in Figure 6, it can be seen that the loading process of this type of membrane material shows a quasi-ideal elastoplasticity, a linear elasticity at the beginning stage and then complete plasticity until the yield point. According to Table 4, for Mylar I and II, although the thickness of Mylar II is twice as high as the thickness of Mylar I, the ultimate tensile strength and extension at break of Mylar II is slightly lower, twice as low as those of Mylar I.
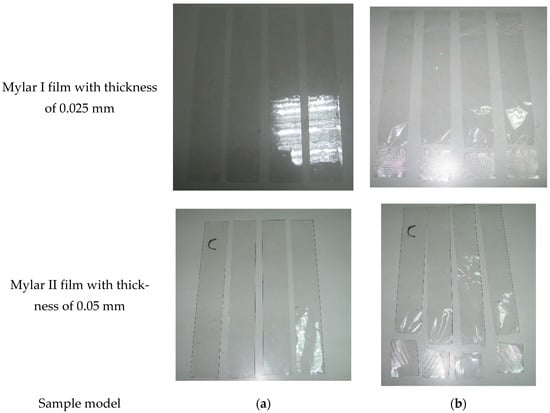
Figure 5.
Comparison of Mylar I and Mylar II film specimens before and after experiment. (a) Before test; (b) after test.
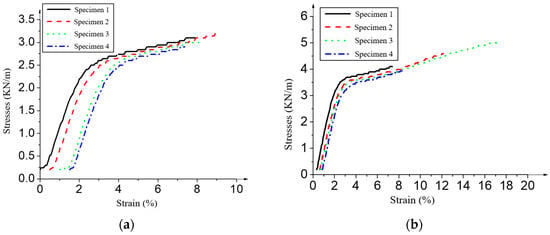
Figure 6.
Stress–strain curves of Mylar specimens during the failure process. (a) Mylar I; (b) Mylar II.

Table 4.
Ultimate tensile strength and elongation at break of Mylar I and Mylar II film specimens.
2.2. Film Seam Test
The reflective surface of an inflatable antenna has high precision and is precisely sewn together from multiple expandable films. The shape of the thin film is the basis for determining the precision of the reflective surface, but the sewing process is one of the key factors influencing the force and accuracy of the reflective surface. Common suture methods for the film are overlap and back paste joints. An overlap joint is not convenient for precise alignment, and the film is subjected to eccentric force, but the seam width is small. A back paste joint is convenient for precise alignment, and the film is subjected to ideal force, but the seam is wide (approximately 1.8 to 2 times the width of the overlap joint). Meanwhile, for the ground and space test environments, different back paste joint materials and processes are adopted to facilitate the test. The reflective surface was made by cutting out 18 thin films using a high-precision template and then connecting them as shown in Figure 7.
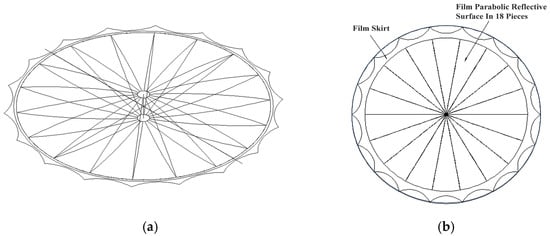
Figure 7.
Reflector plane diagram of inflatable antenna. (a) Three-dimension reflector. (b) Skirt and reflective surface.
In this experiment, two types of back paste joint methods were used: First was the back paste joint with adhesive tape. The type of adhesive tape, including colloid, thin-film, single-sided, and double-sided tape, as well as the manufacture process and tape width, were considered the test parameters. A back paste joint with adhesive tape is conducive to initial testing of surface cutting methods due to its quick manufacture. Second, back paste joints with glue, glue, back paste joints with a film strip (with the same material properties and thickness as the base film), width, and manufacture craft, including glue production and gluing process, were considered the main test factors. Adhesive bonding mainly focuses on state tests in a space environment and antenna life processes, such as flexibility, strength and curing, etc.
2.2.1. Experiments on Specimens with Tape Bonding
Test Preparation
The size of the specimen is shown in Figure 8. Its total length L is equal to 300 mm (manufacturing error of less than 5 mm), its width B is equal to 50 mm (manufacturing error of less than 1 mm), and the effective length L0 is equal to 200 mm. The midpoint is bonded with a tape back joint. Before the tape is bonded, the base film should be wiped clean with over 75% alcohol, and then it should be evenly rolled by hand to ensure that the tape is adhered evenly to the film after the tape is bonded. The tensile base materials were adopted by Kapton HN, Kapton VN, and Mylar (PET), and these tape widths were 10 mm, 15 mm, and 20 mm, respectively. The tape was adopted by Permcel® and its base material was adopted by DuPont Kapton®. In this test, the number of effective specimens in each group is 4, as shown in Table 5. Each specimen was pre-tensioned first; pre-tension force was controlled at 0.5 kN, and the pre-loading speed was 5 mm/min. After that, the specimen was tensioned at a constant speed until failure. The speed of constant-speed tension was a position velocity of 0.0081/s. As shown in Figure 9, the stress–strain curve was measured using a tensile testing machine.
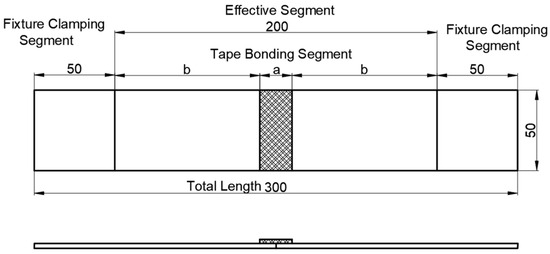
Figure 8.
Specimen dimensions of back adhesive joint with tape under uniaxial tensile test (mm).

Table 5.
Type and number of specimens using back adhesive joints with tape.
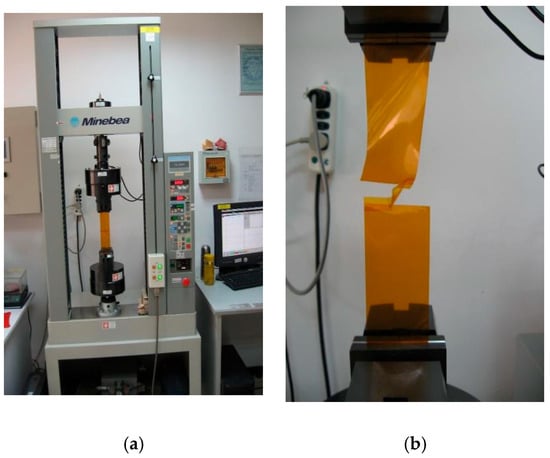
Figure 9.
Tensile testing machine and film specimen tensile test. (a) Tensile testing machine; (b) film specimen tensile test.
Results and Discussions
The failure modes of all 12 specimens of Kapton HN are shown in Figure 10. According to Figure 10a, it can be seen that three of the 10 mm tape specimens are torn open at the area with tape paste, whereas the remaining one is broken at the fixture. For the specimens with a tape width of 15 mm, two of them were torn open at the area with tape paste and two of them were broken at the fixture. Whereas, for the specimens with a tape width of 20 mm, four of them were all broken at the fixture. The failure modes of all 12 specimens of Kapton VN are shown in Figure 10a. It can be seen from Figure 10b that all the film materials are torn at the back paste joint of the middle tape, and none of them are damaged on the base metal. The failure modes of all 12 specimens of Mylar are shown in Figure 10c. It can be seen from Figure 10c that two of the 10 mm tape specimens are torn at the tape paste, whereas the other two are broken at the fixture. For the specimens with a tape width of 15 mm and 20 mm, they were all fractured at the fixture. Figure 11 presents the stress–strain curves of three types of film specimens (Kapton HN, Kapton VN, and Mylar) and tape with widths of 10 mm, 15 mm, or 20 mm. These curves reflect the mechanical property differences among the materials under different width conditions, providing basic data for analyzing their deformation and failure behaviors. Table 6, Table 7 and Table 8 present the ultimate tensile strength (in kN/m) and elongation at break (in %) of Kapton HN, Kapton VN, and Mylar films combined with Kapton tape specimens, respectively.
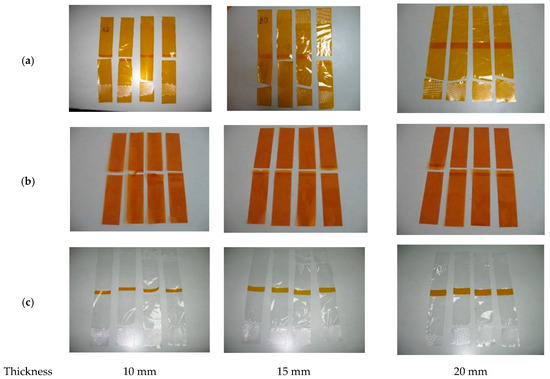
Figure 10.
Failure modes of three film specimens with tape. (a) Kapton HN; (b) Kapton VN; (c) Mylar.
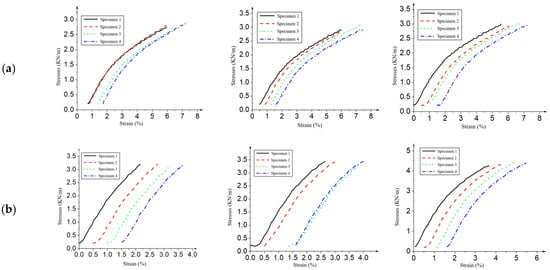

Figure 11.
Stress–strain curves of three film specimens and tape. (a) Kapton HN; (b) Kapton VN; (c) Mylar.

Table 6.
Ultimate tensile strength (kN/m) and elongation at break (%) of Kapton HN film with Kapton tape specimens.

Table 7.
Ultimate tensile strength (kN/m) and elongation at break (%) of Kapton VN film with Kapton tape specimens.

Table 8.
Ultimate tensile strength (kN/m) and elongation at break (%) of Mylar film with Kapton tape specimens.
For the Kapton HN film, when the thickness is 10 mm, after fracture, the upper and lower segments remain intact with high alignment. The film segments above and below the tape have almost the same length and width, the fracture surface is flat, and there is no obvious fragment splashing; when the thickness is 15 mm, after fracture, the fragmentation of the remaining upper and lower segments is obvious. Multiple small fragments appear on the film below the tape, the alignment of the upper and lower segments is poor, and some fragments are detached from the main body; when the thickness increases to 20 mm, the film fractures concentrate below the tape, the upper segment (above the tape) completely retains the long strip shape, and the lower segment (below the tape) is fragmented into multiple sections, with short lengths and wide dispersion. For the Kapton VN film, films of different thicknesses all fracture near the middle part, forming upper and lower segments, showing a segmented failure characteristic. After the film fractures, the fracture surface is relatively flat, there is no obvious fragment splashing or extremely irregular tearing, and fractures are relatively regular on the whole. Finally, for the Mylar film, the areas above and below the tape of the three types of widths all have deformation and damage. Due to the tape constraint changing the stress distribution, the fracture is concentrated near the constraint area. The narrower (10 mm) it is, the more likely it is to have stress concentration and severe deformation and damage; the wider (20 mm) it is, the more likely it is to disperse stress and have a more regular shape. According to the experimental results, it is found that the strength and deformation of the sewn film increase slightly as the width of the tape increases, but the increment is small, and both are smaller than the strength and deformation of the base material obtained in the previous test, which indicates that the widened tape does not effectively improve the strength and deformation of the thin film. Furthermore, the strength and deformation of the sewn Kapton VN specimen were only slightly increased compared with the those of the sewn Kapton HN specimen. However, the strength and deformation of the sewn Kapton VN specimen are only approximately 0.5 times greater than the tested results of the base Kapton VN. Therefore, it could be concluded that the strength and deformation of sewn film mainly depend on the characteristics of the tape film, and the width of the tape film should be reasonably matched with the viscosity of colloid, but not closely related to the strength and material properties of base tape film and the bonded film. The sewn Kapton with tape film has similar properties to the sewn Mylar film with tape film.
2.2.2. Experiments on Specimens with Glue Bonding
Test Preparations
The size of the specimen is shown in Figure 12. Its total length L is equal to 300 mm (manufacturing error of less than 5 mm), its width B is equal to 50 mm (manufacturing error of less than 1 mm), and the effective length L0 is equal to 200 mm. The middle part of the film specimen is back paste joined by gluing with the same film material as the base material. In this test, there were 4 specimens with different film widths of 10 mm, 15 mm, and 20 mm, respectively. Table 9 displays the type and number of specimens for the glue bonding test. It categorizes them by test specimen type (Kapton HN, Kapton VN, and 0.025 mm thick Mylar) and Kapton with glue bonding at widths of 10 mm, 15 mm, and 20 mm. For each combination of specimen type and bonding width, 4 specimens are used, which provides a clear experimental design framework for subsequent studies on the influence of glue bonding parameters on material performance.
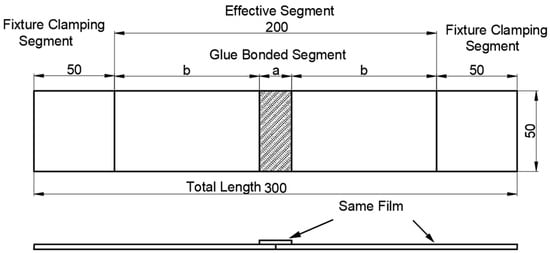
Figure 12.
Specimen dimensions of glue bonding under uniaxial tensile test (mm).

Table 9.
Type and number of specimens using glue bonding.
The midpoint is back paste jointed with glue. The glue is made by mixing epoxy resin 618 and epoxy resin 650 in a weight ratio of 1:1 and stirring evenly. The specimens were bonded at a temperature of 20 ± 2 °C and a humidity of 65 ± 2% under atmospheric pressure. Firstly, the film specimen was soaked in acetone with gauze, and then the adhesive surface was polished 3 to 4 times. Secondly, the glue was smeared evenly and thinned out, and then the film was aligned on the back, and the glue was expelled, squeezed, and rolled at the connection. Thirdly, the specimen was baked at a temperature of 55 ± 5 °C for 2.5 h after the pressing was completed. Finally, the specimens were tested as shown in Figure 13. The base materials of the films are Kapton HN, Kapton VN, and Mylar (PET), and the back tape film is the same material as the corresponding base films with widths of 10 mm, 15 mm, and 20 mm, respectively.
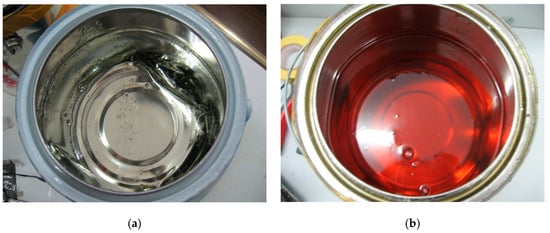
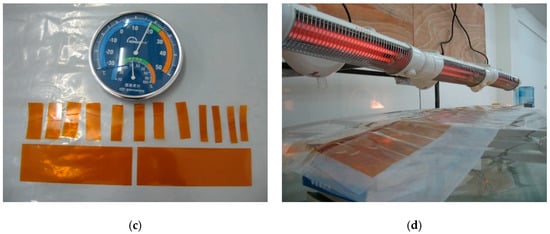
Figure 13.
Manufacture process of specimen. (a) Epoxy resin 618; (b) Epoxy resin 650; (c) preparation of specimens; (d) baking of specimens.
Results and Discussions
The failure modes of all 12 specimens are shown in Figure 14. It can be seen from Figure 14 that damage to all specimens of Kapton HN, VN, and Mylar occurs on the base material, and there is no damage at the back of the glue. Therefore, it is inferred that the glue bonding strength of these specimens is great enough to resist the tension force. By comparing the failure modes of the specimens with tape bonding, it could be concluded that glue bonding is a better option to connect two adjacent films. Figure 15 presents the stress versus strain curves of Kapton HN, Kapton VN, and Mylar films bonded with glue, systematically categorized by three width specifications: 10 mm, 15 mm, and 20 mm. For each film type, three sets of curves under different widths are displayed. These curves vividly depict the mechanical response processes of the glued films subjected to tensile loads. As strain increases, stress shows distinct variation trends, which reflect how glue bonding and width jointly influence the mechanical behaviors of materials. Table 10, Table 11 and Table 12 present the ultimate tensile strength (in kN/m) and elongation at break (in %) of Kapton HN, Kapton VN, and Mylar specimens bonded with glue, respectively. Each table organizes data by specimen group (10-X, 15-X, 20-X series) and shows the calculated mean values.
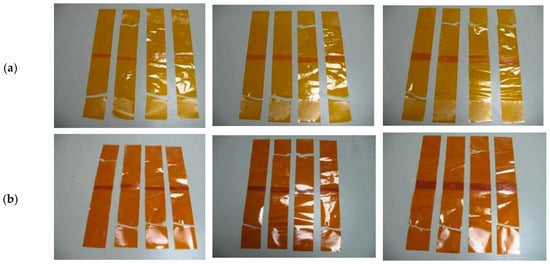

Figure 14.
Failure modes of Kapton HN film specimens with glue. (a) Kapton HN; (b) Kapton VN; (c) Mylar.
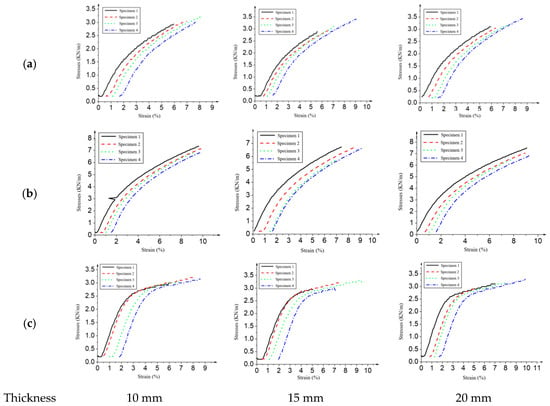
Figure 15.
Stress–strain curves of Kapton HN film with glue. (a) Kapton HN; (b) Kapton VN; (c) Mylar.

Table 10.
Ultimate tensile strength (kN/m) and elongation at break (%) of Kapton HN specimens with glue.

Table 11.
Ultimate tensile strength (kN/m) and elongation at break (%) of Kapton VN specimens with glue.

Table 12.
Ultimate tensile strength (kN/m) and elongation at break (%) of Mylar specimens with glue.
According to the aforementioned results, it was found that the strength and deformation of the sewn film increase slightly with the width of glue, which increases non-proportionally. The strength and deformation of glued film are slightly lower than those of the base material, whereas they were much higher than those of films with tape adhesion. According to the specimen failure behaviors, the main damage is mainly caused by the non-uniform stress on the edge of the adhesive, so that the local strength of the base material is too high to be torn under tension. Therefore, sewing strength is more importantly determined by manufacture craft, uniformity, and continuity of the glue edge. The adhesive strength of the glue itself is higher than the tear strength of the film. The glue adhesion of Kapton VN and Mylar film also have similar characteristics. The sewing strength of Kapton VN film with back adhesive bonding is over two times that of Kapton HN with back adhesive bonding. The sewing strength of Mylar film with back adhesive bonding is equivalent to that of Kapton HN film, and the difference between Mylar film adhesive and the base film is very small. Therefore, the effect of seam width on the sewing strength is very small.
2.3. Test of Skirt Edge Joint
The initial geometric design of the front and rear parabolic surfaces of the reflector of the inflatable antenna is completely symmetrical, and the upper and lower surfaces are lapped with the skirt film. The upper and lower parabolic surfaces are sealed as closed airbags. Under the action of internal air pressure, skirt edge junctions bear radial and circumferential tension of the membrane surface. The radial tension is decomposed into plane radial tension and vertical tearing force. Therefore, the tensile and tear performance tests of the skirt joint are important for design inspection.
The design of the specimen is shown in Figure 16a. The total length L is equal to 300 mm (manufacture error of less than 1.0 mm), the width of this specimen B is equal to 50 mm (manufacture error of less than 0.1), the effective length L0 is equal to 200 mm, the upper and lower surfaces of these specimens are Kapton HN film with a thickness of 0.025 mm, and the skirt edge is Kapton VN film with a thickness of 0.05 mm. The upper and lower films are bonded with the skirt film with glue, and the width of the adhesive tape is 15 mm. The midpoint of the upper and lower films could be supported by an aluminum alloy sheet as shown in Figure 16a, and its width is greater than 2.0 mm of the specimen film. The angle between the upper and lower films should be consistent with the angle between the tangent planes of upper and lower surfaces of the parabolic reflector. The glue production and bonding process are the same as the process as shown in Section 3, and the number of effective specimens is 4.
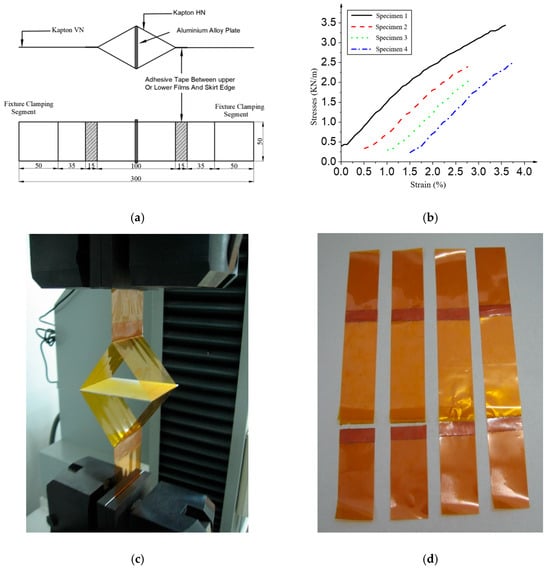
Figure 16.
Tensile test of skirt joint. (a) Skirt joint specimen. (b) Stress–strain curves of skirt joint. (c) Tensile test of specimen. (d) Specimen failure.
The test method is the same as the aforementioned tensile test method. Table 13 lists the summary results of experimental data, Figure 16b shows the stress–strain curves of the skirt joint under tensile test, and Figure 16c,d show the specimen test and failure state. Two specimens (No. 2 and 4) were disconnected at the same time between the reflective surface film and the skirt edge film in the sewing part, while only one reflective surface film was disconnected from the skirt edge film in specimens 1 and 3. The reason for suture damage is still that the edge of the cured glue body is not sufficiently smooth, and the film is torn by uneven force, but the cured glue body is not torn. Due to the production, the dispersion of test results is larger than that of previous test results. The strength and deformation are lower than those of the corresponding tests in Section 3.

Table 13.
Ultimate tensile strength (kN/m) and elongation at break (%) of skirted joints.
3. Numerical Analysis of Stress Conditions
For the numerical simulation, this study will be conducted on half of the reflective surface based on the actual designed model. The reflective surface film could be manufactured with Mylar film with a thickness of 0.025 mm, an elasticity modulus of 4.9 × 10⁹ Pa, and a Poisson’s ratio of 0.38, and the edge skirt film could adopt a Kapton film with thickness of 0.05 mm, an elasticity modulus of 2.5 × 10⁹ Pa, and a Poisson’s ratio of 0.34. The elasticity modulus and Poisson’s ratio of the edge cable are, respectively, 165 × 109 Pa and 0.3. Figure 17 shows a schematic diagram and FE model of the parabolic membrane antenna structures. The reflector surface and skirt edge can be numerically simulated by using shell41 elements and the edge cable can be created by using link1 elements in ANSYS 2024 software. The external 18 points and 12 points should be fixed and the connection section between the reflector surface and the skirt edges should be fixed in one direction as shown in Figure 16c and Figure 17b. The mechanical behaviors of three types of models including an ideal model, a model with 12 sections, and a model with 18 sections under various internal pressures are compared. For the ideal model, the reflector surface is considered one parabolic membrane surface. For the models with 12 and 18 sections, the reflector surface is sectioned into 12 and 18 sections. Two adjacent sections are connected by glue with a width of 10 mm and a thickness of 3 μm, and a membrane belt with width of 10 mm, as shown in Figure 17a. The prototype equation for the ideal model, the model with 12, sections and the model with 18 sections is x2 + y2 = 13,212.619z.

Figure 17.
Schematic diagram and FE models of the parabolic membrane antenna structures. (a) Bonded seam (mm); (b) 18 sections; (c) 12 sections.
Figure 18 shows that displacement contours in the z direction of three types of FE parabolic membrane models. Figure 19 shows the stress contours of three types of FE models. The strain contours of the three types of FE models are described in Figure 20. According to Figure 18, the maximum displacement in the z direction is 4.17 mm, occurring on the top of the reflector as shown in Figure 18a, whereas the maximum deformations in the x and y directions both occur in the vicinity of skirt edges. For the ideal model, the maximum stress of the model under an internal pressure of 25 Pa can be observed at the edge of the reflector, as shown in Figure 19a, with a magnitude of 4.03 MPa. According to Figure 20a, the maximum strain of the model is 1.118 × 10⁻³, existing on the 18 edge points. For the model with 12 sections, the maximum displacement of the model occurs under an internal pressure of 25 Pa is 9.529 mm, occurring at the edge area of the reflector surface and distributing uniformly in the circumferential direction, whereas the minimum displacement appears on the skirt. However, the maximum displacement of the model with 12 sections under 25 Pa in the x and y directions is 1.107 mm, far less than that in the z direction. Maximum stress and strain happen on the tension point of the skirt edge and their magnitudes are, respectively, 12.3 MPa and 5.31 × 10⁻³, whereas minimum stress appears at the central area of the skirt edge, and minimum strain exists on the largest reflector surface, as shown in Figure 19b. For the model with 18 sections, maximum displacement in the z direction of the model under 25 Pa is 5.745 mm in the vicinity of the reflector edge, whereas minimum displacement occurs on the skirt edge. Maximum displacement in the x and y directions, respectively, appear in left and right symmetric regions or the upper and lower symmetric regions, at 0.796 mm, far less than that in the z direction. Maximum stress occurs at the blossom shape of the reflector center, as shown in Figure 19c, with a value of 3.65 MPa, whereas maximum strain can be found on the tension points, with a magnitude of 0.945 × 10⁻³. Table 7 shows the maximum displacement in the z direction and the stress and strain of three types of models under pressures of 25 Pa, 35 Pa, and 50 Pa. According to Table 14, maximum displacements in the z direction of the ideal model under pressures of 25 Pa, 35 Pa, and 50 Pa are the minimum, whereas those of the model with 12 sections are the maximum. The maximum stresses and strains of the model with 18 sections are the lowest in comparison with the other two types of models. Therefore, the mechanical characteristics of the model with 18 sections under internal pressures of 25 Pa, 35 Pa, and 50 Pa can be superior to those of the model with 12 sections under internal pressures of 25 Pa, 35 Pa, and 50 Pa.

Figure 18.
Displacement contours in the z direction of three types of FE models. (a) Ideal model. (b) Model with 12 sections. (c) Model with 18 sections.

Figure 19.
Stress contours of three types of FE models. (a) Ideal model. (b) Model with 12 sections. (c) Model with 18 sections.

Figure 20.
Strain contours of three types of FE models. (a) Ideal model. (b) Model with 12 sections. (c) Model with 18 sections.

Table 14.
Maximum displacement in z direction, stress and strain of three types of models under pressures of 25 Pa, 35 Pa, and 50 Pa.
4. Conclusions
Firstly, this paper briefly introduces the experiments on Kapton HN, Kapton VN, and Mylar film to obtain ultimate tensile and extension at break for the design of inflatable deployable antenna reflectors. A series of film tensile tests, film seam tests, and tensile tests on skirt edge joints are performed to compare the failure modes and the stress–strain curves of Kapton HN, Kapton VN, and Mylar films. Stress analyses of curved surface models with 12 and 18 sections were performed by using ANASYS, and are compared.
According to tensile film tests, the ultimate tensile strength and elongation at break of Kapton VN are much greater than those of Kapton HN. The ultimate tensile strength of Kapton HN is much greater than that of Kapton E-310, while the elongation at break is approximately the same between them. According to the Mylar film test, it can be shown that its loading process shows a quasi-ideal elastic–plastic, linear elasticity at the beginning until full plasticity is reached at the yield point. From the failure modes of Mylar, both groups of film specimens broke at the fixture due to the frictional force existing between the membrane materials and the fixture.
For film seam tests, the strength and deformation of sewn films mainly depend on the characteristics of the tape film, and the width of the tape film should be reasonably matched with the viscosity of colloid, but not closely related to the strength and material properties of base tape film and bonded film. It is estimated that glue bonding is a better option to connect two adjacent films. The adhesive strength of glue itself is higher than the tear strength of the films. The sewing strength of Kapton VN film with back adhesive bonding is over two times that of Kapton HN with back adhesive bonding.
For stress conditions, the maximum displacements in the z direction of the ideal model under pressures of 25 Pa, 35 Pa, and 50 Pa are low, whereas those of the model with 12 sections are high. The maximum stresses and strains of the model with 18 sections are low in comparison with the other two types of models. Therefore, the mechanical characteristics of the model with 18 sections under internal pressures of 25 Pa, 35 Pa, and 50 Pa can be superior to those of the model with 12 sections under internal pressures of 25 Pa, 35 Pa, and 50 Pa.
Author Contributions
Conceptualization, Y.H.; methodology, Y.H.; software, E.Q.; validation, Y.H.; formal analysis, R.G.; investigation, R.G.; resources, E.Q.; data curation, W.C.; writing—original draft preparation, Y.H.; writing—review and editing, Y.H.; visualization, R.G.; supervision, W.C.; project administration, W.C.; funding acquisition, Y.H. All authors have read and agreed to the published version of the manuscript.
Funding
The first author acknowledges and thanks the research and financial support provided by the Wuhan Talent Project for Excellent Youth (No. 45222071) and the Hubei Province government for the overseas youth talent project.
Data Availability Statement
Data are contained within the article.
Conflicts of Interest
The authors declare no conflicts of interest.
References
- Shinde, S.D.; Upadhyay, S.H. Numerical and experimental study on novel tensioning method for the inflatable paraboloid reflector antenna. Mech. Based Des. Struct. Mach. 2024, 52, 54–71. [Google Scholar] [CrossRef]
- Shinde, S.D.; Upadhyay, S.H. The novel design concept for the tensioning system of an inflatable planar membrane reflector. Arch. Appl. Mech. 2021, 91, 1233–1246. [Google Scholar] [CrossRef]
- Huang, H.; Guan, F.-L.; Tang, Y.-S.; Xu, Y. Material mechanical property tests and reflector profile analysis for inflatable antenna. Zhejiang Daxue Xuebao/J. Zhejiang Univ. 2015, 49, 776–781. [Google Scholar]
- Mahon, J.; Pagliocca, N.; Harnack, V.; Koohbor, B.; Krchnavek, R.; Xue, W. Design and Implementation of a Thin Film Tensile Testing Apparatus for Cryogenic Applications. Exp. Tech. 2023, 47, 817–826. [Google Scholar] [CrossRef]
- Liu, Z.-Q.; Qiu, H.; Li, X.; Yang, S.-L. Review of Large Spacecraft Deployable Membrane Antenna Structures. Chin. J. Mech. Eng. 2017, 30, 1447–1459. [Google Scholar] [CrossRef]
- Xu, Y.; Guan, F.; Guan, Y. Precision analysis and shape adjustment of inflatable antenna. Chin. J. Space Sci. 2006, 26, 292–297. [Google Scholar] [CrossRef]
- Lan, Y.; Xi, Y.; Xiong, W.; Liu, X.; Wang, Z.; Huang, S.; Lin, J.; Yin, C.; Li, X.; Zhou, L. The effect of temperature on the roll graphite films derived from Kapton polyimide films. Appl. Phys. A 2024, 130, 497. [Google Scholar] [CrossRef]
- Chouhan, S.; Adak, B.; Butola, B.S.; Joshi, M. Mechanical and Gas Barrier Properties of Naturally and Artificially Weathered High-Performance Fiber Reinforced Laminated Structures for Stratospheric Airship Envelope. Fibers Polym. 2025, 26, 2609–2624. [Google Scholar] [CrossRef]
- Liu, Y.; Liu, Y.; Lin, G. Uniaxial tensile mechanical tests of Kapton foil at high-low temperature conditions. Aircr. Eng. Aerosp. Technol. 2021, 93, 1043–1051. [Google Scholar] [CrossRef]
- Nowak, D.; Dziedzic, A.; Żaluk, Z.; Roguszczak, H.; Węglarski, M. Mechanical properties of SMD interconnections on flexible and rigid substrates. Solder. Surf. Mt. Technol. 2016, 28, 27–32. [Google Scholar] [CrossRef]
- Lototskaya, V.A.; Yakovenko, L.F. Relaxation of the mechanical properties of polyimide films of the kapton H type during long-term exposure at ambient conditions. Low Temp. Phys. 2023, 49, 1222–1228. [Google Scholar] [CrossRef]
- Spivack, M.A. Mechanical Properties of Very Thin Polymer Films. Rev. Sci. Instrum. 1972, 43, 985–990. [Google Scholar] [CrossRef]
- Zhang, J.; Chen, Y.; Xu, W.; Wang, X.; Liu, R.; Kou, Z. Numerical Analysis of Wrinkles-Influencing Factors of Membrane Under Tensile Load. Gongcheng Kexue Yu Jishu/Adv. Eng. Sci. 2023, 55, 191–201. [Google Scholar]
- Wang, M.; Wang, D.; Schaaf, P. Size effect on the mechanical behavior of Al/Si multilayers deposited on Kapton substrate. J. Mater. Sci. Mater. Electron. 2015, 26, 8224–8228. [Google Scholar] [CrossRef]
- Oliva, A.I.; Ruiz-Tabasco, L.; Ojeda-Garcia, J.; Corona, J.E.; Sosa, V.; Avilés, F. Effects of temperature and tensile strain on the electrical resistance of nanometric gold films. Mater. Res. Express 2019, 6, 066407. [Google Scholar] [CrossRef]
- Hsu, K.-L.; Wu, M.-C. Fabrication and Characterization of Flexible AlGaN/GaN HEMTs on Kapton Tape. IEEE Trans. Electron Devices 2021, 68, 3320–3324. [Google Scholar] [CrossRef]
- Calvo, R.; Fuierer, P. Mechanical integrity of ceramic coatings on Kapton made by a dry aerosol deposition of lunar mare simulant. Int. J. Appl. Ceram. Technol. 2023, 20, 395–409. [Google Scholar] [CrossRef]
- Gou, W.; Wang, L.; Jia, Q.; Liu, D. Effect of surface oxide film on the performance of MIG welded joints in aluminum alloys. J. Phys. Conf. Ser. 2024, 2691, 012060. [Google Scholar]
- Gita, B.; Eugenija, S.; Virginijus, U.; Sigitas, K. The Effect of Bonded Seams upon Spatial Behaviour of Knitted Materials Systems. Mater. Sci./Medzg. 2015, 21, 271–275. [Google Scholar]
- Moroni, F.; Pirondi, A.; Pernechele, C.; Vescovi, L. Comparison of Tensile Strength and Fracture Toughness of Co-Bonded and Cold-Bonded Carbon Fiber Laminate-Aluminum Adhesive Joints. Materials 2021, 14, 3778. [Google Scholar] [CrossRef]
- Li, C.H.; Dedoncker, R.; Li, L.W.; Sedghgooya, F.; Zighem, F.; Ji, V.; Depla, D.; Djemia, P. Mechanical properties of CoCrCuFeNi multi-principal element alloy thin films on Kapton substrates. Surf. Coat. Technol. 2020, 402, 126474. [Google Scholar] [CrossRef]
- Wang, Z.D.; Weber, H.W. Kapton film effect on the mechanical strength of ITER TF coil candidate insulation. Mech. Mater. 2005, 37, 113–120. [Google Scholar] [CrossRef]
- Vallabh, R.; Li, A.; Bradford, P.D.; Kim, D.; Seyam, A.F.M. Ultra-lightweight fiber-reinforced envelope material for high-altitude airship. J. Text. Inst. 2022, 113, 1799–1805.8. [Google Scholar] [CrossRef]
Disclaimer/Publisher’s Note: The statements, opinions and data contained in all publications are solely those of the individual author(s) and contributor(s) and not of MDPI and/or the editor(s). MDPI and/or the editor(s) disclaim responsibility for any injury to people or property resulting from any ideas, methods, instructions or products referred to in the content. |
© 2025 by the authors. Licensee MDPI, Basel, Switzerland. This article is an open access article distributed under the terms and conditions of the Creative Commons Attribution (CC BY) license (https://creativecommons.org/licenses/by/4.0/).