Article

Simulation Study of Gas Cooling for Aero-Engine Borescope Probes

1
Air Force Engineering University, Xi’an 710038, China
2
School of Energy and Power Engineering, Xi’an Jiao Tong University, Xi’an 710049, China
*
Author to whom correspondence should be addressed.
Aerospace 2025, 12(9), 852; https://doi.org/10.3390/aerospace12090852
Submission received: 22 July 2025 / Revised: 7 September 2025 / Accepted: 16 September 2025 / Published: 21 September 2025
(This article belongs to the Section Aeronautics)

Abstract

After an aero-engine shuts down, the high temperature within the core flow path prevents conventional borescope probes from performing immediate internal inspections due to their limited thermal resistance, thereby constraining rapid turnaround capabilities for aircraft. To address this challenge, this study proposes an active cooling strategy using coolant flow to keep the probe within a safe temperature range. Three cooling structures incorporating pressure-drop modules—annular, annular-slit, and round-hole configurations—were designed and numerically investigated to assess the effects of geometric parameters and coolant properties (temperature, pressure, nitrogen mixing ratio) on cooling performance. The results demonstrate that the round-hole structure with a 1.0 mm diameter achieves optimal cooling, maintaining an average probe mirror temperature of 286.2 K under coolant conditions of 285 K and 0.5 MPa. Cooling efficiency exhibits a strong linear negative correlation with coolant temperature, while its relationship with pressure is highly structure-dependent. Nitrogen doping significantly improves the heat transfer capacity of the coolant. The implemented three-stage pressure-drop module performs consistently, with the pressure loss per stage determined solely by the inlet pressure. This study provides valuable insights and a theoretical foundation for the design of high-temperature-resistant borescope equipment capable of operating in the harsh environments of aero-engines.

1. Introduction

The aero-engine, a highly complex and precise thermomechanical system, is often referred to as the “heart” of an aircraft [1]. Its operational condition is critical to flight safety, with common faults threatening safe operation often occurring in critical components such as the compressor, combustion chamber, and turbine [2,3]. Consequently, regular inspection of the engine’s internal gas path is essential for ensuring operational reliability and flight safety. Borescope inspection has become a primary non-destructive testing method for examining these internal structures without requiring dismantling [3].
However, following engine shutdown, the core gas path retains extremely high temperatures, typically ranging from 800 K to 900 K, for several hours [4]. Conventional borescope probes are limited by the thermal resistance of their key components (e.g., CCD/CMOS image sensors, optical elements, and electronic circuits), which cannot reliably operate above approximately 400 K [5]. This thermal constraint necessitates a prolonged cooling period before inspection can begin, significantly delaying aircraft turn-around and mission readiness. Although some industrial borescope manufacturers offer probes with enhanced high-temperature resistance, the underlying technology is often proprietary and remains poorly documented in publicly available content or documentation.
To address this thermal management challenge for borescope probes operating in high-temperature environments, two primary active cooling strategies have been investigated: gas film cooling and liquid cooling. The main focus of this paper is to study the cooling effect of cooling airflow on borescope probes.

1.1. Influence of Film Cooling Hole Geometry

Studies on gas film cooling have primarily focused on the structural design of cooling holes and pressure differential configurations. For instance, Li et al. [6] investigated the thermal protection performance of an infrared temperature measurement probe for turbine blades, optimizing the number and diameter of film-cooling holes. Lu et al. [7] compared the cooling characteristics of round, fan-shaped, and expanded holes under various pressure drops, concluding that increased pressure drop improves cooling effectiveness. Zhang et al. [8] numerically evaluated the cooling efficiency of three hole types—plain cylindrical holes, sister holes, and slitted cylindrical holes—and found that slitted sister holes performed best at low blowing ratios, while slitted cylindrical holes excelled at higher blowing ratios. Zhang et al. [9] further compared cylindrical, convergent–divergent, and anti-vortex holes, noting that anti-vortex holes provided superior cooling coverage due to suppressed kidney vortex formation. Goldstein et al. [10] emphasized the effect of hole geometry and density on three-dimensional film cooling in their foundational work. The results indicate that the effects of hole geometry, secondary fluid density, and mainstream boundary layer thickness on film-cooling effectiveness were described. A significant improvement in film-cooling efficiency was observed by widening the coolant channel before the secondary fluid was discharged. Lee and Kim [11] conducted research on fan-shaped holes used for film cooling to enhance film-cooling effectiveness. The study selected the injection angle, lateral expansion angle, and length-to-diameter ratio of the holes as design variables and evaluated the effects of these variables on cooling performance. Saumweber and Schulz [12] analyzed the effect of geometry variations on the cooling performance of fan-shaped cooling holes. Dhungel et al. [13] studied film-cooling from a row of holes supplemented with anti-vortex holes. Using the transient infrared thermography technique, both the heat transfer coefficient and film-cooling effectiveness were simultaneously measured in a single experiment in the region downstream of the film-cooling hole.
Other researchers [14,15,16,17,18] have also emphasized the importance of hole shape, compound angle, and blowing ratio on cooling efficiency.
However, these studies predominantly focused on the influence of single factors, such as hole geometry or pressure difference, while lacking a comprehensive analysis combining both structural and coolant parameters for borescope probe cooling.

1.2. Alternative Cooling Media and Methods

In addition to gas cooling, other cooling mediums such as mixed gases and liquids have been explored. Zhang et al. [19] proposed a high-efficiency gas cooling system using a helium–nitrogen mixture cooled via micro-vortex tubes, achieving a heat removal rate of 120 W/cm2 in a 1.2 mm diameter probe. Another approach involves liquid cooling. Zhang et al. [20] designed a sensor probe integrated with thermal barrier coating, film-cooling holes, and an internal cooling structure, demonstrating that internal turbulators enhance heat transfer. Shi et al. [21] analyzed supercritical-pressure fuel cooling in a multi-channel configuration and evaluated the effects of flow direction, rate, and temperature. Ye et al. [22] designed a cooling structure for an infrared temperature measurement probe, optimizing coolant pressure and flow rate to balance cooling effectiveness and mainstream interference. Hsu et al. [23] developed a compact long-wavelength infrared (LWIR) borescope operating in the 8–14 mm wavelength band for non-contact two-dimensional surface temperature measurements in gas turbine engines. The system effectively minimizes interference from high-temperature gases and soot and incorporates a water-cooling design to withstand extreme operating conditions.
While these studies provide valuable insights into coolant properties and internal channel design, they do not systematically address the combined effects of cooling structure and coolant parameters for borescope probe applications.

1.3. Research Gap and Proposed Contribution

In summary, previous studies have predominantly examined the influences of cooling hole geometry and coolant parameters in isolation, thereby lacking a systematic approach that integrates both structural and medium-related factors. This gap is particularly evident in the context of aero-engine borescope applications, where targeted and efficient cooling solutions are critically needed. To address these limitations, the present study introduces the following innovations: (1) the design of three distinct cooling configurations—annular-, slit-, and hole-type—each integrated with a three-stage pressure reduction module; (2) a comprehensive systematic investigation of the effects of key parameters, including cooling structure dimensions (ring width, slit width, hole diameter), coolant temperature, pressure, and nitrogen mixing ratio, on the mirror temperature distribution, cooling efficiency, and film coverage characteristics of the borescope probe. This work aims to identify the optimal cooling configuration and operational parameters, providing a theoretical foundation and technical strategy for enabling immediate borescope inspection in high-temperature engine environments.

2. Structural Model

2.1. Aero-Engine Borescope Probe Cooling Model

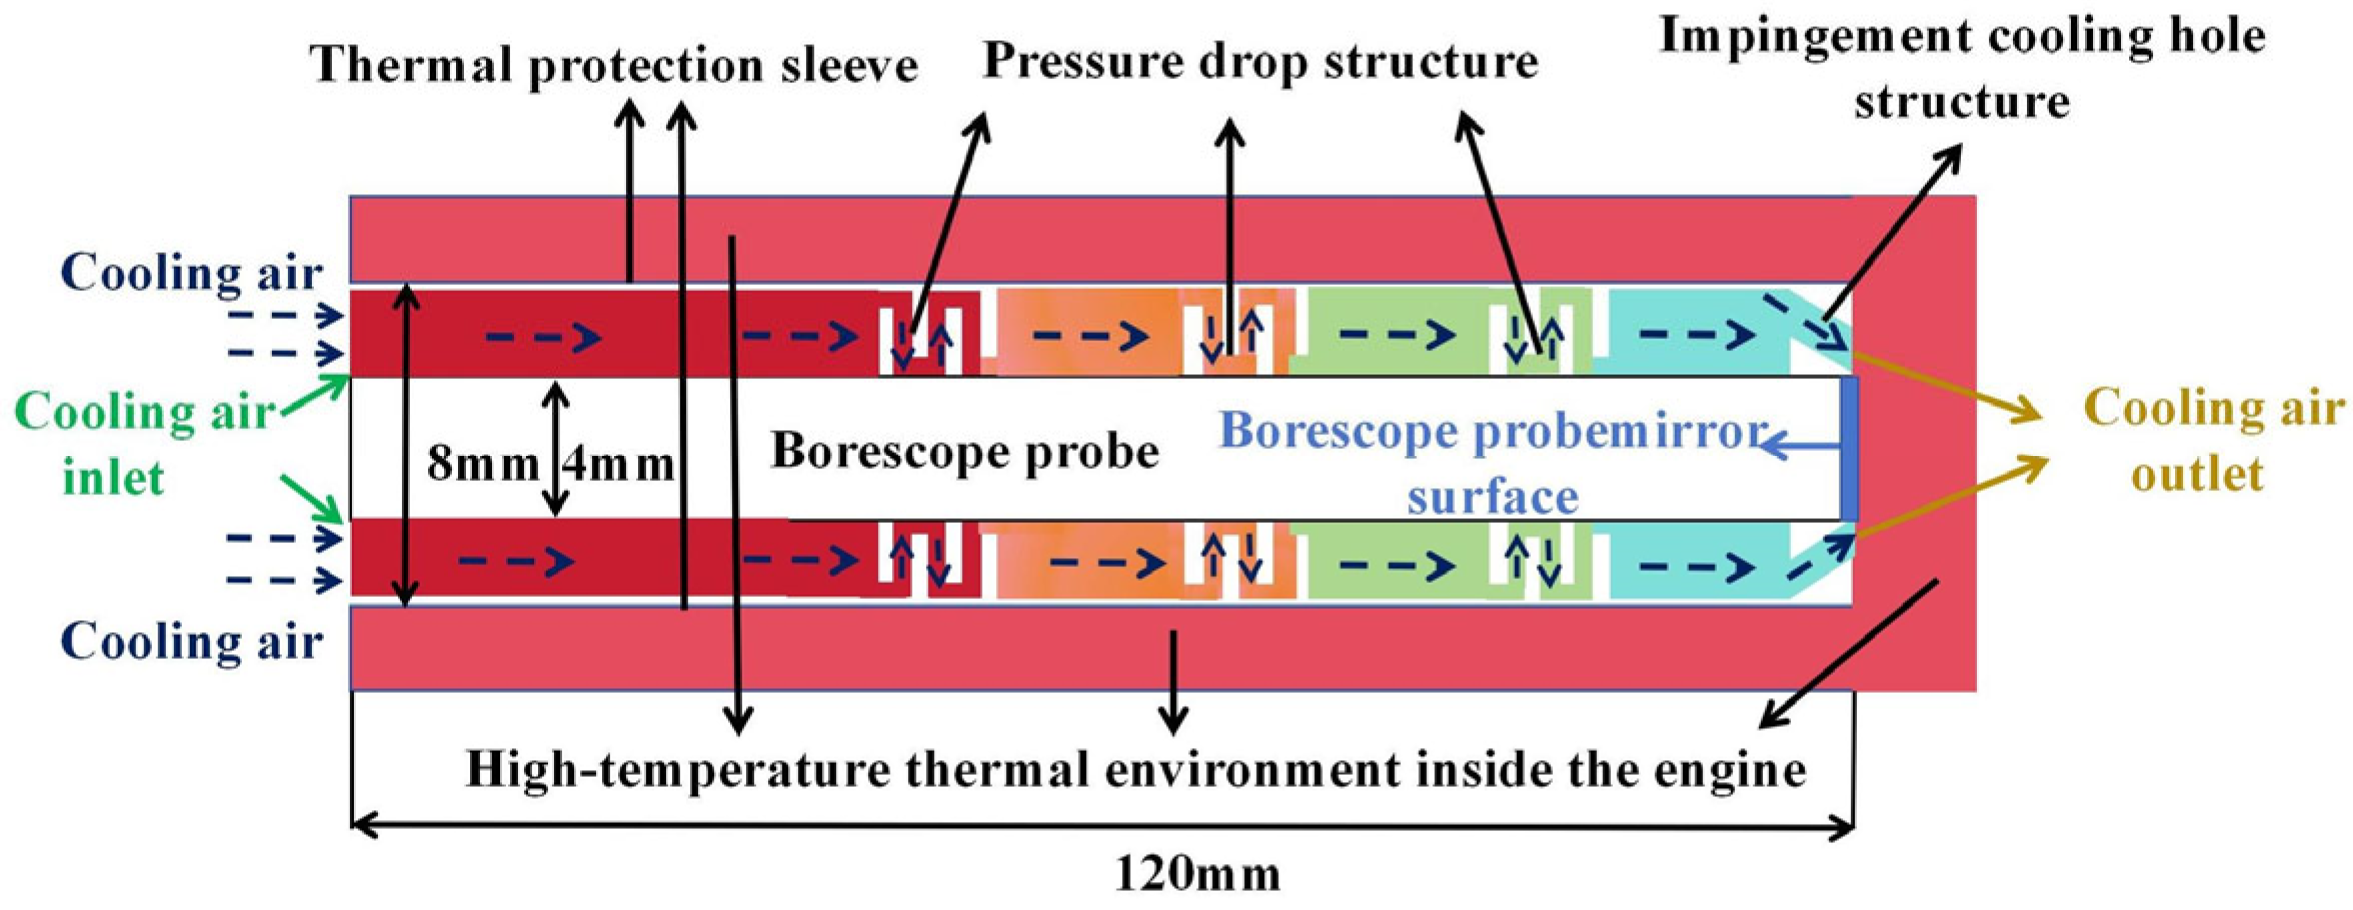
The cooling model for the aero-engine borescope probe comprises the probe itself, the probe mirror, a film-cooling structure, a thermal protection jacket, and a pressure-drop structure. In the hole probe cooling model, the front end of the probe is the probe mirror, the outer wall of the probe is the thermal protection jacket, and between the probe and the thermal protection jacket is the cooling airflow channel; the model is shown in Figure 1.
An impingement cooling hole structure is integrated between the thermal protection jacket and the mirror housing of the borescope probe. By optimizing the parameters of the cooling configuration, a low-temperature cooling airflow at a specified pressure is introduced to generate a continuous air film over the mirror surface. This air film establishes a localized cooling temperature field, thereby providing efficient thermal protection and ensuring stable operation of the probe under high-temperature conditions in the engine’s internal flow passage after shutdown—where ambient temperatures significantly exceed the probe’s standard operational limits. In accordance with standard borescope dimensions and engineering practices, the simulation parameters in this study are defined as follows: the insertion length of the thermal protection jacket into the high-temperature environment is set to 120 mm, the probe diameter is 4 mm, and the outer diameter of the thermal protection jacket is 8 mm.

2.2. Physical Model of Borescope Probe Impingement Cooling Hole

The impact cooling holes of the borescope probe serve as exits through which low-temperature cooling air exchanges heat with the high-temperature environment within the engine’s core flow path. These holes also play a critical role in establishing a protective cooling gas film over the probe mirror. The configuration and structural parameters of these holes significantly influence the cooling performance of the mirror. When the centerline of a cooling hole is not parallel to the direction of the cooling airflow, it is referred to as a compound-angle hole [24], which has been demonstrated to enhance film-cooling effectiveness [14,15,16].
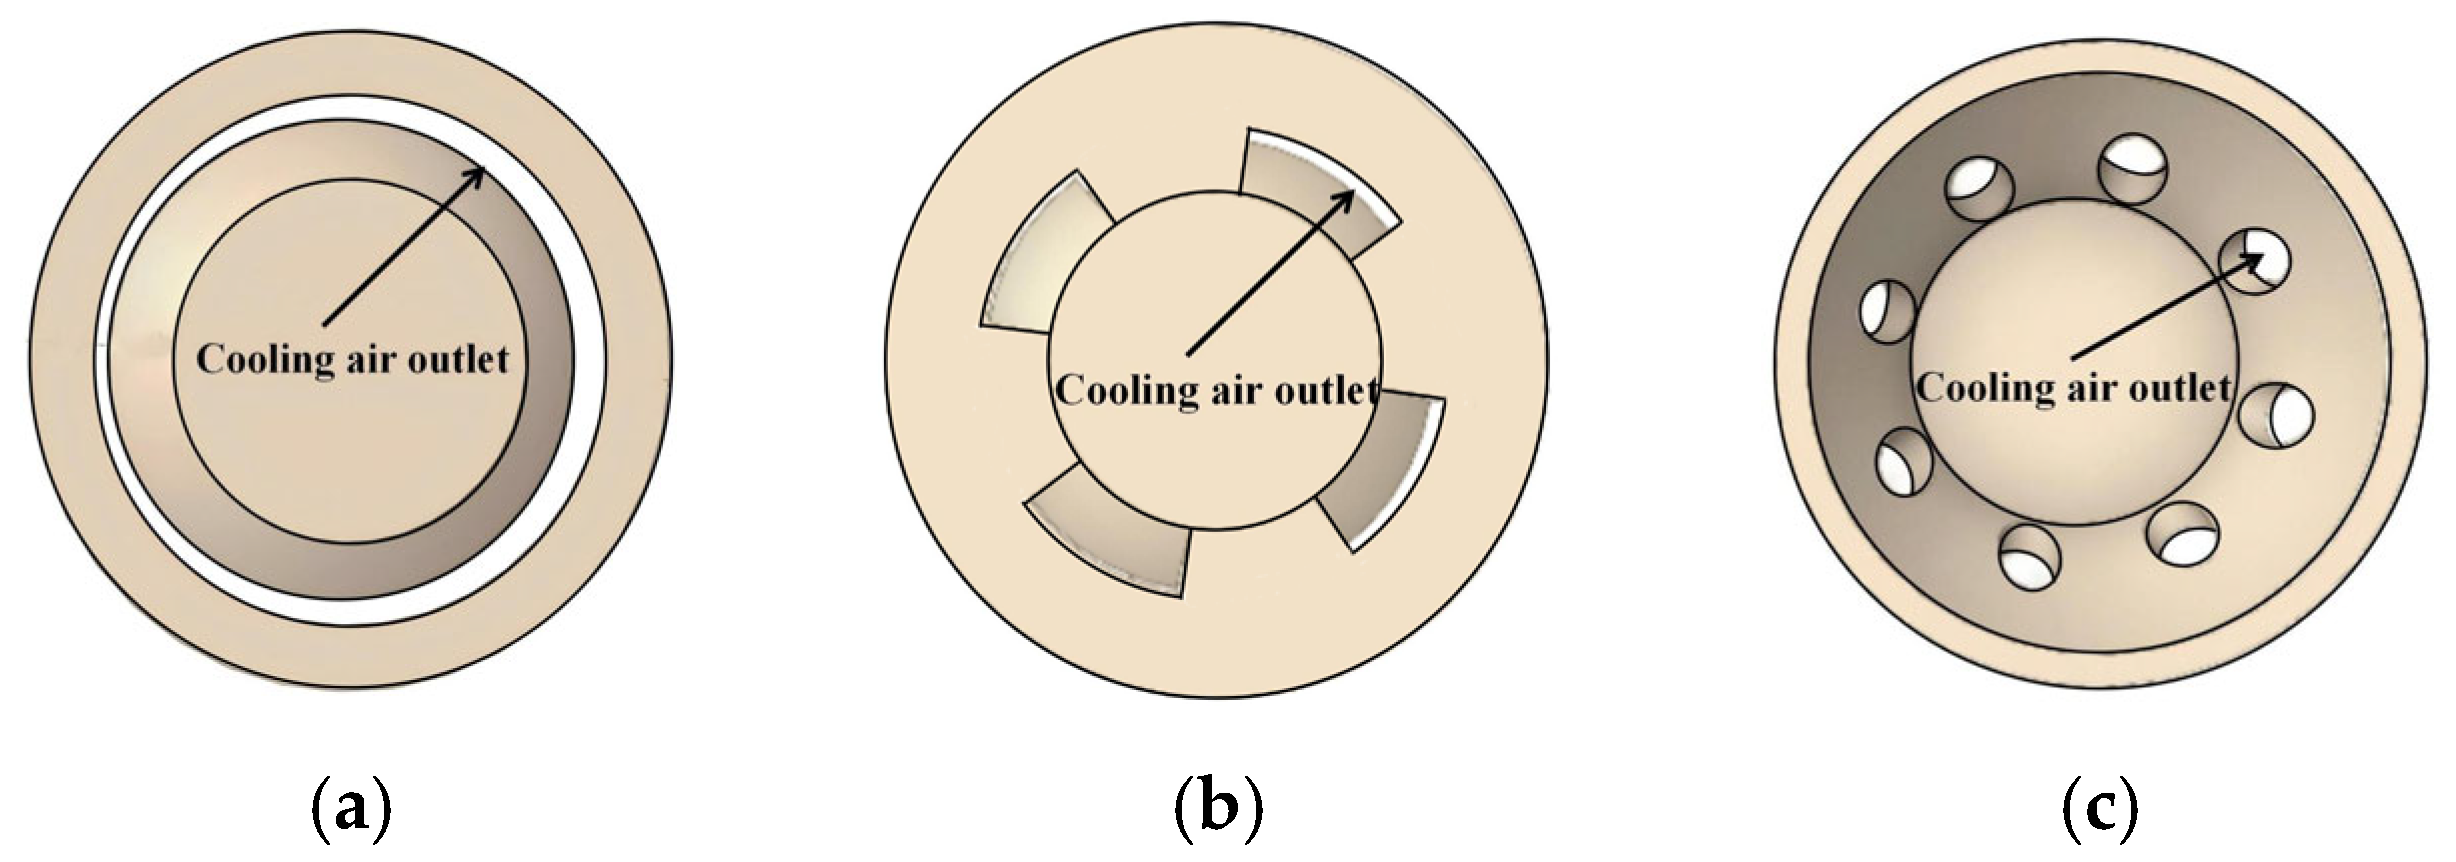
To evaluate the effect of hole configuration on cooling performance, three distinct cooling structures were designed: annular, slit-type, and hole-type. For all three configurations, the cooling outlets are positioned 2.2 mm axially from the center of the probe mirror and are angled at 30°. The annular structure features a continuous circumferential ring. The slit-type structure consists of four arc segments, each subtending 45°, evenly distributed around the circumference. The hole-type configuration comprises eight discrete holes uniformly arranged circumferentially. Schematic diagrams of the three cooling geometries are shown in Figure 2.

2.3. Physical Model of Borescope Probe’s Pressure-Drop Structure

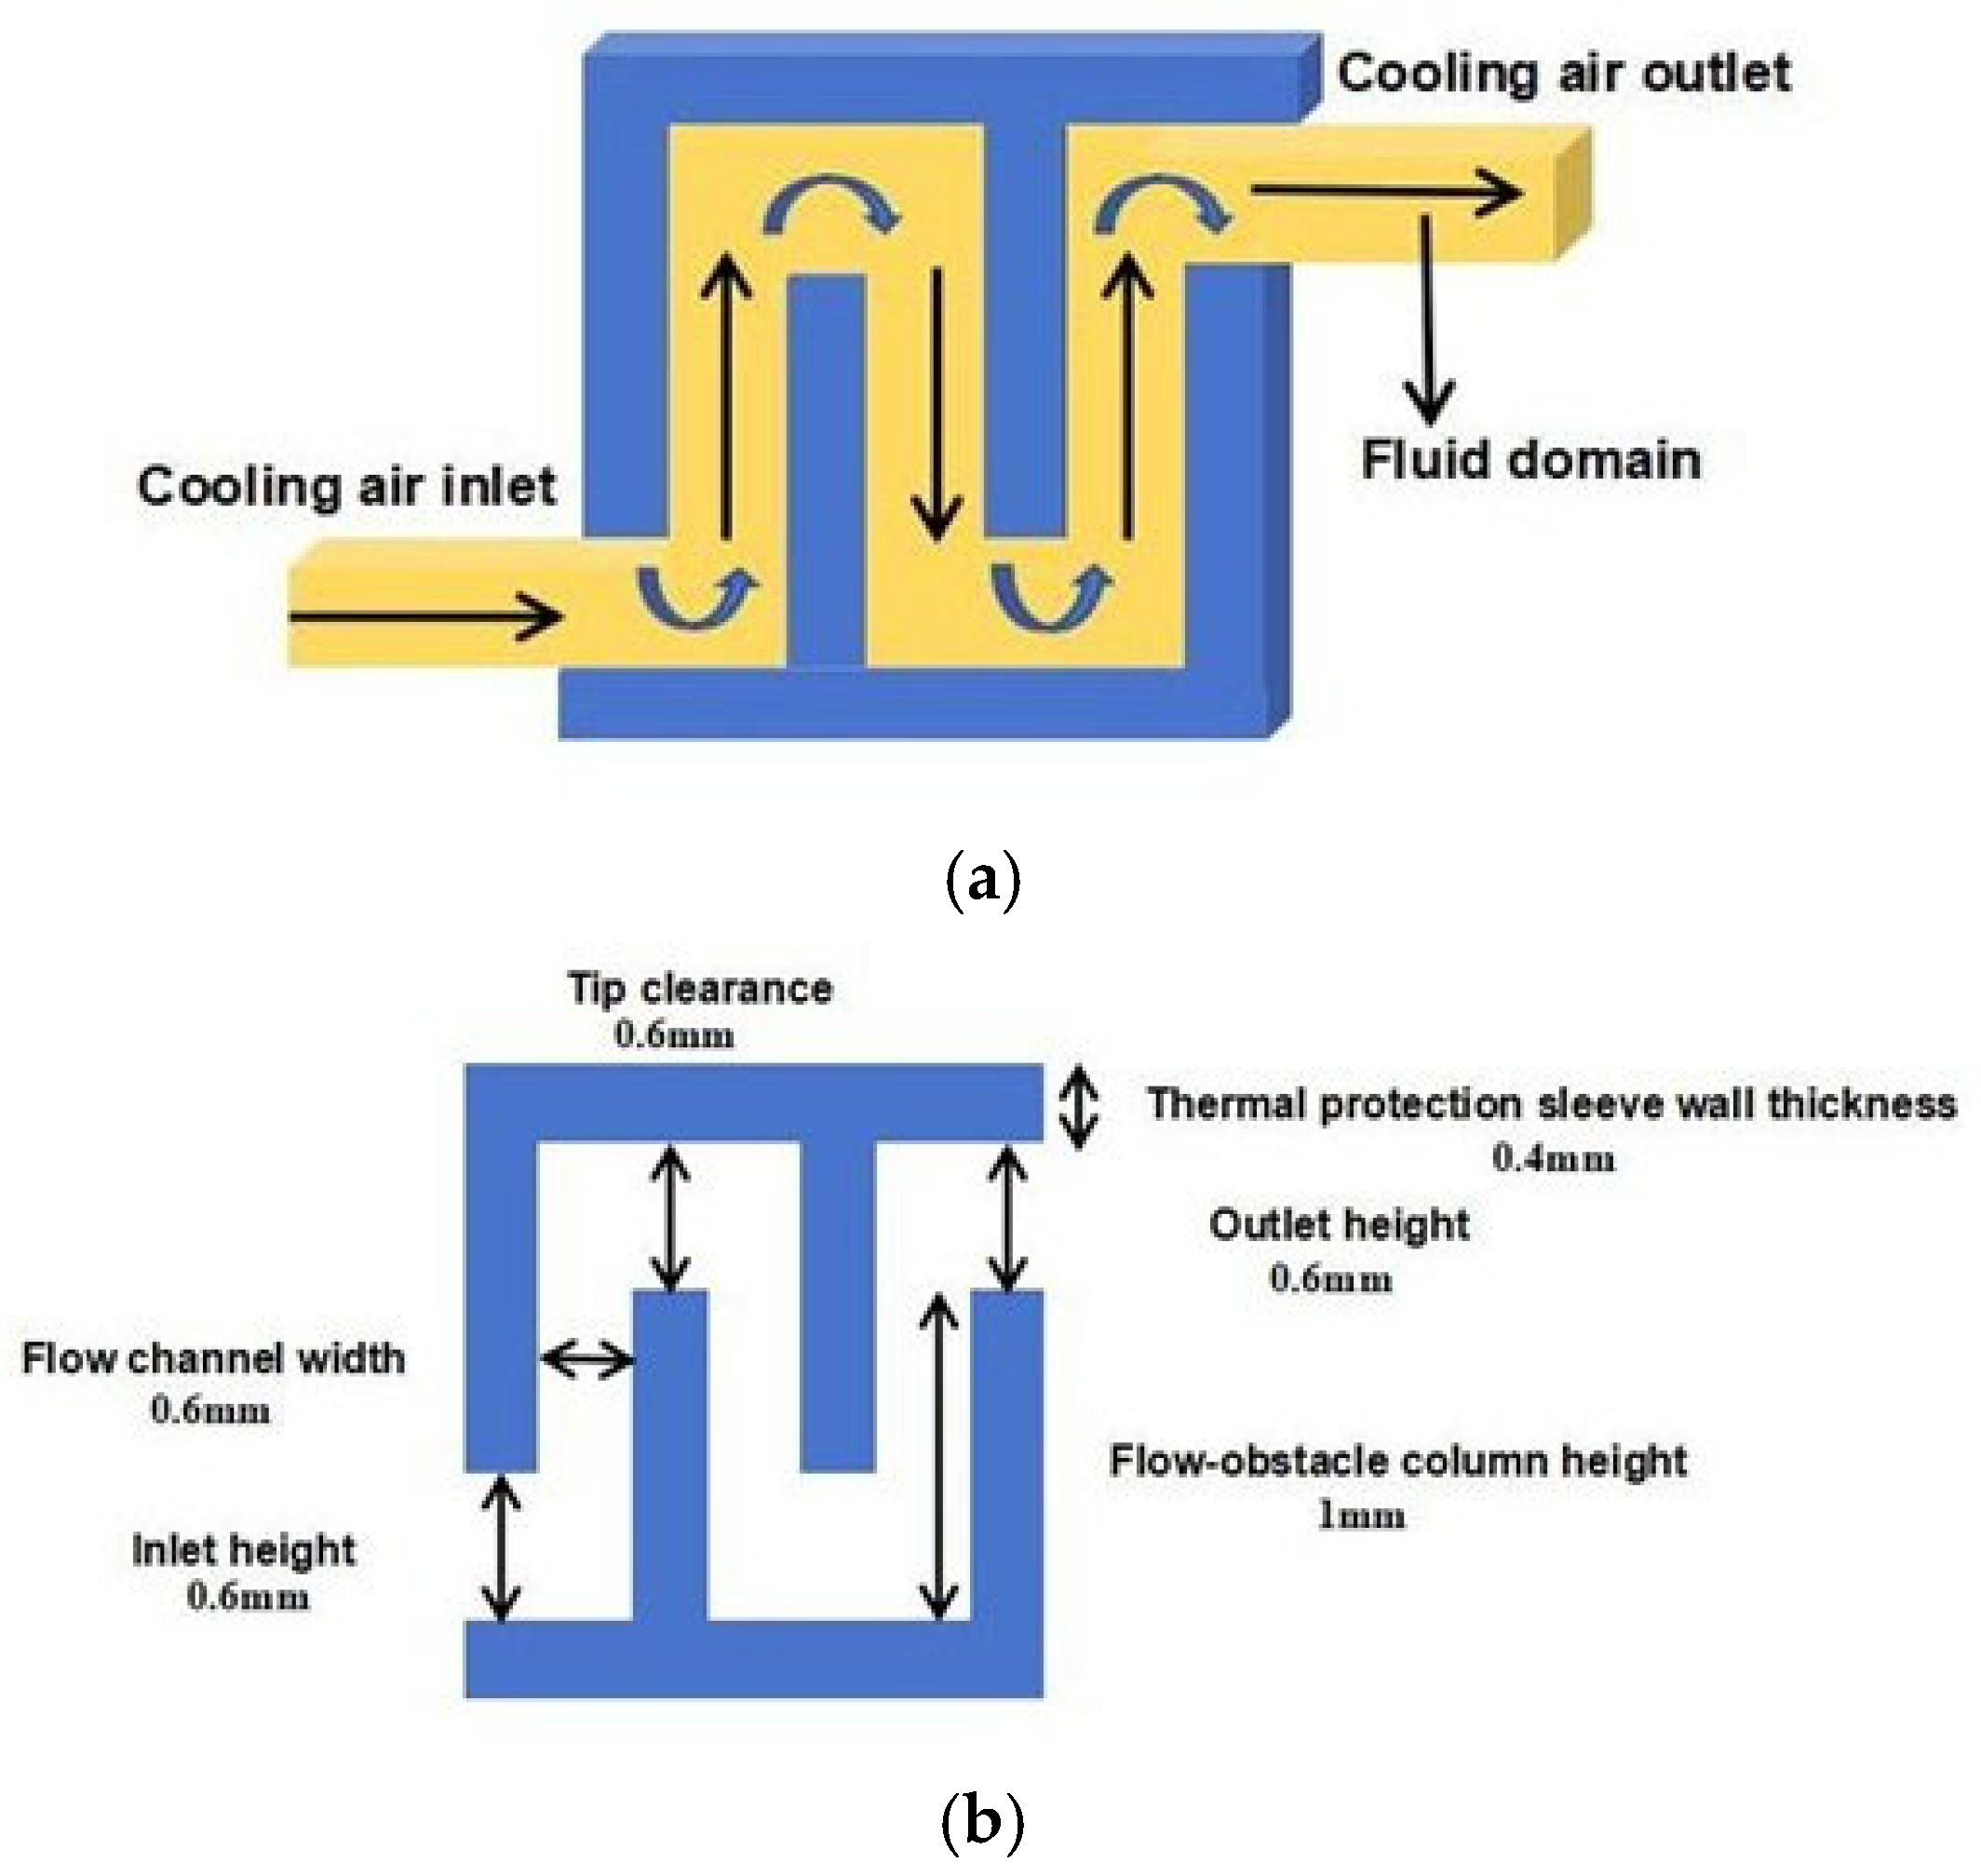
To prevent excessive consumption of cooling gas caused by the high-pressure differential between its inlet and outlet, this paper proposes a multi-stage pressure-drop structure. Located between the probe’s thermal protection jacket and its outer shell, this structure consists of three pressure-drop modules that reduce the cooling gas pressure while maintaining adequate cooling performance for the borescope probe. The cooling gas flows axially within the thermal protection jacket. As it passes through each of the three throttling and expansion modules, its pressure is progressively reduced. This pressure reduction not only improves cooling efficiency but also significantly conserves coolant volume. In practical terms, for a cooling gas cylinder of fixed volume, this system extends the available operational time. The three pressure-drop modules are evenly spaced at intervals of 20 mm. A schematic diagram and the structural parameters of a single pressure-drop module are presented in Figure 3.

3. Numerical Simulation Model and Calculation Method

Numerical simulations were conducted using ANSYS Fluent 2022 R1 software (ANSYS Inc., Pennsylvania, PA, USA), which is based on the finite volume method. The simulation solved the three-dimensional Reynolds-averaged Navier–Stokes (RANS) equations along with the energy equation to model conjugate heat transfer and fluid flow processes. A pressure-based solver was employed with the SIMPLE algorithm for pressure–velocity coupling. The convection terms for momentum and energy were discretized using a second-order upwind scheme. The species transport model was used to simulate the mixing process between different coolant gases. A solution was considered converged when the residuals of all governing equations fell below 10−6, and the surface temperature of the borescope probe was simultaneously monitored to ensure it remained within permissible operational limits.

3.1. Setup of the Calculation Domain and Monitoring Points

3.1.1. Calculation Domain

The computational domain of the flow field for the endoscopic probe is shown in Figure 4. The external thermal environment is modeled as a cylindrical domain with a length of 200 mm and a diameter of 150 mm. The inlets of both the coolant flow and the main flow are located on the same cross-sectional plane.

3.1.2. Cooling Temperature Field Distribution of Borescope Probe

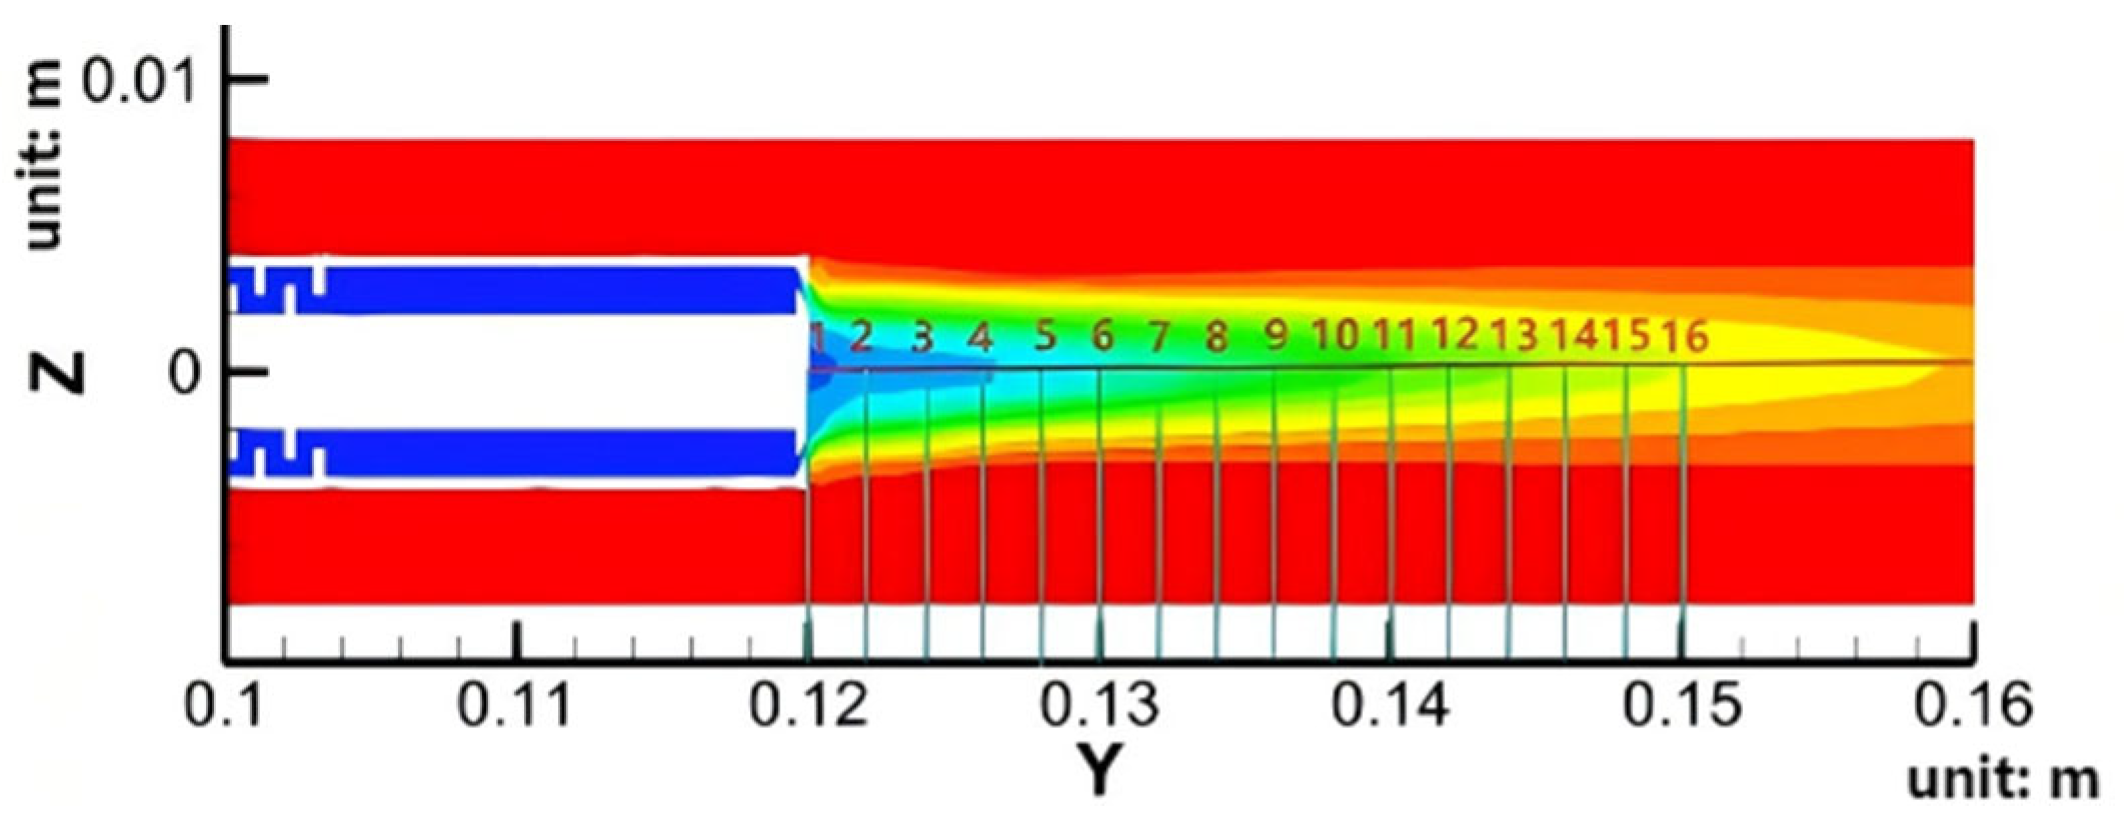
To better evaluate the thermal protection effect of film cooling on the borescope probe, this study introduces the cooling temperature field of the probe as an evaluation metric. As shown in Figure 5, a total of 16 axial monitoring points are distributed between the cross-section containing the probe mirror at 0.12 m and the cross-section located 0.15 m further downstream. These points are used to record temperature variations under film-cooling conditions. All cross-sectional positions are denoted with respect to the cooling flow inlet plane.

3.1.3. Gas Pressure Distribution of Borescope Probe

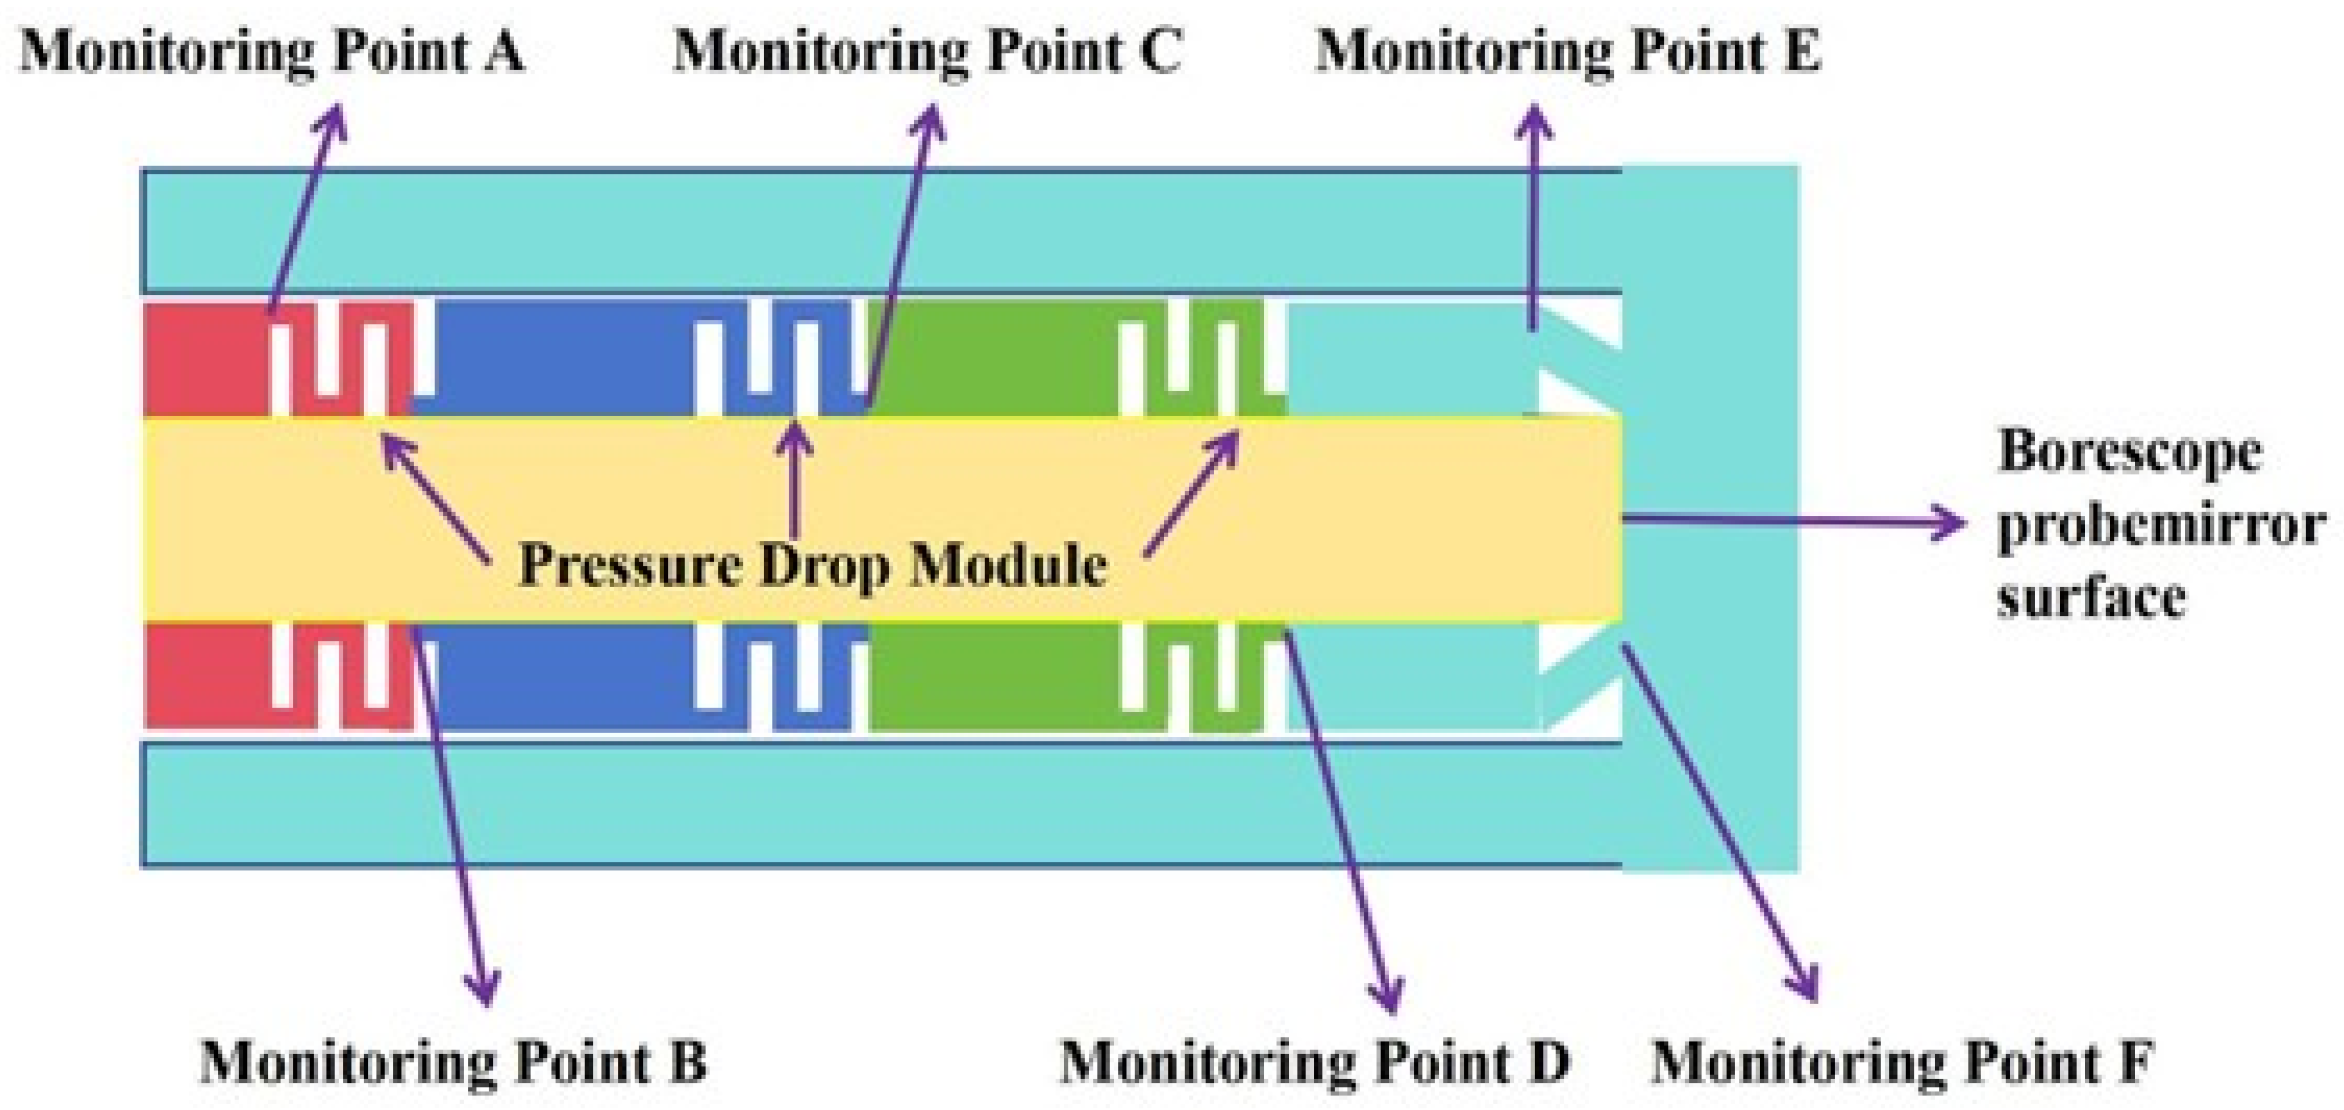
To better evaluate the pressure reduction effect of the pressure-drop structure and impingement cooling holes on the cooling gas, this paper installed six pressure detection points inside the circulation pipe of the thermal protection pipe sleeve for gas pressure measurement. In the definition of pressure detection points in Figure 6, the definition of each monitoring point is as follows:
A: Inlet cross-section of Pressure Reduction Module 1;
B: Outlet cross-section of Pressure Reduction Module 1;
C: Outlet cross-section of Pressure Reduction Module 2;
D: Outlet cross-section of Pressure Reduction Module 3;
E: Inlet cross-section of impingement cooling hole;
F: Outlet cross-section of impingement cooling hole.

3.2. Calculation Model and Assumptions

3.2.1. Calculation Model

The three-dimensional Reynolds-averaged Navier–Stokes (RANS) equations were solved using the commercial finite-volume-based ANSYS Fluent 2022 R1. The pressure-based coupled algorithm was employed for its robustness and efficiency in handling compressible flow at low Mach numbers. The spatial discretization of convective terms was achieved using the second-order upwind scheme to minimize numerical diffusion, while the diffusive terms were discretized with a second-order central differencing scheme. The gradients were computed using the Green–Gauss node-based method for improved accuracy in regions with large gradients.
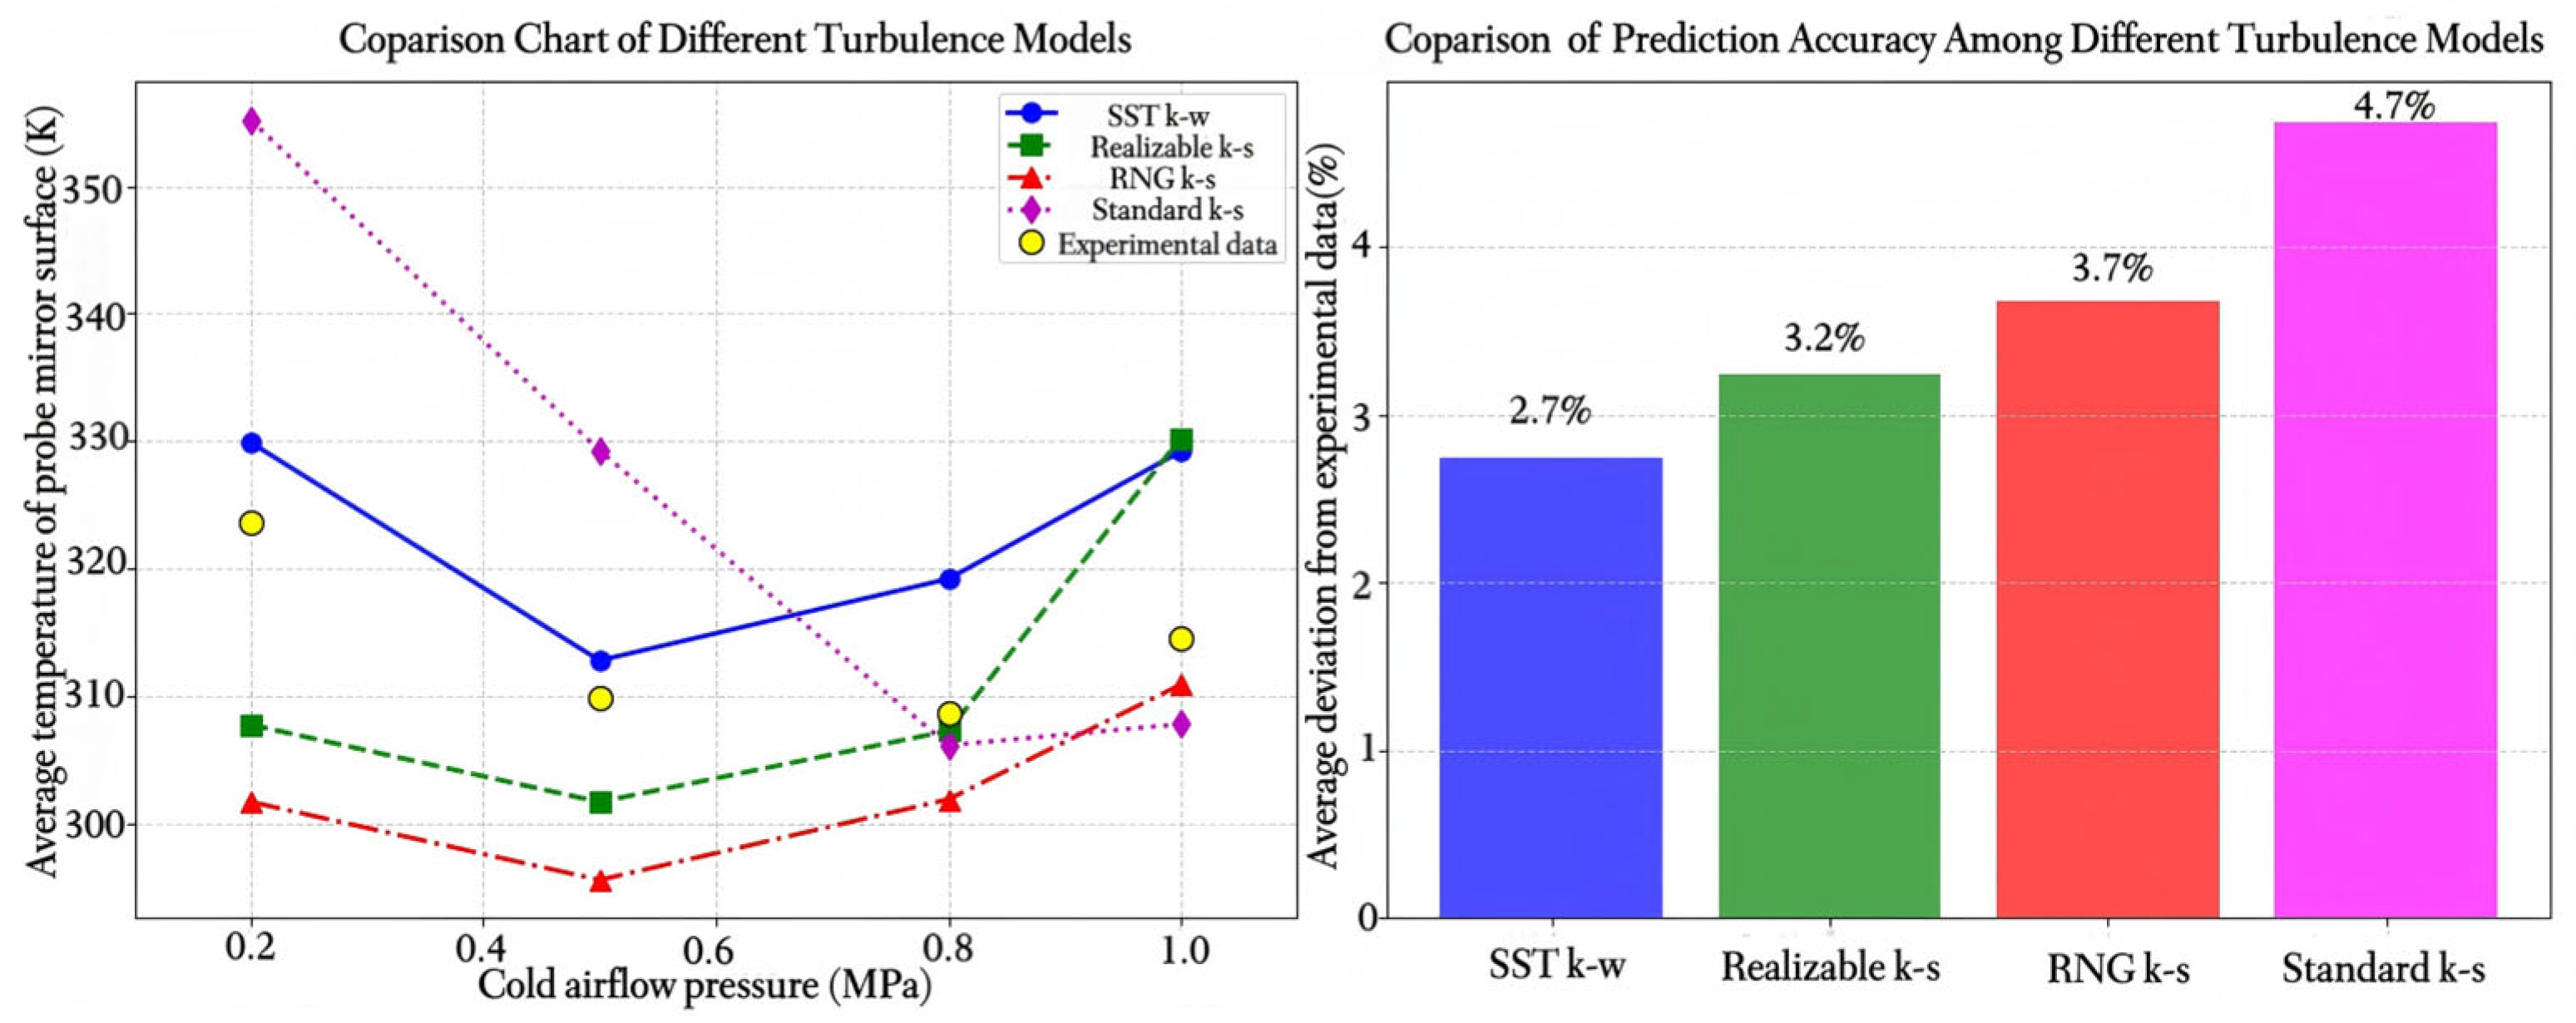
The Shear Stress Transport (SST) k-ω turbulence model [6,11,17,25] was adopted for its demonstrated capability in accurately predicting flows with adverse pressure gradients, separation, and impingement—all relevant to the current film-cooling configuration. This model effectively blends the k-ω formulation near the walls, which provides superior accuracy in resolving the viscous sublayer, with the k-ε model in the bulk flow to avoid its well-documented sensitivity to inlet turbulence conditions. All simulations were run until the scaled residuals for the continuity, momentum, energy, and turbulence equations dropped below 10−6, and evaluation metrics (e.g., average mirror temperature) showed no further change with iterations. Meanwhile, based on References [26,27,28], we conducted simulation calculations on the temperature of the borescope probe using four turbulence models and compared the calculation results with the corresponding experimental data, verifying the effectiveness of using the SST k-ω model. The specific results are presented in Figure 7.

3.2.2. Model Assumptions

Clarification of the core assumptions and scientific basis of the model: In order to ensure that the model is not only in line with the actual project but also satisfies the rationality of numerical calculations, we have used the following assumptions and supporting logic:
Assumptions for wall conditions: The walls of the probe mirror body and cooling structure are assumed to be “smooth and adiabatic walls”. The surface roughness of the borescope probe shell and the inner wall of the cooling channel is much smaller than the characteristic size of the cooling channel, so the influence of wall roughness on the flow can be neglected. The wall of the probe’s thermal protection sleeve is made of high-temperature-resistant adiabatic composite material, which prevents a significant temperature rise in the cooling channel.
Assumptions for the treatment of thermophysical parameters: The thermal conductivity and specific heat capacity of the cooling gas (air/nitrogen mixture) are treated as temperature-independent. Under normal temperature and pressure conditions (cooling gas temperature: 275–295 K; pressure: 0.2–1.0 MPa), the thermal conductivity of air is 0.024 W/(m·K) and its specific heat capacity is 1005 J/(kg·K); the thermal conductivity of nitrogen is 0.026 W/(m·K) and its specific heat capacity is 1039 J/(kg·K).
Mesh quality metrics: orthogonal quality—all grids maintained an average value > 0.85, with a minimum value > 0.15, far exceeding the acceptable threshold of 0.1. Skewness—the average skewness was kept below 0.15, with a maximum value < 0.75, indicating a very high-quality mesh. Aspect ratio—the aspect ratio was maintained below 5 in the critical near-wall and film-cooling regions to ensure numerical accuracy. y+ value—the y+ value on all walls was carefully controlled to be below 5 (averaging ~1.5) to accurately resolve the viscous sublayer using the enhanced wall treatment function of the SST k-ω model.
Sensitivity analysis of boundary conditions: To ensure the results’ robustness against variations in key boundary conditions, a sensitivity analysis was conducted on the round-hole structure model. The baseline case (coolant pressure = 0.5 MPa; temperature = 285 K) was used. The results confirmed that our conclusions are robust within expected operational variations. Coolant inlet pressure: A variation of ±0.1 MPa around the baseline led to a change in the average mirror temperature of less than ±3.5 K. Coolant inlet temperature: A variation of ±5 K resulted in an almost linear and equivalent change in the average mirror temperature of ±5.1 K, indicating a predictable and stable system response. Mainstream inlet turbulence intensity: Varying the intensity between 3% and 7% resulted in a negligible change in the average mirror temperature of less than 0.8 K, demonstrating the low sensitivity of the core cooling effect to this parameter.

3.3. Boundary Conditions

Based on the actual operating environment, the boundary conditions used in this study are summarized in Table 1. The pressure and temperature of the main stream correspond to the actual conditions in the core flow passage of the aero-engine after shutdown. The mainstream inlet was defined as a pressure-inlet condition with a pressure of 101,325 Pa and a temperature of 900 K. To systematically investigate the effect of the coolant’s properties on the cooling performance, the coolant flow was varied in terms of pressure, temperature, and nitrogen mixing ratio. The outlet was set as a pressure-outlet boundary, with the same pressure and temperature as the mainstream inlet.

3.4. Basis for the Selection Range of Research Variables

To better explain the rationality of the selection ranges for research variables including pressure, temperature, and size, this paper provides support by citing the relevant literature or industry standards. The specific parameter selection ranges and their corresponding rationale are provided in Table 2.

3.5. Grid Independence Verification

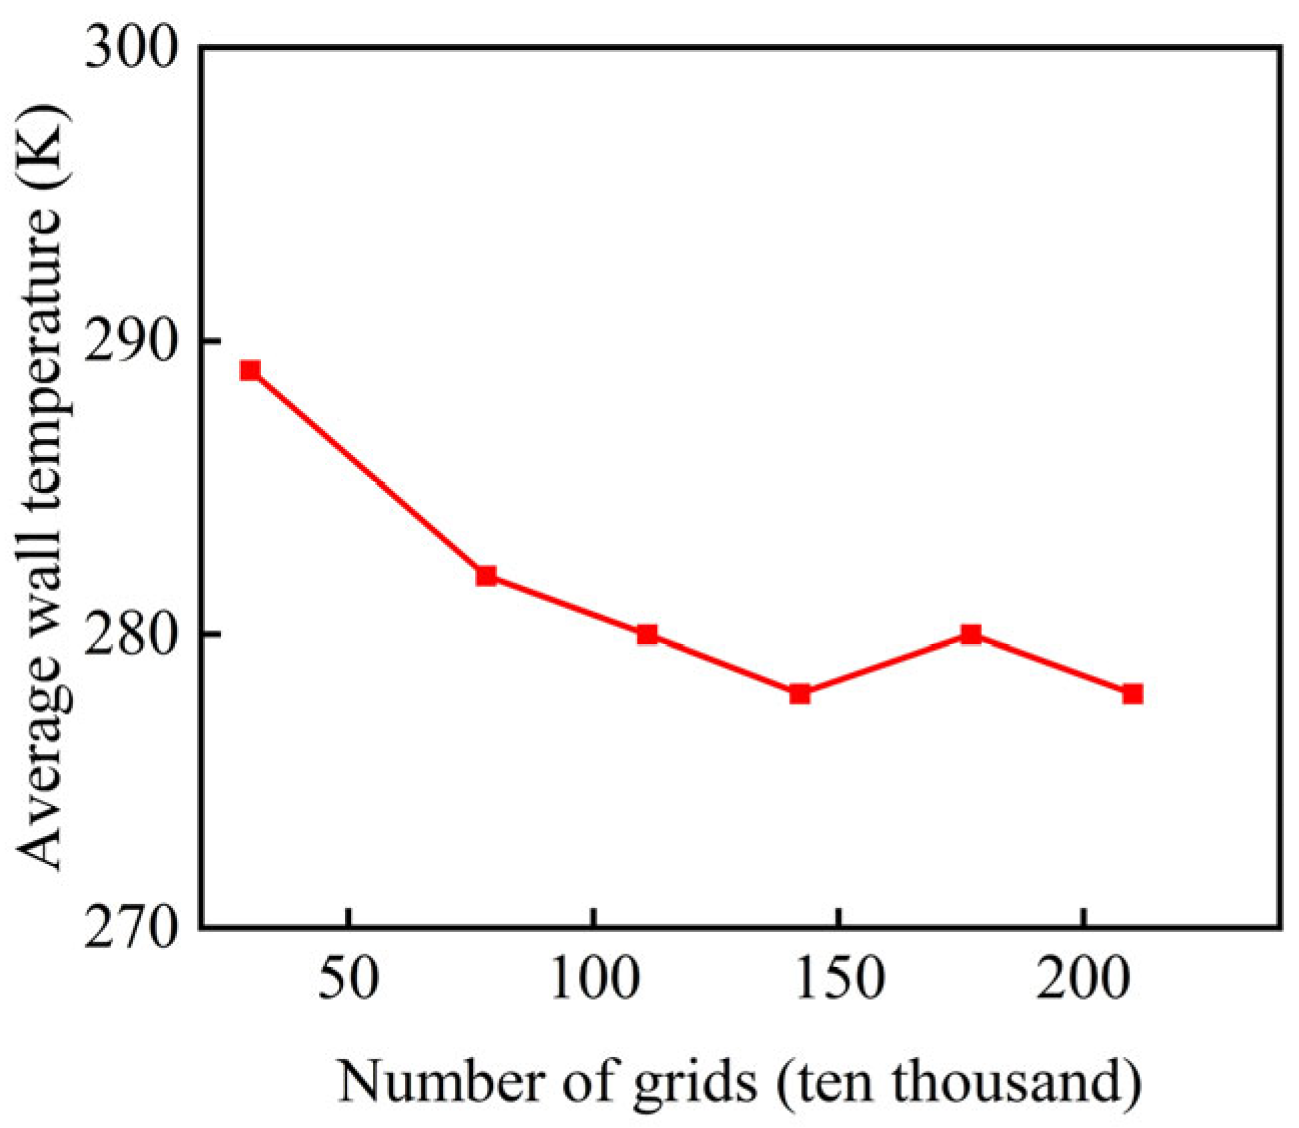
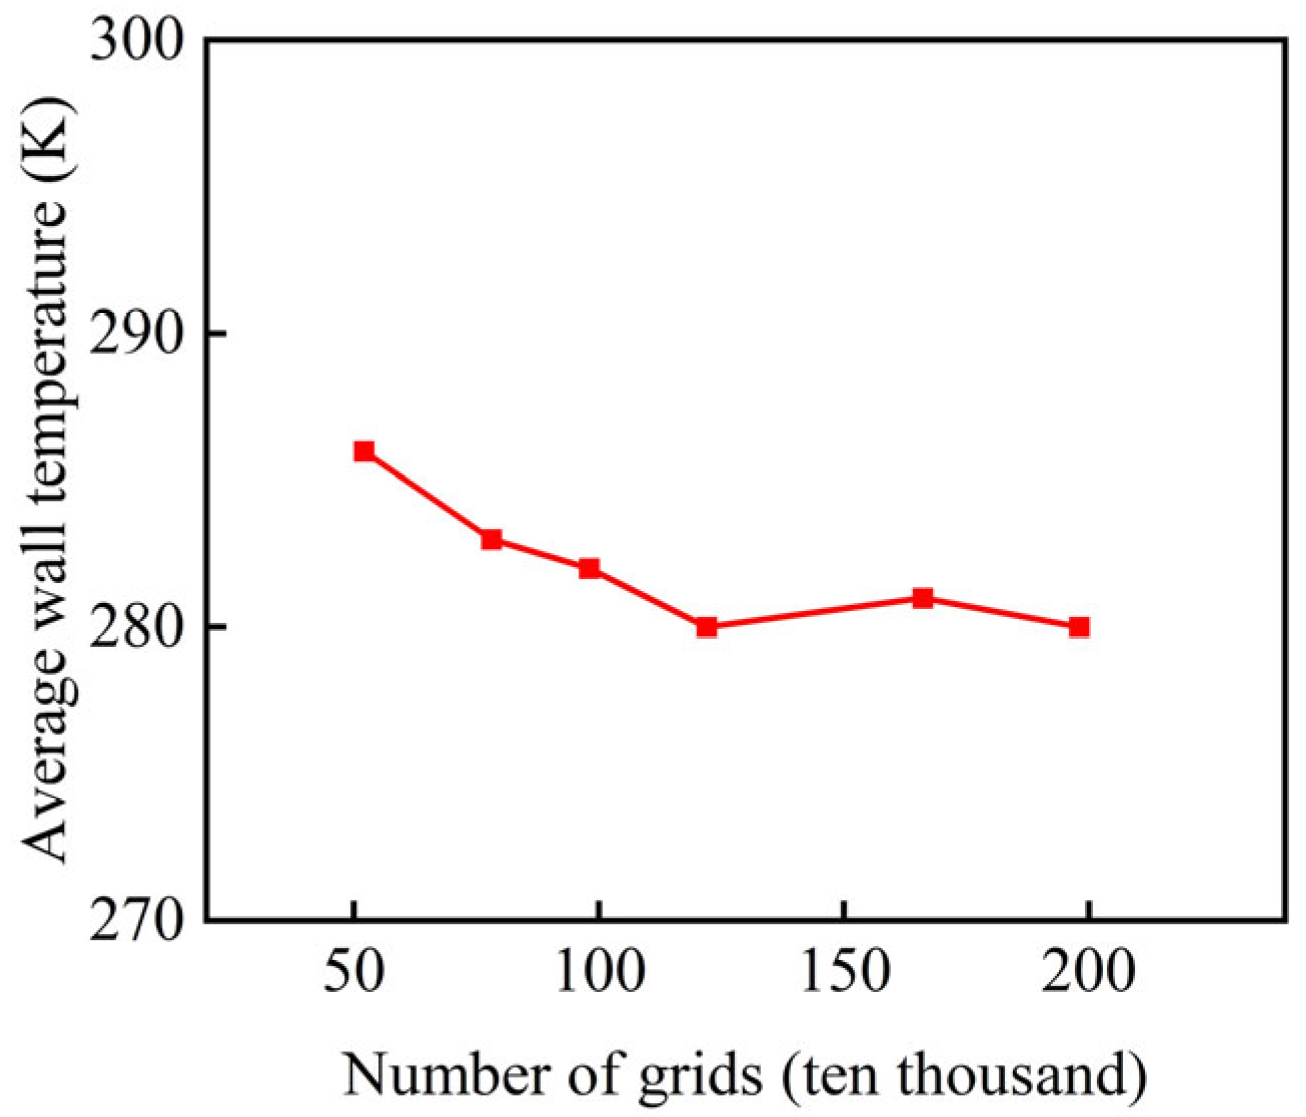
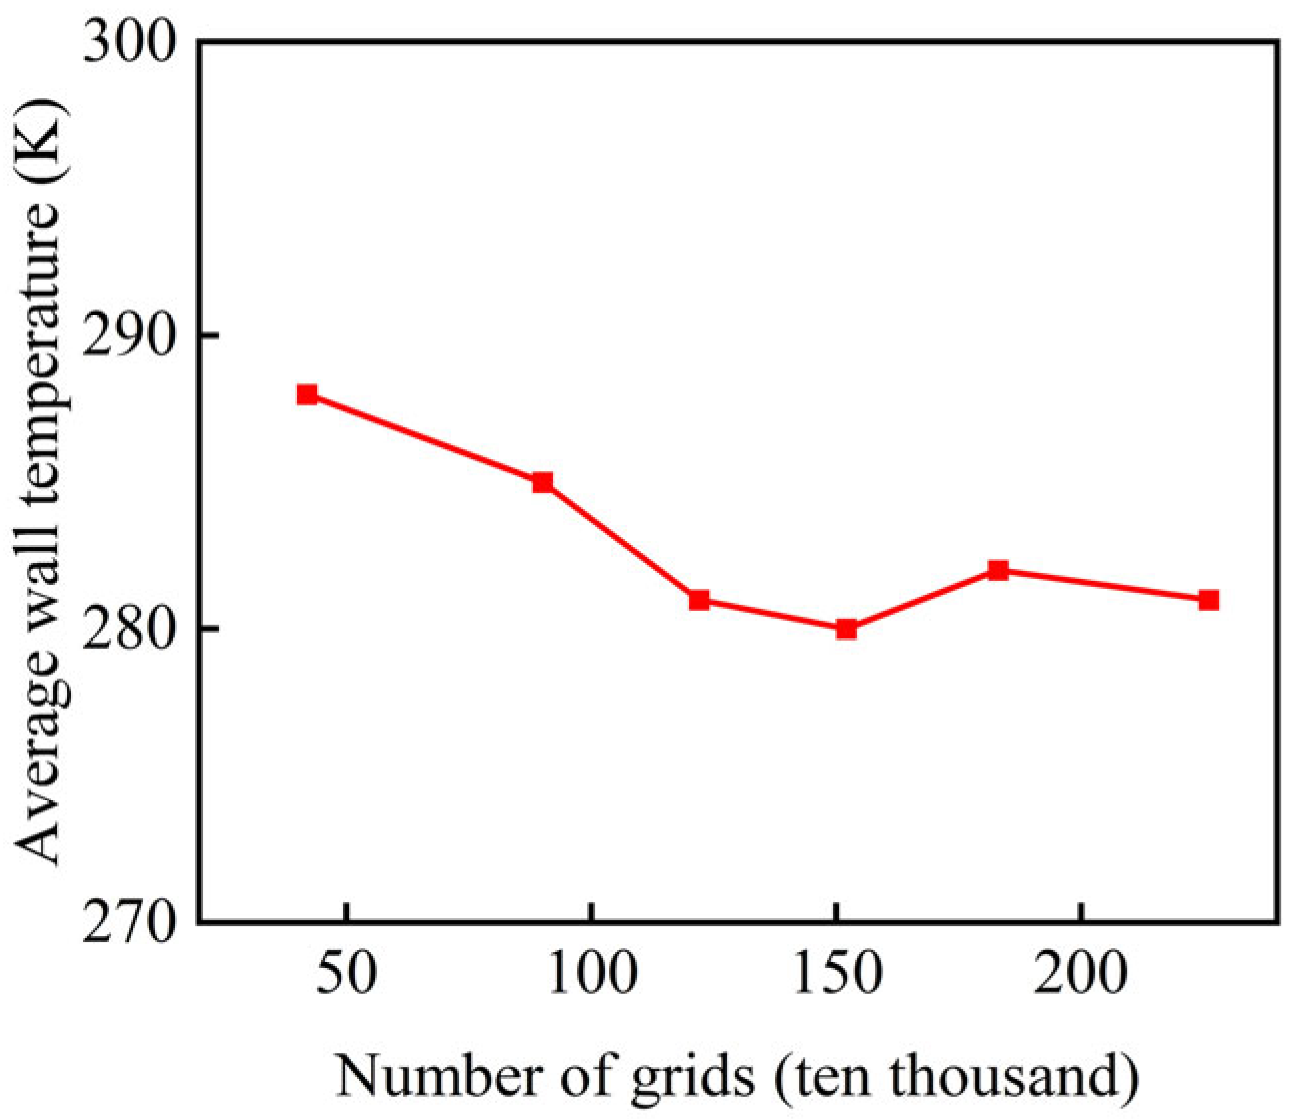
The computational mesh was generated using ICEM CFD as an unstructured grid. Due to the significant temperature gradient between the cooling airflow and the mainstream flow, local mesh refinement was applied near the cooling airflow channel walls and the gas film exit to improve simulation accuracy. A grid independence study was conducted using six different grid sizes for each of the three cooling configurations (annular-, slit-, and hole-type), as illustrated in Figure 8, Figure 9 and Figure 10. The inlet conditions for the mainstream remained unchanged, while the cooling airflow inlet was set to 0.5 MPa and 285 K. The annular cooling channel width was 0.6 mm, and both the slit-type and hole-type structures had a width of 0.8 mm. The results indicate that grid independence was achieved at approximately 1.42 million elements for the annular structure, 1.22 million for the slit-type structure, and 1.52 million for the hole-type structure, beyond which the average mirror surface temperature remained stable.

4. Analysis of Calculation Results

4.1. Simulation Evaluation Metrics

4.1.1. Average and Maximum Temperatures of Borescope Probe Mirror Surface

The temperature distribution on the borescope probe mirror surface is the most important evaluation metric for the cooling effect of the gas. A safe mirror surface temperature is fundamental for stable probe operation. In this paper, the professional data visualization and analysis software “Tecplot 360 EX 2022 R1” is used to obtain contour plots of temperature and cooling efficiency as well as simulation data.

4.1.2. Average Cooling Efficiency of Borescope Probe Mirror Surface

To assess the cooling effect of gas impingement on the probe mirror, the film-cooling efficiency η—defined as the adiabatic wall effectiveness—was introduced. This parameter quantitatively evaluates the protective performance of the cooling film. The expression for η ¯ is given by Equation (1).
η ¯ = T T w T T c

4.2. Simulation Experiments

To systematically investigate the effects of the cooling structure’s outlet width and gas properties on the cooling performance of the borescope probe, a series of numerical simulations based on three cooling configurations were conducted in this study. The following key parameters were considered:
(1)
Cooling gas temperature;
(2)
Coolant inlet pressure;
(3)
Gas composition (nitrogen mixing ratio);
(4)
Coolant outlet width.
All other parameters were held constant: the cooling gas temperature was set to 285 K, the inlet pressure to 0.5 MPa, the working fluid to air, and the outlet width to 0.6 mm.

4.3. Analysis of Cooling Condition Influence

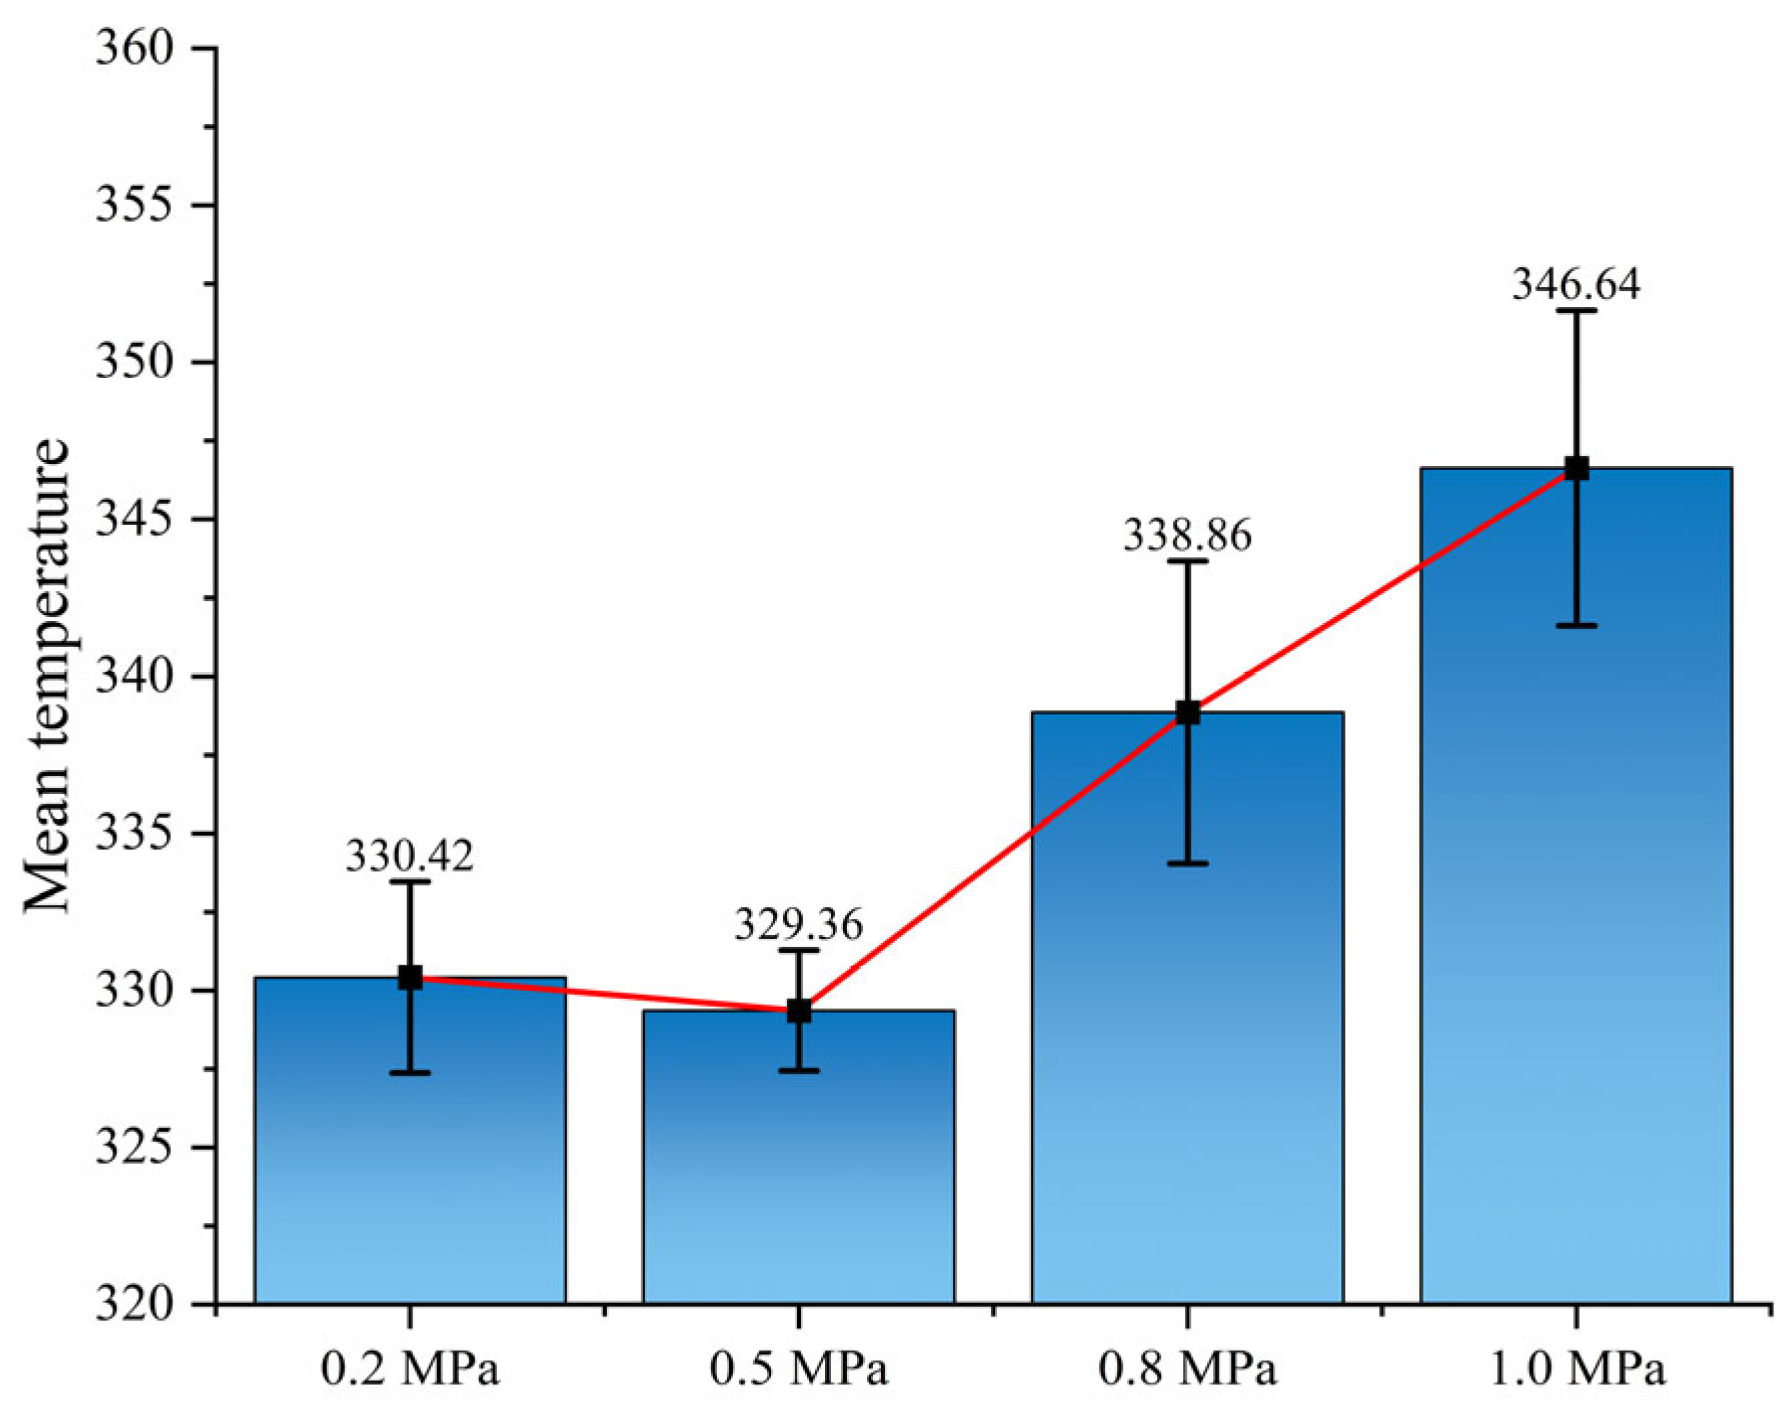
To ensure the accuracy of the simulation results, validate the computational process employed in this study, and enhance the credibility of the research conclusions, this paper investigates the influence of different inlet pressures on the cooling performance of the annular cooling structure. Five independent measurement experiments were conducted, and a one-way analysis of variance (ANOVA) was applied. The analysis results are shown in Figure 11.
The results indicate that the inlet pressure has a significant impact on the average temperature of the probe mirror surface. In the annular cooling structure, the average temperature under the pressure condition of 0.5 MPa is the lowest (312.80 ± 0.92 K). Moreover, through one-way analysis of variance (ANOVA) and subsequent tests, it is confirmed that this value is significantly lower than those under other pressure conditions (p < 0.05); in contrast, the average temperature under 1.0 MPa is the highest (349.24 ± 0.87 K). The error bars in the figure represent the standard deviation of five independent measurement results (±1 SD), and all original data points are displayed in the figure. Validation results have proven the effectiveness of the simulation calculations and the reliability of the conclusions.

4.3.1. Ring Structure Cooling Flow Field Analysis

(1)
Influence of Coolant Inlet Pressure
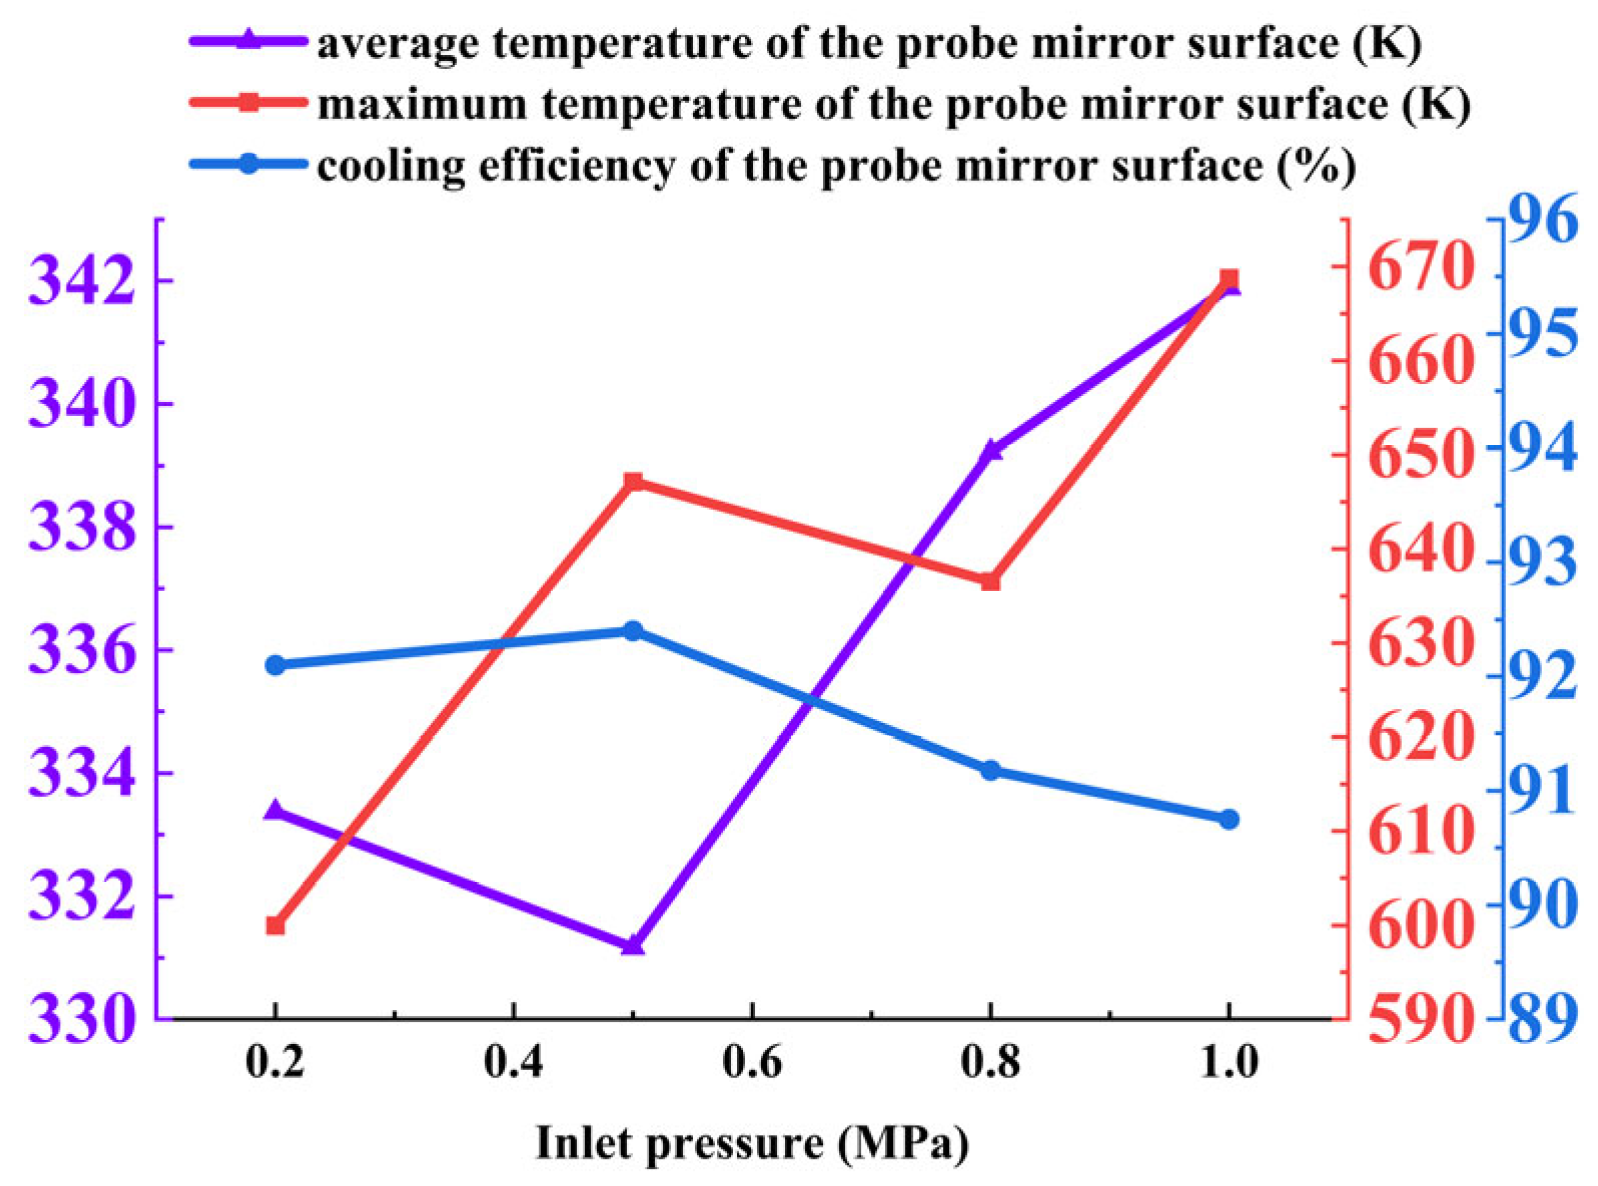
The cold flow inlet pressure significantly influences both the coolant flow rate and the cooling performance of the borescope probe. An excessively low pressure prevents the formation of a sufficiently thick cooling film, while an excessively high pressure leads to rapid coolant ejection and consumption, thereby reducing cooling effectiveness. In this study, four inlet pressures—0.2 MPa, 0.5 MPa, 0.8 MPa, and 1.0 MPa—were compared and analyzed.
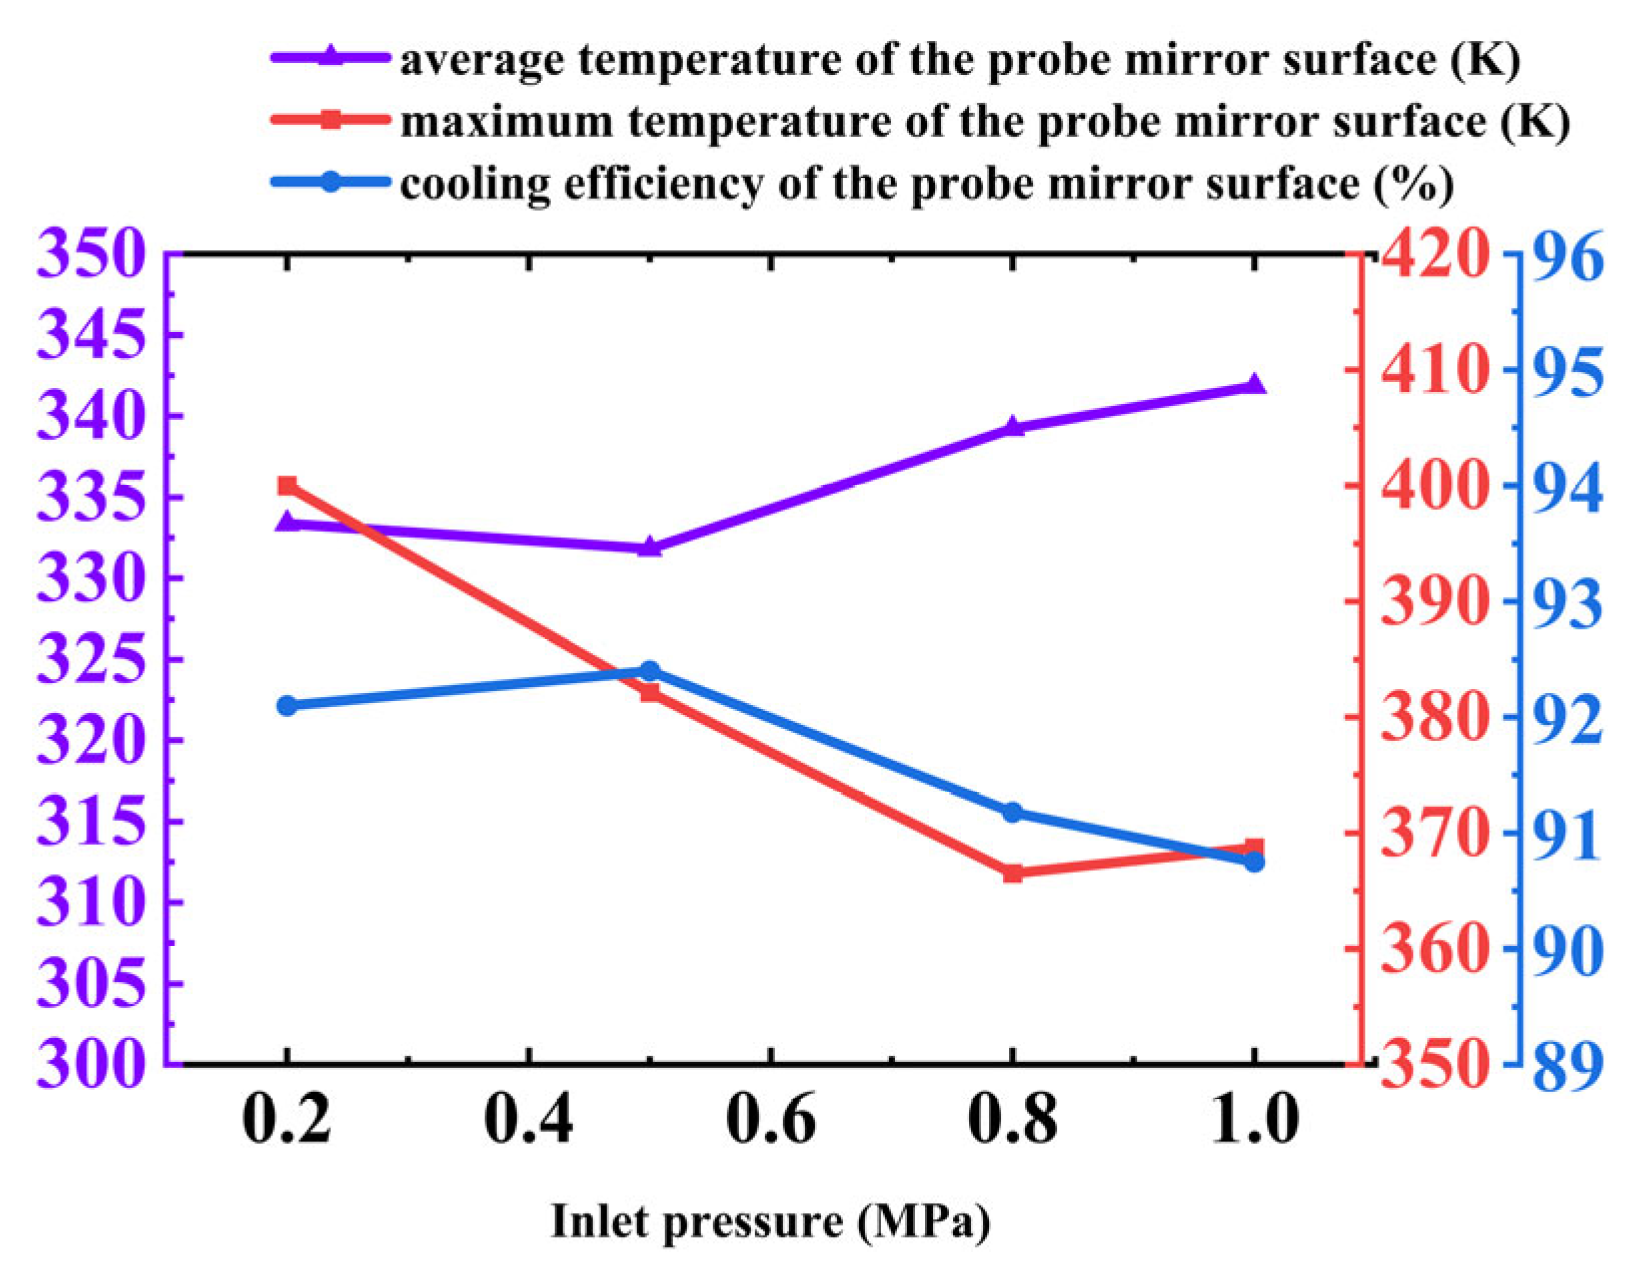
Figure 12 illustrates the variation in both the mirror surface temperature and average cooling efficiency of the probe under different cold flow pressures. As the inlet pressure increases, the flow rate of the cooling gas at the outlet of the annular structure rises correspondingly. The cooling effect initially improves and then deteriorates, reflected in the average mirror temperature, which first decreases from 333.50 K at 0.2 MPa to 331.81 K at 0.5 MPa, and then increases to 341.84 K at 1.0 MPa. The maximum mirror temperature follows a similar trend. Meanwhile, the cooling efficiency also increases initially before decreasing.
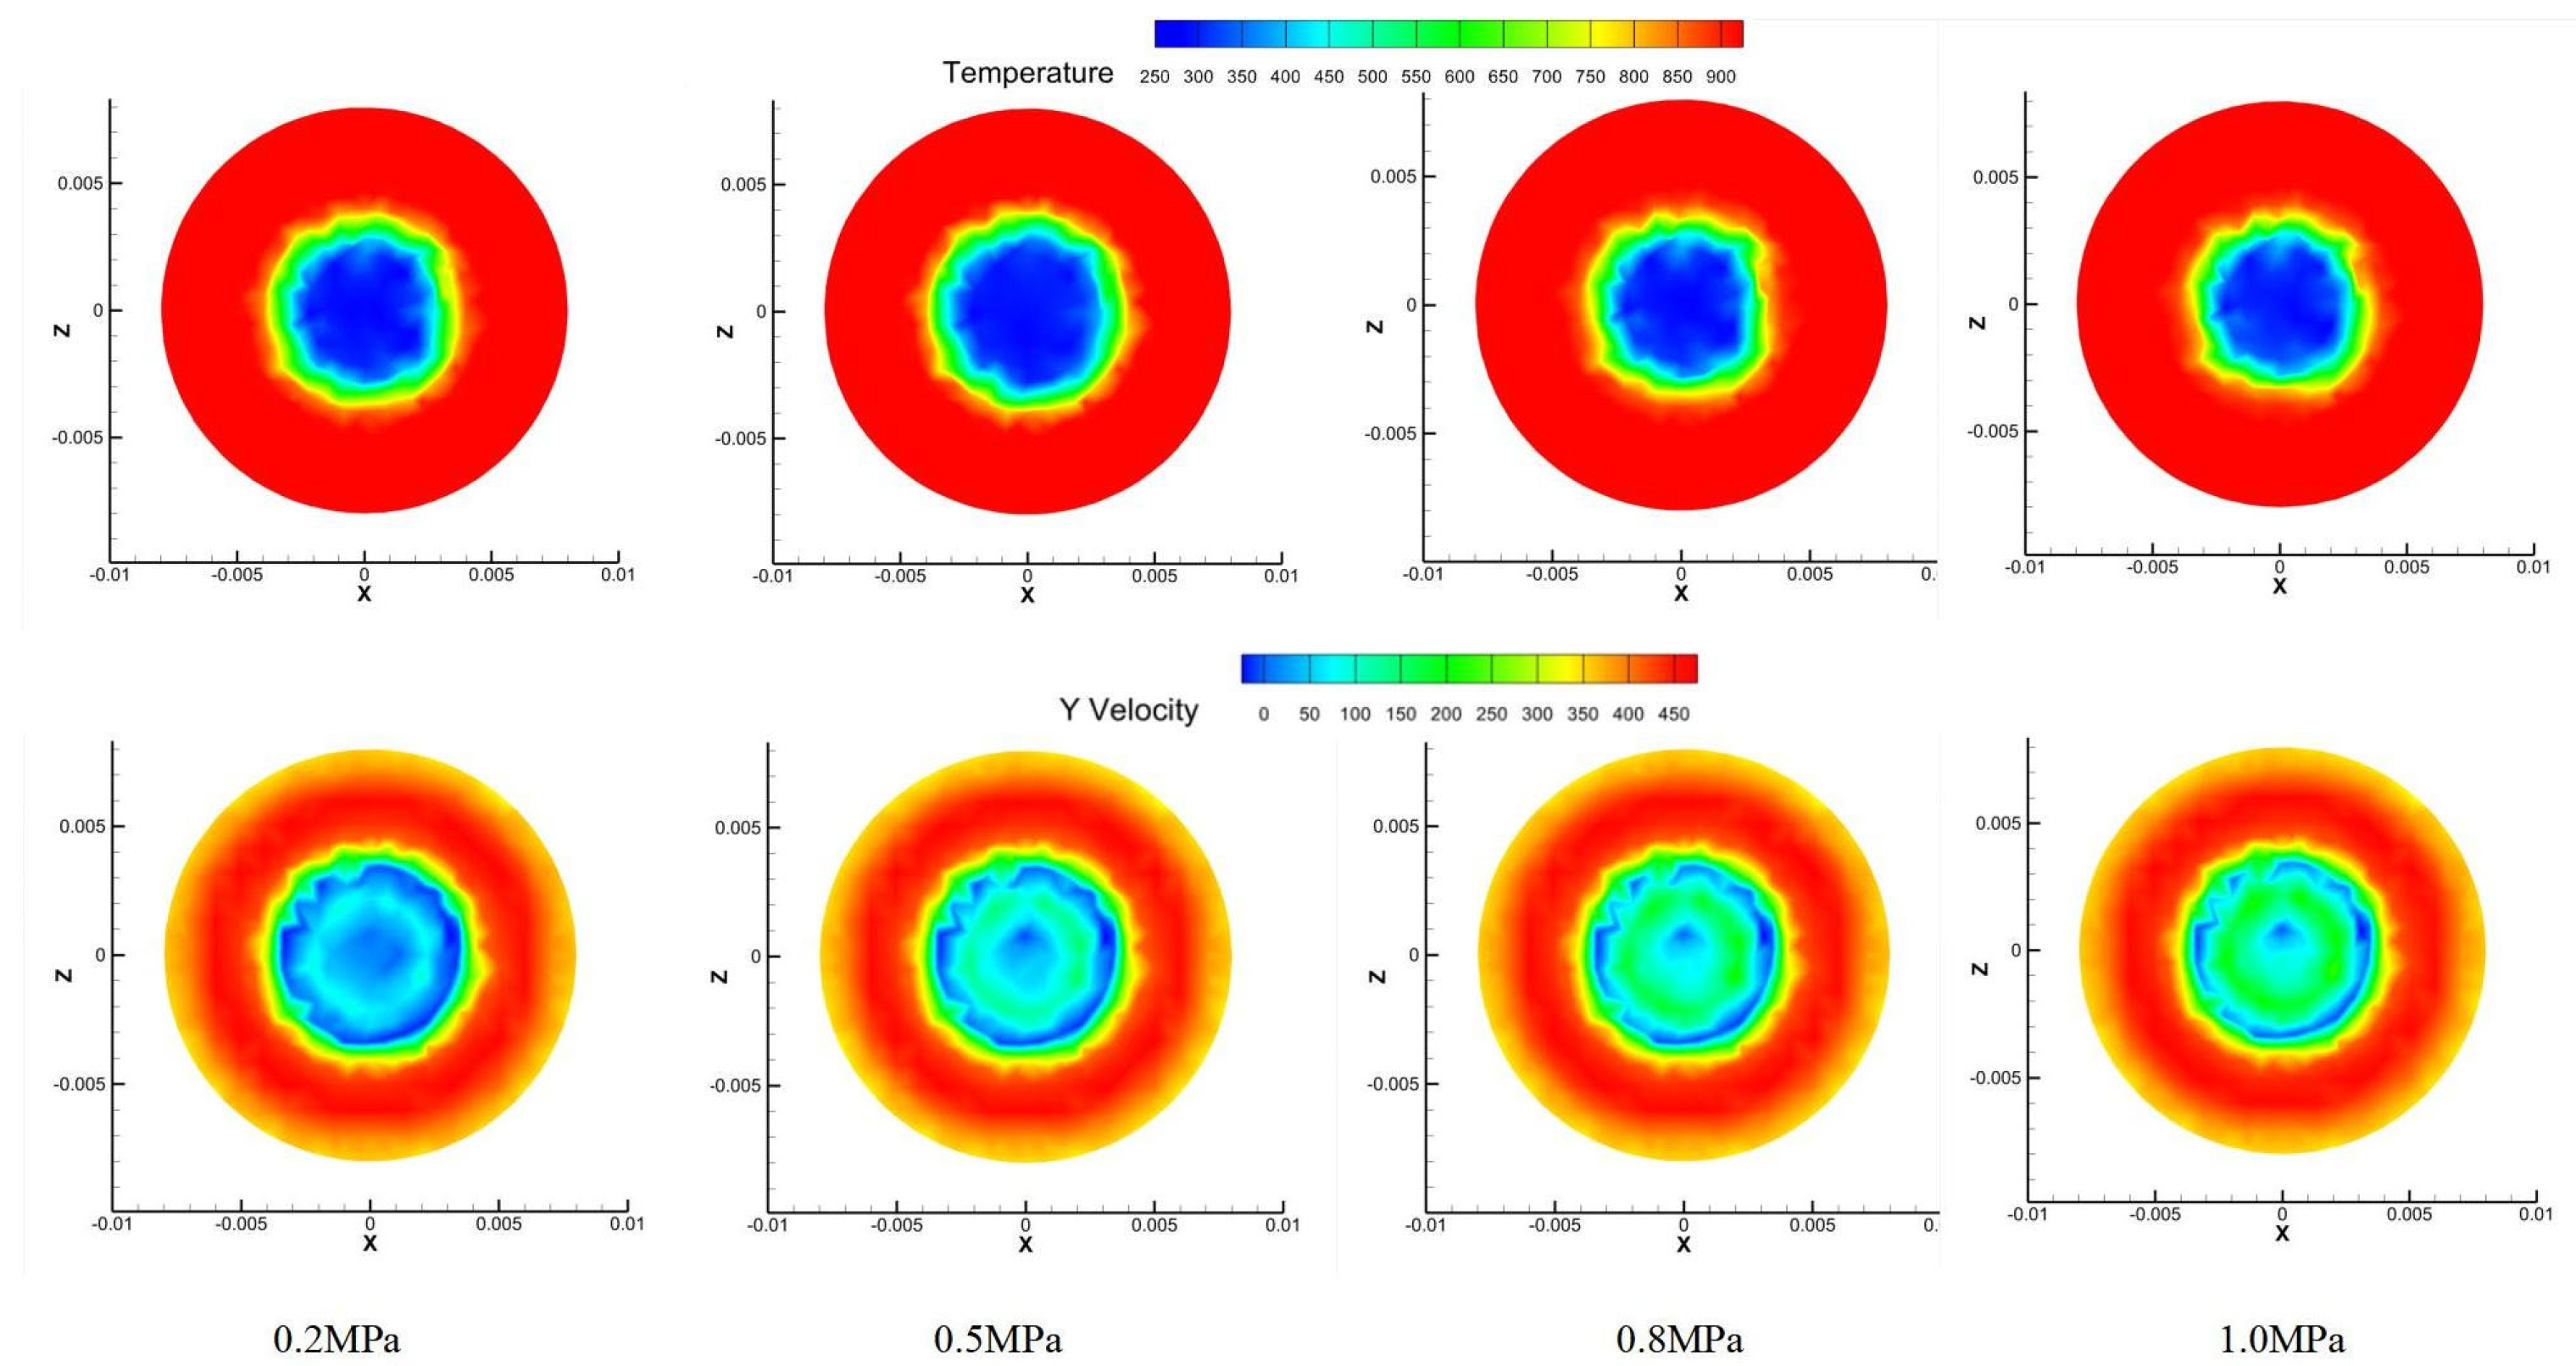
Figure 13 presents temperature contours at the 0.12 m cross-section where the probe mirror is located. The four comparative contour plots illustrate the temperature and flow velocity distributions under different inlet pressures. It can be observed that as the coolant pressure increases, the low-temperature region near the center of the mirror expands initially and then contracts. Meanwhile, the Y-velocity contours reveal that the high-velocity region on the mirror surface continuously expands with increasing coolant inlet pressure, and the central area becomes a pronounced high-speed flow zone beyond 0.8 MPa. This behavior is consistent with the previously noted trend of the average mirror temperature varying with inlet pressure and further demonstrates that the enlargement of the high-speed zone significantly enhances convective heat transfer, thereby improving the cooling performance around the mirror.
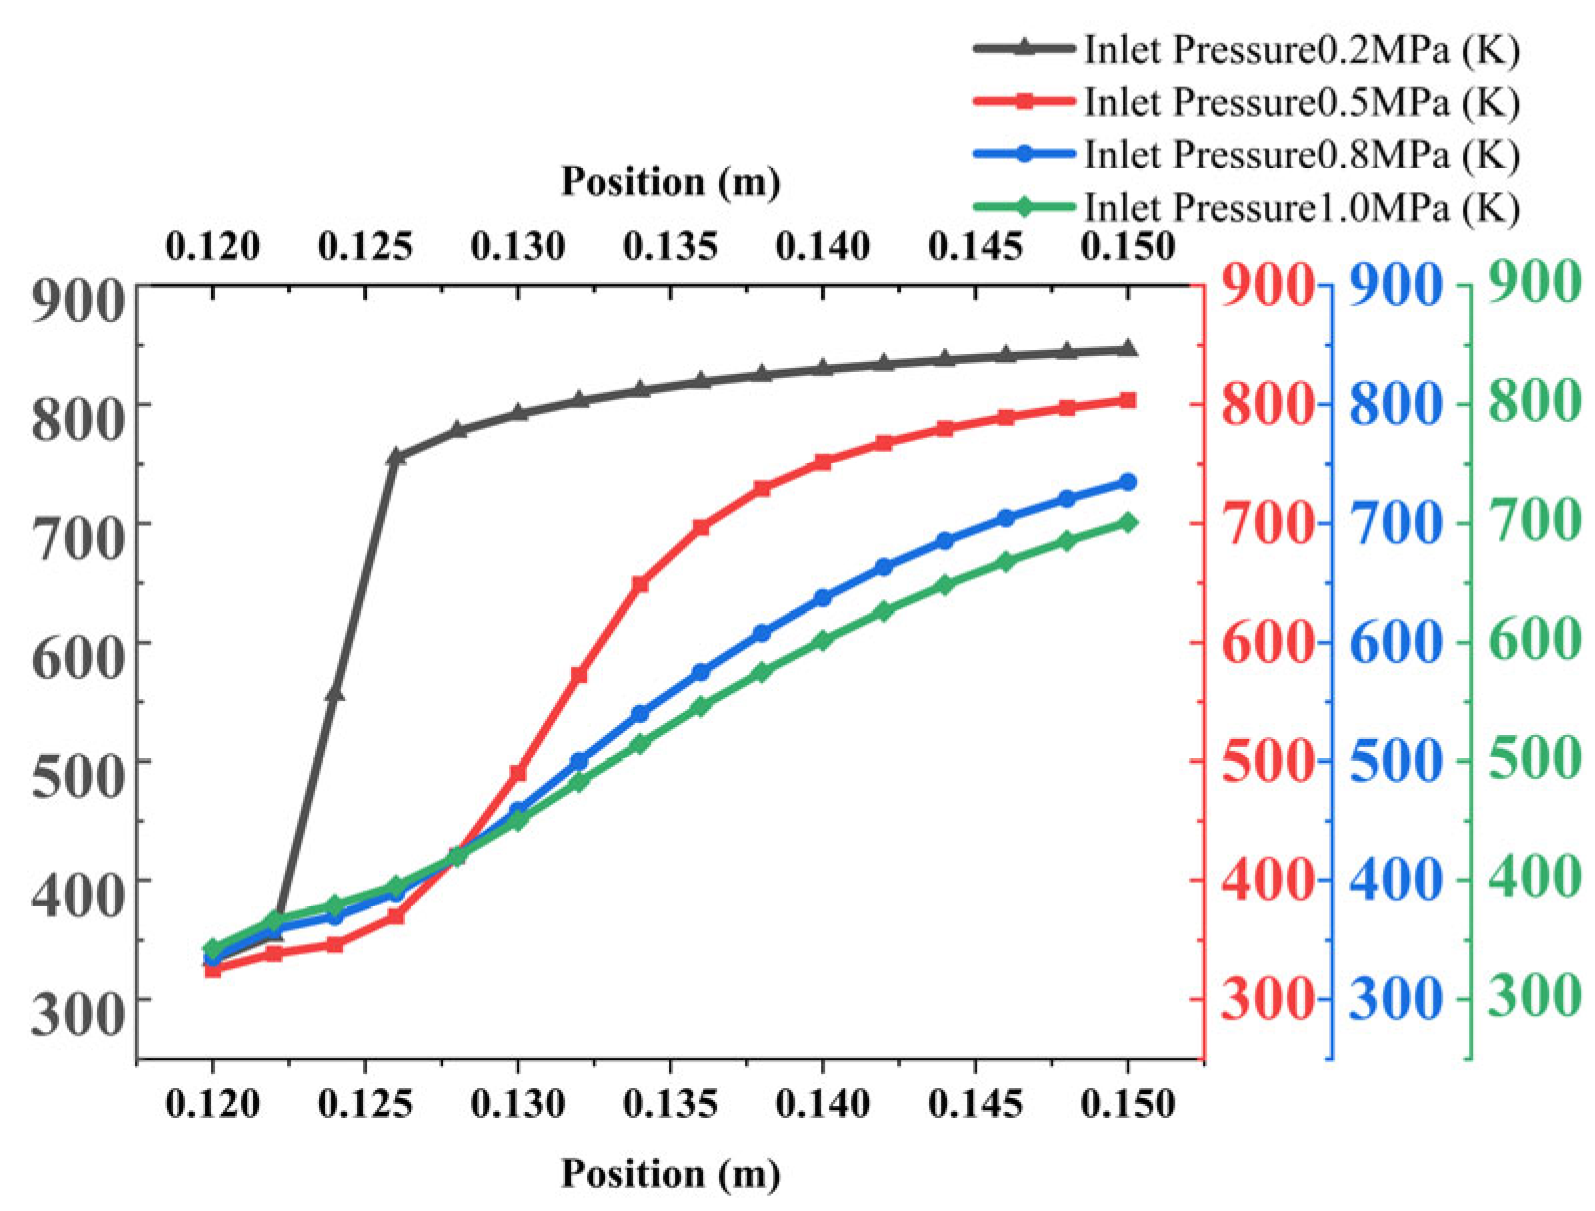
Figure 14 illustrates the variation in the cooling temperature field in front of the borescope probe under different cold flow inlet pressures. As the distance from the mirror increases, the temperature at each spatial monitoring point rises. The temperature increases rapidly up to the 0.135 m position, after which the rate of temperature rise slows, stabilizing by 0.15 m. As shown in the figure, a lower inlet pressure (e.g., 0.2 MPa) results in a more rapid temperature increase ahead of the probe; at 0.13 m, the temperature reaches approximately 800 K. In contrast, under higher inlet pressures, the temperature at the same location remains around 400–500 K. This difference is attributed to the formation of a more extensive cooling film at higher pressures, which enhances thermal protection in the region near the probe.
Figure 15 presents the temperature contour from the 0.1 m to 0.15 m cross-section. The cooling film formed by the coolant ejected from the impingement cooling ring is visible in front of the mirror. The low-temperature region is smallest at an inlet pressure of 0.2 MPa. As pressure increases, the cooling film coverage expands significantly until 0.8 MPa, beyond which no further noticeable expansion occurs. This behavior aligns with the previously observed influence of inlet pressure on the probe’s temperature distribution.
The influence of coolant inlet pressure on the thermal performance of an annular cooling structure was investigated under four pressure conditions: 0.2 MPa, 0.5 MPa, 0.8 MPa, and 1.0 MPa. The key findings are summarized as follows:
Mirror temperature and cooling efficiency: As shown in Figure 12, both the average and maximum mirror temperatures exhibit a non-monotonic relationship with increasing inlet pressure. The average temperature decreases from 329.90 K at 0.2 MPa to 312.81 K at 0.5 MPa, then increases to 319.24 K at 1.0 MPa. Cooling efficiency follows a similar trend, initially improving before declining beyond the optimum pressure. This behavior is attributed to the trade-off between cooling film stability and coolant consumption rate. At moderate pressures, the coolant forms a continuous protective film, whereas excessive pressure induces high velocity and mixing, reducing residence time and cooling effectiveness.
Flow and temperature distribution: Figure 13 illustrates that as pressure increases, the low-temperature region on the mirror initially expands and then contracts. Concurrently, the high-velocity zone continuously expands with pressure, becoming particularly pronounced above 0.8 MPa. This flow acceleration enhances convective heat transfer, corroborating the observed temperature trends. Figure 14 and Figure 15 further demonstrate that higher pressures significantly extend the cooling film’s spatial coverage, maintaining lower temperatures in regions farther from the mirror. The cooling film reaches its maximum coverage at 0.8 MPa, beyond which no notable expansion occurs.
Summary of optimal conditions: The annular cooling structure achieves optimal performance at a coolant inlet pressure of 0.5 MPa, yielding the lowest average mirror temperature (312.81 K) and highest cooling efficiency. This pressure balances coolant momentum and flow stability, promoting the formation of an effective insulating film without excessive consumption or mixing. Pressures below 0.5 MPa result in inadequate film coverage, while higher pressures diminish cooling performance due to reduced film adherence and increased mixing. For practical applications in aero-engine borescope cooling, 0.5 MPa is recommended to ensure efficient thermal protection and operational economy.
(2)
Influence of Coolant Inlet Temperature
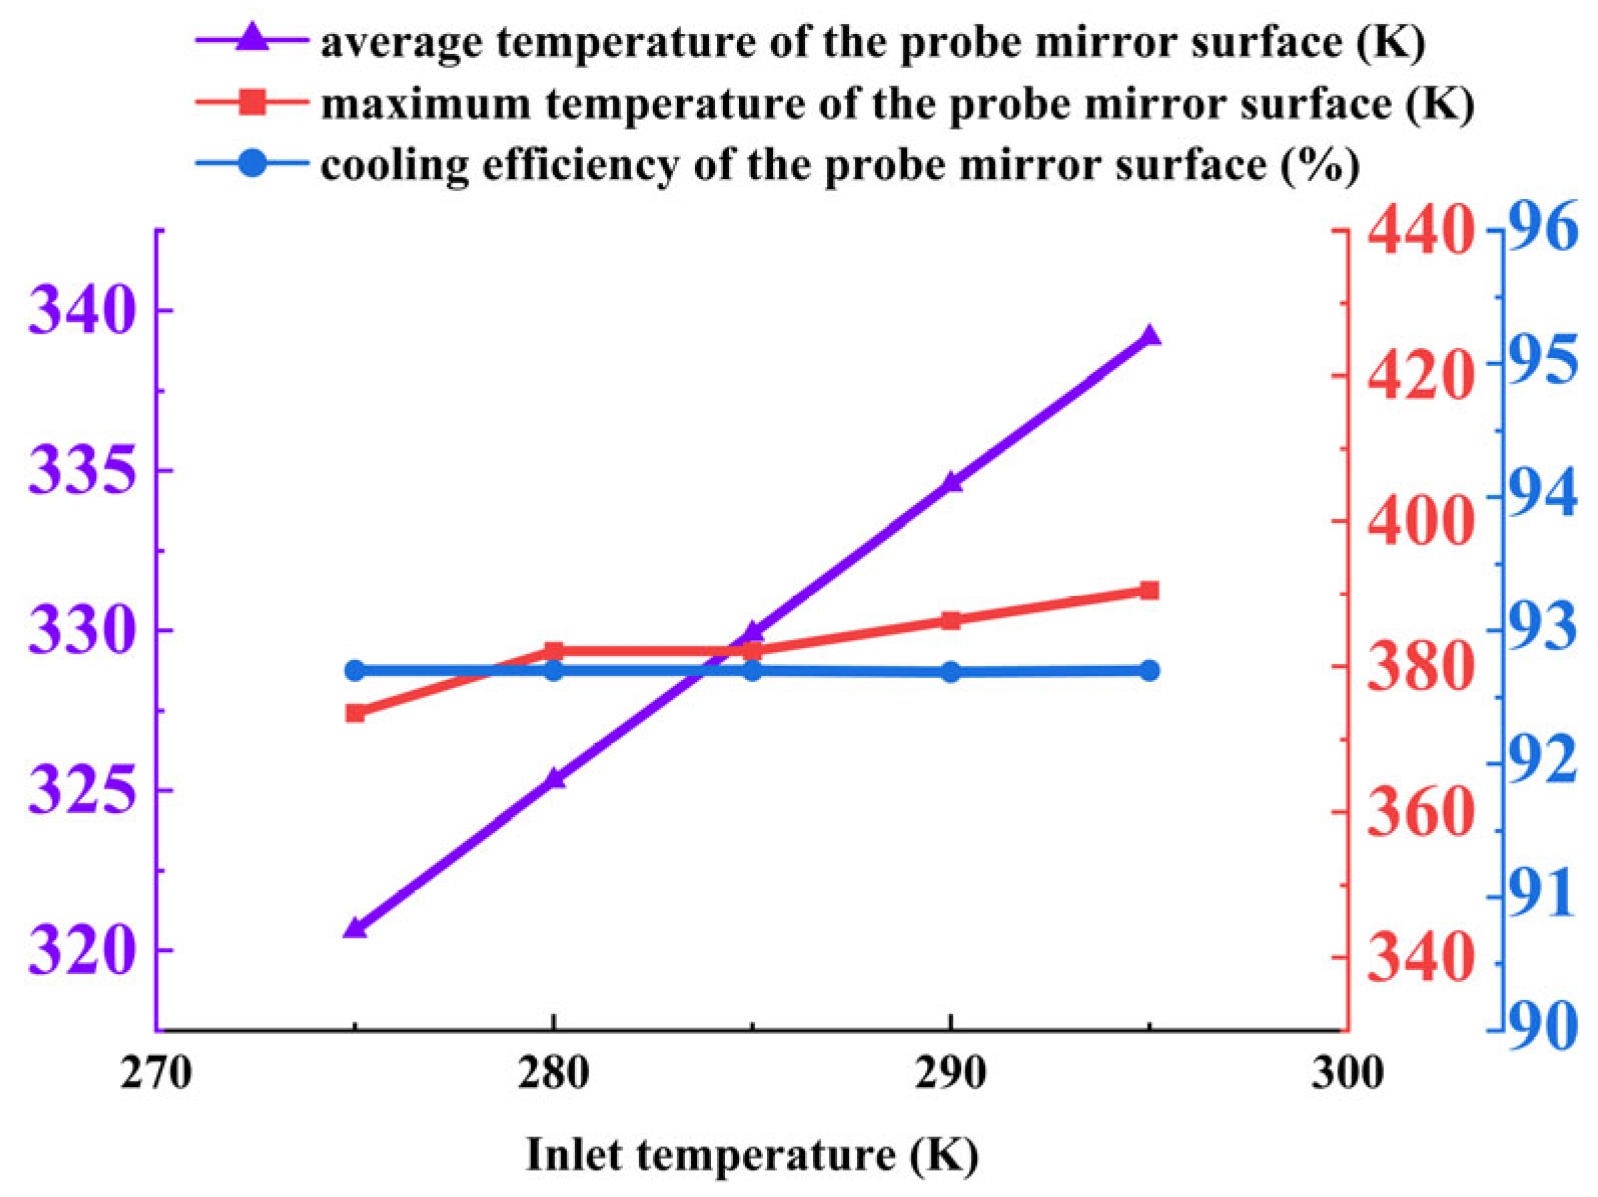
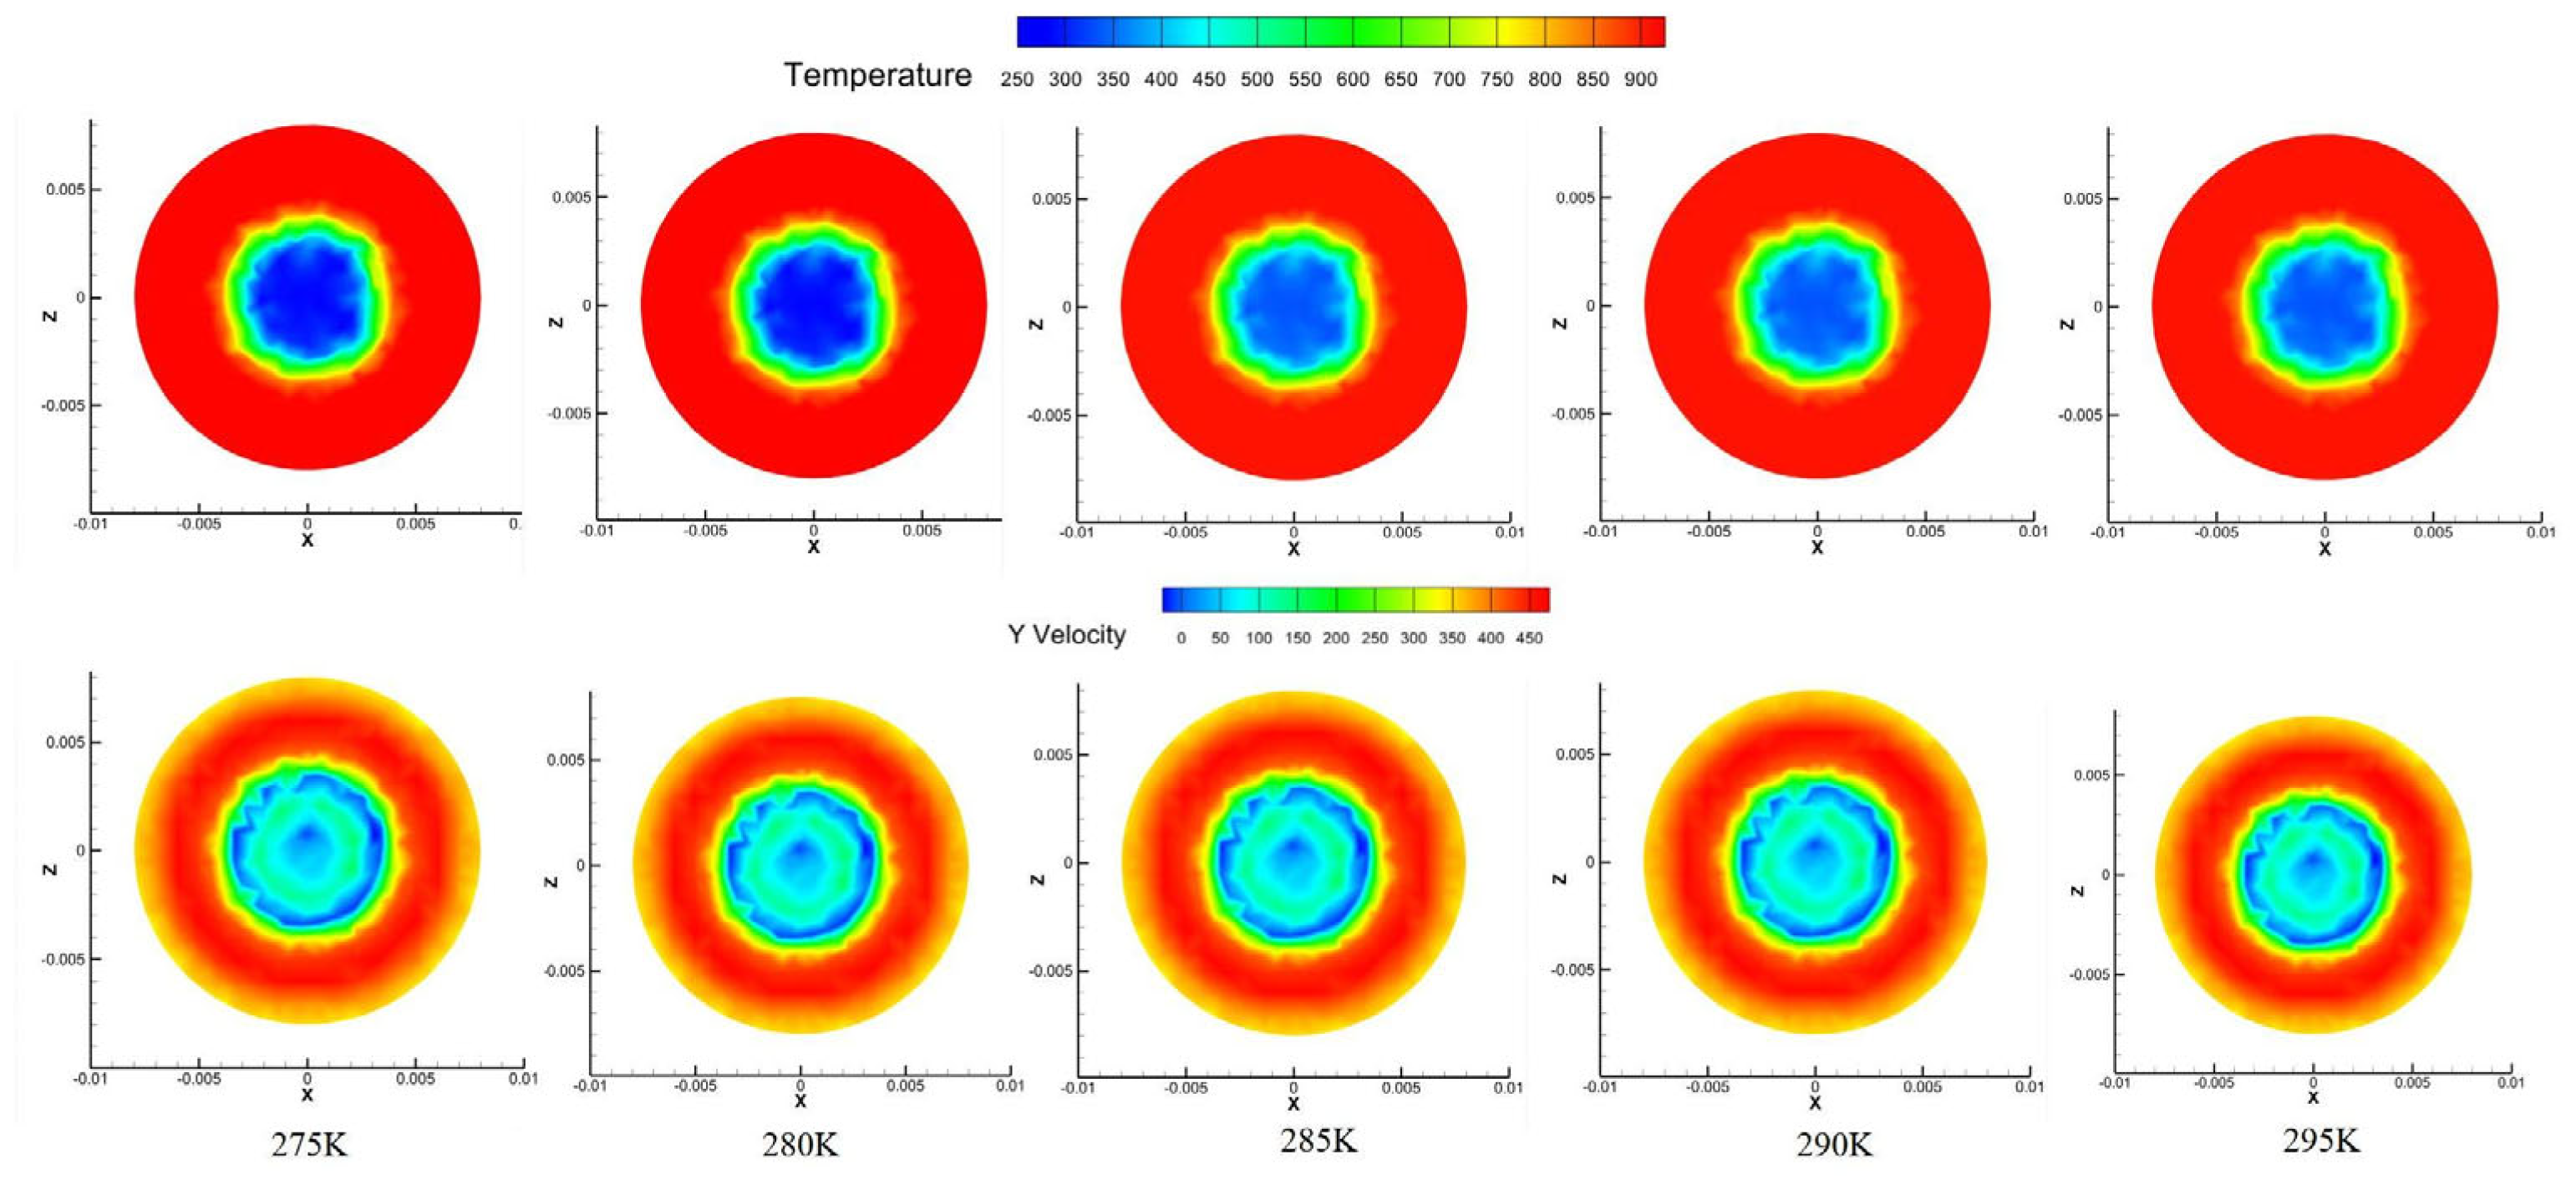
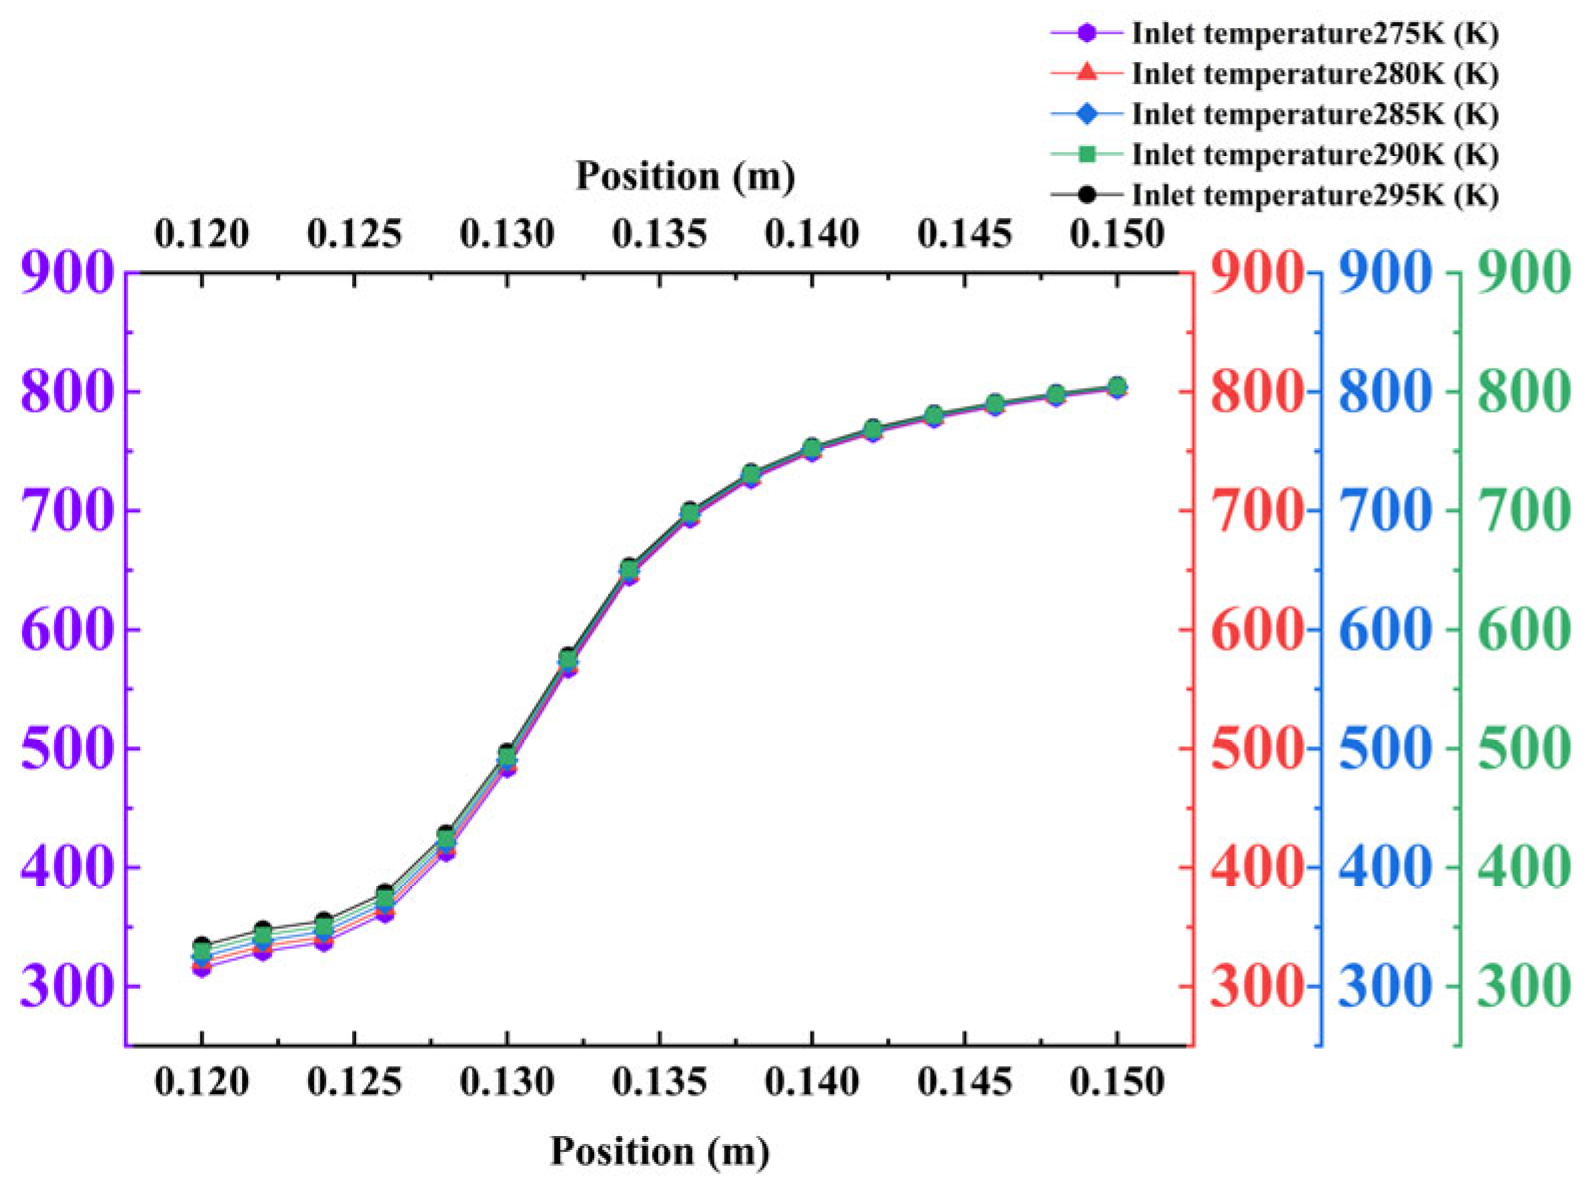
This section analyzes the influence of the coolant inlet temperature on the cooling characteristics of the borescope probe. Comparative analyses were conducted under five coolant temperature conditions: 275 K, 280 K, 285 K, 290 K, and 295 K. Figure 16, Figure 17, Figure 18 and Figure 19 present the resulting mirror temperature, cooling efficiency, temperature distribution on the mirror surface, and cooling temperature field, respectively.
Variations in the coolant inlet temperature primarily affect the absolute temperature of the mirror surface while exerting negligible influence on the cooling efficiency and the distribution pattern of the downstream temperature field. The specific manifestations are as follows:
Mirror temperature and cooling efficiency: The average mirror temperature exhibits a strictly linear and proportional relationship with the inlet temperature, increasing from 320.63 K at 275 K to 339.16 K at 295 K. This occurs because the coolant acts as a “cold source”; an increase in its temperature directly raises the equilibrium wall temperature under steady-state heat transfer conditions. The cooling efficiency remains largely unchanged, indicating that the adiabatic effectiveness of the cooling film is unaltered, and both the flow structure and the coverage characteristics of the film remain stable.
Temperature field distribution: Under different temperature conditions, the contour morphology of the temperature field is highly consistent, indicating that the inlet temperature does not alter the flow behavior of the coolant or the spatial structure of the cooling film. Temperature variations result only in a uniform shift in the temperature values across the field, while the gradient and morphology remain unchanged. This is because, under a constant inlet pressure, temperature changes do not affect the momentum of the coolant, and thus the formation and coverage capability of the cooling film remain intact.
Summary of optimal conditions: Within the investigated parameter range, an inlet temperature of 275 K yields the lowest average mirror temperature (320.63 K), representing the optimum cooling condition. If cooling efficiency is used as the evaluation metric, the performance across temperature conditions is comparable. Therefore, the selection of the inlet temperature should consider practical engineering requirements: lower temperatures are preferable when minimizing mirror temperature is critical, whereas moderately higher temperatures may be adopted when economic efficiency is a priority without compromising the thermal insulation performance of the cooling film.
(3)
Influence of Coolant Nitrogen Mixing
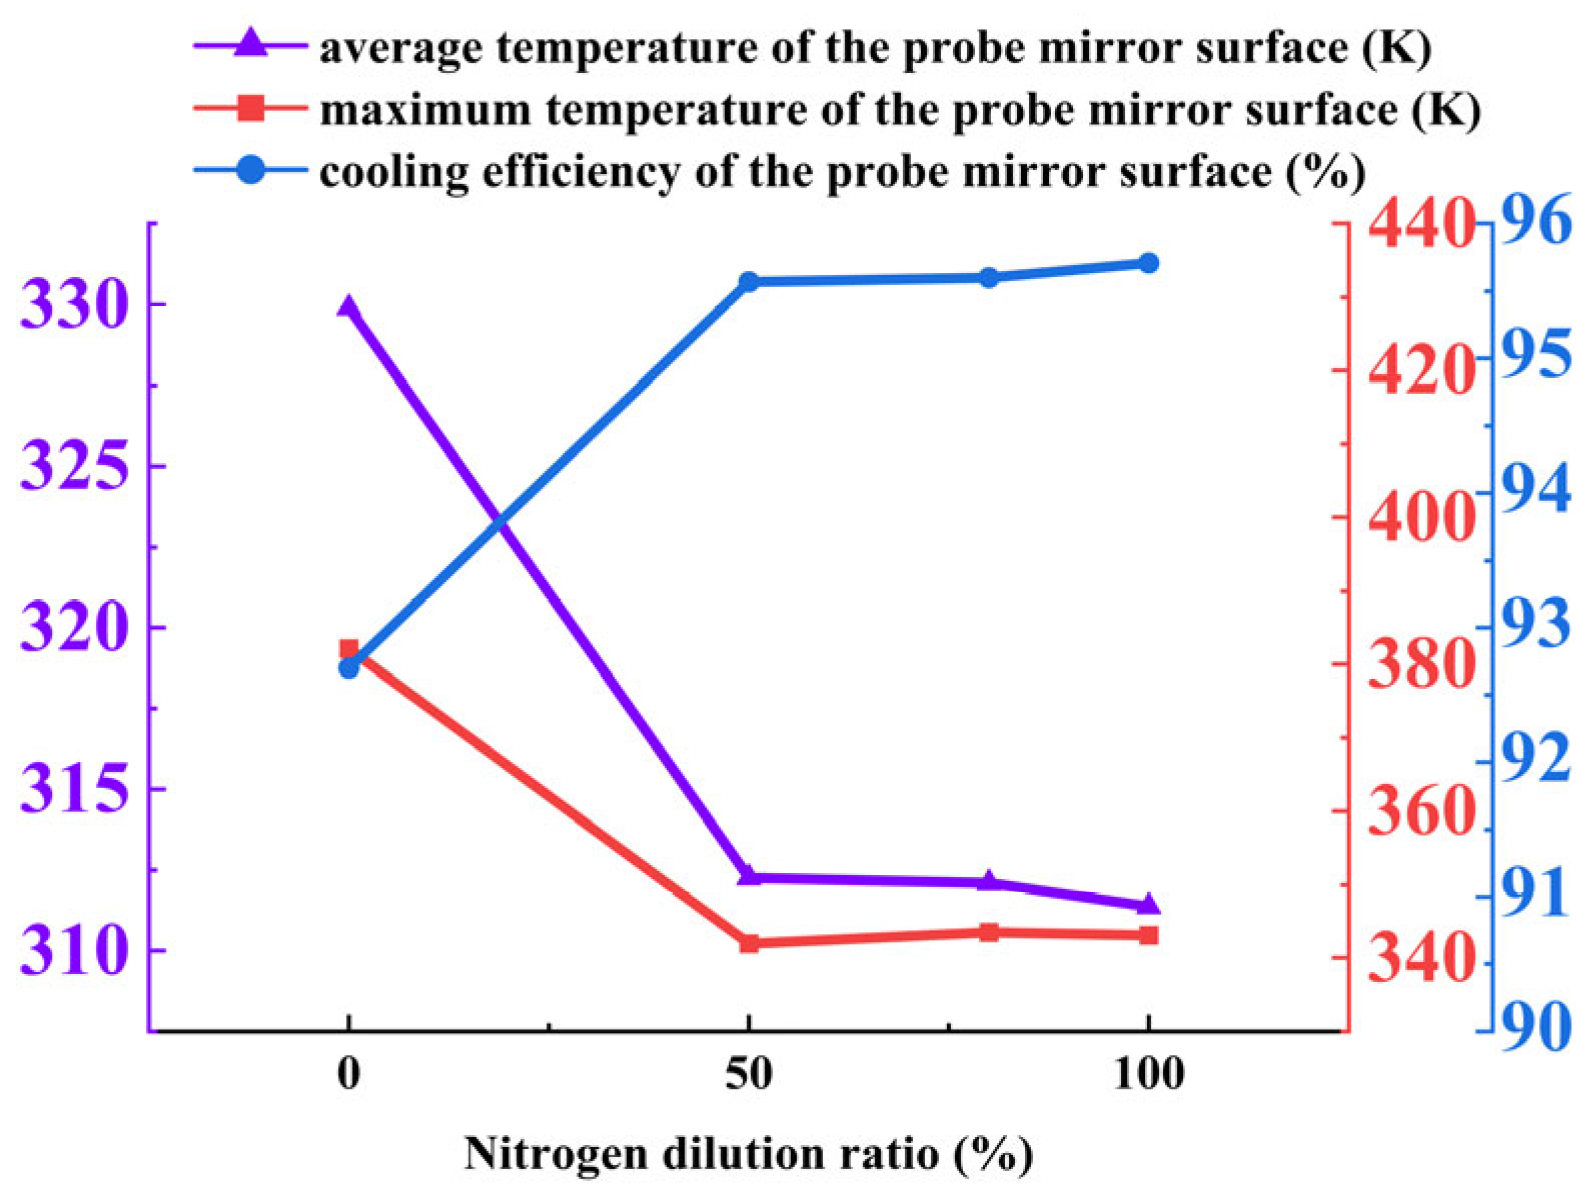
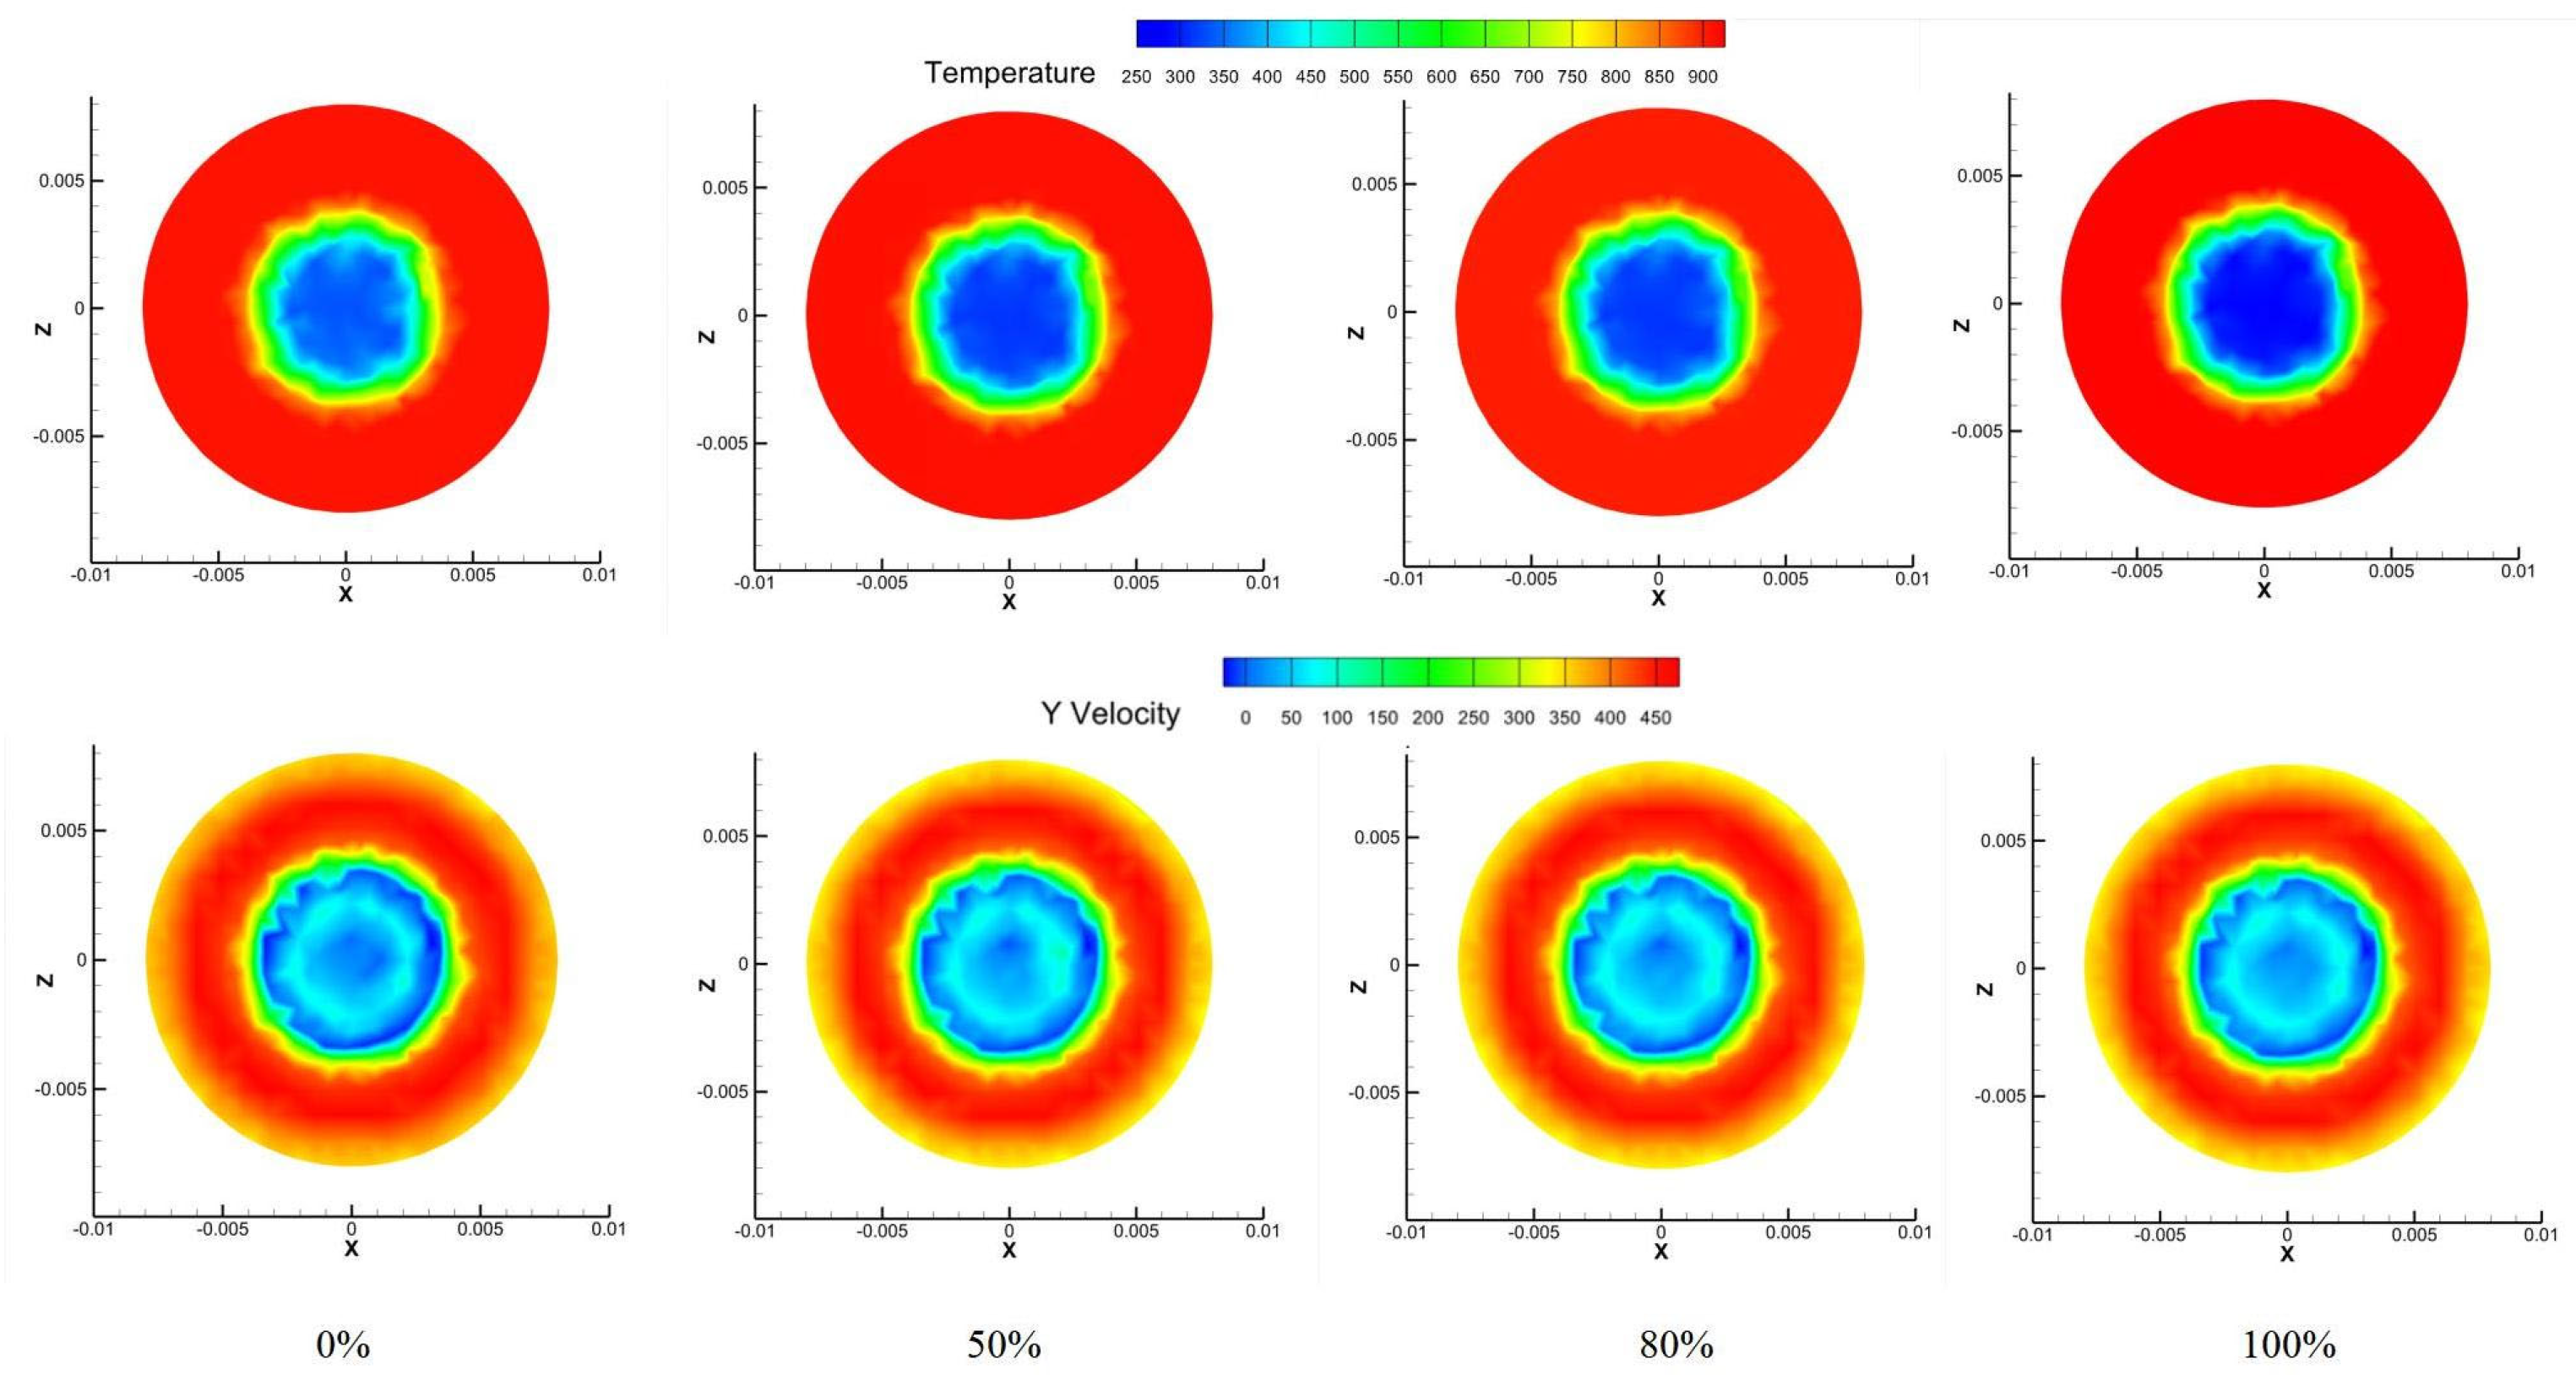
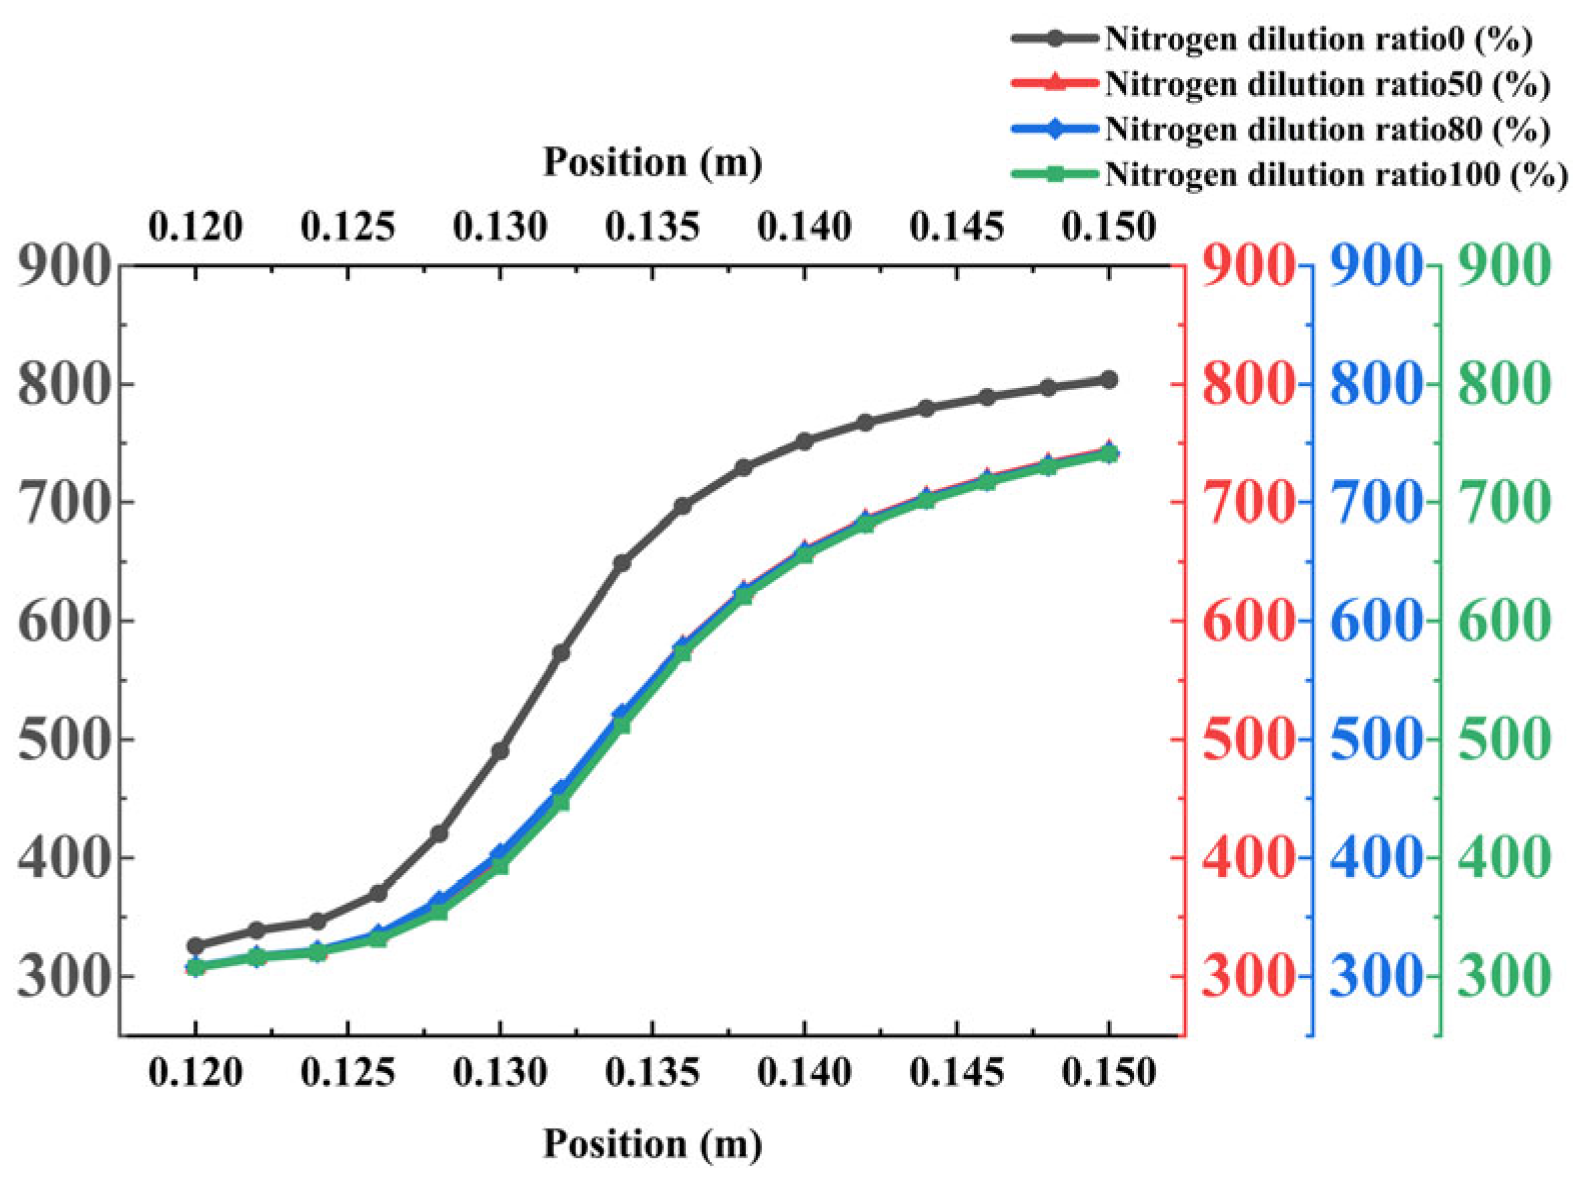
This section investigates the influence of nitrogen concentration in the cooling air on the cooling performance of the borescope probe. Four nitrogen mixing ratios—0%, 50%, 80%, and 100%—were considered in this study. The corresponding results are shown in Figure 20, Figure 21, Figure 22 and Figure 23.
The influence of the nitrogen concentration in the coolant on the thermal performance of an annular cooling structure was investigated under four mixing ratios: 0%, 50%, 80%, and 100%. The key findings are summarized as follows:
Mirror temperature and cooling efficiency: As shown in Figure 20, nitrogen doping significantly enhances cooling performance. The average mirror temperature decreases from 329.90 K (0% nitrogen) to 311.37 K (100% nitrogen), while the maximum temperature drops substantially from 382.14 K to 341.85 K. Correspondingly, the cooling efficiency shows notable improvement. This enhancement is attributed to nitrogen’s superior thermophysical properties, including higher specific heat capacity and improved thermal transport characteristics, which promote more efficient heat absorption and dissipation within the cooling film.
Flow velocity and temperature distribution: Figure 21 demonstrates that nitrogen doping moderately reduces the flow velocity on the mirror surface due to the lower density of nitrogen compared to air. However, this velocity reduction is accompanied by improved flow uniformity and stability, contributing to more consistent cooling coverage. The temperature contours reveal that the low-temperature region expands significantly with increasing nitrogen concentration, particularly at a 50% mixing ratio. Figure 22 and Figure 23 further confirm that the spatial morphology of the temperature field remains consistent across different mixing ratios, with nitrogen primarily enhancing heat transfer efficiency rather than altering the fundamental flow structure. The improved thermal performance results from the enhanced convective heat transfer capabilities of the nitrogen-enriched mixture.
Summary of optimal conditions: The cooling performance of the annular structure is markedly improved by nitrogen doping, with a 50% nitrogen mixing ratio identified as optimal. This ratio achieves the best balance between heat transfer enhancement and flow characteristics, yielding the lowest mirror temperatures and highest cooling efficiency. Higher nitrogen concentrations (80–100%) do not provide additional benefits, indicating a saturation point in thermal performance improvement. The reduced flow velocity at higher nitrogen concentrations is compensated for by improved heat transfer efficiency, maintaining overall cooling effectiveness. For practical applications in aero-engine borescope systems, a 50% nitrogen mixture is recommended to maximize cooling performance while maintaining operational feasibility and economic efficiency.
(4)
Influence of Cooling Ring Width
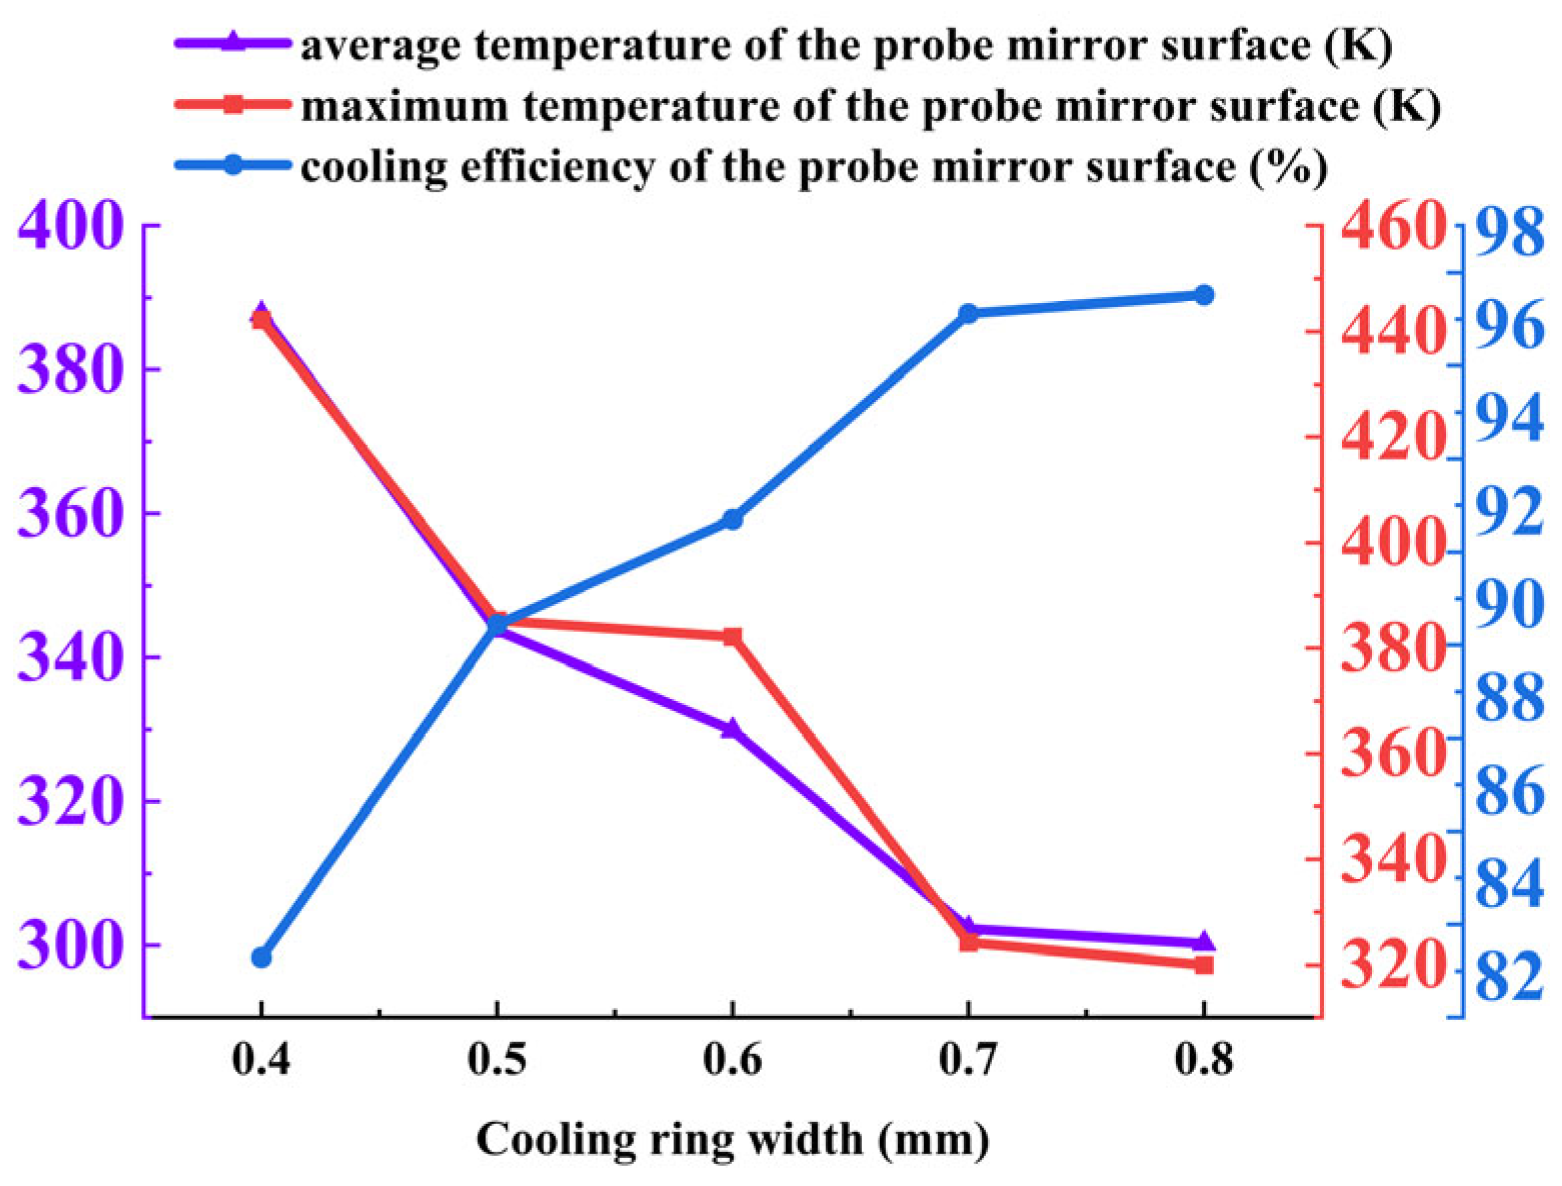
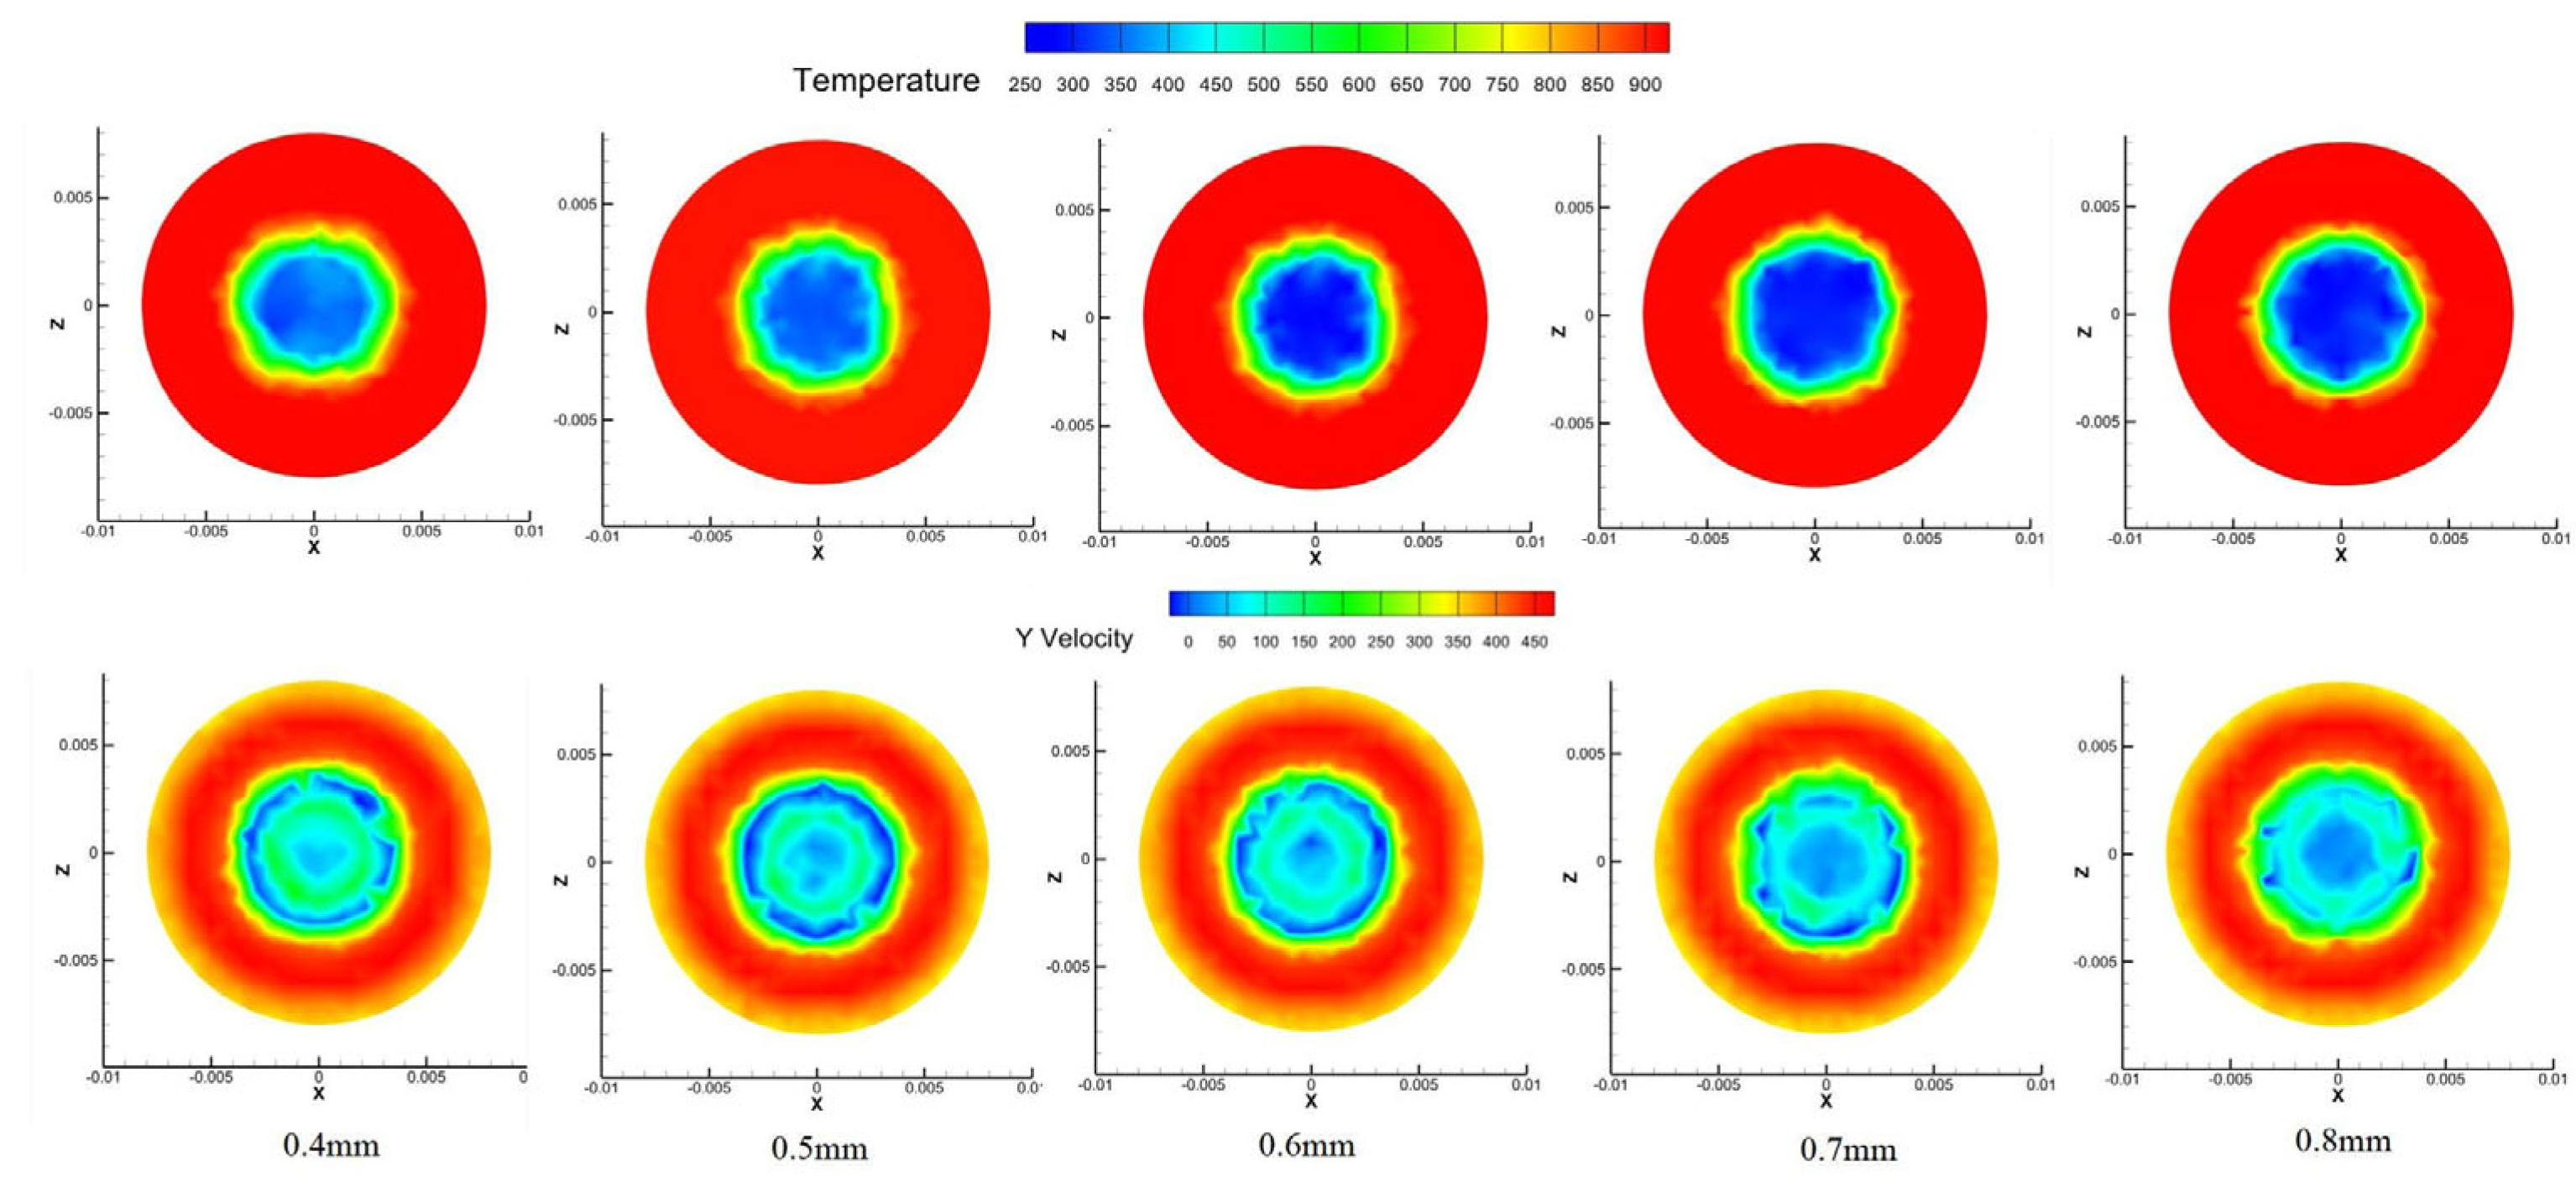
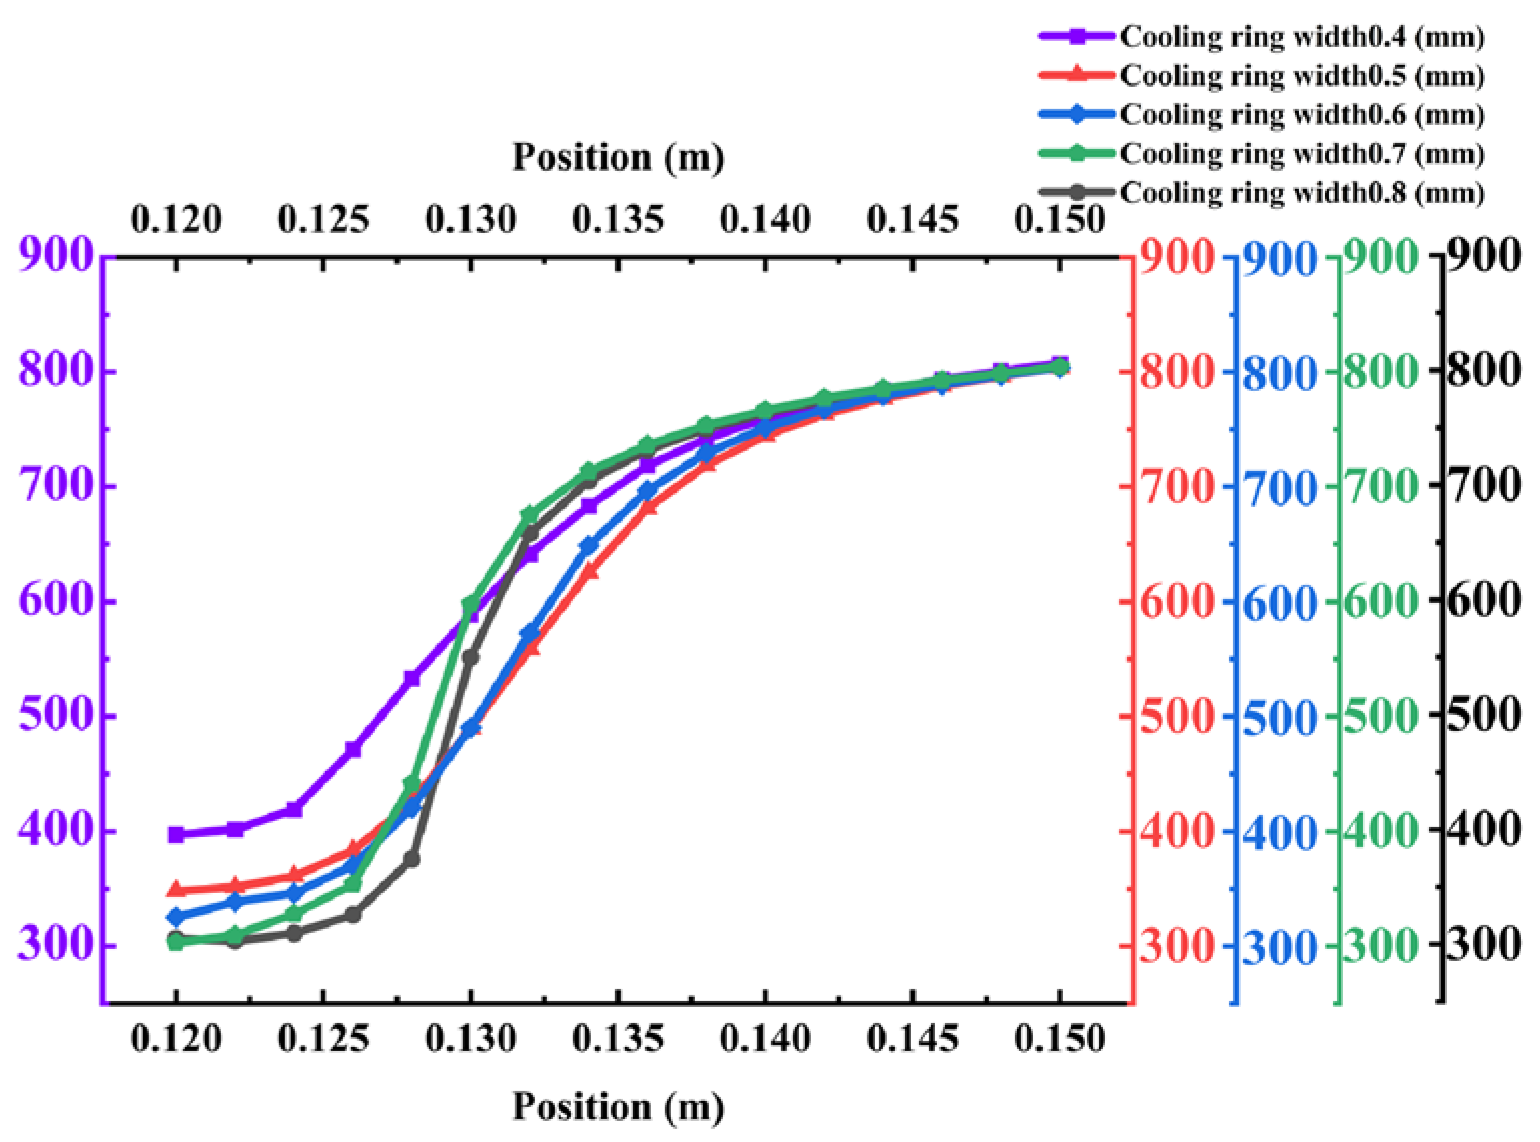
This section analyzes the influence of the cooling ring width on the cooling performance of the borescope probe. Five different cooling ring widths—0.4 mm, 0.5 mm, 0.6 mm, 0.7 mm, and 0.8 mm—were selected for comparative investigation. The corresponding results are presented in Figure 24, Figure 25, Figure 26 and Figure 27.
The influence of cooling ring width on the thermal performance of the annular cooling structure was investigated using five widths: 0.4 mm, 0.5 mm, 0.6 mm, 0.7 mm, and 0.8 mm. The key findings are summarized as follows:
Mirror temperature and cooling efficiency: As shown in Figure 24, both the average and maximum mirror temperatures decrease significantly with increasing ring width. The average temperature declines from 387.77 K at 0.4 mm to 300.25 K at 0.8 mm, while the maximum temperature drops from 442.25 K to 320.05 K. Correspondingly, the cooling efficiency shows continuous improvement. This enhancement is attributed to the increased coolant mass flow rate at larger widths, which improves the coverage and heat transfer capacity of the cooling film.
Flow velocity and temperature distribution: Figure 25 reveals that the flow velocity distribution on the mirror surface undergoes significant changes with increasing width. While larger widths enhance coolant flow rate, they also reduce the exit velocity due to the increased flow area. At smaller widths (0.4–0.5 mm), higher velocities are observed but with insufficient flow volume, resulting in poor cooling coverage. At a 0.6 mm width, an optimal balance is achieved between flow rate and velocity, providing both adequate coverage and sufficient momentum for effective heat transfer. Larger widths (0.7–0.8 mm) show further reduced velocities, compromising the cooling effectiveness in regions distant from the probe. Figure 23 and Figure 26 confirm that the temperature field distribution follows similar trends, with the most uniform thermal protection achieved at 0.6 mm width.
Summary of optimal conditions: The cooling ring width significantly affects the performance of the annular cooling structure. A width of 0.6 mm is identified as optimal, providing the best balance between coolant flow rate and exit velocity. This configuration keeps the average mirror temperature below 330 K while ensuring excellent lateral diffusion and thermal coverage. Smaller widths (0.4–0.5 mm) result in inadequate cooling due to limited flow volume, while larger widths (0.7–0.8 mm) suffer from reduced velocity, impairing cooling effectiveness in distal regions. For practical applications in aero-engine borescope systems, a cooling ring width of 0.6 mm is recommended to ensure comprehensive thermal protection while maintaining efficient coolant utilization.

4.3.2. Ring–Slit Structure Cooling Flow Field Analysis

(1)
Influence of Coolant Inlet Pressure
For the ring–slit structure, this study employs the same pressure parameters as those used for the circular structure. Four coolant inlet pressures were applied: 0.2, 0.5, 0.8, and 1.0 MPa. The specific results of the analysis are presented below.
Mirror temperature and cooling efficiency: As shown in Figure 28, the average mirror temperature decreases initially and then increases with rising coolant pressure, while the cooling efficiency first increases and then decreases. The optimal cooling performance occurs at 0.5 MPa, with an average mirror temperature of 331.37 K and a cooling efficiency of 92.4%. This trend is attributed to the requirement that the total pressure of the coolant must exceed that of the mainstream flow to effectively cover the probe surface. Excessively high pressure increases flow velocity, leading to intensified mixing and reduced residence time, thereby diminishing cooling effectiveness.
Temperature distribution characteristics: Figure 29 reveals that the low-temperature region between the segmented ring slits expands as pressure increases, significantly improving cooling coverage. However, beyond 0.5 MPa, the expansion of the cooling region saturates. At lower pressures (e.g., 0.2 MPa), the cooling airflow fails to fully cover the areas between the slits, resulting in a cloverleaf-shaped cooling pattern. As pressure rises, the coolant undergoes sufficient heat exchange with the surrounding hot environment, causing the cooling zone to become more circular and uniform.
Temperature field evolution: Figure 30 indicates that the temperature rise trend remains consistent across pressure conditions, but the rate of increase varies markedly. At 0.2 MPa, the temperature rises rapidly, reaching 750 K by 0.125 m. At 0.5 MPa and above, the temperature increase slows significantly, suggesting the formation of a stable and continuous cooling film.
Summary of optimal conditions: The ring–slit structure achieves optimal cooling performance at a coolant inlet pressure of 0.5 MPa, balancing high cooling efficiency (92.4%) and low mirror temperature (331.37 K). This pressure ensures sufficient coolant momentum to form a stable film without excessive velocity, which would promote mixing and reduce effectiveness. Lower pressures result in inadequate coverage and higher temperatures, while higher pressures offer no further improvement and increase coolant consumption. Thus, 0.5 MPa is recommended for practical applications to maximize cooling performance and operational efficiency.
(2)
Influence of Coolant Inlet Temperature
The influence of coolant inlet temperature on the cooling performance of the ring–slit structure was investigated under five temperature conditions: 275 K, 280 K, 285 K, 290 K, and 295 K. The key findings are summarized below:
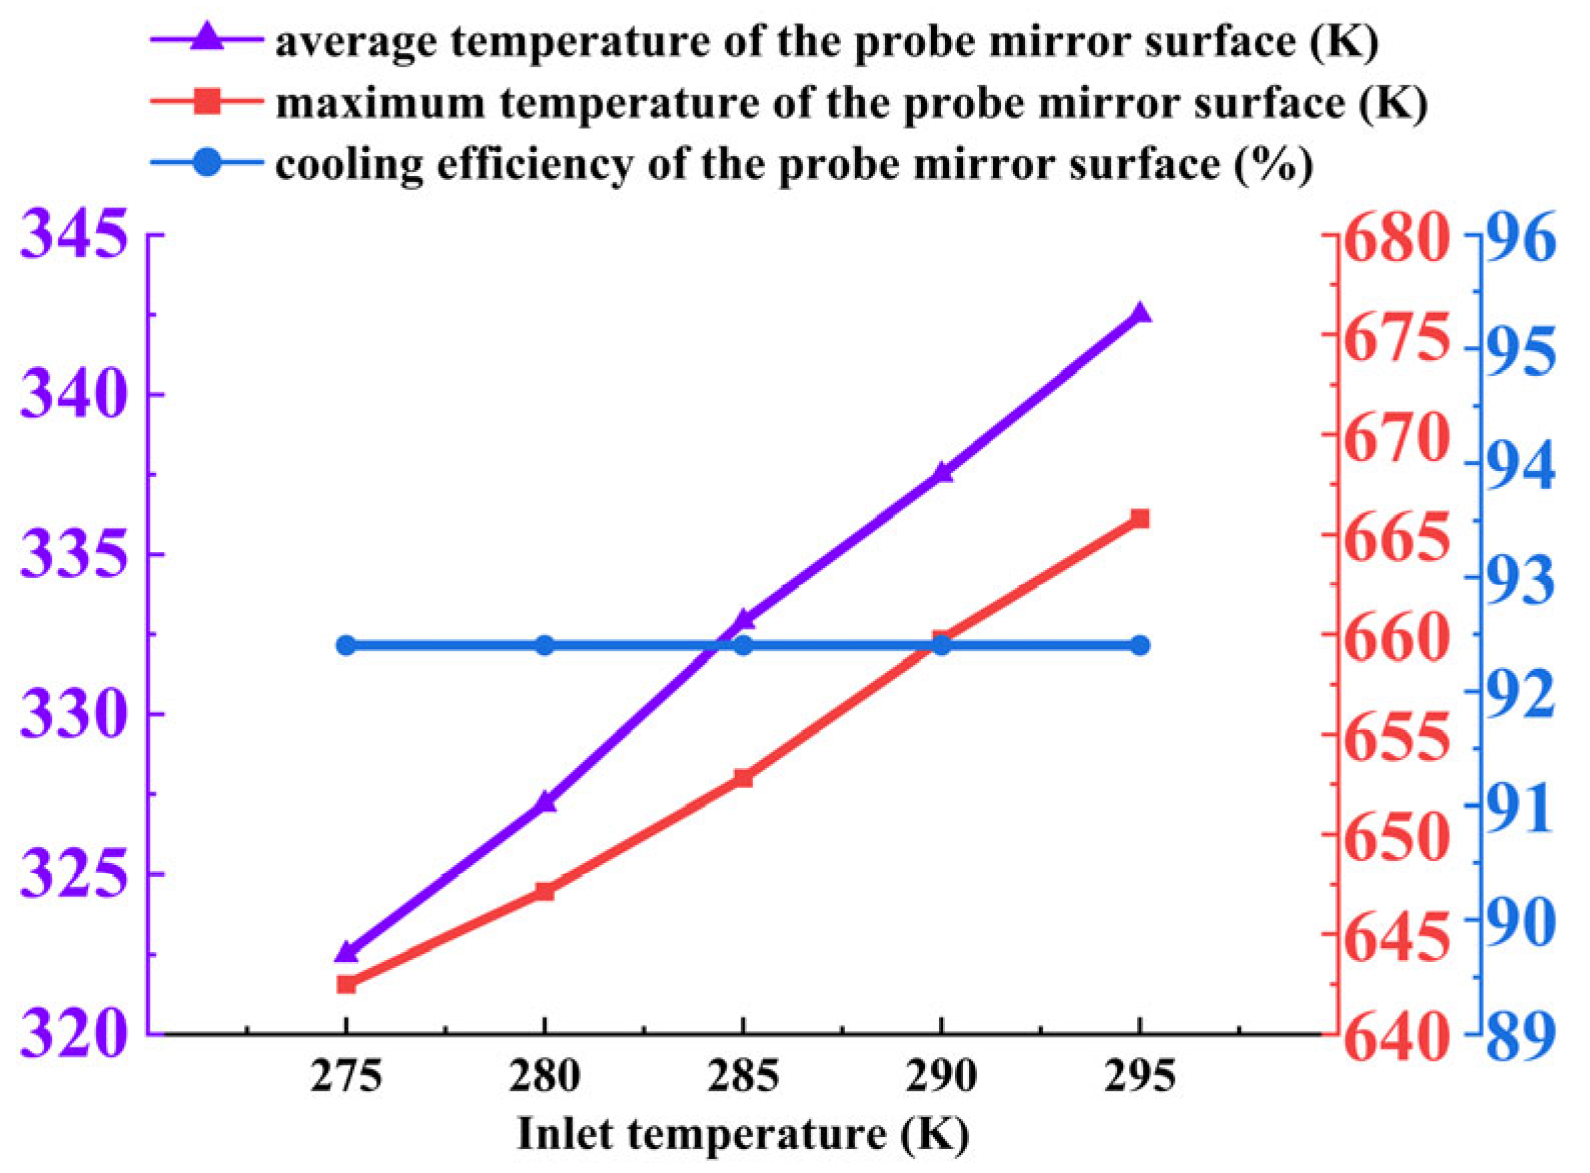
Mirror temperature and cooling efficiency: As shown in Figure 31, the average temperature of the probe mirror exhibits a linear relationship with the coolant inlet temperature, increasing from 322.49 K at 275 K to 340.97 K at 295 K. In contrast, the cooling efficiency remains constant at 92.40% across all temperature conditions. This occurs because the coolant temperature directly influences the baseline temperature of the cooling source but does not alter the flow characteristics or the adiabatic effectiveness of the cooling film.
Temperature field distribution: Analysis of Figure 32 indicates that variations in inlet temperature do not affect the spatial distribution of the temperature field. The morphology and gradient of the temperature contours remain consistent across all cases. The cooling film coverage, flow direction, and lateral diffusivity remain unchanged, confirming that temperature only shifts the absolute temperature values uniformly without impacting the flow structure or cooling mechanisms.
Summary of optimal conditions: The cooling performance of the ring–slit structure is primarily influenced by the absolute temperature of the coolant. While lower inlet temperatures, such as 275 K, yield the lowest mirror temperature (322.49 K), the cooling efficiency remains unaffected by temperature variations. Therefore, the selection of the optimal inlet temperature should be based on specific application requirements: lower temperatures are suitable when minimizing the absolute mirror temperature is critical, whereas higher temperatures may be used to reduce operational costs without sacrificing cooling efficiency.
(3)
Influence of Coolant Nitrogen Mixing
The influence of the nitrogen concentration in the cooling air on the thermal performance of the borescope probe under the ring–slit configuration was investigated. Four nitrogen mixing ratios—0%, 50%, 80%, and 100%—were examined. The key findings are summarized as follows:
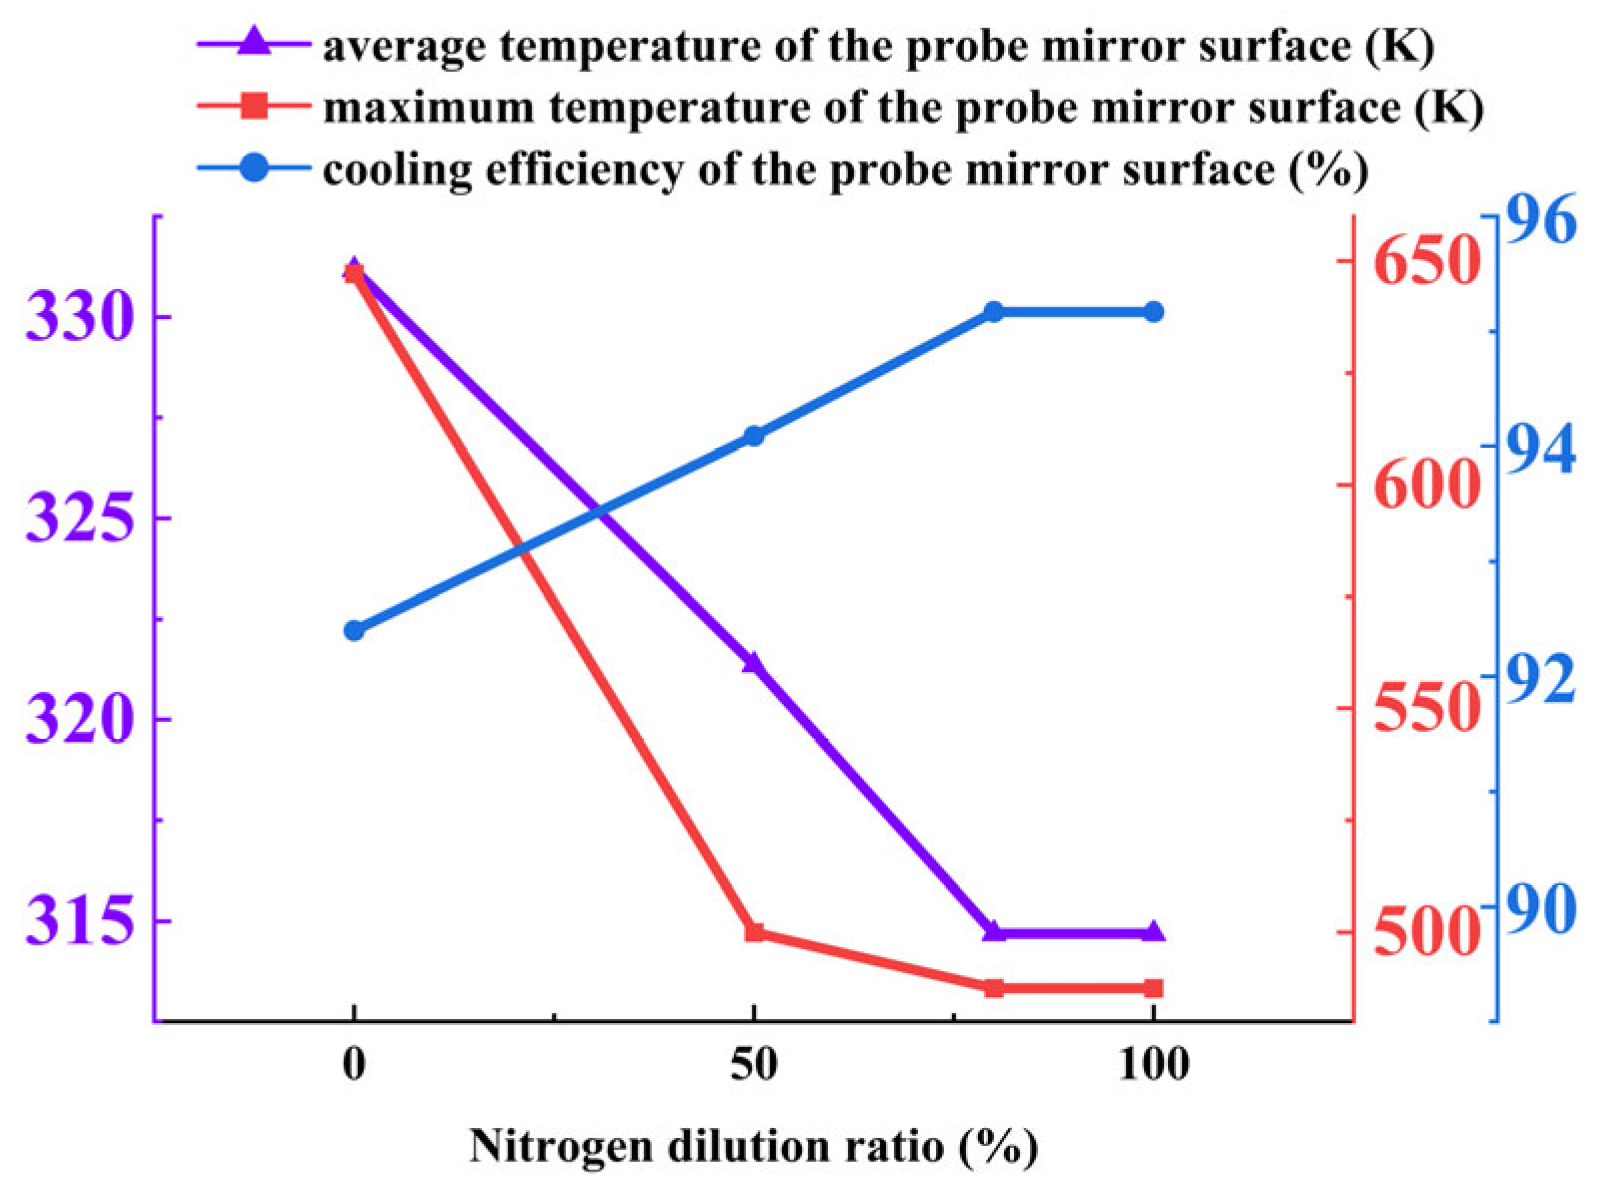
Mirror temperature and cooling efficiency: As illustrated in Figure 33, nitrogen doping significantly enhances cooling performance. The average mirror temperature decreases from 331.17 K (0% nitrogen) to 314.69 K (100% nitrogen), while the maximum temperature drops substantially from 647.14 K to 487.50 K. Correspondingly, the cooling efficiency increases from 92.40% to 95.17%. This improvement is attributed to the superior thermophysical properties of nitrogen, including higher specific heat capacity and improved thermal transport characteristics, which enhance heat absorption and dissipation within the cooling film.
Temperature field distribution: Analysis of Figure 34 indicates that nitrogen doping considerably expands the low-temperature region on the probe mirror. A notable enlargement of the cooling zone is observed as the nitrogen ratio increases from 0% to 50%. Beyond 50%, further increases yield diminishing returns, with the temperature field morphology remaining largely unchanged at 80% and 100% nitrogen.
Summary of optimal conditions: The introduction of nitrogen into the coolant markedly improves the cooling effectiveness of the ring–slit structure. A nitrogen mixing ratio of 50% is identified as the optimum ratio, providing the best balance between performance enhancement and practical applicability. At this ratio, the cooling effect is significantly improved without substantial additional gains at higher concentrations. These results suggest that nitrogen doping can be strategically used to enhance thermal protection in high-temperature environments, with 50% offering a cost-effective and efficient solution for borescope probe cooling applications.
(4)
Influence of Cooling Slit Width
The influence of cooling slit width on the thermal performance of the borescope probe was investigated under the ring–slit configuration. Four slit widths—0.4 mm, 0.5 mm, 0.6 mm, and 0.8 mm—were compared. The key observations are summarized below:
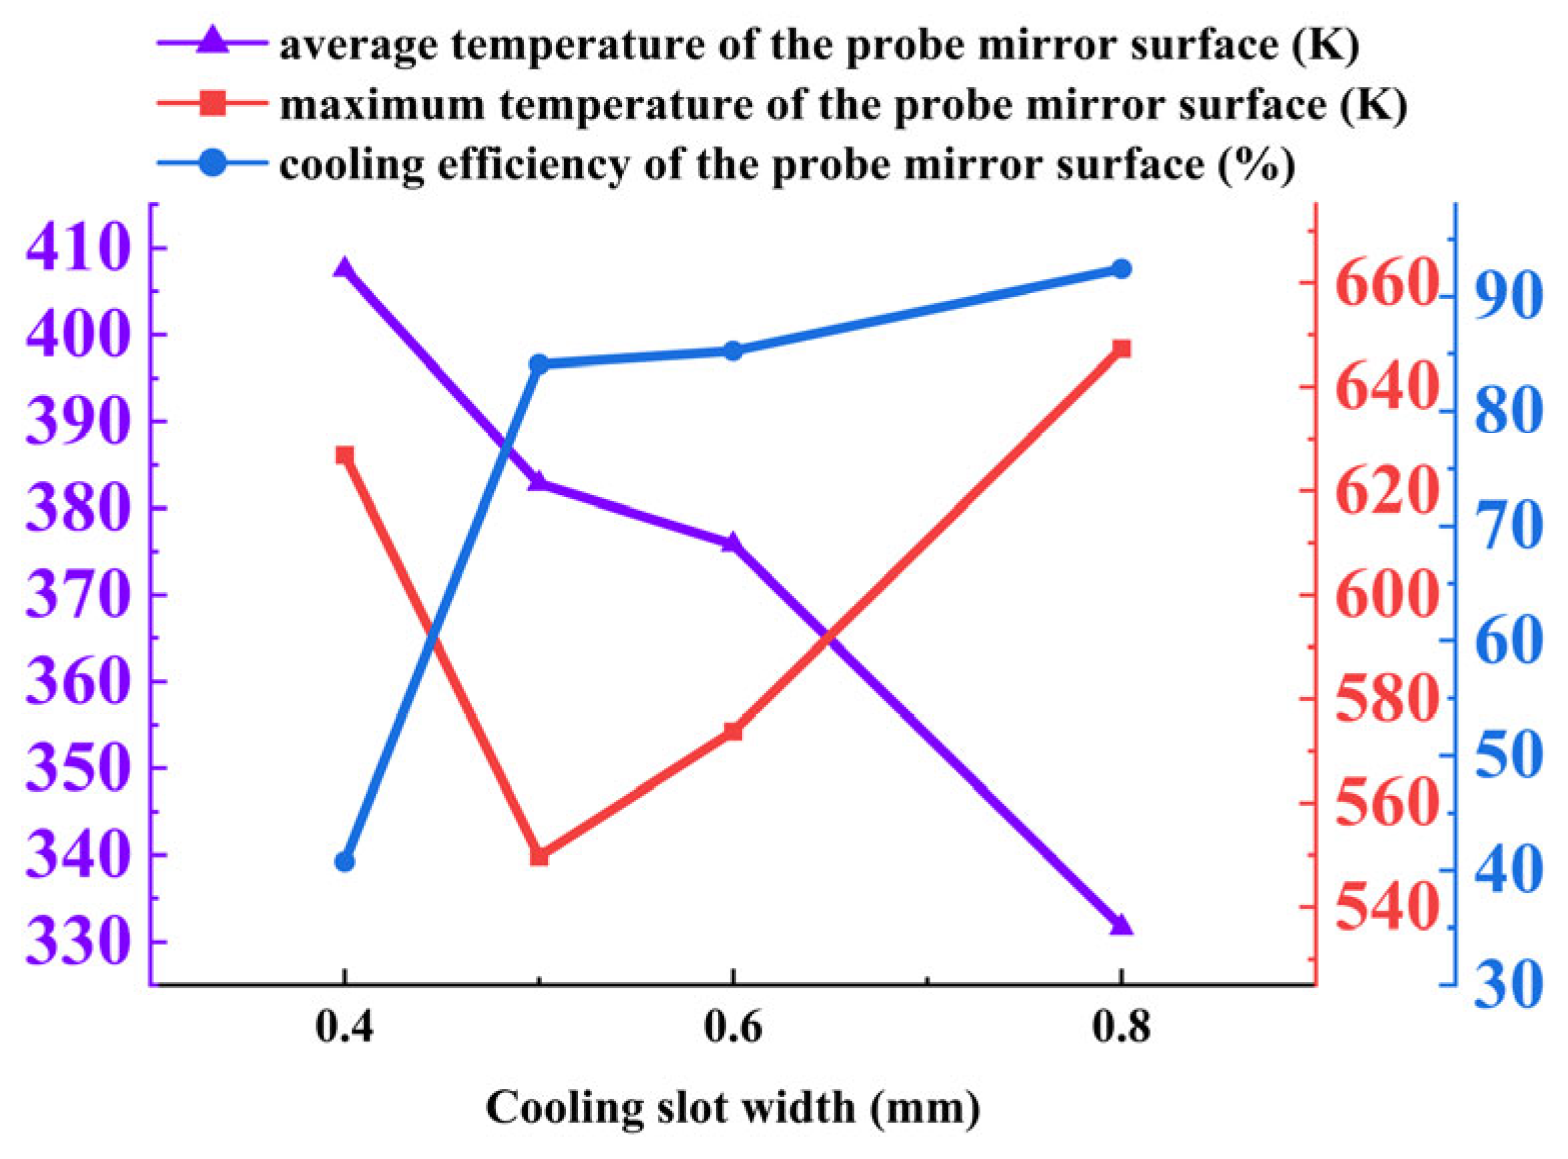
Mirror temperature and cooling efficiency: As shown in Figure 35, increasing the slit width significantly improves cooling performance. The average mirror temperature decreases substantially from 407.54 K at 0.4 mm to 331.68 K at 0.8 mm, while the cooling efficiency increases markedly from 40.75% to 92.40%. However, the maximum mirror temperature exhibits a non-monotonic trend, reaching a minimum of 549.73 K at 0.5 mm and rising above 625 K at both 0.4 mm and 0.8 mm. This behavior is attributed to the trade-off between coolant flow rate and velocity: narrower slits provide insufficient flow for adequate cooling, while wider slits reduce flow velocity, compromising local heat transfer and resulting in incomplete cooling in certain regions.
Temperature field distribution: Analysis of Figure 36 and Figure 37 indicates that the cooling area on the mirror surface expands with increasing slit width due to higher coolant flow rate. The temperature field distribution ahead of the probe remains consistent across different slit widths, with temperature curves largely overlapping except for the 0.4 mm case, where temperatures are notably higher. This suggests that slit width has limited influence on the overall morphology of the temperature field but significantly affects the absolute temperature levels and local cooling uniformity.
Summary of optimal conditions: The cooling slit width has a profound impact on the performance of the ring–slit cooling structure. A width of 0.5 mm is identified as the optimum width, achieving the lowest maximum mirror temperature (549.73 K) while maintaining excellent average temperature reduction and cooling efficiency. Narrower widths (e.g., 0.4 mm) suffer from insufficient coolant flow, whereas wider widths (e.g., 0.8 mm) reduce flow velocity, leading to localized overheating. These findings highlight the importance of balancing flow rate and velocity to ensure efficient and uniform cooling. For practical applications, a slit width of 0.5 mm is recommended to maximize thermal protection and operational reliability.

4.3.3. Hole-Type Structure Cooling Flow Field Analysis

(1)
Influence of Coolant Inlet Pressure
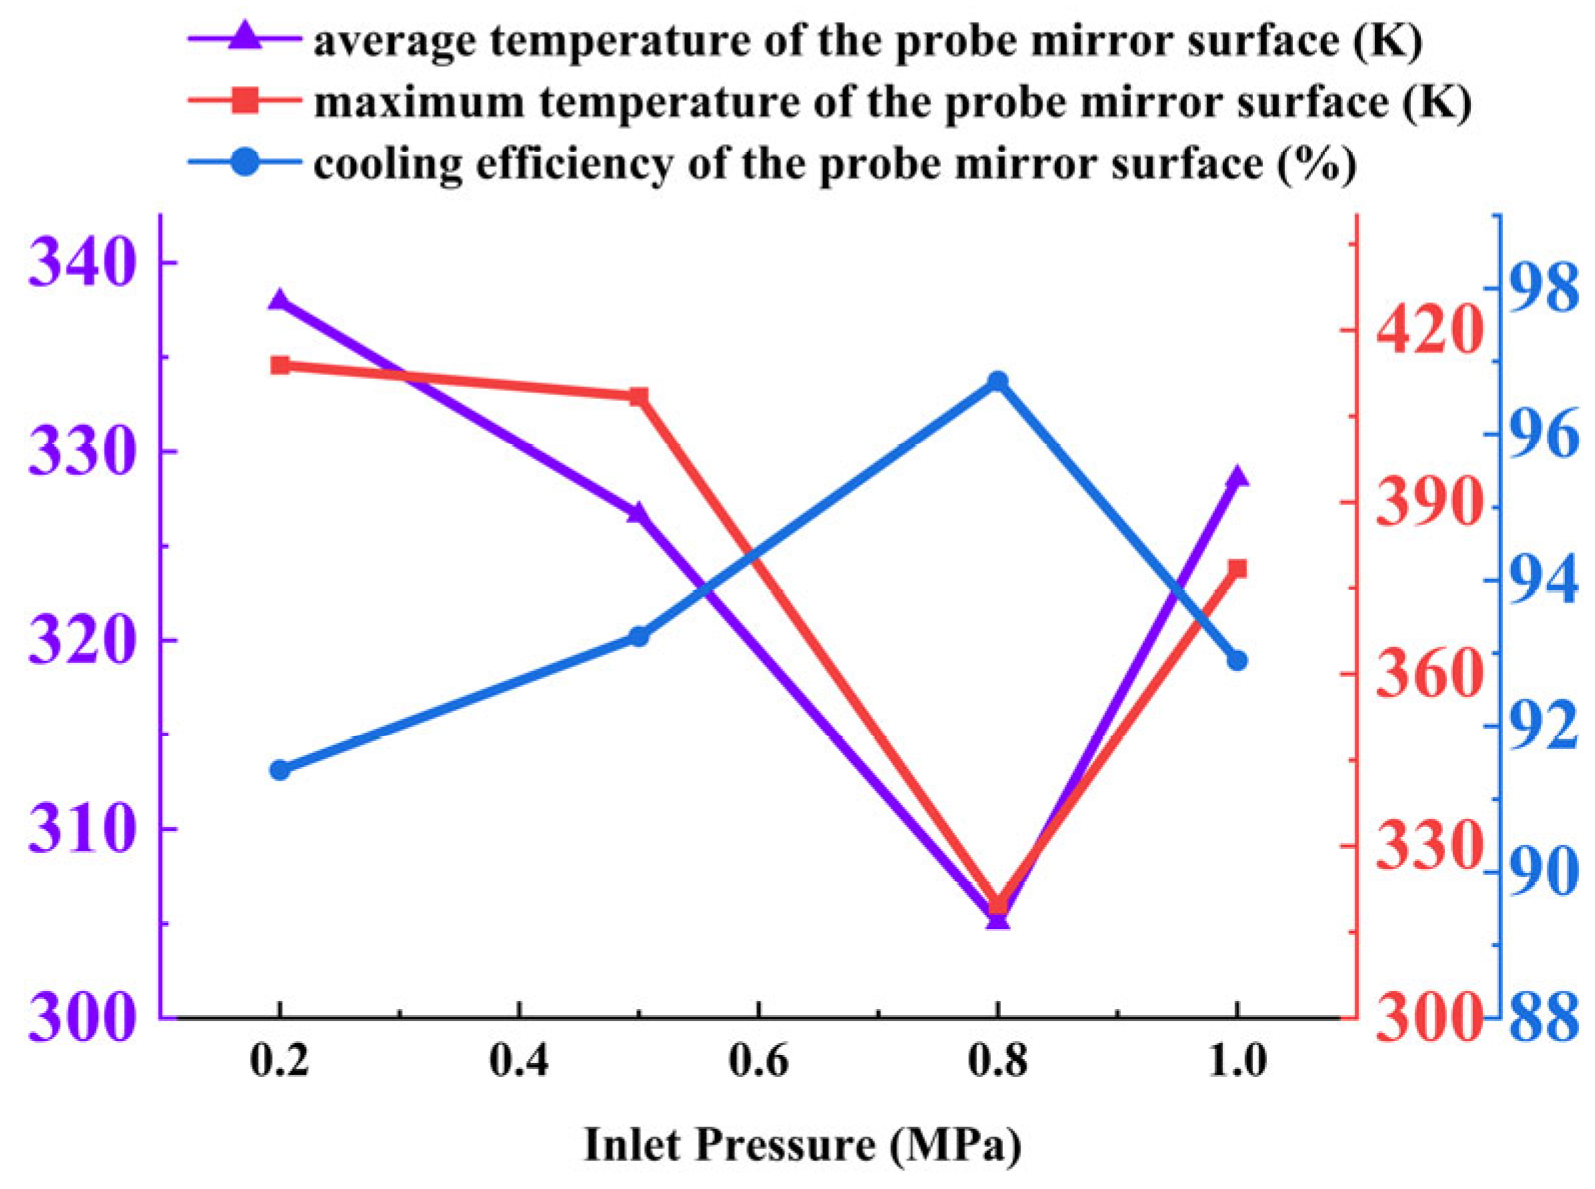
The influence of coolant inlet pressure on the cooling performance of the hole-type structure was investigated. Key observations from Figure 38, Figure 39 and Figure 40 are summarized as follows:
Mirror temperature and cooling efficiency: As shown in Figure 38, the average and maximum temperatures of the probe mirror exhibit a non-monotonic relationship with the inlet pressure, initially decreasing and then increasing as the pressure rises from 0.2 MPa to 1.0 MPa. The optimum cooling performance occurs at 0.8 MPa, where the average and maximum mirror temperatures reach their lowest values of 305.10 K and 319.85 K, respectively, and the cooling efficiency peaks at 96.73%. This trend is attributed to the balance between coolant momentum and flow distribution: moderate pressure ensures sufficient penetration and formation of a continuous cooling film, while excessive pressure promotes mixing and reduces residence time.
Temperature field distribution: Analysis of Figure 39 and Figure 40 indicates that the inlet pressure has minimal impact on the temperature distribution very close to the mirror surface. However, as the distance from the mirror increases, higher pressures significantly expand the cooling coverage and enhance the effectiveness of the air film.
Summary of optimal conditions: The hole-type cooling structure demonstrates superior performance at a coolant inlet pressure of 0.8 MPa, achieving the lowest mirror temperatures and the highest cooling efficiency (96.73%). This pressure provides the ideal compromise between coolant momentum and flow stability, ensuring effective film formation without excessive mixing. Lower pressures result in inadequate cooling coverage, while higher pressures diminish performance due to reduced film adherence and increased mixing. For practical applications in aero-engine environments, 0.8 MPa is recommended to maximize cooling effectiveness and operational reliability.
(2)
Influence of Coolant Inlet Temperature
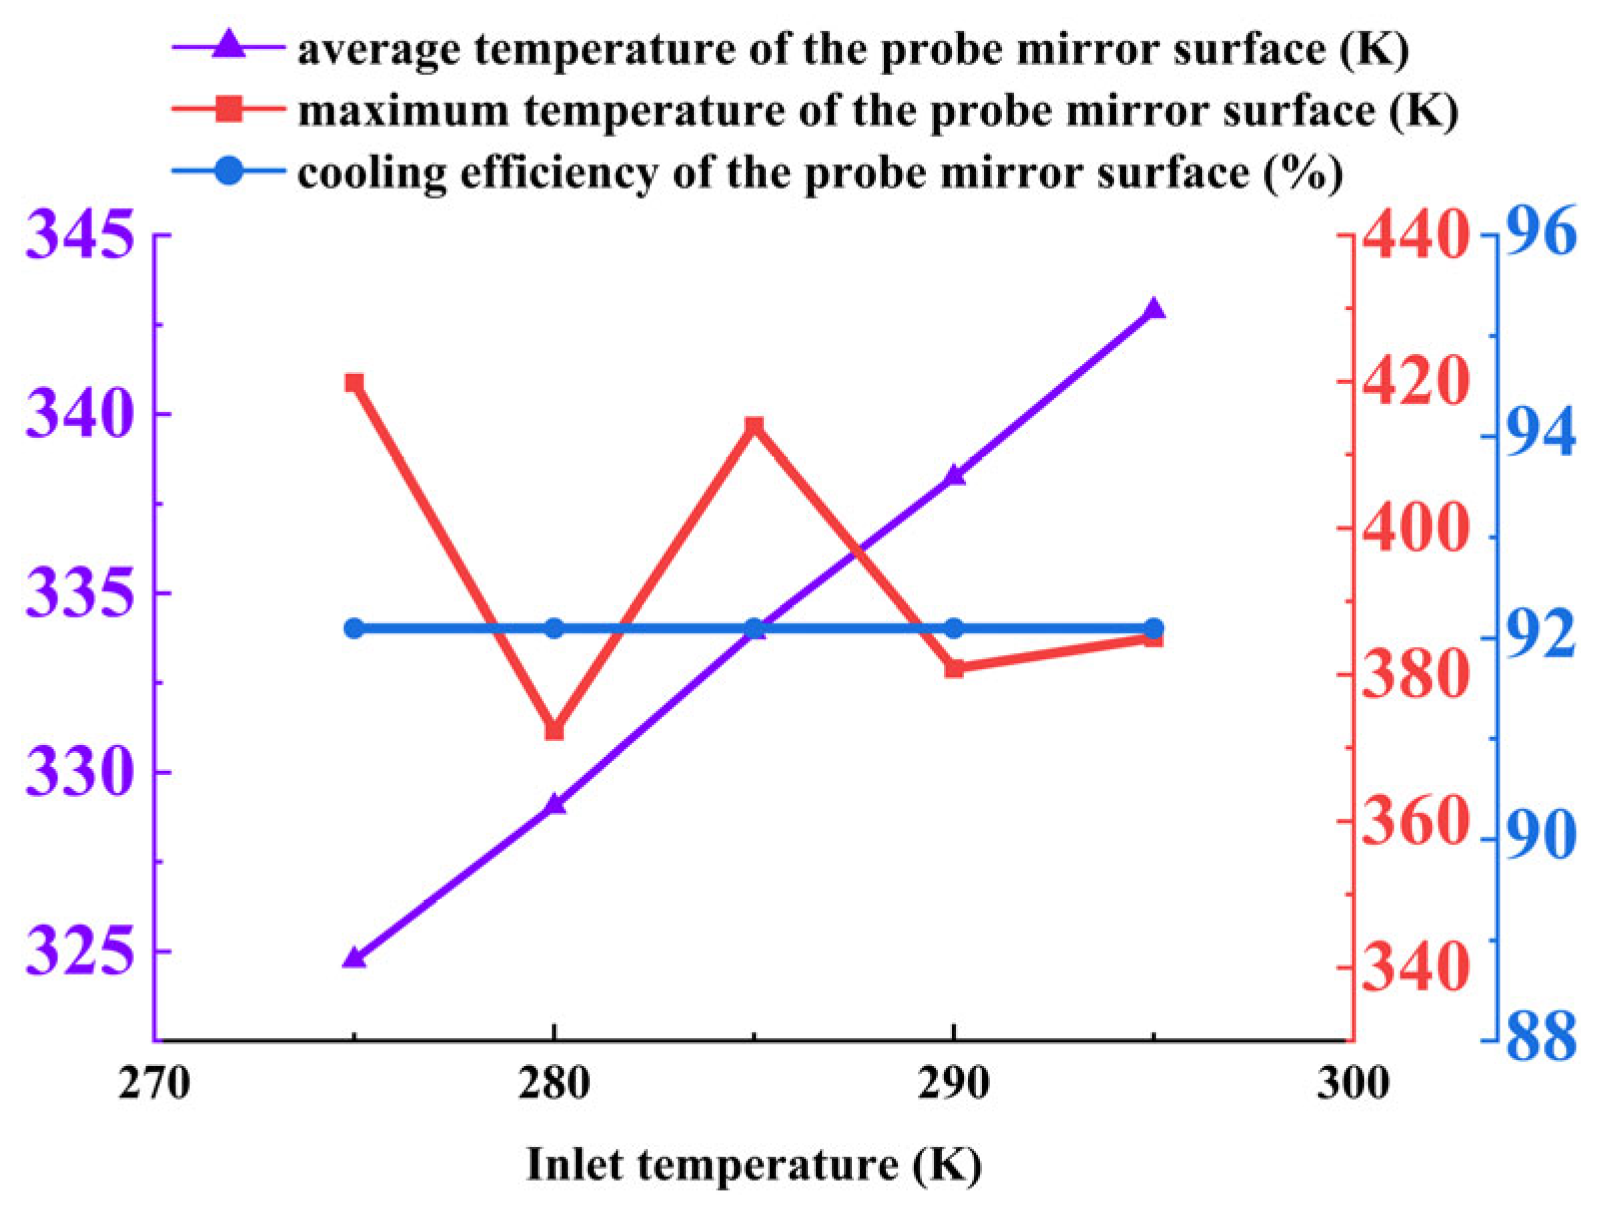
Analysis of Figure 41 and Figure 42 indicates that the average temperature of the hole probe mirror in the circular hole structure changes linearly with the change in the coolant inlet temperature and the cooling efficiency is unchanged, which is consistent with the results of the circular ring and the ring–slit structure. In analyzing the distribution of the temperature field under the conditions of different temperature coolant inlet conditions in the circular hole structure, with a small increase in the coolant inlet temperature, the temperature increase in the temperature field also changes linearly and the trend of change is consistent; at this time, the distribution of the temperature field cloud diagram is basically the same.
(3)
Influence of Coolant Nitrogen Mixing
The influence of the nitrogen concentration in the coolant on the thermal performance of the hole-type cooling structure was investigated. Four nitrogen mixing ratios—0%, 50%, 80%, and 100%—were examined. The key findings are summarized below:
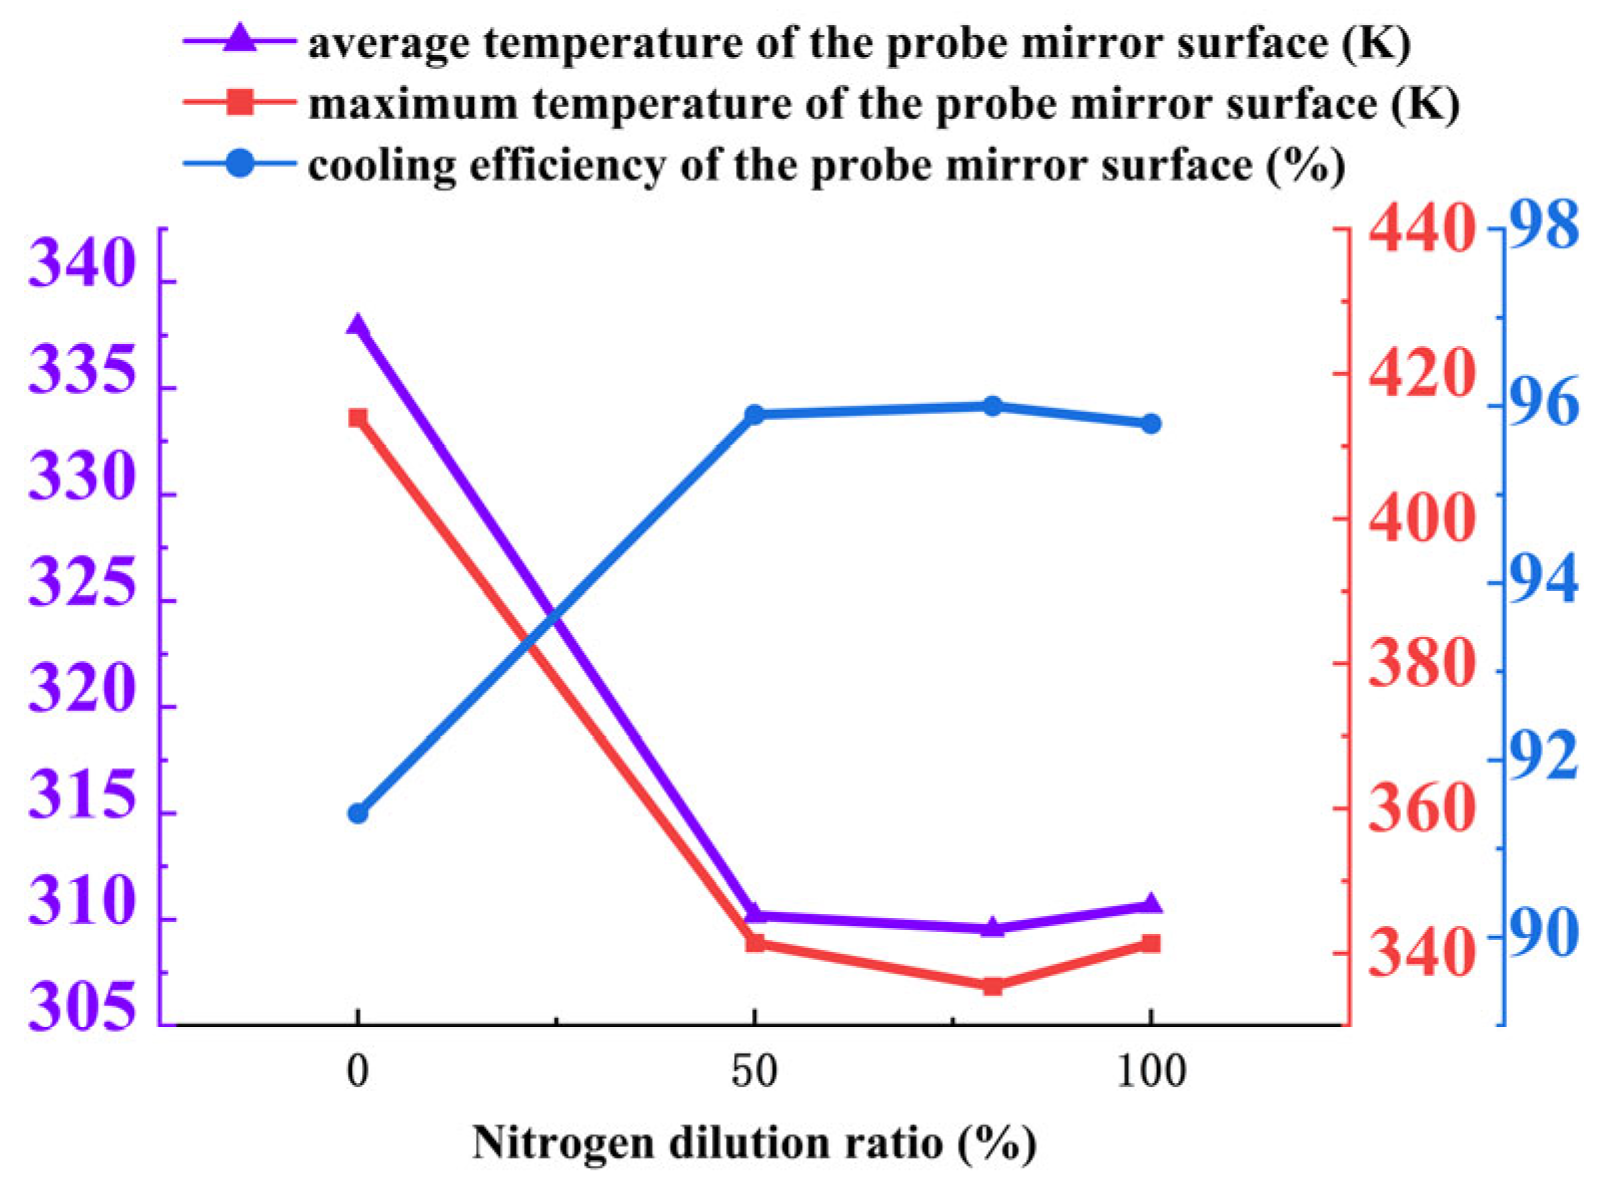
Mirror temperature and cooling efficiency: As demonstrated in Figure 43, nitrogen doping significantly enhances cooling performance, though the improvement is non-monotonic. Both the average and maximum mirror temperatures decrease initially and then increase slightly beyond an optimum point. The best performance is achieved at a nitrogen mixing ratio of 80%, where the average temperature is reduced from 337.93 K (0% nitrogen) to 309.55 K and the maximum temperature drops from 413.92 K to 335.43 K. Correspondingly, the cooling efficiency increases from 91.40% to 96.10%. This enhancement is attributed to the improved thermophysical properties of the nitrogen-enriched coolant, which promote more efficient heat absorption and dissipation within the cooling film.
Temperature field distribution: Analysis of Figure 44 indicates that the cooling coverage area on the probe mirror expands as the nitrogen ratio increases up to 80%. The low-temperature region is most extensive at this ratio, confirming the optimal cooling effect. Beyond 80%, no significant further improvement is observed in the temperature field distribution, suggesting a saturation of the beneficial thermal effects. The overall morphology of the temperature field remains consistent, with nitrogen doping primarily influencing the absolute temperature levels rather than the flow structure.
Summary of optimal conditions: The cooling performance of the hole-type structure is markedly improved by nitrogen doping, with an 80% nitrogen mixing ratio identified as optimal. This ratio achieves the lowest mirror temperatures and the highest cooling efficiency, representing the best balance between performance enhancement and practical feasibility. Higher nitrogen concentrations do not yield additional benefits, indicating a performance plateau beyond 80%. These results suggest that nitrogen doping can be effectively employed to enhance cooling in high-temperature environments, with an 80% mixture offering the most efficient and economically viable solution for borescope probe applications.
(4)
Influence of Cooling Hole Diameter
The influence of cooling hole diameter on the thermal performance of the borescope probe was investigated using four diameters: 0.4 mm, 0.6 mm, 0.8 mm, and 1.0 mm. The key findings are summarized as follows:
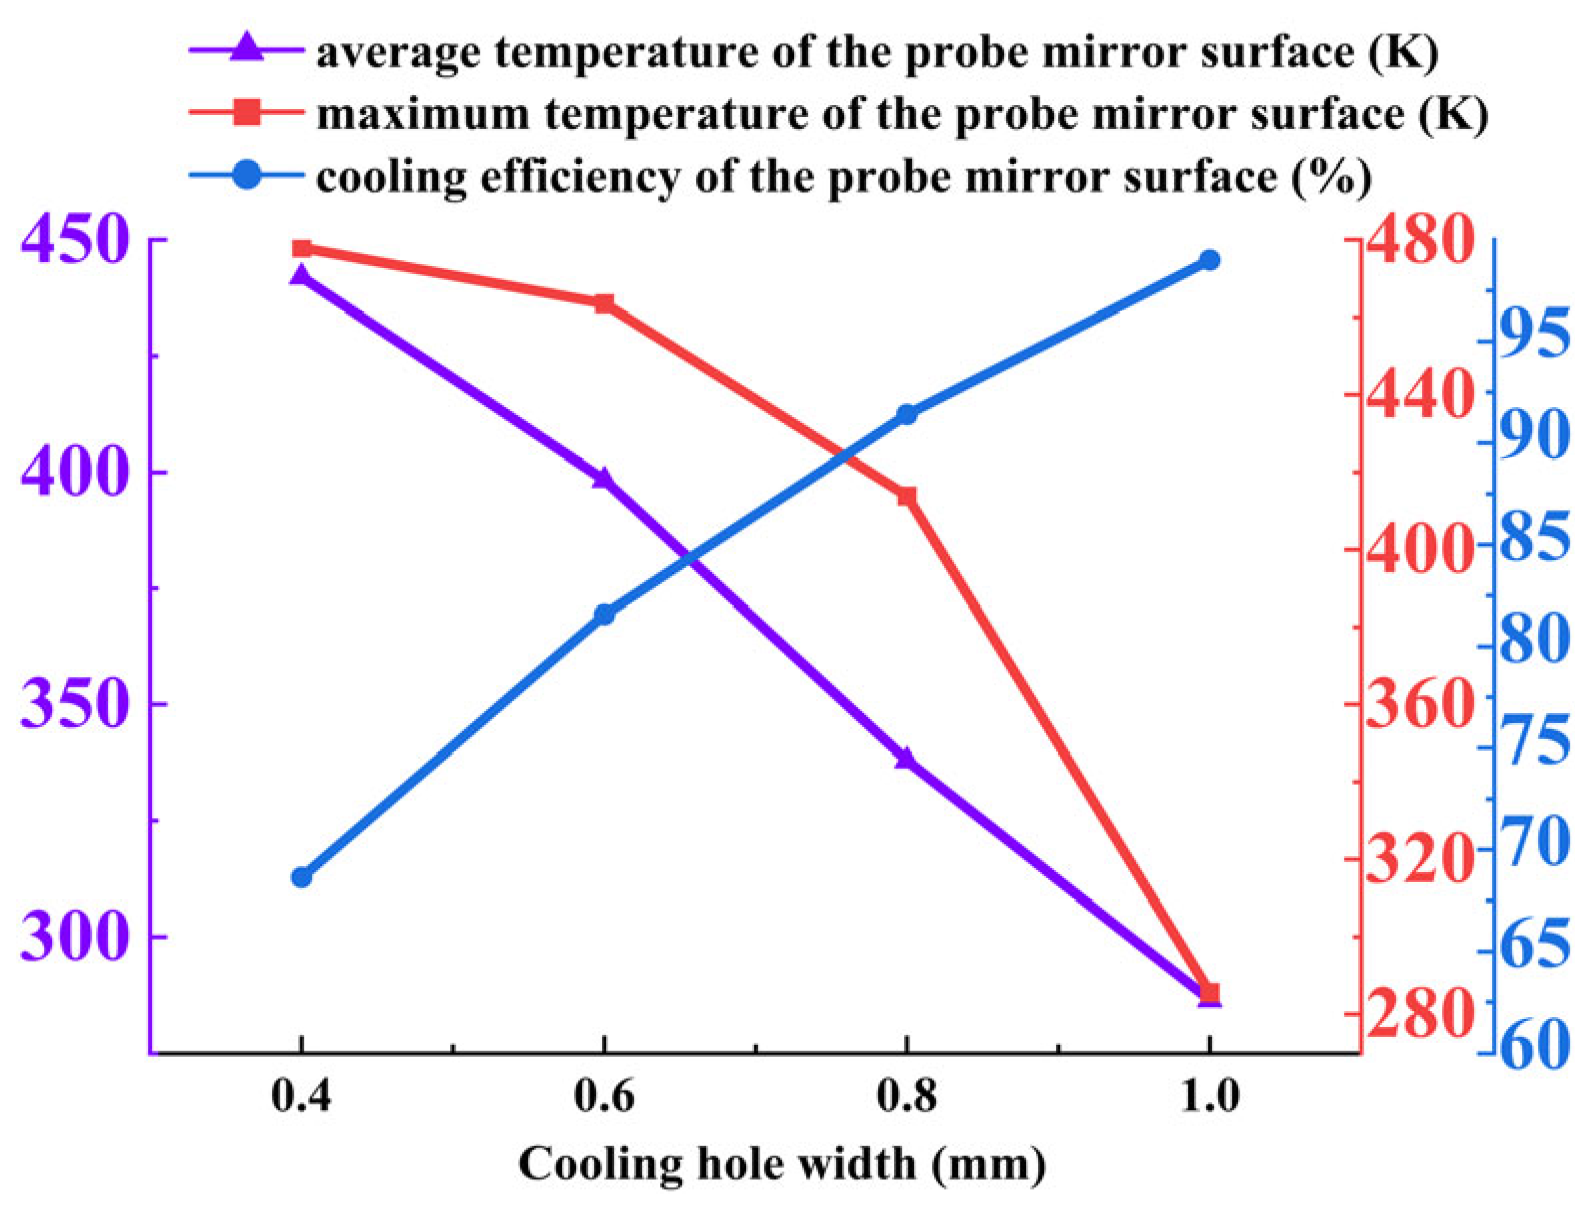
Mirror temperature and cooling efficiency: As shown in Figure 45, both the average and maximum temperatures of the probe mirror decrease significantly with increasing cooling hole diameter, while the cooling efficiency improves progressively. The average temperature declines from 451.98 K at 0.4 mm to 286.20 K at 1.0 mm and the maximum temperature drops from 477.92 K to 289.64 K. At 1.0 mm, the mirror temperature approaches the coolant inlet temperature, indicating the formation of a complete and effective cooling protective film. This enhancement is attributed to the increased coolant mass flow and improved coverage capability at larger diameters.
Temperature field distribution: Analysis of Figure 46 and Figure 47 reveals that the cooling area on the mirror surface expands considerably with larger diameters, resulting in more uniform and efficient thermal protection. The temperature distribution curves ahead of the probe vary significantly with diameter. At 0.4 mm, the temperature rises rapidly near the 0.125 m cross-section, whereas at 1.0 mm, the temperature remains stable up to 0.130 m without a significant increase. This demonstrates that larger diameters facilitate the formation of a robust cooling film that effectively suppresses heat penetration from the high-temperature environment.
Summary of optimal conditions: The cooling hole diameter profoundly affects the performance of the hole-type cooling structure. A diameter of 1.0 mm is identified as optimal, achieving the lowest mirror temperatures (average: 286.20 K; maximum: 289.64 K) and the highest cooling efficiency. At this diameter, the coolant forms a complete protective film that provides near-ideal cooling performance. Smaller diameters (e.g., 0.4 mm) result in insufficient coolant flow and inadequate film formation, leading to poor cooling effectiveness. These results highlight the critical role of diameter selection in maximizing thermal protection. For practical applications in high-temperature environments, a cooling hole diameter of 1.0 mm is recommended to ensure reliable and efficient probe operation.

4.3.4. Underlying Physical Principles of Coolant Property Effects

The marked improvement in cooling performance observed with nitrogen-based coolants, as compared to conventional air, arises from fundamental differences in the thermophysical properties that govern heat transfer and fluid dynamic behavior. The underlying mechanisms can be systematically summarized as follows:
(1)
Enhanced heat capacity:
The volumetric heat capacity of a coolant directly determines its capacity to absorb thermal energy per unit volume. Nitrogen possesses a higher specific heat capacity (Cp ≈ 1040 J/kg·K) than air (Cp ≈ 1005 J/kg·K). Under identical mass flow conditions, nitrogen absorbs a greater amount of heat from the probe’s mirror surface for the same temperature rise, resulting in a more pronounced temperature reduction.
(2)
Improved thermal transport:
The thermal conductivity (k) of the coolant dictates the efficiency of heat transfer between the solid wall and the coolant gas. Nitrogen possesses a higher thermal conductivity (k ≈ 0.026 W/m·K at 300 K) than air (k ≈ 0.024 W/m·K at 300 K). This property facilitates a more effective conduction of heat from the hot surface into the coolant jet and the ensuing protective film, thereby improving the convective heat transfer coefficient and accelerating the cooling process.
(3)
Improved cooling film stability:
Owing to its higher molecular weight and density, nitrogen exhibits greater momentum when injected into the crossflow. This reduces jet deflection and improves adhesion to the surface, forming a more continuous and stable cooling film. The cohesive film mitigates the entrainment of high-temperature mainstream gases, thereby maintaining lower adiabatic wall temperatures and significantly reducing surface heating.
(4)
Synthesis of mechanisms:
The synergistic integration of these properties—increased heat absorption, improved heat conduction, and enhanced film stability—collectively contributes to an additional reduction of 20–30 K in the average mirror temperature. These findings underscore the potential of nitrogen-enriched coolants in advancing thermal protection strategies for borescope probes operating in high-temperature environments.
4.4. Operating Conditions for Each Cooling Structure

Based on the above simulation results, the optimal operating conditions for each configuration are summarized in Table 3.

4.5. Analysis of Pressure-Drop Structure Influence

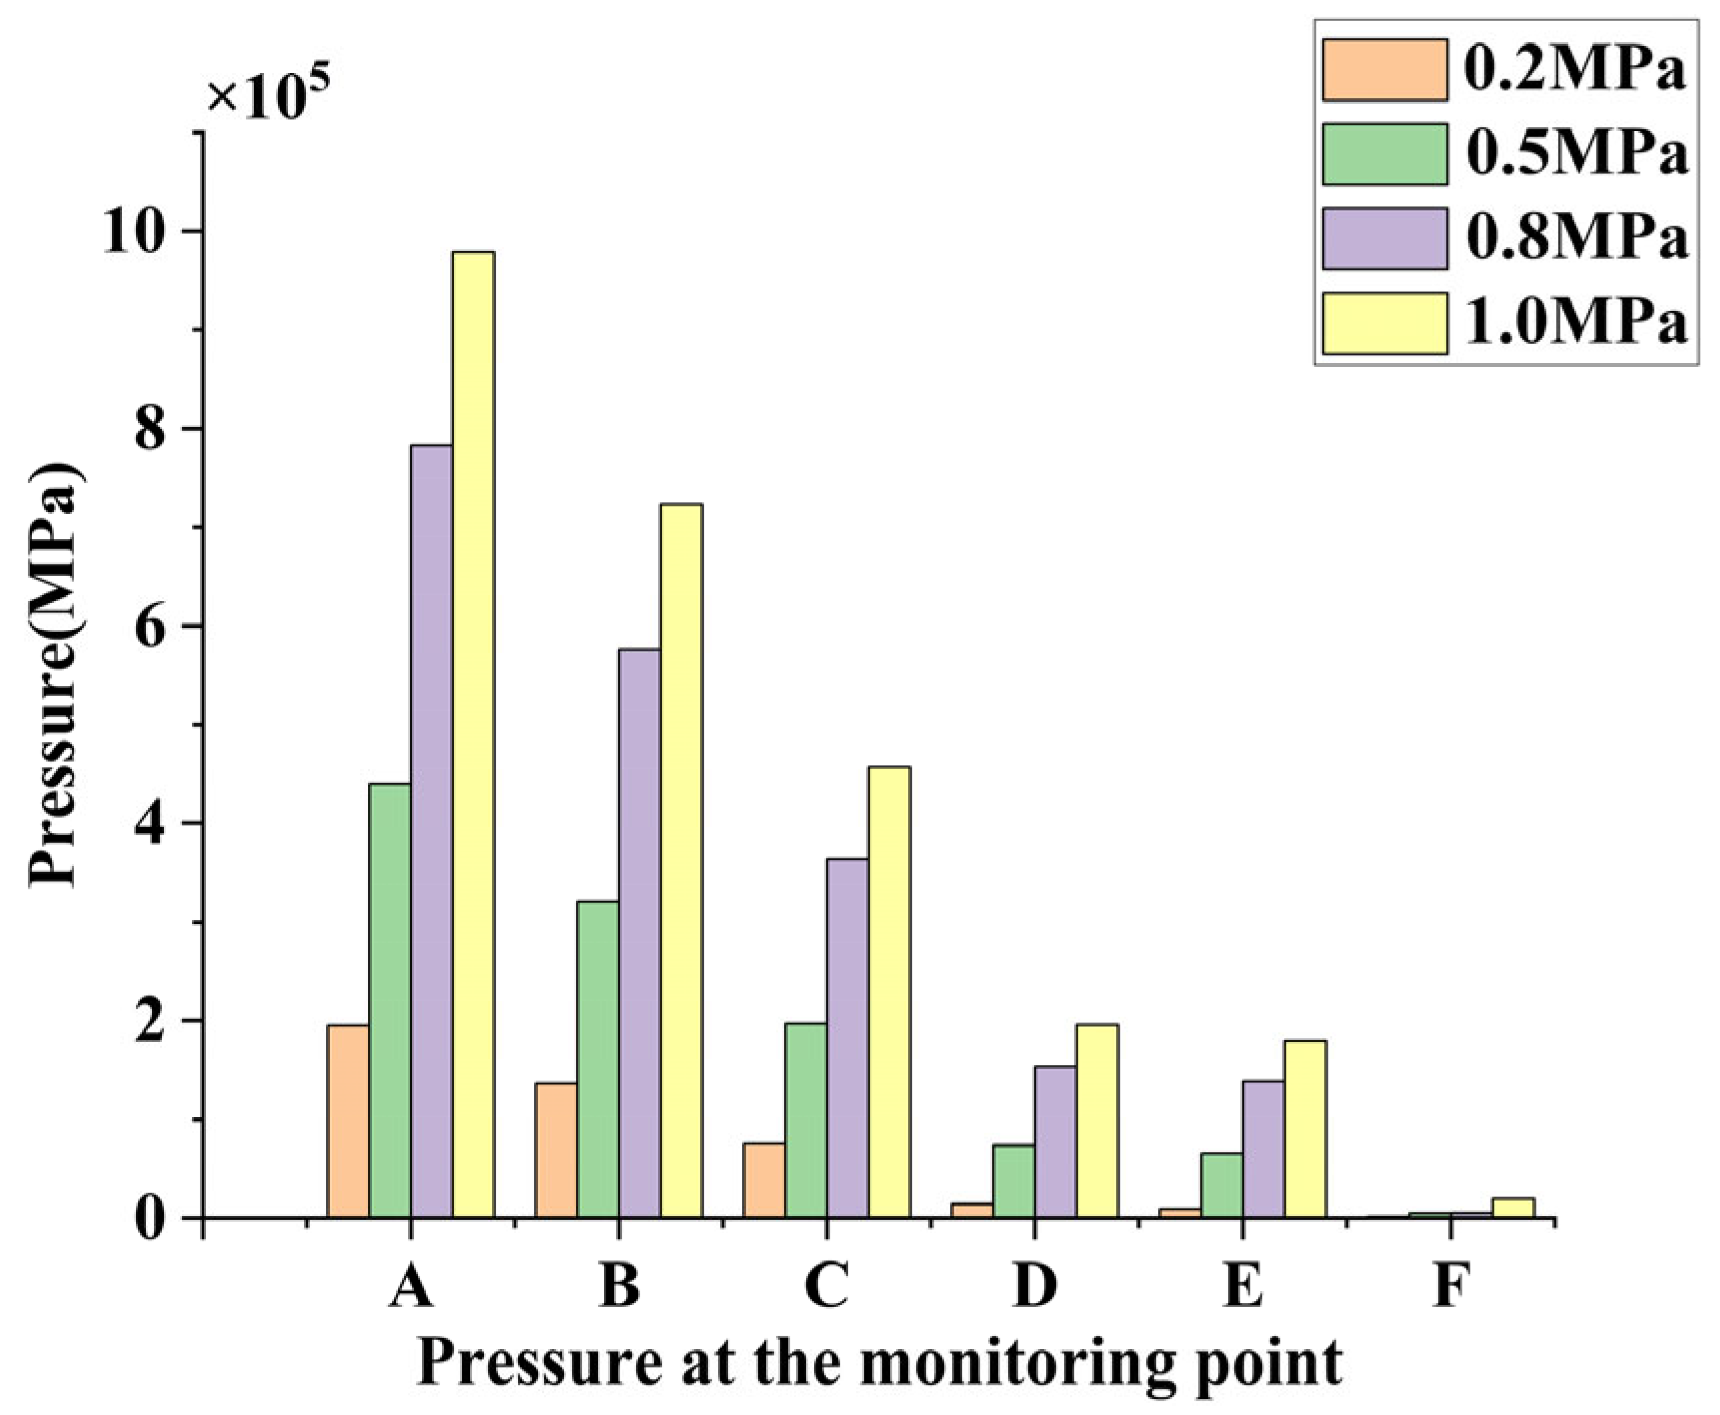
To better analyze the pressure reduction effect of the pressure-drop structure on the coolant gas, six pressure monitoring points were set along the probe (referencing Figure 6). The ring cooling structure is used as an example. Analysis is performed under coolant inlet pressures of 0.2 MPa, 0.5 MPa, 0.8 MPa, and 1.0 MPa.
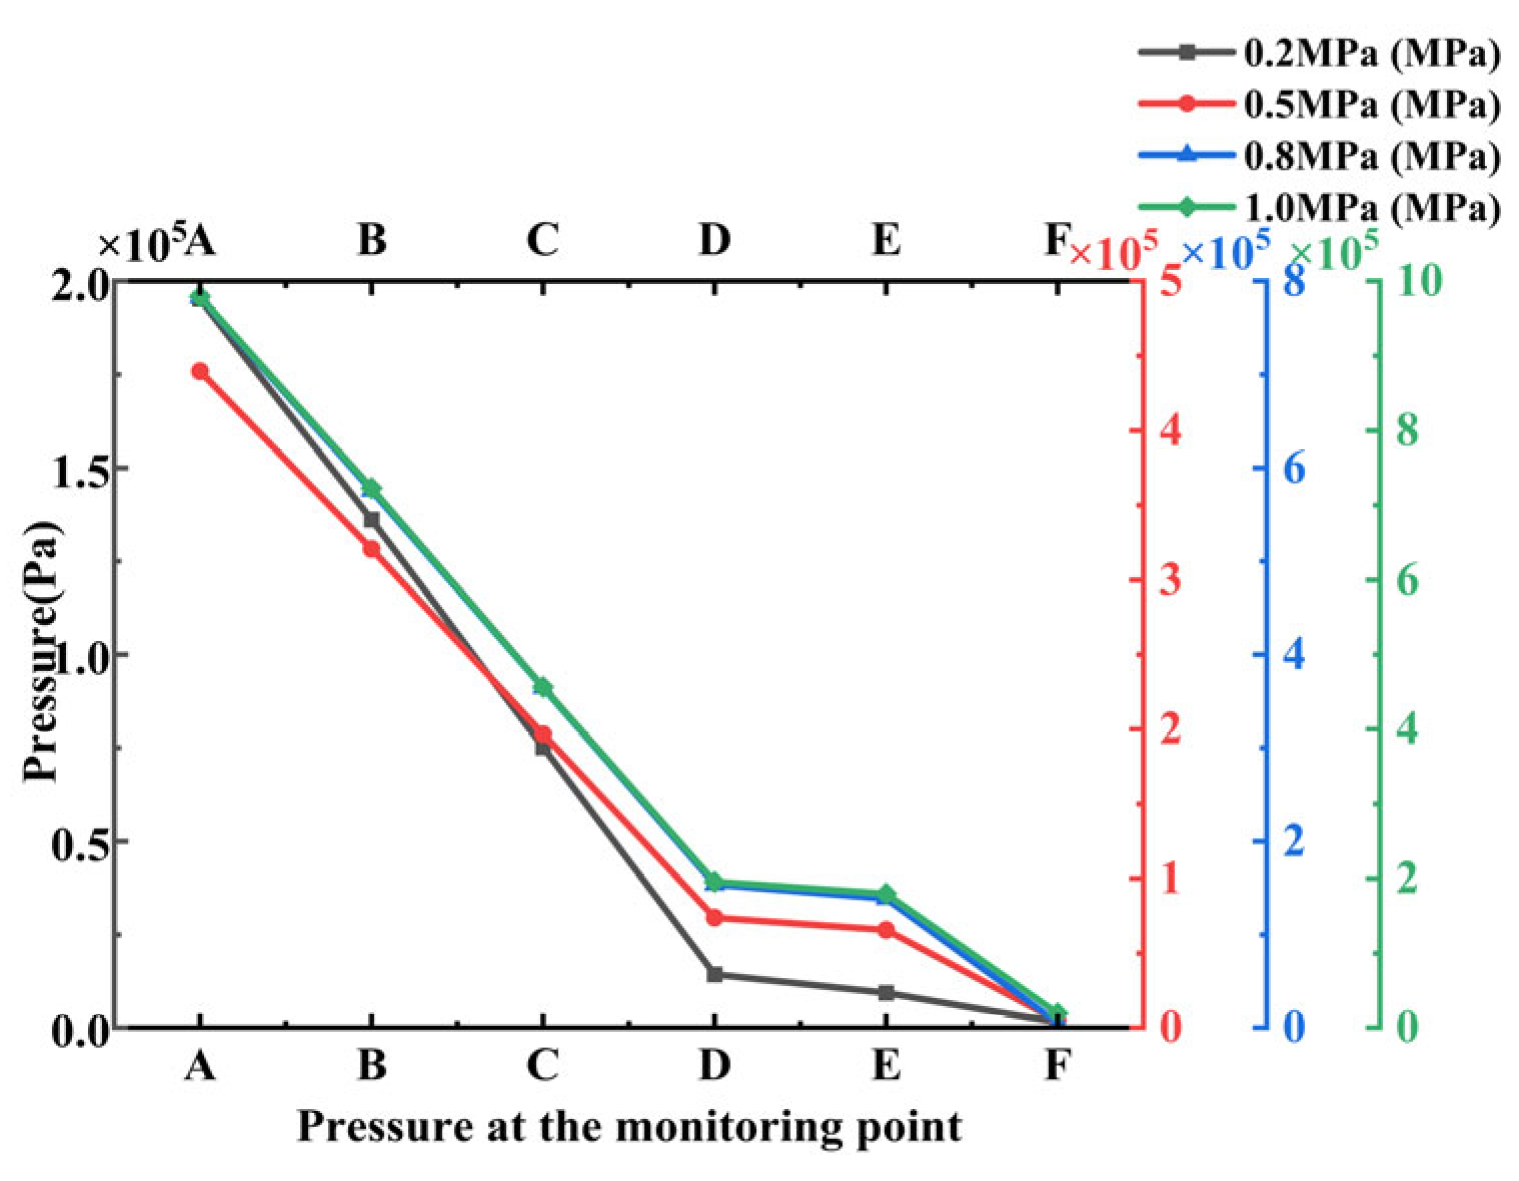
Analysis of Table 4 and Figure 48 and Figure 49 reveals that each stage of the three-stage pressure reduction structure effectively lowers the coolant flow pressure. Specifically, at a coolant pressure of 0.2 MPa, the pressure drops across the three stages are 58,978.52 Pa, 60,980.16 Pa, and 60,795.79 Pa, respectively. At 0.5 MPa, the pressure drops are 119,070.22 Pa, 123,900.19 Pa, and 122,931.54 Pa. At 0.8 MPa, the values are 207,055.08 Pa, 211,241.96 Pa, and 210,622.39 Pa. At 1.0 MPa, the pressure reductions are 256,310.68 Pa, 266,331.68 Pa, and 266,331.39 Pa.
The data indicate that the pressure drop across each stage depends solely on the inlet pressure of the coolant. Moreover, under the same inlet pressure, the pressure reduction remains consistent across all three stages. In practical terms, the pressure drop per stage is approximately 0.06 MPa, 0.12 MPa, 0.21 MPa, and 0.26 MPa at inlet pressures of 0.2 MPa, 0.5 MPa, 0.8 MPa, and 1.0 MPa, respectively.
As shown in Figure 49, the pressure reduction exhibits a linear relationship under all four coolant pressure conditions. Additionally, pressure loss occurs as the coolant flows through the thermal protection jacket of the probe. A significant pressure decrease is observed between monitoring point E (inlet section) and point F (outlet section) of the impingement cooling outlet structure, although this reduction is less pronounced than that achieved by the dedicated pressure-drop modules. This phenomenon results from two main factors: first, the narrowing of the flow passage at the cooling structure outlet increases flow velocity, thereby reducing pressure; second, heat exchange between the coolant and the high-temperature environment near the probe mirror surface also contributes to the pressure change.
In summary, the pressure reduction structure effectively lowers the coolant pressure before it enters the cooling structure, enabling the formation of a highly efficient cooling film over the probe’s mirror region. Furthermore, the design of the cooling structure—specifically, the cross-sectional profile at the inlet and outlet—coupled with thermal effects, results in additional significant pressure loss.

5. Conclusions

This study developed and numerically validated an integrated cooling system for aero-engine borescope probes. The technical contribution lies in the synergistic combination of a multi-stage pressure-drop module with three distinct impingement cooling configurations, accompanied by a systematic comparative analysis that identifies optimal operational parameters for each design. This work provides practical insights for designing high-temperature-resistant borescope probes, enabling rapid post-shutdown engine injury inspection. The principal conclusions are as follows:
(1)
The cooling gas effectively reduces the probe mirror temperature across all three configurations. The cooling efficiency demonstrates a linear relationship with the coolant temperature. The effect of coolant pressure, however, varies non-monotonically with the structure: both the annular and slit configurations achieve optimal film-cooling performance at 0.5 MPa, whereas the hole-type structure performs best at 0.8 MPa. Furthermore, coolant composition significantly influences cooling performance. Replacing air with nitrogen-enriched coolant reduces the average mirror temperature by approximately 20–30 K, attributable to the superior thermophysical properties of nitrogen.
(2)
Among the three configurations studied, the hole-type structure with a 1.0 mm opening exhibits the best overall cooling performance. Under conditions of 285 K coolant temperature and 0.5 MPa pressure, this structure reduces the probe’s mirror temperature to 286.20 K—8.5% lower than that of the slit-type structure (314.69 K) and 4.7% lower than the annular structure (300.25 K)—achieving the most effective thermal protection via stable film formation. The hole-type structure demonstrated a cooling efficiency of 99.8%, representing a 4.6% improvement over the slit-type structure (95.2%) and a 2.3% enhancement compared to the annular structure (97.5%).
(3)
The pressure drop across each stage of the multi-module structure is determined primarily by the inlet pressure and remains consistent across all stages for a given inlet condition. Specifically, the pressure drop per stage measures approximately 0.06 MPa, 0.12 MPa, 0.21 MPa, and 0.26 MPa for inlet pressures of 0.2 MPa, 0.5 MPa, 0.8 MPa, and 1.0 MPa, respectively, in the annular cooling structure.

Author Contributions

Conceptualization, L.J. and R.X.; validation, X.H. and J.P.; formal analyses.; resources, H.Z. and R.X.; data curation, H.Z. and L.J.; Writing—review and editing, H.Z. and L.J.; supervision, X.H. and R.X. All authors have read and agreed to the published version of the manuscript.

Funding

This research received no external funding.

Data Availability Statement

The original contributions presented in the study are included in the article; further inquiries can be directed to the corresponding author.

Conflicts of Interest

The authors declare no conflicts of interest.

Nomenclature

Latin Symbols
SymbolDescriptionUnit
L Outlet width (e.g., of cooling ring/slit/hole)mm
p PressurePa
T TemperatureK
T aw Adiabatic wall temperatureK
T c Coolant inlet temperatureK
T m Mainstream hot gas temperatureK
T max Maximum temperature of the probe’s mirror surfaceK
T ¯ Average temperature of the probe’s mirror surfaceK
Greek Symbols
SymbolDescriptionUnit
η Adiabatic film-cooling efficiency%
Subscripts
awAdiabatic wall
cCoolant
mMainstream
maxMaximum
Abbreviations
%Volume fraction of nitrogen in coolant mixture%
CCDCharge-Coupled Device
CFDComputational Fluid Dynamics
CMOSComplementary Metal–Oxide–Semiconductor
SSTShear Stress Transport

References

  1. Liu, D.X.; Chen, G. Aero-Engine: The Heart of Aircraft, 2nd ed.; Aviation Industry Press: Beijing, China, 2015. [Google Scholar]
  2. Wang, C.H.; Xing, Y.; Li, Z.H.; Tian, S. Analysis on the mechanism and threat modes of aero-engine terminal threats. Aeroengine 2024, 50, 38–42. [Google Scholar]
  3. Xiao, B.R. Application of borescope detection technology in aero-engine maintenance. China High-Tech 2019, 15, 96–98. [Google Scholar]
  4. NASA. Thermal Transient Behavior in Gas Turbine Engines After Shutdown; NASA CR-2020-002471; NASA Glenn Research Center: Cleveland, OH, USA, 2020. [Google Scholar]
  5. Everest Mentor Visual iQ™ HD Industrial Videoscope. Available online: http://www.everestbj.com/index.php/product/view/43 (accessed on 13 July 2025).
  6. Li, X.F.; Zhang, S.L.; Ye, Z.P.; Chen, J.L. Thermal protection performance of infrared temperature measurement probes for turbine blades. J. Eng. Therm. Energy Power 2024, 39, 97–105. [Google Scholar]
  7. Lu, X.; Jia, Y.L.; Ge, B.; Zang, S.S.; Han, J. Comparative Study on Coupled Heat Transfer Characteristics of Different Hole-Type Effusion Cooling Walls under Swirling Impingement. J. Chin. Soc. Power Eng. 2024, 44, 1811–1818. [Google Scholar]
  8. Zhang, L.; Wang, C. Numerical Simulation of the Effect of Hole Shape on Film Cooling Effectiveness of Flat Plate. Therm. Power Gener. 2015, 44, 22–26. [Google Scholar]
  9. Zhang, X.D.; Dong, R.L.; Shi, H.H.; Chen, W.; Shen, W.J.; Zhang, P. Numerical Simulation of Influence of Different Hole Patterns on Air Film Cooling Effect. J. Zhejiang Sci-Tech Univ. 2013, 30, 340–344. [Google Scholar]
  10. Goldstein, R.J.; Eckert, E.R.G.; Chiang, H.D. Effect of hole geometry and density on three-dimensional film cooling. Int. J. Heat Mass Transf. 1974, 17, 595–607. [Google Scholar] [CrossRef]
  11. Lee, K.D.; Kim, K.Y. Shape optimization of a fan-shaped hole to enhance film-cooling effectiveness. Int. J. Heat Mass Transf. 2010, 53, 2996–3005. [Google Scholar] [CrossRef]
  12. Saumweber, C.; Schulz, A. Effect of geometry variations on the cooling performance of fan-shaped cooling holes. J. Turbomach. 2012, 134, 061008. [Google Scholar] [CrossRef]
  13. Dhungel, A.; Lu, Y.; Phillips, W.; Ekkad, S.V.; Heidmann, J. Film Cooling from a Row of Holes Supplemented with Anti Vortex Holes. J. Turbomach. 2007, 131, 021007. [Google Scholar] [CrossRef]
  14. Chen, D.J.; Ye, N.; Xu, Y.C.; Dai, Z. Analysis of Air Film Cooling Performance Based on Different Cooling Velocities. Heilongjiang Sci. 2025, 16, 72–75. [Google Scholar]
  15. McGovern, K.T.; Leylek, J.H. A detailed analysis of film cooling physics—Part II: Compound-angle injection with cylindrical holes. J. Turbomachine 2000, 122, 113–121. [Google Scholar] [CrossRef]
  16. Brittingham, R.A.; Leylek, J.H. A detailed analysis of film cooling physics—Part IV: Compound-angle injection with shaped holes. J. Turbomachine 2000, 122, 133–145. [Google Scholar] [CrossRef]
  17. Haydt, S.; Lynch, S. Cooling effectiveness for a shaped film cooling hole at a range of compound angles. In Proceedings of the ASME Turbo Expo 2018: Turbomachinery Technical Conference and Exposition, Oslo, Norway, 11–15 June 2018. ASME Paper No. GT2018-75726. [Google Scholar]
  18. Zhu, H.R.; Xu, D.C.; Liu, S.L. Effect of Film Cooling Hole Shape on Downstream Cooling Effectiveness. Acta Aeronaut. Astronaut. Sin. 2002, 23, 75–78. [Google Scholar]
  19. Zhang, Y.; Zhu, Z.; Li, Y.; Zhang, Y.; Zhao, Y. High-efficiency gas cooling system for turbine borescope probes in extreme thermal environments. Int. J. Heat Mass Transf. 2024, 221, 125678. [Google Scholar]
  20. Zhang, S.; Zhang, Z.; Wang, Y.; Zheng, H. Design and performance verification of thermal protection structure of high-temperature probe in aero-engine. Appl. Therm. Eng. 2024, 253, 123745. [Google Scholar] [CrossRef]
  21. Shi, Y.N.; Shan, Y.; Tan, X.M.; Guo, S.G.; Zhang, J.; Wang, F.; Jin, R.H. Supercritical pressure fuel cooling characteristics in ramjet nozzles. J. Aerosp. Power 2024, 39, 20220704. [Google Scholar]
  22. Ye, Z.P.; Li, X.F.; Liu, Y.; Tan, Z.Y.; Huai, X.L. Numerical investigation on thermal protection performance of infrared temperature measurement probes. J. Eng. Thermophys. 2024, 45, 205–211. [Google Scholar]
  23. Hsu, P.S.; Chen, T.; Roy, A.; Zhang, A.; Oleksandr, B.; Adhikari, S.; Emerson, B.; Lieuwen, T. A compact LWIR borescope sensor for 2D engine component surface temperature measurement. Meas. Sci. Technol. 2023, 34, 64004. [Google Scholar] [CrossRef]
  24. Zhang, T. Study on the Design of Film Cooling Structure for Exhaust Nozzle. Master’s Thesis, Dalian University of Technology, Dalian, China, 2021. [Google Scholar]
  25. Xie, G.; Liu, C.L.; Niu, J.J.; Ye, L.; Wang, R. Experimental investigation on analogy principle of conjugate heat transfer for effusion/impingement cooling. Int. J. Heat Mass Transf. 2020, 156, 119856. [Google Scholar] [CrossRef]
  26. Liu, A.C.; Wang, Y.M.; Hao, C.S. Reliability of the SST k-ω Model for Impingement Jet Cooling. J. Nanchang Hangkong Univ. (Nat. Sci. Ed.) 2009, 23, 32–36. [Google Scholar]
  27. Zeng, H.; Xi, R.; Li, Y.; Hou, X.; Fu, C. Study of Cooling Characteristics of Axisymmetric Tail Nozzle. Energies 2024, 17, 6064. [Google Scholar] [CrossRef]
  28. Wu, J.N.; Lu, L.P.; Liu, Y.W. Performance Evaluation of Turbulence Models in Complex Flows of Sajben Diffusers. J. Aerosp. Power 2017, 32, 1216–1223. [Google Scholar]
  29. Pedersen, D.R.; Eckert, E.R.G.; Goldstein, R.J. Film cooling with large density differences between the mainstream and the secondary fluid measured by the heat-mass transfer analogy. J. Heat Transf. 1977, 99, 620–627. [Google Scholar] [CrossRef]
  30. Burd, S.W.; Kaszeta, R.W.; Simon, T.W. Effects of Hole Geometry and Density on Three-Dimensional Film Cooling. International J. Heat Mass Transf. 1996, 39, 687–698. [Google Scholar]
Figure 1. Aero-engine borescope probe cooling model.
Aerospace 12 00852 g001
Figure 2. Physical model of borescope probe impingement cooling hole. (a) Ring-type cooling structure; (b) ring–slit cooling structure; (c) Hole-type cooling.
Aerospace 12 00852 g002
Figure 3. Internal flow schematic and structural parameters of pressure-drop module. (a) Internal flow schematic; (b) structural parameters.
Aerospace 12 00852 g003
Figure 4. Calculation domain diagram.
Aerospace 12 00852 g004
Figure 5. Distribution of temperature monitoring points in the borescope probe cooling temperature field.
Aerospace 12 00852 g005
Figure 6. Distribution of gas pressure monitoring points for borescope probe.
Aerospace 12 00852 g006
Figure 7. Validation of Calculation results for different turbulence models.
Aerospace 12 00852 g007
Figure 8. Ring structure grid independence verification.
Aerospace 12 00852 g008
Figure 9. Ring–slit structure grid independence verification.
Aerospace 12 00852 g009
Figure 10. Hole-type structure grid independence verification.
Aerospace 12 00852 g010
Figure 11. Error analysis of mirror surface temperature under different pressure conditions.
Aerospace 12 00852 g011
Figure 12. Probe mirror surface temperature and average cooling efficiency vs. coolant inlet pressure.
Aerospace 12 00852 g012
Figure 13. Flow velocity and temperature distributions on the probe mirror surface of an annular cooling structure at different inlet pressures.
Aerospace 12 00852 g013
Figure 14. Temperature distribution in the temperature field under different inlet pressures.
Aerospace 12 00852 g014
Figure 15. Contour plot of probe’s cooling temperature field distribution under different inlet pressures.
Aerospace 12 00852 g015
Figure 16. Probe mirror surface temperature and average cooling efficiency vs. coolant inlet temperature.
Aerospace 12 00852 g016
Figure 17. Flow velocity and temperature distributions on the probe mirror surface of an annular cooling structure at different inlet temperatures.
Aerospace 12 00852 g017
Figure 18. Temperature distribution in the temperature field under different inlet temperatures.
Aerospace 12 00852 g018
Figure 19. Contour plot of probe cooling temperature field distribution under different inlet temperatures.
Aerospace 12 00852 g019
Figure 20. Probe mirror surface temperature and average cooling efficiency vs. nitrogen mixing ratio in coolant.
Aerospace 12 00852 g020
Figure 21. Flow velocity and temperature distributions on the probe mirror surface of an annular cooling structure at different nitrogen mixing ratios.
Aerospace 12 00852 g021
Figure 22. Temperature distribution in the temperature field under different nitrogen mixing ratios.
Aerospace 12 00852 g022
Figure 23. Contour plot of probe’s cooling temperature field distribution under different nitrogen mixing ratios.
Aerospace 12 00852 g023
Figure 24. Probe mirror surface temperature and average cooling efficiency vs. cooling ring width.
Aerospace 12 00852 g024
Figure 25. Flow velocity and temperature distributions on the probe mirror surface of an annular cooling structure at different cooling ring widths.
Aerospace 12 00852 g025
Figure 26. Temperature distribution in the temperature field under different cooling ring widths.
Aerospace 12 00852 g026
Figure 27. Contour plot of probe’s cooling temperature field distribution under different cooling ring widths.
Aerospace 12 00852 g027
Figure 28. Probe mirror surface temperature and average cooling efficiency vs. coolant inlet pressure for ring–slit structure.
Aerospace 12 00852 g028
Figure 29. Contour plot of probe’s mirror surface temperature distribution under different inlet pressures for ring–slit structure.
Aerospace 12 00852 g029
Figure 30. Contour plot of probe’s cooling temperature field distribution under different coolant inlet pressures for ring–slit structure.
Aerospace 12 00852 g030
Figure 31. Probe mirror surface temperature and average cooling efficiency vs. coolant inlet temperature for ring–slit structure.
Aerospace 12 00852 g031
Figure 32. Contour plot of probe’s mirror surface temperature distribution under different inlet temperatures for ring–slit structure.
Aerospace 12 00852 g032
Figure 33. Probe’s mirror surface temperature and average cooling efficiency vs. nitrogen mixing ratio in coolant for ring–slit structure.
Aerospace 12 00852 g033
Figure 34. Contour plot of probe’s mirror surface temperature distribution under different nitrogen mixing ratios for ring–slit structure.
Aerospace 12 00852 g034
Figure 35. Probe’s mirror surface temperature and average cooling efficiency vs. cooling slit width for ring–slit structure.
Aerospace 12 00852 g035
Figure 36. Contour plot of probe’s mirror surface temperature distribution under different slit widths for ring–slit structure.
Aerospace 12 00852 g036
Figure 37. Contour plot of probe cooling temperature field distribution under different slit widths for ring–slit structure.
Aerospace 12 00852 g037
Figure 38. Probe’s mirror surface temperature and average cooling efficiency vs. coolant inlet pressure for hole-type structure.
Aerospace 12 00852 g038
Figure 39. Contour plot of probe’s mirror surface temperature distribution under different inlet pressures for hole-type structure.
Aerospace 12 00852 g039
Figure 40. Contour plot of probe’s cooling temperature field distribution under different coolant inlet pressures for hole-type structure.
Aerospace 12 00852 g040
Figure 41. Probe’s mirror surface temperature and average cooling efficiency vs. coolant inlet temperature for hole-type structure.
Aerospace 12 00852 g041
Figure 42. Contour plot of probe’s mirror surface temperature distribution under different inlet temperatures for hole-type structure.
Aerospace 12 00852 g042
Figure 43. Probe’s mirror surface temperature and average cooling efficiency vs. nitrogen mixing ratio in coolant for hole-type structure.
Aerospace 12 00852 g043
Figure 44. Contour plot of probe’s mirror surface temperature distribution under different nitrogen mixing ratios for hole-type structure.
Aerospace 12 00852 g044
Figure 45. Probe’s mirror surface temperature and average cooling efficiency vs. cooling hole diameter.
Aerospace 12 00852 g045
Figure 46. Contour plot of probe’s mirror surface temperature distribution under different hole diameters.
Aerospace 12 00852 g046
Figure 47. Contour plot of probe’s cooling temperature field distribution under different hole diameters.
Aerospace 12 00852 g047
Figure 48. Pressure bar chart at monitoring points under different coolant pressures in ring cooling structure.
Aerospace 12 00852 g048
Figure 49. Pressure curve at monitoring points under different coolant pressures in ring cooling structure.
Aerospace 12 00852 g049
Table 1. Boundary conditions.
ParameterValue
Mainstream inlet temperature/K900
Mainstream inlet pressure/Pa101, 325
Mainstream outlet temperature/K900
Mainstream outlet pressure/Pa101, 325
Impingement cooling hole coolant outlet angle/°30
Coolant temperature/K275, 280, 285, 290, 295
Coolant pressure/MPa0.2, 0.5, 0.8, 1.0
Nitrogen mixture ratio/%0, 50, 80, 100
Table 2. Parameter settings and their selection basis for the numerical simulations.
ParameterValue RangeSelection Basis
Mainstream inlet temperature/K900 Refers to NASA report [4]; the upper limit of 800–900 K for the engine inner flow path post-shutdown is adopted to simulate extreme conditions.
Coolant temperature/K275–300 Refers to Pedersen et al. [29]; covers the conventional output temperature range (273–300 K) of industrial cooling systems.
Coolant pressure/MPa0.2–1.0 According to aero-engine ground maintenance standard GJB 5678-2020 [30]; covers the rated pressure range (0.3–1.2 MPa) of portable cooling systems.
Structural size/mm0.4–1.0 Refers to the outer diameter (8 mm) of the Weylin Everest Mentor Visual iQ™ HD probe [5]; the size of cooling structures must be ≤1/8 of the housing inner diameter to avoid interference with probe installation.
Table 3. Summary table of optimal operating conditions.
Cooling ConfigurationOptimal Size (Width/Diameter) (mm)Optimal Coolant Pressure (MPa)Optimal Coolant Temperature (K)Optimal Nitrogen Mixing Ratio (%)Average Mirror Temperature (K)Cooling Efficiency (%)
Ring Structure0.8 mm0.527550300.2597.5
Ring–slit Structure0.6 mm0.527550314.6995.2
Circular Hole Structure1.0 mm0.827580286.2099.8
Table 4. Pressure at monitoring points under different coolant pressures in ring structure.
Coolant PressureA (Pa)B (Pa)C (Pa)D (Pa)E (Pa)F (Pa)
0.2 MPa195,106.12136,127.6075,147.4414,351.659379.531514.52
0.5 MPa439,732.72320,662.50196,762.3173,830.7765,599.954918.23
0.8 MPa782,727.34575,672.26364,430.30153,807.91138,570.145303.24
1.0 MPa979,317.70723,007.02456,675.21195,710.17179,827.0919,444.85
Disclaimer/Publisher’s Note: The statements, opinions and data contained in all publications are solely those of the individual author(s) and contributor(s) and not of MDPI and/or the editor(s). MDPI and/or the editor(s) disclaim responsibility for any injury to people or property resulting from any ideas, methods, instructions or products referred to in the content.