Article

Investigation of the Combustion Products of Ionic Liquid-Based Green Propellants Using Infrared Spectroscopy

by
Jacob Oberndorfer
*,
Philipp Teuffel
,
Sophie C. Stölzle
,
Dominic Freudenmann
and
Christoph U. Kirchberger
Institute of Space Propulsion, German Aerospace Center (DLR), 74239 Hardthausen am Kocher, Germany
*
Author to whom correspondence should be addressed.
Aerospace 2025, 12(6), 507; https://doi.org/10.3390/aerospace12060507
Submission received: 27 March 2025 / Revised: 19 May 2025 / Accepted: 23 May 2025 / Published: 3 June 2025
(This article belongs to the Section Astronautics & Space Science)

Abstract

:
In rocketry today, conventional hypergolic propellant combinations typically use hydrazine-derived fuels and oxidizers based on nitrogen tetroxide. Due to their high toxicity and consequently expensive handling, safer alternatives, so-called “green hypergolics”, are currently being developed. The ionic liquid-based fuels [EMIM][SCN], HIP_11 and HIM_30, paired with highly concentrated hydrogen peroxide as an oxidizer, are three candidates for such green hypergolics, which are currently under research at the German Aerospace Center (DLR). These combinations have been shown to exhibit reliable hypergolic ignition. For a better understanding of the reaction process and to assess the risks in working with these propellants, it is desirable to determine their combustion products. A test setup was designed to extract the gaseous combustion products from hypergolic drop tests. The gas samples were analyzed using Fourier-transform infrared spectroscopy and the gaseous combustion products were determined from the infrared spectra. Additional tests with varied oxidizer concentration or alternative fuels were conducted to further investigate detailed aspects of the findings. It was concluded that [EMIM][SCN], HIP_11 and HIM_30 produce very similar sets of combustion products with hydrogen peroxide, including water vapor, carbon dioxide, carbon monoxide, hydrogen cyanide and sulfur dioxide. Finally, the combustion products were compared to the substances produced when thermally decomposing the fuels. This confirmed that the previously detected substances were caused by a reaction between hydrogen peroxide and the fuels, rather than by their thermal decomposition due to heating.

1. Introduction

Hypergolic propellants have served an important role throughout the history of spaceflight. Their propellant characteristics are defined by their ability to spontaneously ignite upon contact between a fuel and an oxidizer [1]. Additionally, they usually possess good storability and performance [1], as well as short ignition delay times (IDTs) [2,3], which is the time between the first contact of the fuel and oxidizer and ignition [3,4]. Shorter ignition delay times are desirable for a smoother engine ignition process [3,5]. With long ignition delays, larger quantities of propellant can accumulate in the combustion chamber, which then ignite simultaneously, causing a pressure spike which can damage the engine [6]. These advantages make them ideal for applications on satellites and space probes, but also manned spacecraft, for both attitude control and orbital maneuvers. Currently, most hypergolic propellant combinations contain a fuel derived from hydrazine, such as monomethylhydrazine (MMH) or unsymmetrical dimethylhydrazine (UDMH) [7]. Oxidizers are commonly based on dinitrogen tetroxide (NTO), such as mixed oxides of nitrogen (MON) [7]. Hydrazine is toxic and carcinogenic [8], and may potentially be banned in the European Union in the future under the REACH regulation [9,10]. NTO has a high vapor pressure, and can therefore easily form toxic vapor clouds [11]. As such, procedures for working with these kinds of propellants are very strict, including, for example, air-tight full-body protective suits [11]. This increases the cost of working with conventional hypergolics.

1.1. Green Propellants

Newly developed hypergolic propellants aim to reduce the risks associated with the conventional combinations, while preserving their advantages. They are commonly referred to as “green” hypergolic propellants [12]. If the concerns regarding the production, transport and handling of hypergolics can be reduced, worker safety could be improved and costs potentially lowered.
One class of green propellants currently studied at the German Aerospace Center (DLR) are ionic liquids (ILs) [12,13,14,15,16,17,18]. These are ionic substances with a melting point below 100 °C [19]. In practice, for use as a fuel, a freezing point equal to or lower than that of hydrazine, at 0.6 °C, is desired [13]. A large variety of ionic liquids exist, and their properties can be modified by either changing the combination of cation and anion, or by modifying the structure of one of the ions themselves [16]. While ILs are not entirely harmless, their toxicity is significantly reduced compared to hydrazine. Importantly, they are not known to be carcinogenic [20], and have very low vapor pressures, making the formation of dangerous gases improbable [21].
Certain combinations of IL-based fuels and various oxidizers have been found to be hypergolic. Of these oxidizers, highly concentrated hydrogen peroxide, also known as high-test peroxide (HTP), may be seen as a strong candidate for a green propellant from a safety and toxicity standpoint. It has been investigated for use as a rocket propellant since 1934 [1], but was initially held back by prohibitively high manufacturing costs for high concentrations around 98 wt%. Lower concentrations of 80–85 wt% not only decrease performance, but also cause the HTP to decompose more quickly [22]. This decomposition is one drawback of using HTP, as it decomposes exothermically into water and oxygen. The heat produced further accelerates this reaction, potentially leading to a thermal runaway [23]. To prevent this, hydrogen peroxide should be stored at low temperature in suitable containers and be kept free of contamination that could catalyze the decomposition [23]. Additionally, skin contact with HTP can cause chemical burns and bleaching of the affected area. Eye contact or ingestion must be avoided [23]. HTP is, however, not known to cause any long-term health issues and has a low vapor pressure [23], which are advantages over conventional hypergolics.
One currently unknown aspect of these IL-based hypergolic propellants is the combustion products created in the reaction with HTP. Knowledge of these is desirable for multiple reasons. For those working with these propellants during testing and potential future applications, knowing which substances to expect in the testing environment can help in setting appropriate safety measures. From an academic standpoint, insight into the combustion products can aid in determining the reaction process of these propellants and fine-tune the development of future IL-based fuels.

1.2. Related Developments and Studies

The development of IL-based fuels at DLR Lampoldshausen started with an initial computational screening of potential ionic green propellants [14]. The ionic liquid 1-ethyl-3-methyl-imidazolium thiocyanate ([EMIM][SCN]) was first evaluated as a fuel by Lauck et al. [14]. Combined with HTP as an oxidizer, it was investigated in drop tests. This type of experiment is often used to trial hypergolic propellant combinations, where a drop of oxidizer falls into a pool of fuel, leading to ignition if the combination is hypergolic. [EMIM][SCN] and HTP were confirmed to be hypergolic [14], and additionally, it was found that by adding up to 5 wt% copper(I) thiocyanate (CuSCN) to the fuel, the ignition delay could be reduced from 31.7 ms to 13.9 ms [14]. This mixture of [EMIM][SCN] and CuSCN is referred to as HIP_11.
Another additive studied for [EMIM][SCN] by Ricker et al. is imidazole thiocyanate ([HIM][SCN]) [15]. This ionic substance is solid at room temperature, but soluble in [EMIM][SCN] [15]. This mixture possesses a shorter ignition delay than pure [EMIM][SCN]; depending on the fuel composition, ignition delays as low as 16.7 ms have been achieved [15]. These fuels have been named HIM_XX, where XX denotes the mass fraction of [HIM][SCN] dissolved in [EMIM][SCN].
The combustion products of some ionic liquid-based green propellants have been studied in the past. One method employed for this purpose is Fourier-transform infrared (FTIR) spectroscopy, where the transmittance of a beam of infrared light through a sample is measured to identify substances [24]. Chambreau et al. [25] used this type of analysis to study the reaction process and products of dicyanamide- and azide-based IL fuels and the oxidizer white fuming nitric acid [25]. Chambreau et al., however, focused on detecting intermediate and pre-ignition products to study the reaction process [25], rather than the ultimate combustion products. As such, FTIR scans were taken directly in the reaction chamber at high sampling rates [25].
In this study, the gaseous combustion products of [EMIM][SCN], HIP_11 and HIM_30, in combination with 98 wt% hydrogen peroxide, were determined using a drop test setup and FTIR spectroscopy performed after the combustion had occurred fully.

2. Test Setup and Campaign

2.1. Analysis of Combustion Products

The hypergolic drop test experiments were conducted using an automated test setup. It consisted of an aluminum frame box with windows for optical access, both with a thickness of 10 mm. This configuration ensured that any hypergolic reaction would be safely contained within the chamber, which was also placed inside a closed fume hood during the experiments for additional safety. Inside the chamber, a small pool of fuel was prepared on a watch glass. Above, HTP was prepared in a syringe which was mounted on, and protruded through, the roof of the chamber. A step motor was used to drive the syringe and produce drops of HTP accurately and predictably. These then impacted the pool of fuel below. Due to the hypergolicity of the propellant combinations, this led to a spontaneous ignition.
The chamber was already equipped with a thermocouple and piezoelectric pressure transducer to measure the inside temperature and pressure. Additionally, a pyrometer could be used to remotely quantify the temperature of the fuel pool. The ignition delay time was determined using a high-speed camera, recording the inside of the chamber through the frontal window at 5000 frames per second. From these recordings, the exact time of the initial contact between the fuel and oxidizer and the time of the first visible flame were determined.
Valves and pipes were added to the setup in order to purge the chamber with argon gas before each drop test to prevent sample contamination from the environment. Argon was chosen because, as a noble gas, it would not take part in the chemical reaction between the propellants and would not produce any signals on an IR spectrum. Additionally, it was known from previous research that an argon atmosphere would not significantly alter the ignition behavior of the propellants. A gas cylinder was used to transport the sample from the drop test chamber to the gas cell of the IR spectrometer. The setup can be seen in Figure 1.
During testing, the gas cylinder was first purged with argon, connected to the drop test chamber and evacuated using a vacuum pump. Next, the drop test chamber was prepared by placing a pool of 80 µL IL fuel on the watch glass, sealing the chamber and also purging it with argon. Following this, the drop test was conducted. It was found that dropping two drops of HTP before extracting a sample from the chamber produced more intensive IR peaks. After the reaction, a valve attached to the gas cylinder was opened, at which point the pressure differential caused some of the gas in the chamber to flow into the cylinder. The gas cylinder was then sealed, disconnected from the drop test chamber and attached to the IR spectrometer’s gas cell. Finally, the gas cell was purged with argon and evacuated, and the valve to the gas cylinder was opened to move the gas sample into the spectrometer gas cell. After this, the spectrometer scan was conducted.
In total, 30 drop test experiments were conducted, which can be divided into four separate test campaigns:
  • As a benchmark, for each fuel—[EMIM][SCN], HIP_11 and HIM_30—six tests were conducted using 98 wt% HTP. These spectra were of high quality, consistent and rich in information. Therefore, it was decided to reduce the number of drop tests for each condition from six to three for subsequent campaigns, in order to shorten the time needed for the experiments.
  • Three tests each were carried out with the ionic substances trimethylsulfonium thiocyanate ([S111][SCN]) and triethylsulfonium thiocyanate ([S222][SCN]) [17]. The goal of these was to further investigate a proposed sulfur dioxide peak detected in the benchmark spectra by using fuels containing an increased amount of sulfur.
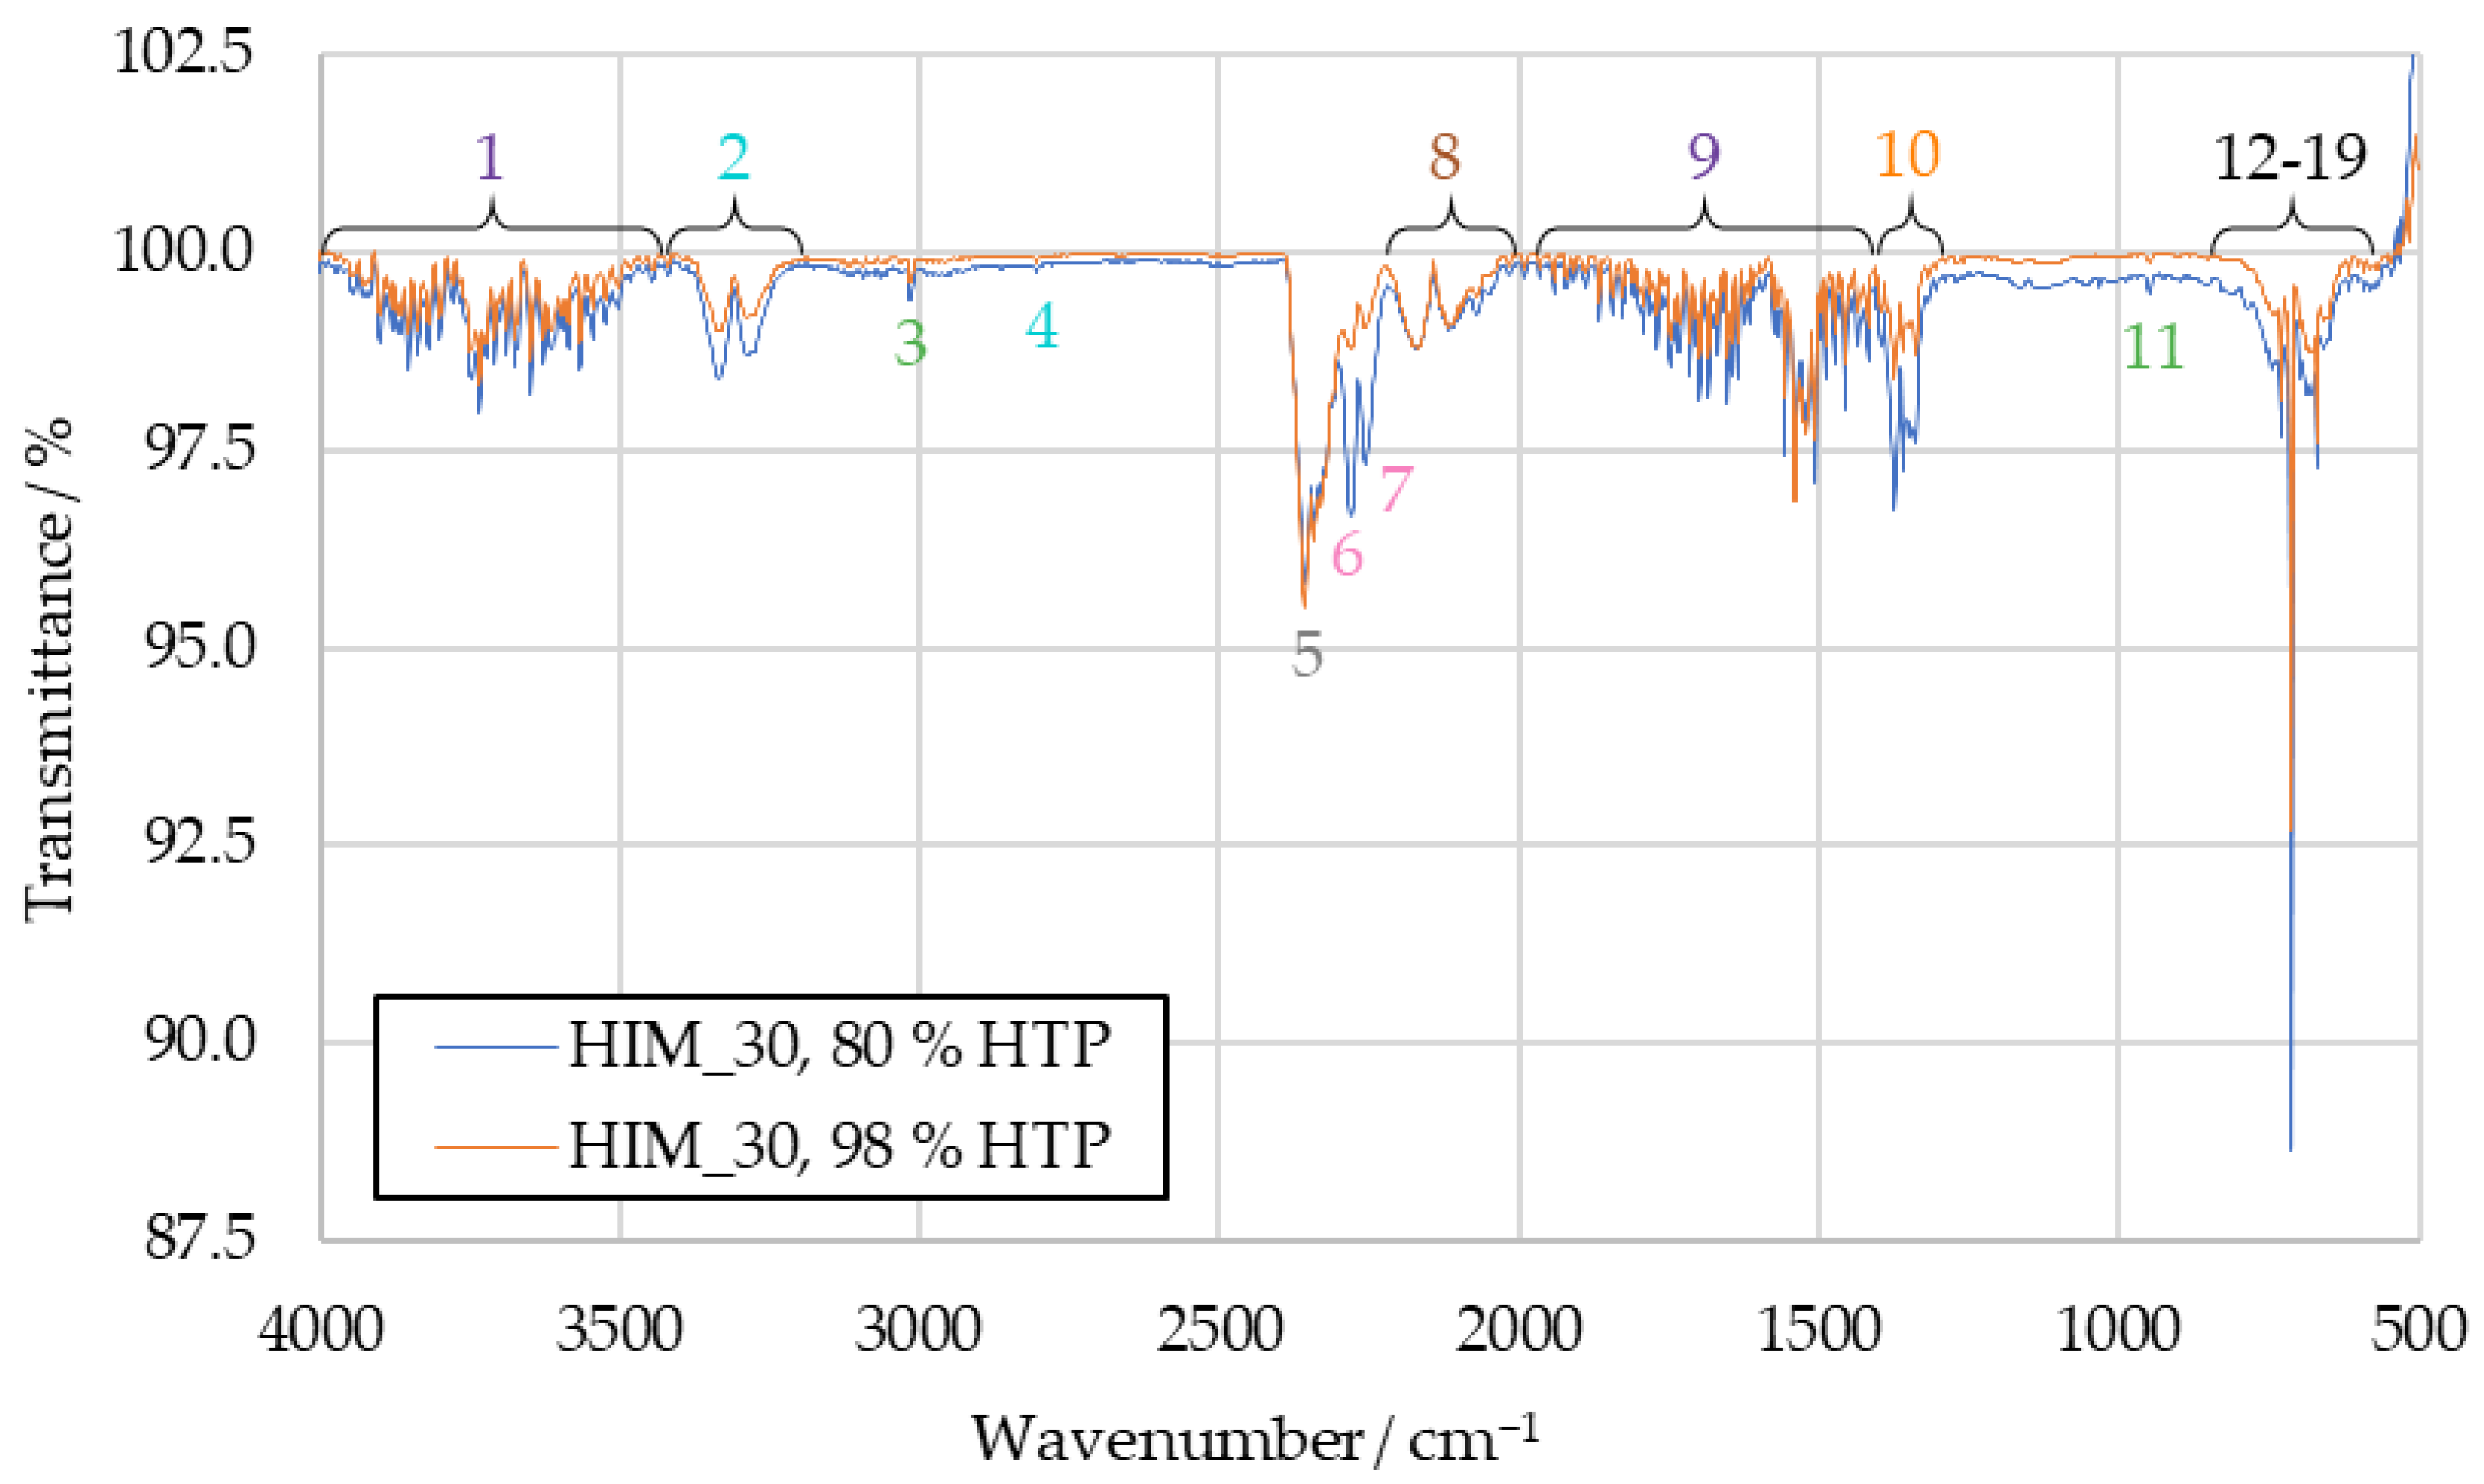
  • HIP_11 and HIM_30 were tested with 80.5 wt% HTP for three drop tests each. This was conducted to investigate the effect of a longer ignition delay time, in order to compare the results to the spectra from the [EMIM][SCN] benchmark. [EMIM][SCN] had a longer ignition delay time than the other fuels under the same conditions, so diluted oxidizer was used to artificially slow the ignition of HIP_11 and HIM_30.
  • The additives used in HIP_11 and HIM_30—CuSCN and [HIM][SCN]—were tested as pure substances for three tests each to investigate whether they would produce separate combustion products from [EMIM][SCN], which might have been obscured in the more complex benchmark spectra.

2.2. Analysis of Decomposition Products

When planning the experiments, it was considered whether the detected substances in the drop test gas samples would primarily be the products of a chemical reaction between the fuel and the oxidizer, or the products of thermal decomposition of the propellants after the impact of the oxidizer drop in the fuel pool. To investigate this, additional tests using a Netzsch STA 449 F3 Jupiter thermogravimetric analyzer (TGA) were conducted. Here, the fuels were heated at a constant rate of 10 K per minute from room temperature up to 873 K (600 °C), causing them to decompose. The resulting gaseous decomposition products were vented into an FTIR spectrometer connected directly to the TGA.
These tests were conducted both in an inert nitrogen atmosphere and in an atmosphere of pure oxygen. Two tests were carried out each for [EMIM][SCN], HIP_11 and HIM_30, resulting in 12 TGA tests in total.
A summary of the drop tests and TGA tests can be seen in the following Table 1:

2.3. Infrared Spectra and Data Processing

The spectrometer used in the analysis of the drop test combustion products was an IRAffinity-1S from the manufacturer Shimadzu, Kyoto, Japan. Combustion product spectra were recorded with a wavenumber resolution of 2 cm−1, in the wavenumber range from 4000 cm−1 to 500 cm−1. For each spectrum, 50 sample scans were taken. With scanning times of about three minutes, this provided a good compromise between high-quality spectra and short measurement times.
An Alpha Transmission FTIR spectrometer, manufactured by Bruker, Billerica, MA, USA, was used to analyze the decomposition products from the TGA tests. Sample scans were continuously taken during the heating process, resulting in three-dimensional spectra. In these, absorption is plotted over both wavenumber and time. The 3D spectra were recorded with a temporal resolution of 21 s and a wavenumber resolution of 2 cm−1. For comparison with the drop test spectra, these 3D spectra were converted from absorption (A) to transmittance (%T), according to Smith [24]:
% T = 100 · 10 A
Subsequently, 2D spectra were extracted at the times when the lowest transmittance had been measured in each 3D spectrum. An example of such a 3D spectrum is shown in Figure 2, while the 2D spectrum extracted from it can be seen in Figure 3. In Figure 3, blue indicates high transmittance, while red highlight signals with the lowest measured transmittance.
To reduce the effects of random contamination of the samples, all spectra recorded with the same propellants and under the same conditions were subsequently averaged. This additionally helped to further reduce the random noise in the spectra. Finally, some of the spectra showed a slightly sloped baseline. To these spectra, baseline correction was applied, according to Smith [24], in order to achieve a straight baseline at 100 % transmittance. This correction only served to improve the readability of the spectra, and did not change the wavenumber position of the peaks.

2.4. Propellant Sourcing

The base chemicals needed for the fuels [EMIM][SCN], HIP_11 and HIM_30 are [EMIM][SCN], [HIM][SCN] and CuSCN. The molecular structures of [EMIM][SCN] and [HIM][SCN] can be seen in Figure 4.
The [EMIM][SCN] and [HIM][SCN] used here were purchased from Ionic Liquid Technologies GmbH, Heilbronn, Germany. CuSCN was sourced from Sigma Aldrich, Taufkirchen, Germany. Pure [EMIM][SCN] was used as a fuel without additives. HIP_11 and HIM_30 were mixed at the DLR chemistry lab according to Table 2.
The fuel samples were stirred using a magnetic stirrer at room temperature for twelve hours. They were prepared in one batch at the start of the testing campaign, and then the same fuel samples were used continuously for all tests.
Highly concentrated hydrogen peroxide was purchased from Jakusz SpaceTech Ltd., Szymbark, Poland. The concentration of the sample used on each day of testing was determined after the last test of the day by measuring its density at a fixed temperature and correlating it to a concentration according to [26]. For all regular days of testing, the HTP concentration was between 97.8 wt% and 98.1 wt%. The lower HTP concentration used deliberately on one testing day was obtained by diluting the HTP with water to a measured concentration of 80.5 wt%.

3. Results

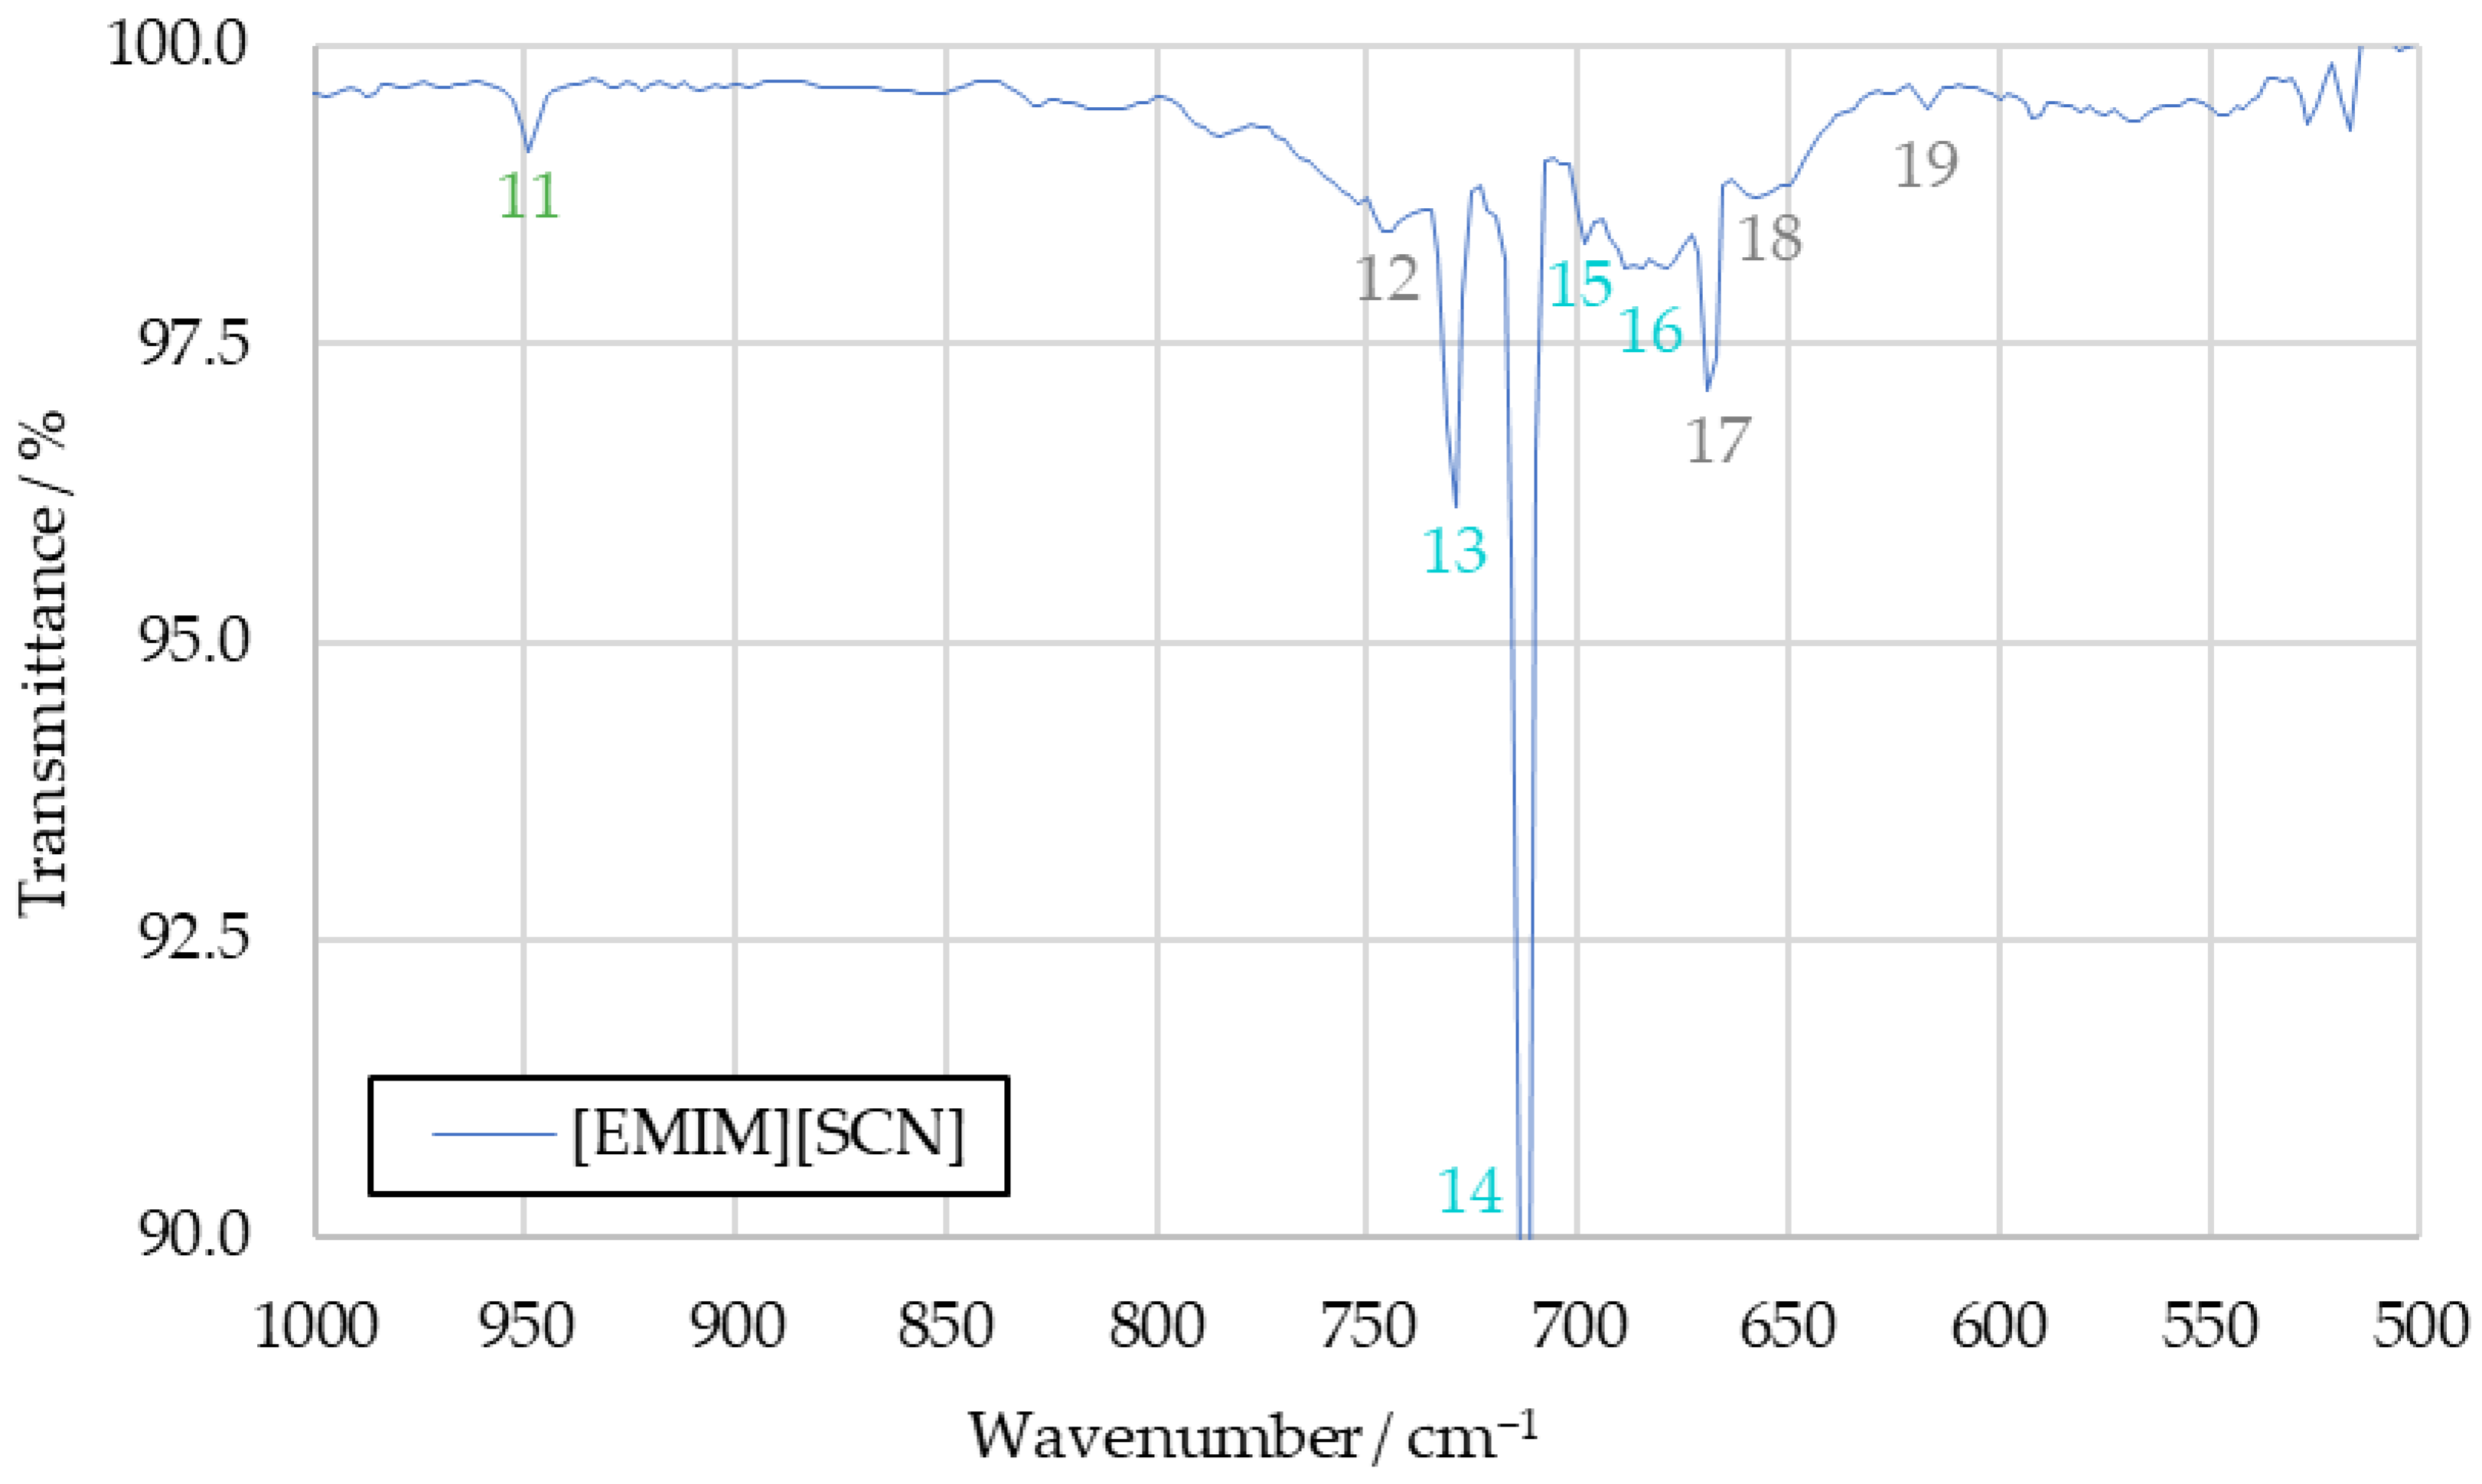
3.1. Benchmark Spectra of [EMIM][SCN], HIP_11 and HIM_30

The spectra obtained from the initial benchmark campaign using [EMIM][SCN], HIP_11 and HIM_30 with 98 wt% hydrogen peroxide showed many similarities. All IR bands observed in one of the spectra could also be observed in any other of this series, albeit potentially with different intensity. Figure 5 shows the complete [EMIM][SCN] spectrum, with all the analyzed peaks or peak pairs labeled for referencing. The cluster of peaks between 600 cm−1 and 800 cm−1 is additionally shown in greater detail in Figure 6. Reference numbers have been color-coded to indicated signals proposed to originate from the same substance.
Substances are identified from the IR spectra by the wavenumber positions of their characteristic peaks. As these positions do not significantly differ between the tests with different fuels, the averaged [EMIM][SCN] spectrum from Figure 5 will be used for identification going forward. The differences in intensity that can be observed with some of the peaks when comparing spectra gained from different fuels will be discussed afterwards. By comparing the sample spectra to reference spectra of potential combustion products, almost all IR bands detected in the sample spectra could be assigned to a combustion product.

3.1.1. Water Vapor (Peaks 1 and 9)

Water vapor is detected in an IR spectrum through two broad clusters of peaks, ranging from 4000 cm−1 to 3400 cm−1 and 2100 cm−1 to 1200 cm−1, respectively [27]. These peaks can make it more difficult to identify other substances in an IR spectra, as they often obscure less intensive signals in relatively broad regions of the spectrum. The water bands themselves, however, can be clearly observed in the sample spectra in the form of peaks 1 and 9. As such, water can be determined as a combustion product with high certainty.

3.1.2. Carbon Dioxide (Peaks 5, 12, 17, 18 and 19)

An IR spectrum of carbon dioxide shows one peak at around 2350 cm−1 and a cluster of peaks at 744 cm−1, 669 cm−1, 650 cm−1 and 620 cm−1, which are suitable for substance identification [27]. Additional bands at wavenumbers above 3500 cm−1 overlap with the signals caused by water vapor, and are not suitable for identification in the context of the sample spectrum. All of these peaks can be identified in the sample spectrum, labeled as peaks 5, 12, 17, 18 and 19. In addition to being an expected combustion product resulting from the combustion of the imidazole-based cation, the analysis of the sample spectrum strongly supports carbon dioxide as part of the combustion products.

3.1.3. Carbon Monoxide (Peak 8)

The characteristic peak pair of carbon monoxide, with peaks at 2116 cm−1 and 2171 cm−1 [27], can be detected in all recorded benchmark spectra as peak 8. Similarly to carbon dioxide, carbon monoxide is expected to be produced in the combustion of the imidazole-based cation when carbon is not fully oxidized. Its presence in the sample is strongly supported by the detected IR bands.

3.1.4. Hydrogen Cyanide (Peaks 2, 4, 13, 14, 15 and 16)

All the peaks from the hydrogen cyanide reference spectrum can be identified in the drop test sample spectra, except those obscured by the water signals. Detected bands include the peak pair at 3333 cm−1 and 3289 cm−1, as well as a peak at 2804 cm−1 and multiple peaks which are part of the same cluster as the carbon dioxide signals, located at 730 cm−1, 710 cm−1, 695 cm−1 and 680 cm−1, respectively [27].
As the reference spectrum for hydrogen cyanide was only available in hardcopy format, rather than digitized, the graphical resolution for determining the wavenumber positions of the peaks was limited to an accuracy of 10 cm−1 for values above 2000 cm−1 and 5 cm−1 below that. Given this, the IR bands detected in the sample compare very well to the reference spectrum. As such, the certainty with which hydrogen cyanide can be confirmed in the samples is high.

3.1.5. Sulfur Dioxide (Peak 10)

To detect sulfur dioxide in the sample spectrum, the peak between 1300 cm−1 and 1400 cm−1 was used [27]. Its highest intensity occurs at 1360 cm−1. As this portion of the spectrum still contains overlap with the water peak, confirming its presence was initially difficult, especially in the spectra of HIP_11 and HIM_30 products.
In the [EMIM][SCN] benchmark spectrum, the sulfur dioxide peak at 1360 cm−1 is visible strongly enough to separate it from the water vapor bands. Other peaks present in the reference spectrum of sulfur dioxide proved unsuitable for this analysis, as their intensity was too low to detect them in the sample spectra.
To further investigate the sulfur dioxide signal, the aforementioned tests with the fuels [S111][SCN] and [S222][SCN] were carried out. Spectra recorded in these tests are shown in Figure A1 and Figure A2 in Appendix A. They show increased intensity at the 1360 cm−1 peak. The similarity between this peak and the benchmark spectra supports the conclusion that this signal is caused by sulfur dioxide in the benchmark spectra as well.
The sulfur dioxide peak is one of the signals which shows different intensity depending on the fuels used in the benchmark drop tests, with it being significantly more intensive in the spectrum of [EMIM][SCN] combustion products. This is further investigated in Section 3.2. Overall, sulfur dioxide was detected with high certainty.

3.1.6. Alkenes (Peaks 3 and 11)

Alkenes were detected in the IR spectrum using peaks 3 and 11. Peak 3 was measured at a wavenumber of 3015 cm−1. This matches the range within which the corresponding peak of ethene, the simplest example of an alkene, should be visible based on the reference [27]. A second peak of ethene is visible at 950 cm−1 in the ethene reference spectrum [27], which matches the wavenumber peak 11 precisely. The other potential peaks that could be caused by an ethene signal were not detectable in the sample spectrum beyond reasonable doubt, due to overlapping signals.
A definite identification of ethene based on this information is not possible. It is, however, likely that ethene or another unburnt hydrocarbon was present in the sample, as similar hydrocarbon molecules would result in similar IR bands being detected.

3.1.7. Thiocyanates, Isocyanates and Nitriles (Peaks 6 and 7)

The final two peaks of the sample spectrum that are not yet correlated to any substance are peaks 6 and 7, which are detected in the sample spectrum at 2280 cm−1 and 2255 cm−1 respectively. Similarly to sulfur dioxide, these peaks were observed with noticeably greater intensity in the spectrum of the [EMIM][SCN] combustion products compared to the spectra of HIP_11 and HIM_30 products. A few candidate substances have been identified that could produce these peaks, but with the limited available information, no definitive correlation could be achieved.
Thiocyanates are considered as a possible match, due to the large quantity of thiocyanate anions present in the fuels. They usually cause IR peaks in the wavenumber range from 2140 cm−1 to 2175 cm−1 [27], which does not overlap with the measured positions of peaks 6 and 7. Depending on the chemical structure of the remaining thiocyanate substance, it is possible that individual peak positions could be shifted to slightly different wavenumbers; however, the lack of additional information makes it difficult to assess this possibility.
Isocyanates could possibly be formed in the strong oxidizing environment created by the presence of HTP. They are described as producing a peak between the wavenumbers of 2250 cm−1 and 2275 cm−1 [27], which could match the position of both peaks when accounting for resolution and a slight shift in the peak wavenumbers, depending on the exact substance present in the sample.
Similarly, nitriles might potentially occur as a combustion product. In an IR spectrum, they show a peak between 2222 cm−1 and 2260 cm−1 [27]. This matches the position of peak 7.
Ultimately, the gathered information is insufficient to confidently attribute concrete substances to peaks 6 and 7. Further investigation using other methods of substance identification is needed to fully understand these IR signals.

3.2. Decreased Hydrogen Peroxide Concentration

A hypothesis for the cause of the different relative intensities of some peaks when comparing sample spectra of [EMIM][SCN] products to those of HIP_11 and HIM_30 products is the difference in ignition delay time. During the benchmark drop test campaign, [EMIM][SCN] had an average IDT of 70 ms, while HIP_11 and HIM_30 ignited with average delays of 20 ms and 27 ms, respectively. To test this hypothesis, the ignition of HIP_11 and HIM_30 was artificially slowed down using 80 wt% HTP. This resulted in an IDT of 74 ms for HIP_11 and 58 ms for HIM_30.
The HIM_30 combustion product spectrum with 80 wt% HTP can be seen in Figure 7, where it is compared to a spectrum obtained with 98 wt% HTP. For both HIM_30 and HIP_11, the increased IDT with 80 wt% HTP decreased the IR transmittance of the samples at the wavenumbers previously suggested for hydrogen cyanide, sulfur dioxide and the not clearly identified peaks 6 and 7. The corresponding HIP_11 spectrum is available in Figure A3.
While calculating the absolute concentrations of combustion products was not the objective of this research, some conclusions can still be drawn. The signals of most substances identified in the IR spectra do not change in intensity between using 80 wt% HTP and 98 wt% HTP. Only some peaks increase in intensity when the ignition is slowed. As such, it can be concluded that when the IDT is increased, the combustion results in higher concentrations of hydrogen cyanide, sulfur dioxide and the substances causing peaks 6 and 7 in the sample, relative to other combustion products.

3.3. Spectra of Pure CuSCN and [HIM][SCN]

The additives CuSCN and [HIM][SCN] used in HIP_11 and HIM_30 were tested in separate drop tests. These were conducted to determine whether they would produce any unique combustion products distinct from [EMIM][SCN], which might have been obscured in the spectra of HIP_11 and HIM_30 due to the additives’ lower concentrations.
Both CuSCN and [HIM][SCN] are powdery solids. [HIM][SCN] ignited upon contact with the first HTP drop, and the resulting combustion dispersed the leftover fuel sample away from the watch glass. This made an additional ignition with a second drop of HTP impossible. CuSCN did not ignite with the first HTP drop, and so a second drop was possible. This resulted in an ignition, likely due to the previous heating of the CuSCN from the reaction with the first drop. Apart from these changes in the procedure, the tests were carried out identically to all previous drop tests.
The resulting spectrum of CuSCN products can be seen in Figure 8. It shows significantly fewer peaks than the previous benchmark spectra, with only the ones attributed to water vapor (1 and 9), carbon dioxide (6, 17, 18 and 19) and hydrogen cyanide (2, 13, 14, 15 and 16) being visible. Additionally, the not unambiguously identified peaks 6 and 7 can be observed.
The water bands in the spectrum can be safely attributed to decomposed hydrogen peroxide, while the hydrogen cyanide is a likely reaction product of thiocyanate anions. As no hydrocarbons were present in the drop test, carbon dioxide must have either also been a product of the thiocyanate anions, or been caused by atmospheric contamination. Peaks 6 and 7 being present in this spectrum suggests that they are caused by substances formed from the reaction between HTP and thiocyanate anions as well.
Not visible is peak 4, attributed to hydrogen cyanide, which is likely too weak to be observed. The same applies to peak 12, associated with carbon dioxide. The other absent signals are those of carbon monoxide (8), sulfur dioxide (10) and alkenes (3 and 11). Since those peaks are of high intensity in the benchmark spectra, it can be assumed that they are not merely obscured here. Rather, it is likely that the substances linked to those signals are not present among the combustion products of CuSCN.
The spectrum recorded with the combustion products of HTP and pure [HIM][SCN] is shown in Figure 9. It shows largely the same peaks as the CuSCN spectrum. Notable additions are a faint carbon monoxide band, as well as a very weak signal at 3030 cm−1, similar to the previously suggested alkene signal. Both of these are likely the result of incomplete combustion of the imidazole cation.
Overall, the tests with either of the pure additives revealed no previously undetected combustion products. Some information can still be obtained from them, however. The absence of peaks 3 and 11 in the CuSCN combustion product spectrum supports the assignment of those signals to unburnt hydrocarbons. They can only be observed in spectra where the fuel used contains hydrocarbon groups, but not in the spectrum of CuSCN products.

3.4. Spectra of Thermal Decomposition Products

The TGA tests were conducted in both a pure oxygen and a pure nitrogen atmosphere with [EMIM][SCN], HIP_11 and HIM_30. However, this difference in atmospheric composition did not seem to significantly influence the decomposition products observed in those tests. An exemplary comparison of the influence of the two types of atmosphere is shown for HIP_11 in Figure A4. While the intensities of individual bands change between the spectra, the presence or absence of certain peaks is consistent.
The only noteworthy exception are the peaks of water vapor and carbon dioxide, which sometimes disappear or flip to more than 100% transmittance in the spectra, which occurs randomly across all fuels and atmospheres. This was likely caused by changes in the environmental water vapor and carbon dioxide concentrations in the ambient air present in the spectrometer. The background spectrum was recorded at the beginning of the heating process, roughly 30 min before the time step at which the 2D spectrum was extracted. If the concentration of gases in the environment changes during this time, this cause a lower or higher transmittance to be measured.
The IR spectrum obtained from a decomposition test with [EMIM][SCN] can be seen in Figure 10. The main finding of the TGA tests is that the decomposition products of [EMIM][SCN], HIP_11 and HIM_30 share little communality with the spectra obtained from the drop tests. They show significant amounts of peaks in the fingerprint region of the spectrum, between 1500 cm−1 and 500 cm−1. This is typical for complex molecules, rather than the simple combustion products discussed before.
In the [EMIM][SCN] decomposition spectrum, seen in Figure 10, the hydrogen cyanide peak pair (peak 2) at 3270 cm−1 and 3340 cm−1 is visible. Additionally, a peak around 3000 cm−1 (labeled “peak A”, as it was not detected in previous tests) can be observed. It is likely the result of the imidazole ring or another hydrocarbon. Additionally, a strong peak is visible at 2050 cm−1 (peak B), which is attributed to the thiocyanate anion.
Overlaid with the decomposition spectrum of [EMIM][SCN] decomposition products in Figure 10 is a liquid phase spectrum of the fuel, recorded on the IRAffinity-1S spectrometer. For better visualization, this has been rescaled to align the intensities of both spectra. As such, any comparison of peak intensity is invalid, but wavenumber positions of signals remain comparable. It can be seen that the general structure of these spectra is similar, although the exact wavenumbers of the peaks vary. This suggests that while the fuel does undergo chemical changes during thermal decomposition, it remains composed of comparatively complex molecules, unlike during the combustion with hydrogen peroxide.
The decomposition spectrum of HIP_11 shows no significant differences to that of [EMIM][SCN]. Some bands, mostly those of hydrogen cyanide (peak 2) and thiocyanate (peak B), are observed with lower transmittance in the HIP_11 spectrum, and the peaks’ positions in the fingerprint region vary slightly, but otherwise, the spectra are largely identical.
In the HIM_30 decomposition spectrum, more differences can be observed when comparing it to the [EMIM][SCN] decomposition spectrum, as shown in Figure 11. These mainly consist of two previously unobserved peaks, one at 3520 cm−1 (peak C) and one at 1991 cm−1 (peak D). No concrete substance could be identified for peak C, but given the elements present in the fuel, a hydrogen–nitrogen stretching vibration is considered the most likely cause of this signal. Peak D is likely a secondary thiocyanate peak, shifted from the main thiocyanate band because the thiocyanate ions are bonded to two different cations, one resulting from the decomposition of 1-ethyl-3-methyl-imidazolium, the other from regular imidazolium.

4. Conclusions and Outlook

In this work, the three ionic liquid-based fuels [EMIM][SCN], HIP_11 and HIM_30 were investigated in regard to their combustion products with highly concentrated hydrogen peroxide. For this purpose, a hypergolic drop test campaign was conducted, from which the gaseous combustion products were extracted and analyzed using FTIR spectroscopy. Additionally, the gaseous decomposition products of the fuels were analyzed for comparison. From these investigations, the following results could be determined:
  • The gaseous combustion products of all three fuels contain water vapor, carbon dioxide, carbon monoxide, hydrogen cyanide, sulfur dioxide and, likely, ethene. They also possibly contain isocyanates, thiocyanates or nitriles.
  • Artificially slowing the ignition of HIP_11 and HIM_30 using a lower concentration of HTP results in more intensive IR peaks of hydrogen cyanide, sulfur dioxide and the uncertain substances for which isocyanates, thiocyanates or nitriles have been proposed.
  • The additives present in HIP_11 and HIM_30—CuSCN and [HIM][SCN]—do not produce any detectable gaseous combustion products that are not also produced by [EMIM][SCN], the base of all three fuels.
  • Apart from hydrogen cyanide, the thermal decomposition of the fuels results in an entirely different set of gaseous products. This confirms that the substances identified from the drop tests are formed from the direct chemical reaction between the fuels and HTP, rather than potential thermal decomposition caused by heating of the fuel pool prior to ignition.
Future research based on these results may use different methods of analysis, such as mass spectroscopy, to confirm the combustion products detected here. Additionally, non-gaseous combustion products can be investigated to gain a more complete understanding of the reaction between ionic liquid-based fuels and HTP. Trying to capture intermediate species of the reaction by slowing the ignition with lower-concentration hydrogen peroxide could also aid in this. Finally, as the reaction conditions in a combustion chamber differ significantly from those in a drop test environment, engine gas sampling and testing can be conducted to compare the combustion products identified here with those produced in a rocket engine.

Author Contributions

Conceptualization, J.O., P.T. and S.C.S.; methodology, J.O.; validation, J.O., P.T. and S.C.S.; formal analysis, J.O.; investigation, J.O.; resources, S.C.S. and D.F.; data curation, J.O.; writing—original draft preparation, J.O.; writing—review and editing, P.T., S.C.S. and J.O.; visualization, J.O.; supervision, P.T. and S.C.S.; project administration, P.T. and S.C.S.; funding acquisition, D.F. and C.U.K. All authors have read and agreed to the published version of the manuscript.

Funding

The research was funded as part of the DLR-internal project NeoFuels.

Data Availability Statement

The original contributions presented in the study are included in the article, further inquiries can be directed to the corresponding author.

Acknowledgments

The authors would like to express their thanks for the support of the lab team of the department of Chemical Propellant Technology. The support and cooperation of the department of Satellite and Orbital Propulsion is highly appreciated.

Conflicts of Interest

The authors declare no conflicts of interest. The funders had no role in the design of the study; in the collection, analyses, or interpretation of data; in the writing of the manuscript; or in the decision to publish the results.

Abbreviations

The following abbreviations appear in this manuscript:
CuSCNCopper(I) thiocyanate
DLRDeutsches Zentrum für Luft- und Raumfahrt e.V.
German Aerospace Center e.V.
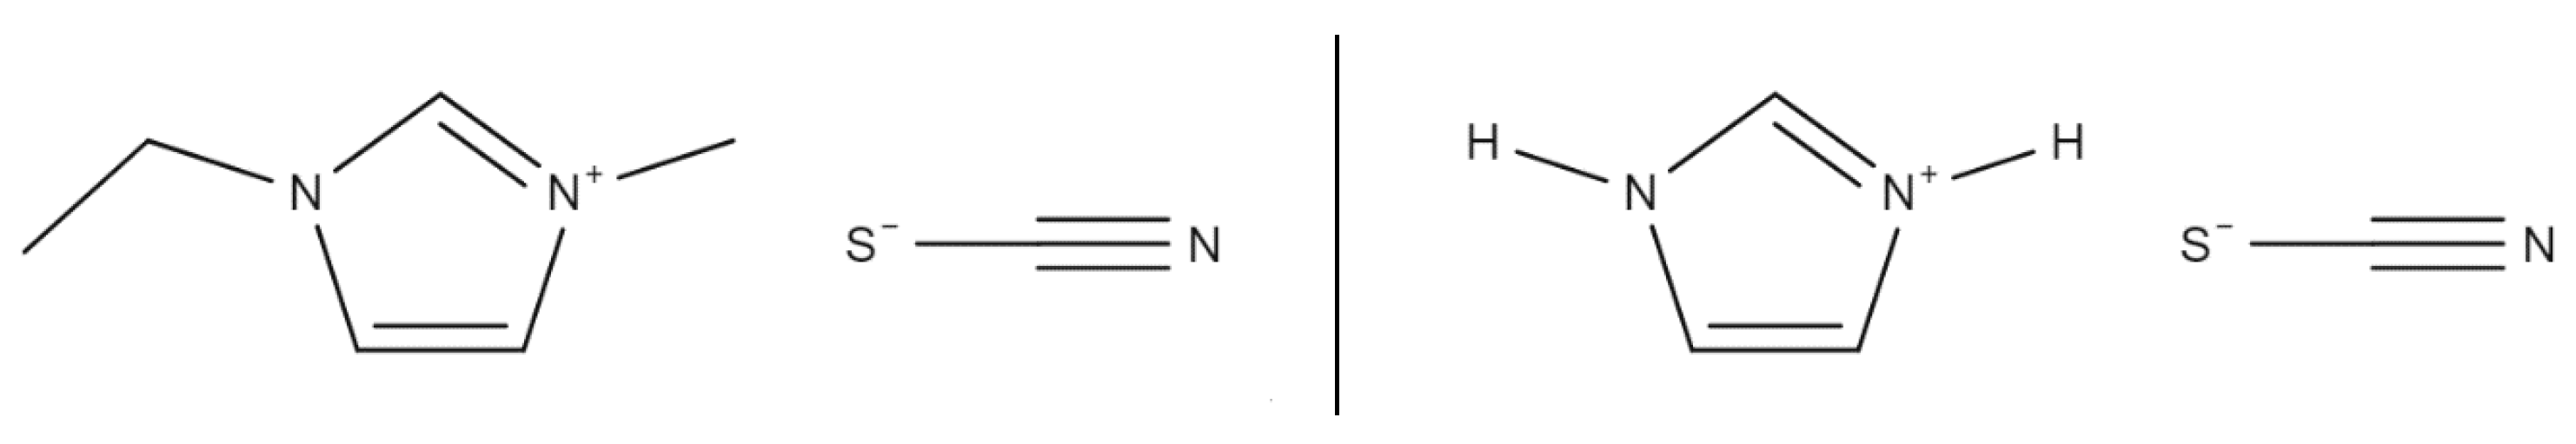
[EMIM][SCN]1-Ethyl-3-methyl-imidazolium thiocyanate
FTIRFourier-transform infrared (spectroscopy)
[HIM][SCN]Imidazolium thiocyanate
HTPHigh-test peroxide
IDTIgnition delay time
ILIonic liquid
IRInfrared
MMHMonomethylhydrazine
MONMixed oxides of nitrogen
NTONitrogen tetroxide
[S111][SCN]Trimethylsulfonium thiocyanate
[S222][SCN]Triethylsulfonium thiocyanate
TGAThermogravimetric analyzer
UDMHUnsymmetrical dimethylhydrazine

Appendix A

This appendix shows additional spectra which were recorded as part of the testing campaign and discussed in Section 3.
Figure A1. IR spectrum of [S111][SCN] combustion products.
Aerospace 12 00507 g0a1
Figure A2. IR spectrum of [S222][SCN] combustion products.
Aerospace 12 00507 g0a2
Figure A3. Comparison of HIP_11 product IR spectra with 80 wt% HTP and 98 wt% HTP.
Aerospace 12 00507 g0a3
Figure A4. Comparison of decomposition product IR spectra of HIP_11 under nitrogen and oxygen atmospheres.
Aerospace 12 00507 g0a4

References

  1. Clark, J.D. Ignition! Rutgers University Press: New Brunswick, NJ, USA, 2018. [Google Scholar]
  2. Weiss, H.G.; Johnson, B.; Fisher, H.D.; Gerstein, M. Modification of the Hydrazine-Nitrogen Tetroxide Ignition Delay. AIAA J. 1964, 2, 2222–2223. [Google Scholar]
  3. Klapötke, T.M. Chemistry of High-Energy Materials: Explosives, Propellants, Pyrotechnics; deGruyter: Berlin, Germany; New York, NY, USA, 2025. [Google Scholar]
  4. Dadieu, A.; Schmidt, E.W.; Damm, R. Qualitative Analyse des Zündvorganges. In Raketentreibstoffe; Springer: Wien, Austria, 1968; p. 245. [Google Scholar]
  5. Slocum-Wang, Z.; Felton, L.D.; Turner, T.W. Ignition Delay Screening Techniques: Drop Testing vs. Engine Testing. In Proceedings of the 42nd AIAA/ASME/SAE/ASEE Joint Propulsion Conference & Exhibit, Sacramento, CL, USA, 9–12 July 2006. [Google Scholar]
  6. Kang, H.; Lee, E.; Kwon, S. Suppression of Hard Start for Nontoxic Hypergolic Thruster Using H2O2 Oxidizer. J. Propuls. Power 2017, 33, 1111–1117. [Google Scholar] [CrossRef]
  7. Schmidt, E.W. Hydrazine and Its Derivatives: Preparation, Properties, Applications; Wiley-Interscience: New York, NY, USA, 2001. [Google Scholar]
  8. Santonen, T.; Kromhout, H.; Rietjens, I.; Van Tongeren, M.; Papameletiou, D.; Klein, C.L. SCOEL/REC/164 Hydrazine-Recommendation from the Scientific Committee on Occupational Exposure Limits; Publications Office of the European Union: Brussels, Belgium, 2016. [Google Scholar]
  9. European Chemicals Agency. Candidate List of Substances of Very High Concern for Authorisation. Available online: https://echa.europa.eu/candidate-list-table (accessed on 15 January 2024).
  10. European Chemicals Agency. Recommendation for the Authorisation List. Available online: https://echa.europa.eu/regulations/reach/authorisation/recommendation-for-inclusion-in-the-authorisation-list (accessed on 15 January 2025).
  11. National Oceanic and Atmospheric Administration. Nitrogen Tetroxide, June 1999. Available online: https://cameochemicals.noaa.gov/report?key=CH4075 (accessed on 7 March 2025).
  12. Negri, M.; Lauck, F. Hot Firing Tests of a Novel Green Hypergolic Propellant in a Thruster. J. Propuls. Power 2022, 38, 467–477. [Google Scholar] [CrossRef]
  13. Lauck, F.; Negri, M.; Freudenmann, D.; Schlechtriem, S. Selection of Ionic Liquids and Characterization of Hypergolicity with Hydrogen Peroxide. Int. J. Energetic Mater. Chem. Propuls. 2020, 19, 25–37. [Google Scholar] [CrossRef]
  14. Lauck, F.; Balkenhohl, J.; Negri, M.; Freudenmann, D.; Schlechtriem, S. Green bipropellant development—A study on the hypergolicity of imidazole thiocyanate ionic liquids with hydrogen peroxide in an automated drop test setup. Combust. Flame 2021, 226, 87–97. [Google Scholar] [CrossRef]
  15. Ricker, S.C.; Freudenmann, D.; Schlechtriem, S. Investigation on Ionic Liquid Combinations as Fuels for Hypergolic Propellants With Hydrogen Peroxide. In Space Propulsion; 3AF: Estoril, UK, 2022. [Google Scholar]
  16. Ricker, S.C.; Brüggemann, D.; Freudenmann, D.; Ricker, R.; Schlechtriem, S. Protic thiocyanate ionic liquids as fuels for hypergolic bipropellants with hydrogen peroxide. Fuel 2022, 328, 125290. [Google Scholar] [CrossRef]
  17. Stölzle, S.C.; Kruse, L.; Freudenmann, D. Trialkylsulfonium Thiocyanate Ionic Liquids: Investigation on Temperature-Dependent Ignition Behavior of Green Hypergolic Propellants. Propellants Explos. Pyrotech. 2024, 49, e202400151. [Google Scholar] [CrossRef]
  18. Ricker, S.C.; Lauck, F.; Teuffel, P.; Merz, F.; Freudenmann, D.; Kirchberger, C. HIM_30: Hot-Firing Tests and Characterisation of a Green Hypergolic Propellant Based on Ionic Liquids and Hydrogen Peroxide. In Space Propulsion; 3AF: Glasgow, UK, 2024. [Google Scholar]
  19. Wilkes, J.S. A short history of ionic liquids—From molten salts to neoteric solvents. Green Chem. 2002, 4, 73–80. [Google Scholar] [CrossRef]
  20. Carl Roth GmbH. 1-Ethyl-3-methyl-imidazolium-thiocyanat (EMIM SCN). 17 September 2024. Available online: https://www.carlroth.com/de/de/ionische-fluessigkeiten/1-ethyl-3-methyl-imidazolium-thiocyanat-%28emim-scn%29/p/2059.2 (accessed on 12 March 2025).
  21. Marsh, K.N.; Boxall, J.A.; Lichtenthaler, R. Room Temperature Ionic Liquids and Their Mixtures—A Review. Fluid Phase Equalibria 2004, 219, 93–98. [Google Scholar] [CrossRef]
  22. Ventura, M.C. Long Term Storability of Hydrogen Peroxide. In Proceedings of the 41st AIAA/ASME/SAE/ASEE Joint Propulsion Conference & Exhibit, Tucson, AZ, USA, 10–13 July 2005. [Google Scholar]
  23. Davis, D.D.; Dee, L.A.; Greene, B.; Hornung, S.D.; McClure, M.B.; Rathgeber, K.A. Fire, Explosion, Compatibility and Safety Hazards of Hydrogen Peroxide; NASA Scientific and Technical Information Program Office: Las Cruces, NM, USA, 2005. [Google Scholar]
  24. Smith, B.C. Fundamentals of Fourier Transform Infrared Spectroscopy; CRC Press: Boca Raton, FL, USA, 2011. [Google Scholar]
  25. Chambreau, S.D.; Schneider, S.; Rosander, M.; Hawkins, T.; Gallegos, C.J.; Pastewait, M.F.; Vaghjiani, G.L. Fourier Transform Infrared Studies in Hypergolic Ignition of Ionic Liquids. J. Phys. Chem. 2008, 112, 7816–7824. [Google Scholar] [CrossRef] [PubMed]
  26. Schumb, W.C.; Satterfield, C.N.; Wentworth, R.L. Hydrogen Peroxide; Reinhold Pub. Corp.: New York, NY, USA; London, UK, 1955. [Google Scholar]
  27. NIST Mass Spectrometry Data Center, William, E.W. (Director) Infrared Spectra. In NIST Chemistry WebBook, NIST Standard Reference Database Number 69; Linstrom, P.J., Mallard, W.G., Eds.; National Institute of Standards and Technology: Gaithersburg, MD, USA. Available online: https://webbook.nist.gov/chemistry/ (accessed on 27 March 2025).
Figure 1. Drop test setup, including gas sampling equipment.
Aerospace 12 00507 g001
Figure 2. An example of a 3D IR spectrum, generated by the TGA as an absorption spectrum and converted to transmittance, for the [EMIM][SCN] sample decomposed in a nitrogen atmosphere.
Aerospace 12 00507 g002
Figure 3. A 2D IR spectrum extracted from the 3D spectrum shown in Figure 2.
Aerospace 12 00507 g003
Figure 4. Structural formulas of [EMIM][SCN] (left) and [HIM][SCN] (right).
Aerospace 12 00507 g004
Figure 5. Full [EMIM][SCN] combustion product IR spectrum.
Aerospace 12 00507 g005
Figure 6. A detailed view of the peak cluster between 600 cm−1 and 800 cm−1 of the [EMIM][SCN] combustion product IR spectrum.
Aerospace 12 00507 g006
Figure 7. Comparison of HIM_30 combustion product IR spectra with 80 wt% HTP and 98 wt% HTP.
Aerospace 12 00507 g007
Figure 8. IR spectrum of CuSCN drop test products.
Aerospace 12 00507 g008
Figure 9. IR spectrum of [HIM][SCN] drop test products.
Aerospace 12 00507 g009
Figure 10. Comparison of [EMIM][SCN] gaseous decomposition product IR spectrum and [EMIM][SCN] liquid phase IR spectrum.
Aerospace 12 00507 g010
Figure 11. Comparison of decomposition product IR spectra of [EMIM][SCN] and HIM_30.
Aerospace 12 00507 g011
Table 1. Test matrix of combustion and decomposition product test campaigns.
Test TypeFuelNumber of TestsOther
Benchmark spectra[EMIM][SCN]6
HIP_116
HIM_306
Sulfonium-based ionic liquids[S111][SCN]3
[S222][SCN]3
Decreased HTP concentrationHIP_11380.5 wt% HTP concentration
HIM_303
TGA decomposition products[EMIM][SCN]4Thermogravimetric analyzer tests, two per fuel in pure oxygen atmosphere and two in pure nitrogen atmosphere
HIP_114
HIM_304
Table 2. Composition and purity of HIP_11 and HIM_30.
HIP_11HIM_30
Base component
(concentration)
[EMIM][SCN][EMIM][SCN]
(97.5 wt%)(70 wt%)
Base component purity
cation/anion
99.9%/99.9%99.9%/99.9%
Additive
(concentration)
CuSCN[HIM][SCN]
(2.5 wt%)(30 wt%)
Additive purity
cation/anion
99.4%/99.4%97.3%/99.4%
Disclaimer/Publisher’s Note: The statements, opinions and data contained in all publications are solely those of the individual author(s) and contributor(s) and not of MDPI and/or the editor(s). MDPI and/or the editor(s) disclaim responsibility for any injury to people or property resulting from any ideas, methods, instructions or products referred to in the content.

