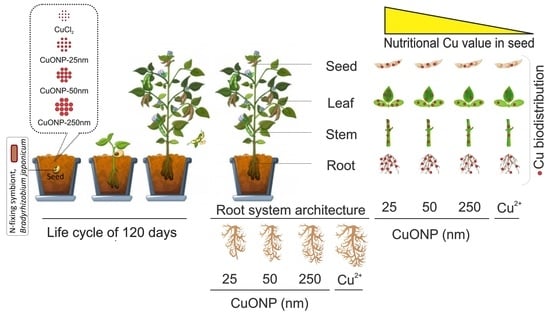
Root System Architecture, Copper Uptake and Tissue Distribution in Soybean (Glycine max (L.) Merr.) Grown in Copper Oxide Nanoparticle (CuONP)-Amended Soil and Implications for Human Nutrition


Abstract
1. Introduction
2. Material and Methods
2.1. CuONPs Synthesis, Characterization and Localization in Seed
2.2. Experimental Set Up, Soil Preparation and Exposure Conditions
2.3. Planting and Crop Management
3. Measurement of Root Parameters
3.1. ICP-OES Analysis of Total Copper Uptake
3.2. Seed Copper Concentration Comparison with Recommended Dietary Allowance (RDA) and Daily Value (DV)
3.3. Statistical Analysis
4. Results and Discussion
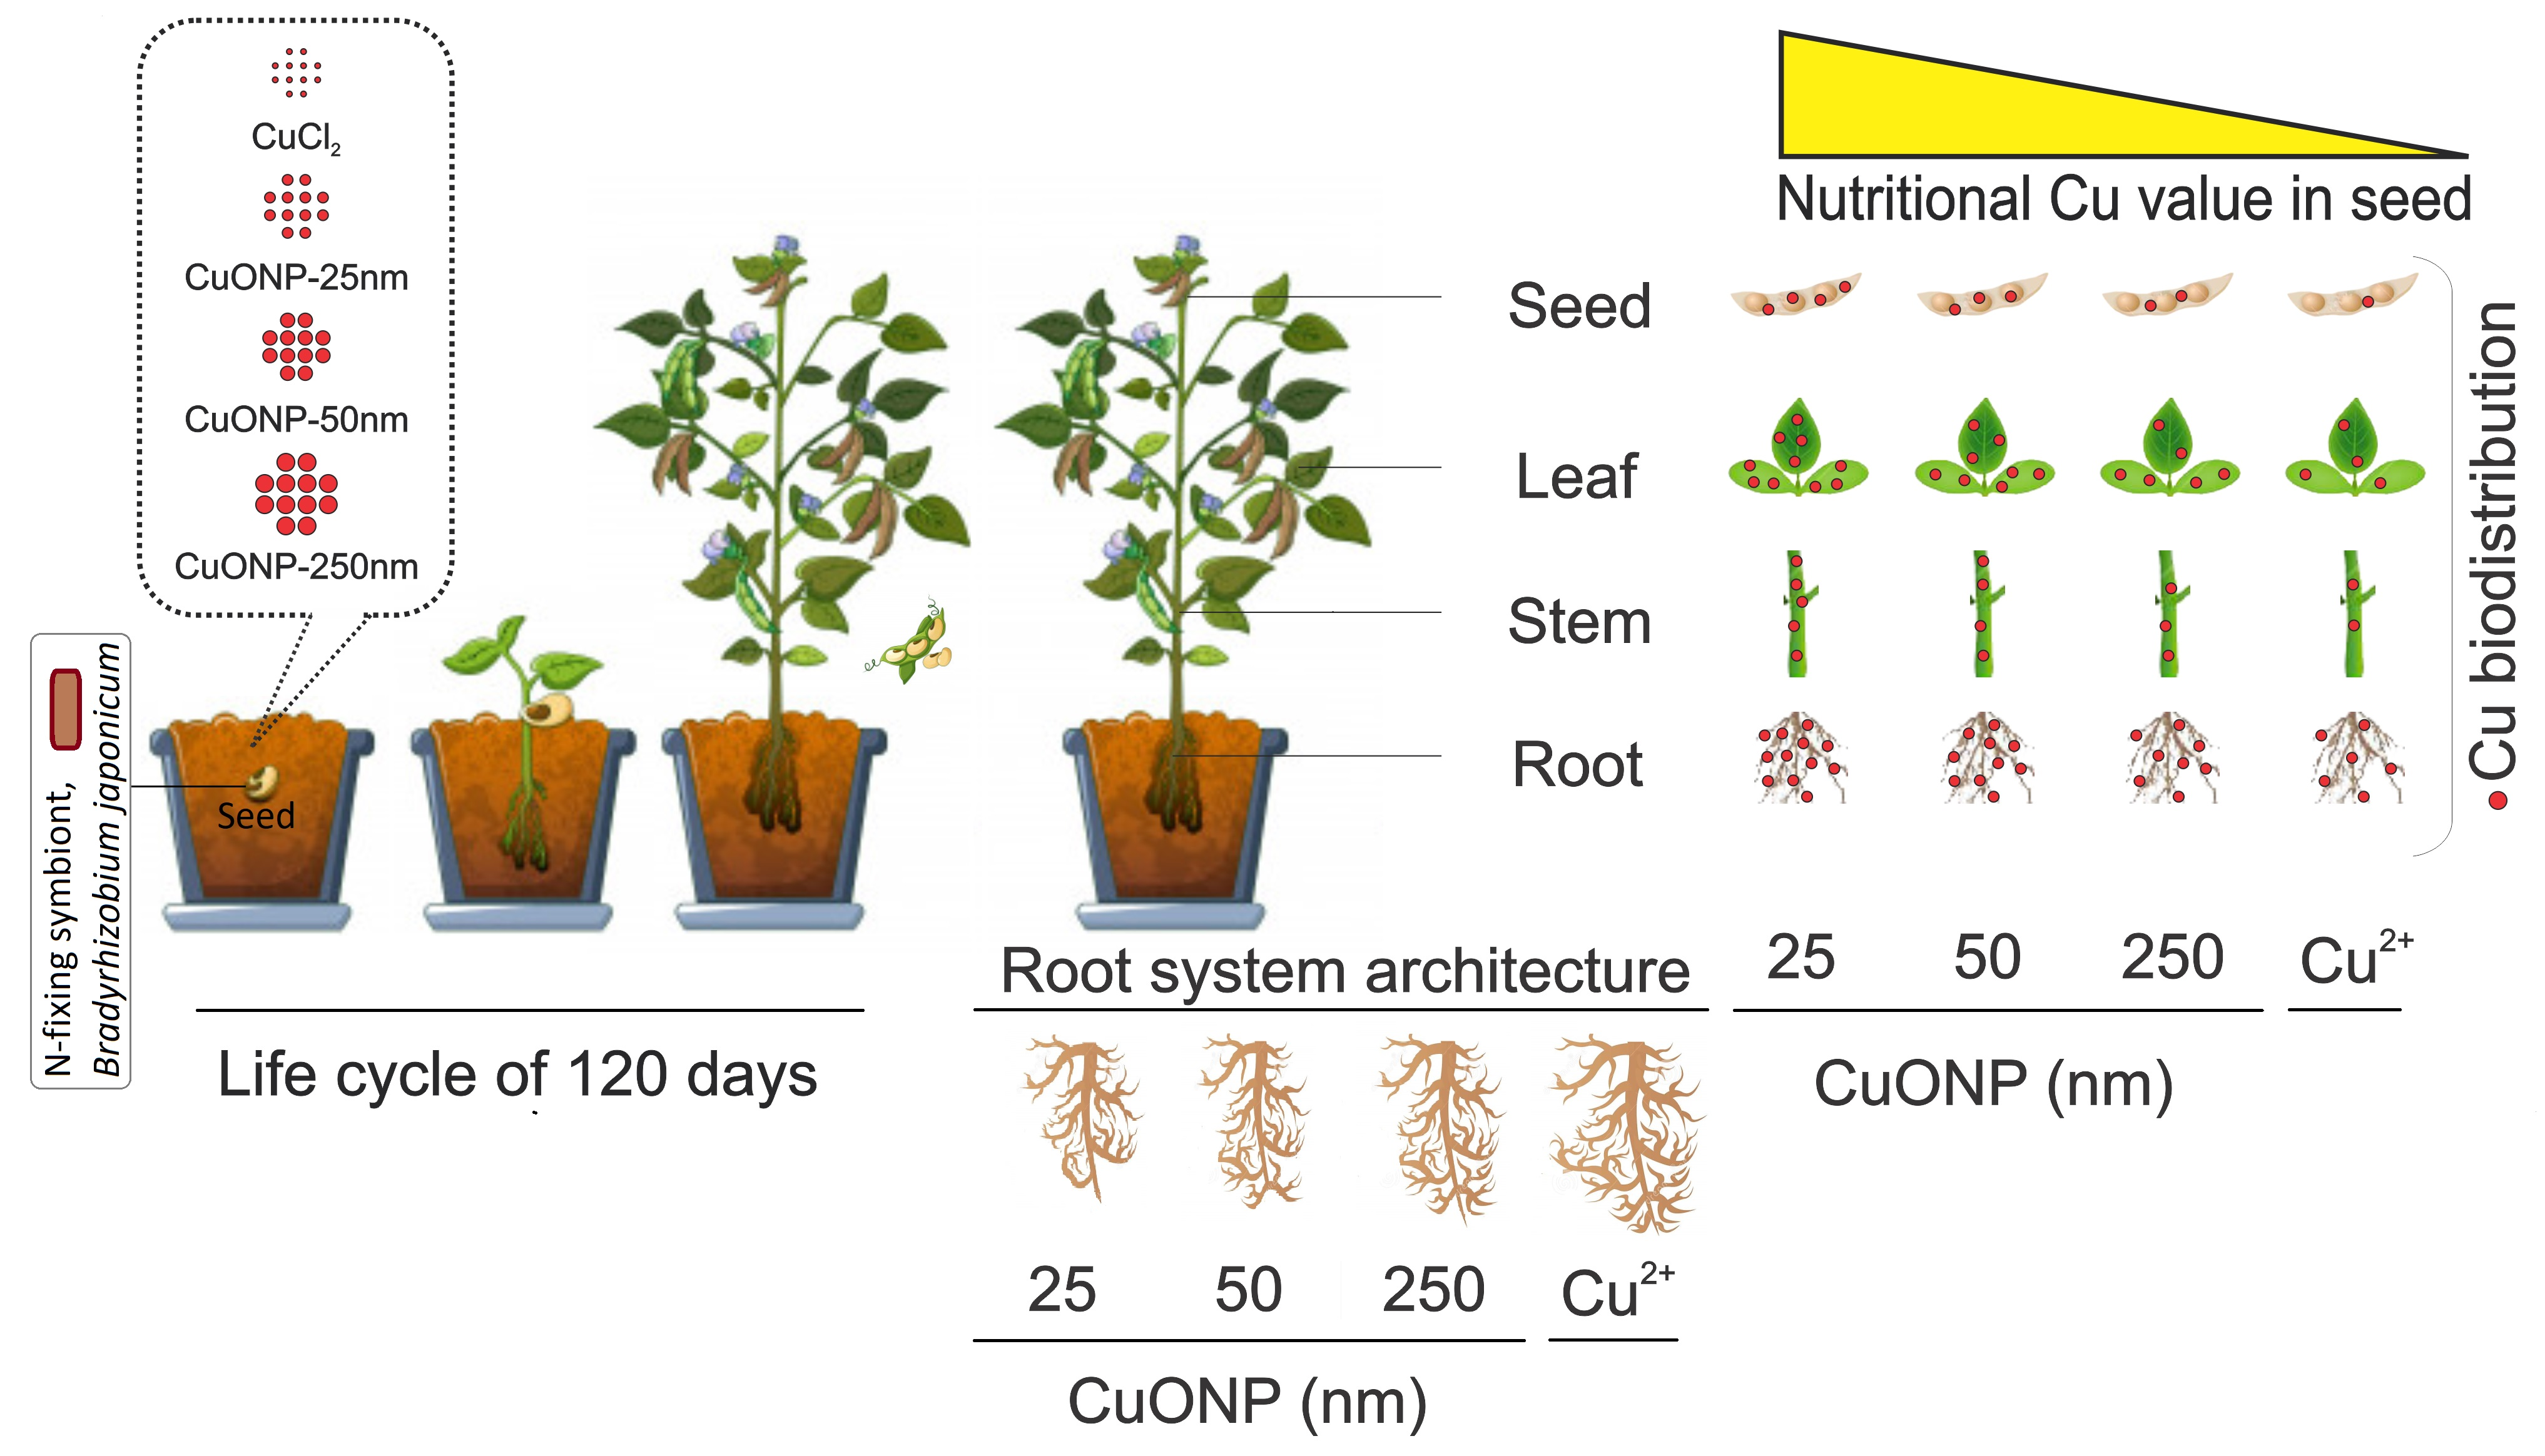
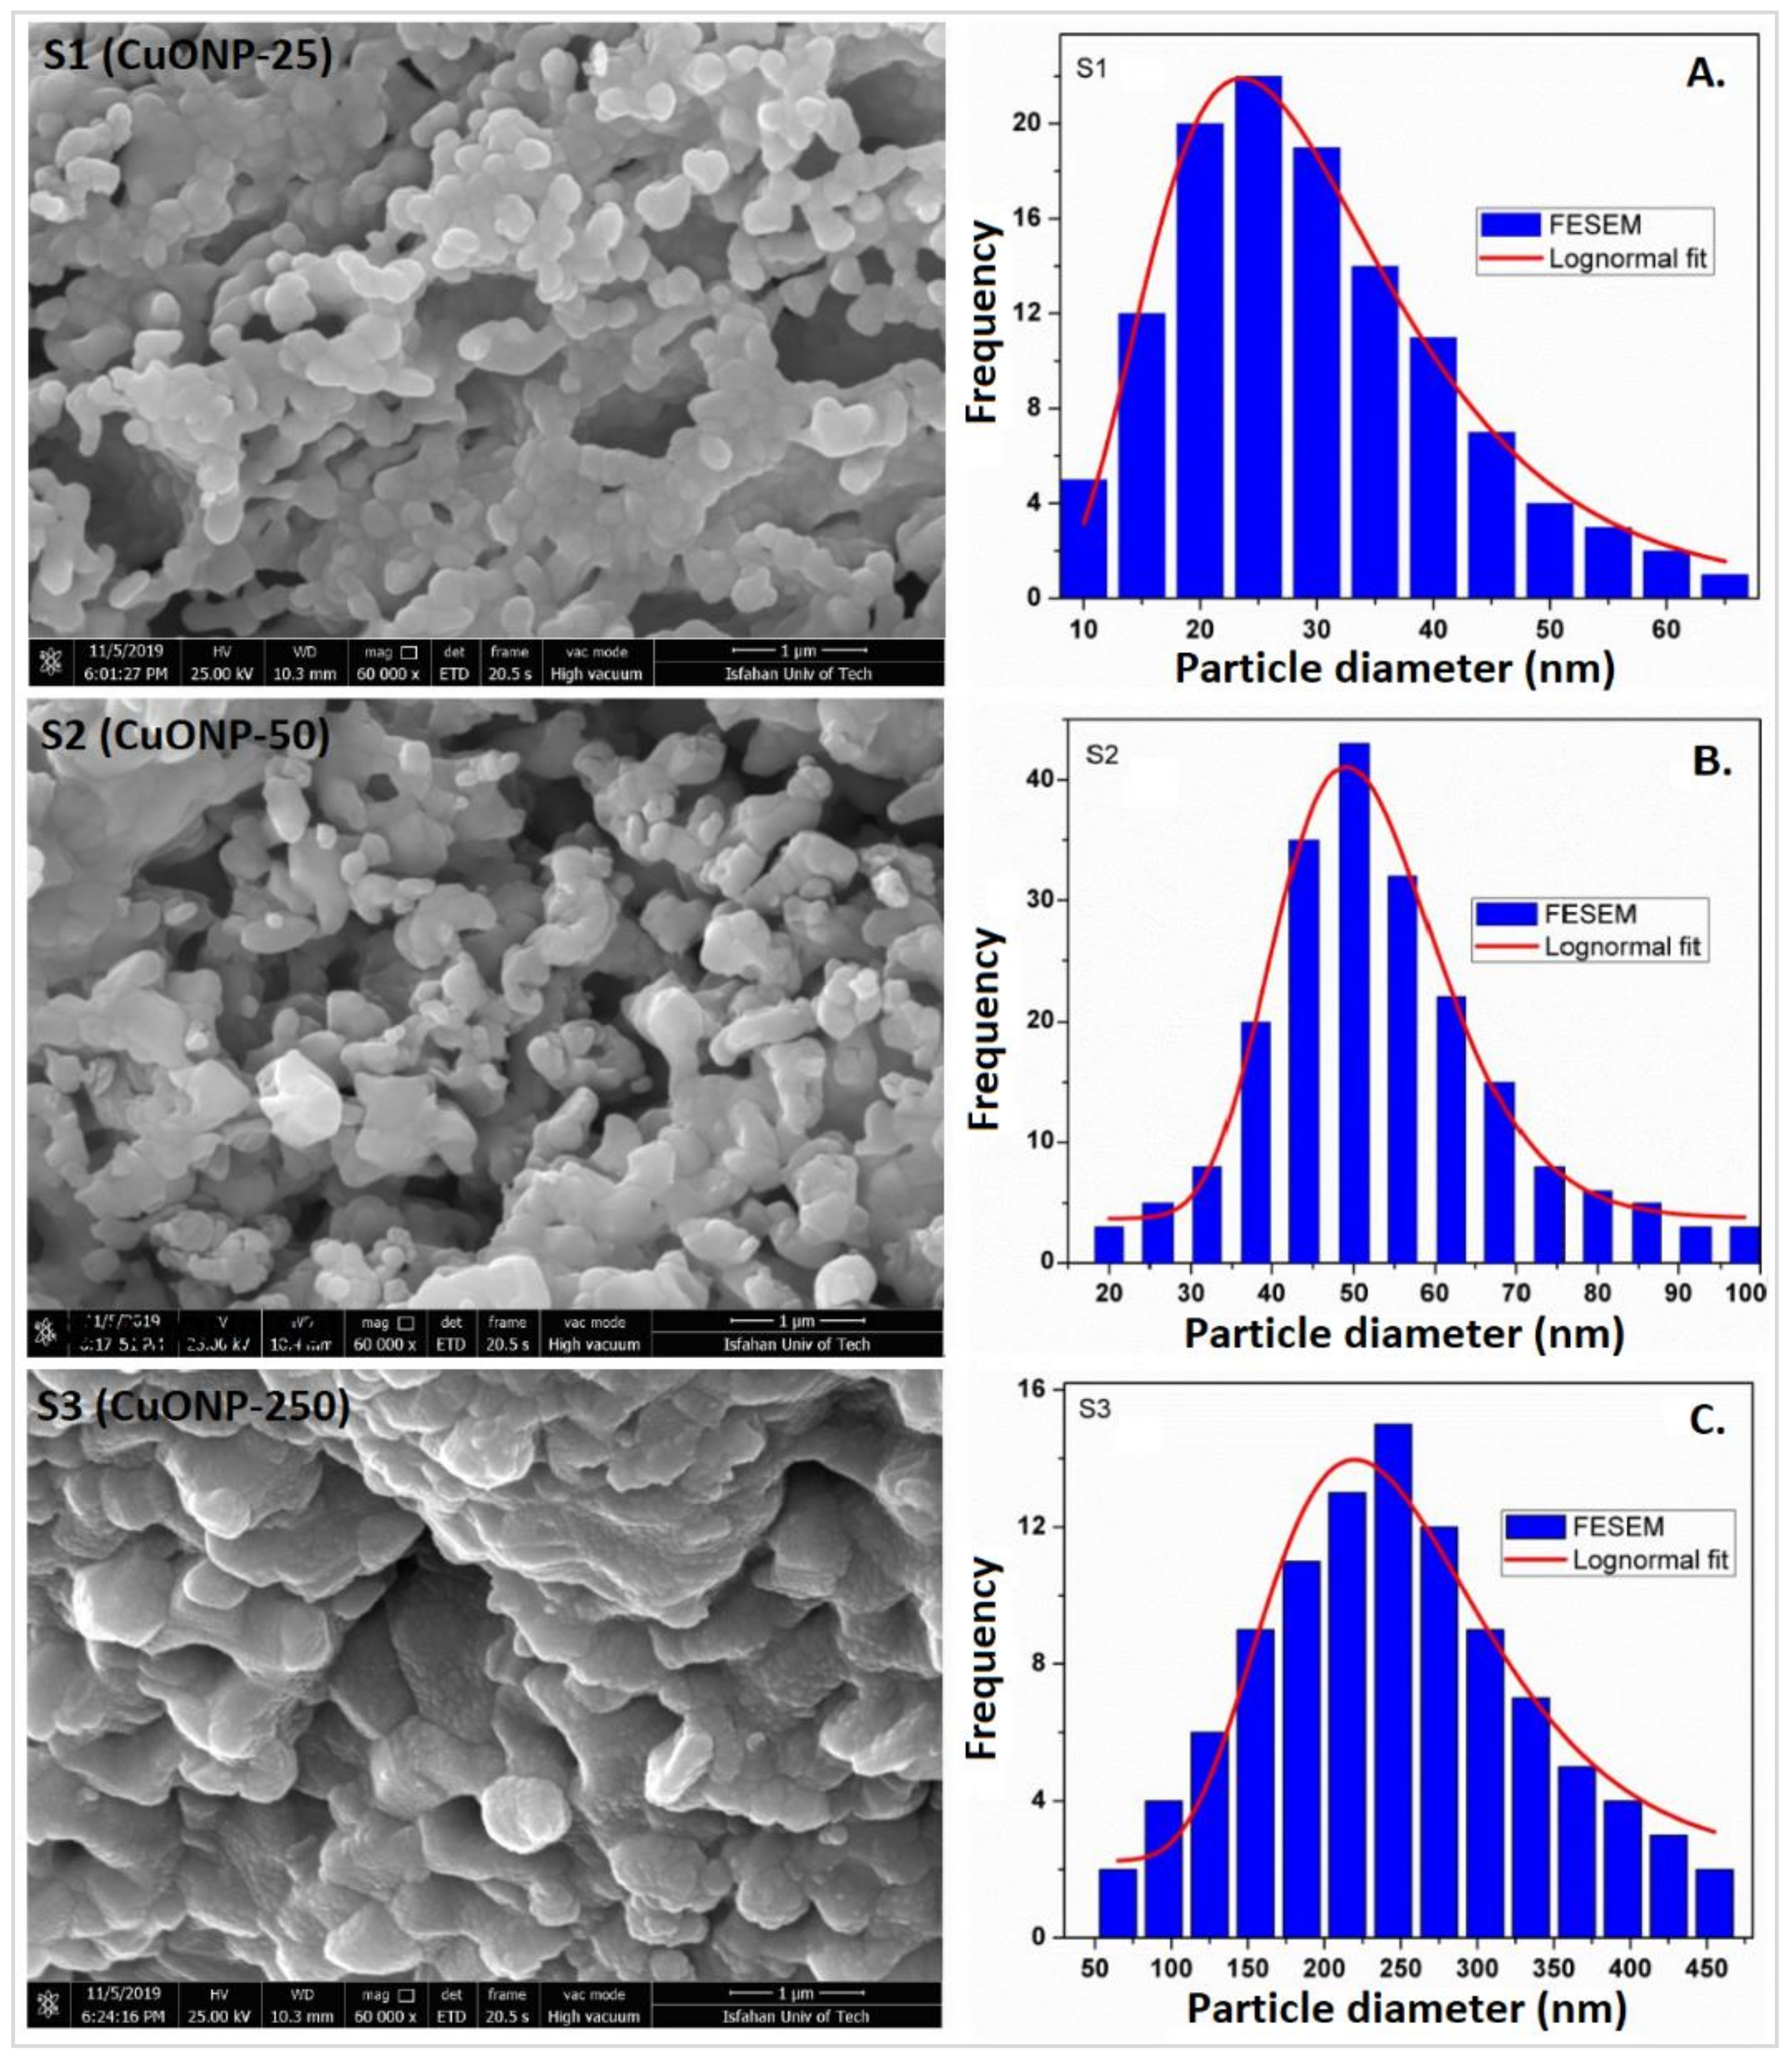
4.1. Nanoparticle Characterization
4.1.1. Root Dry Weight
4.1.2. Root Length
4.1.3. Root Volume
4.1.4. Root Area
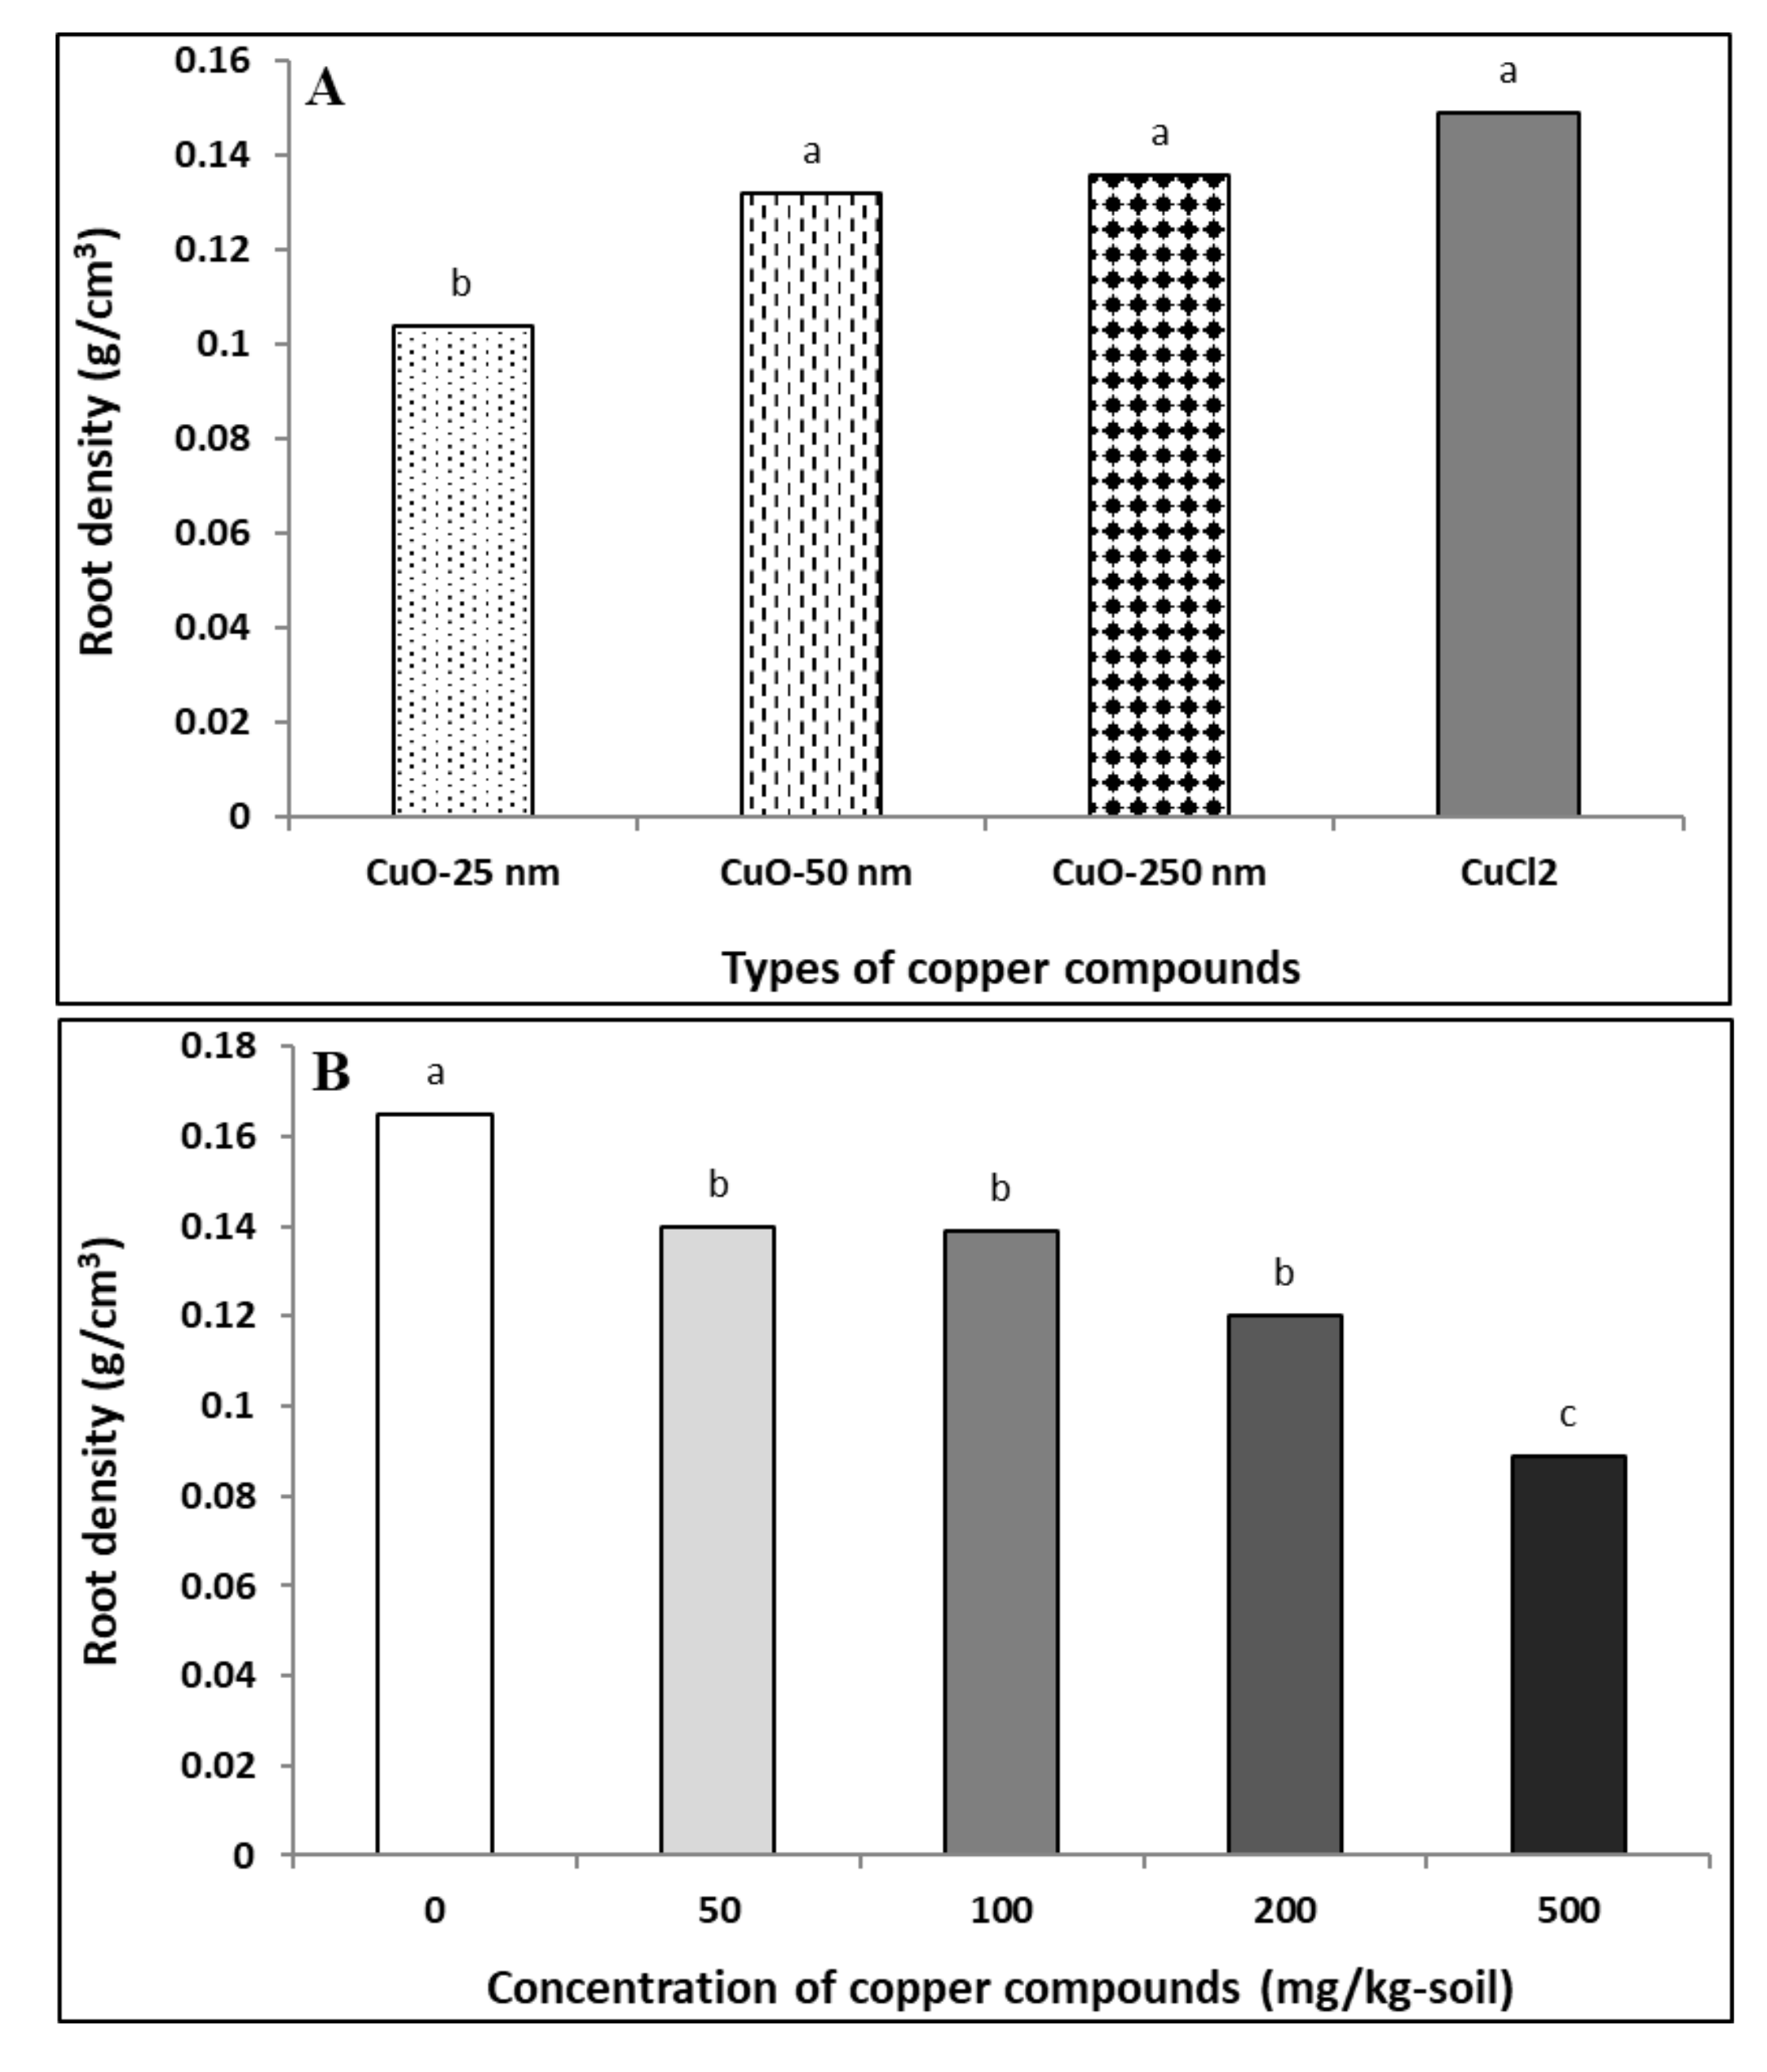
4.1.5. Root Density
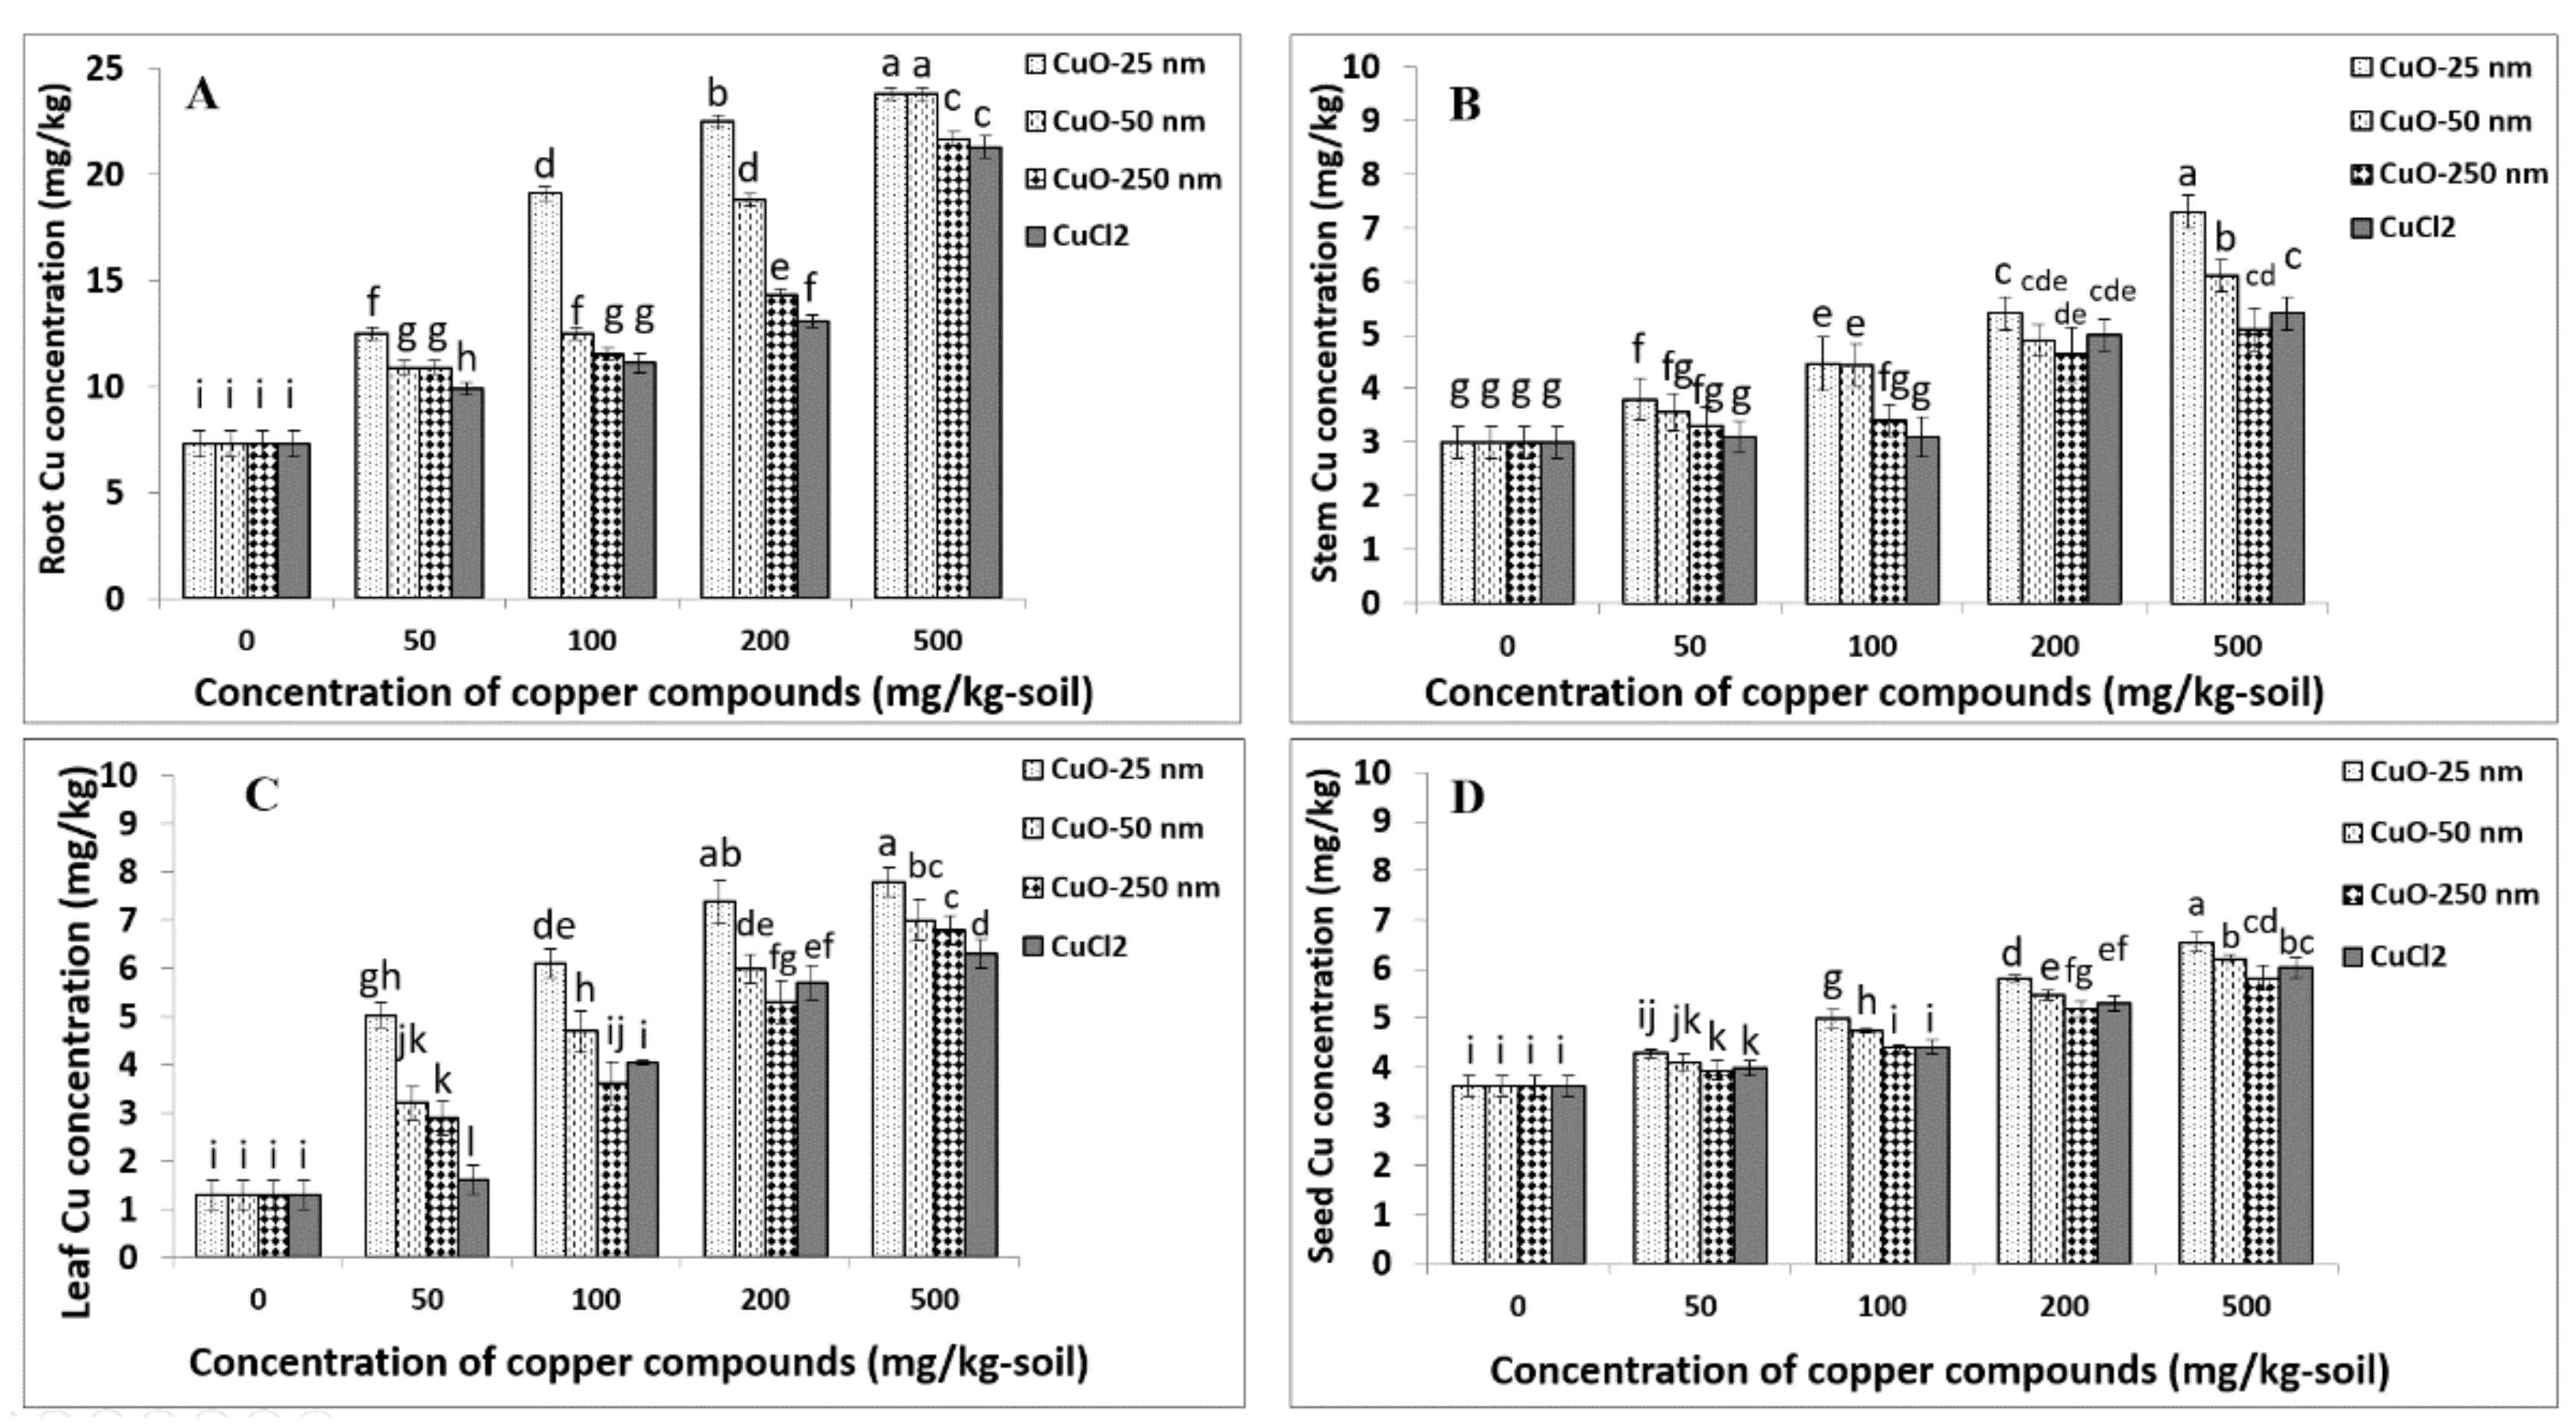
4.2. Root Copper Uptake
4.3. Stem Copper Uptake
4.4. Leaf Copper Uptake
4.5. Seed Copper Uptake
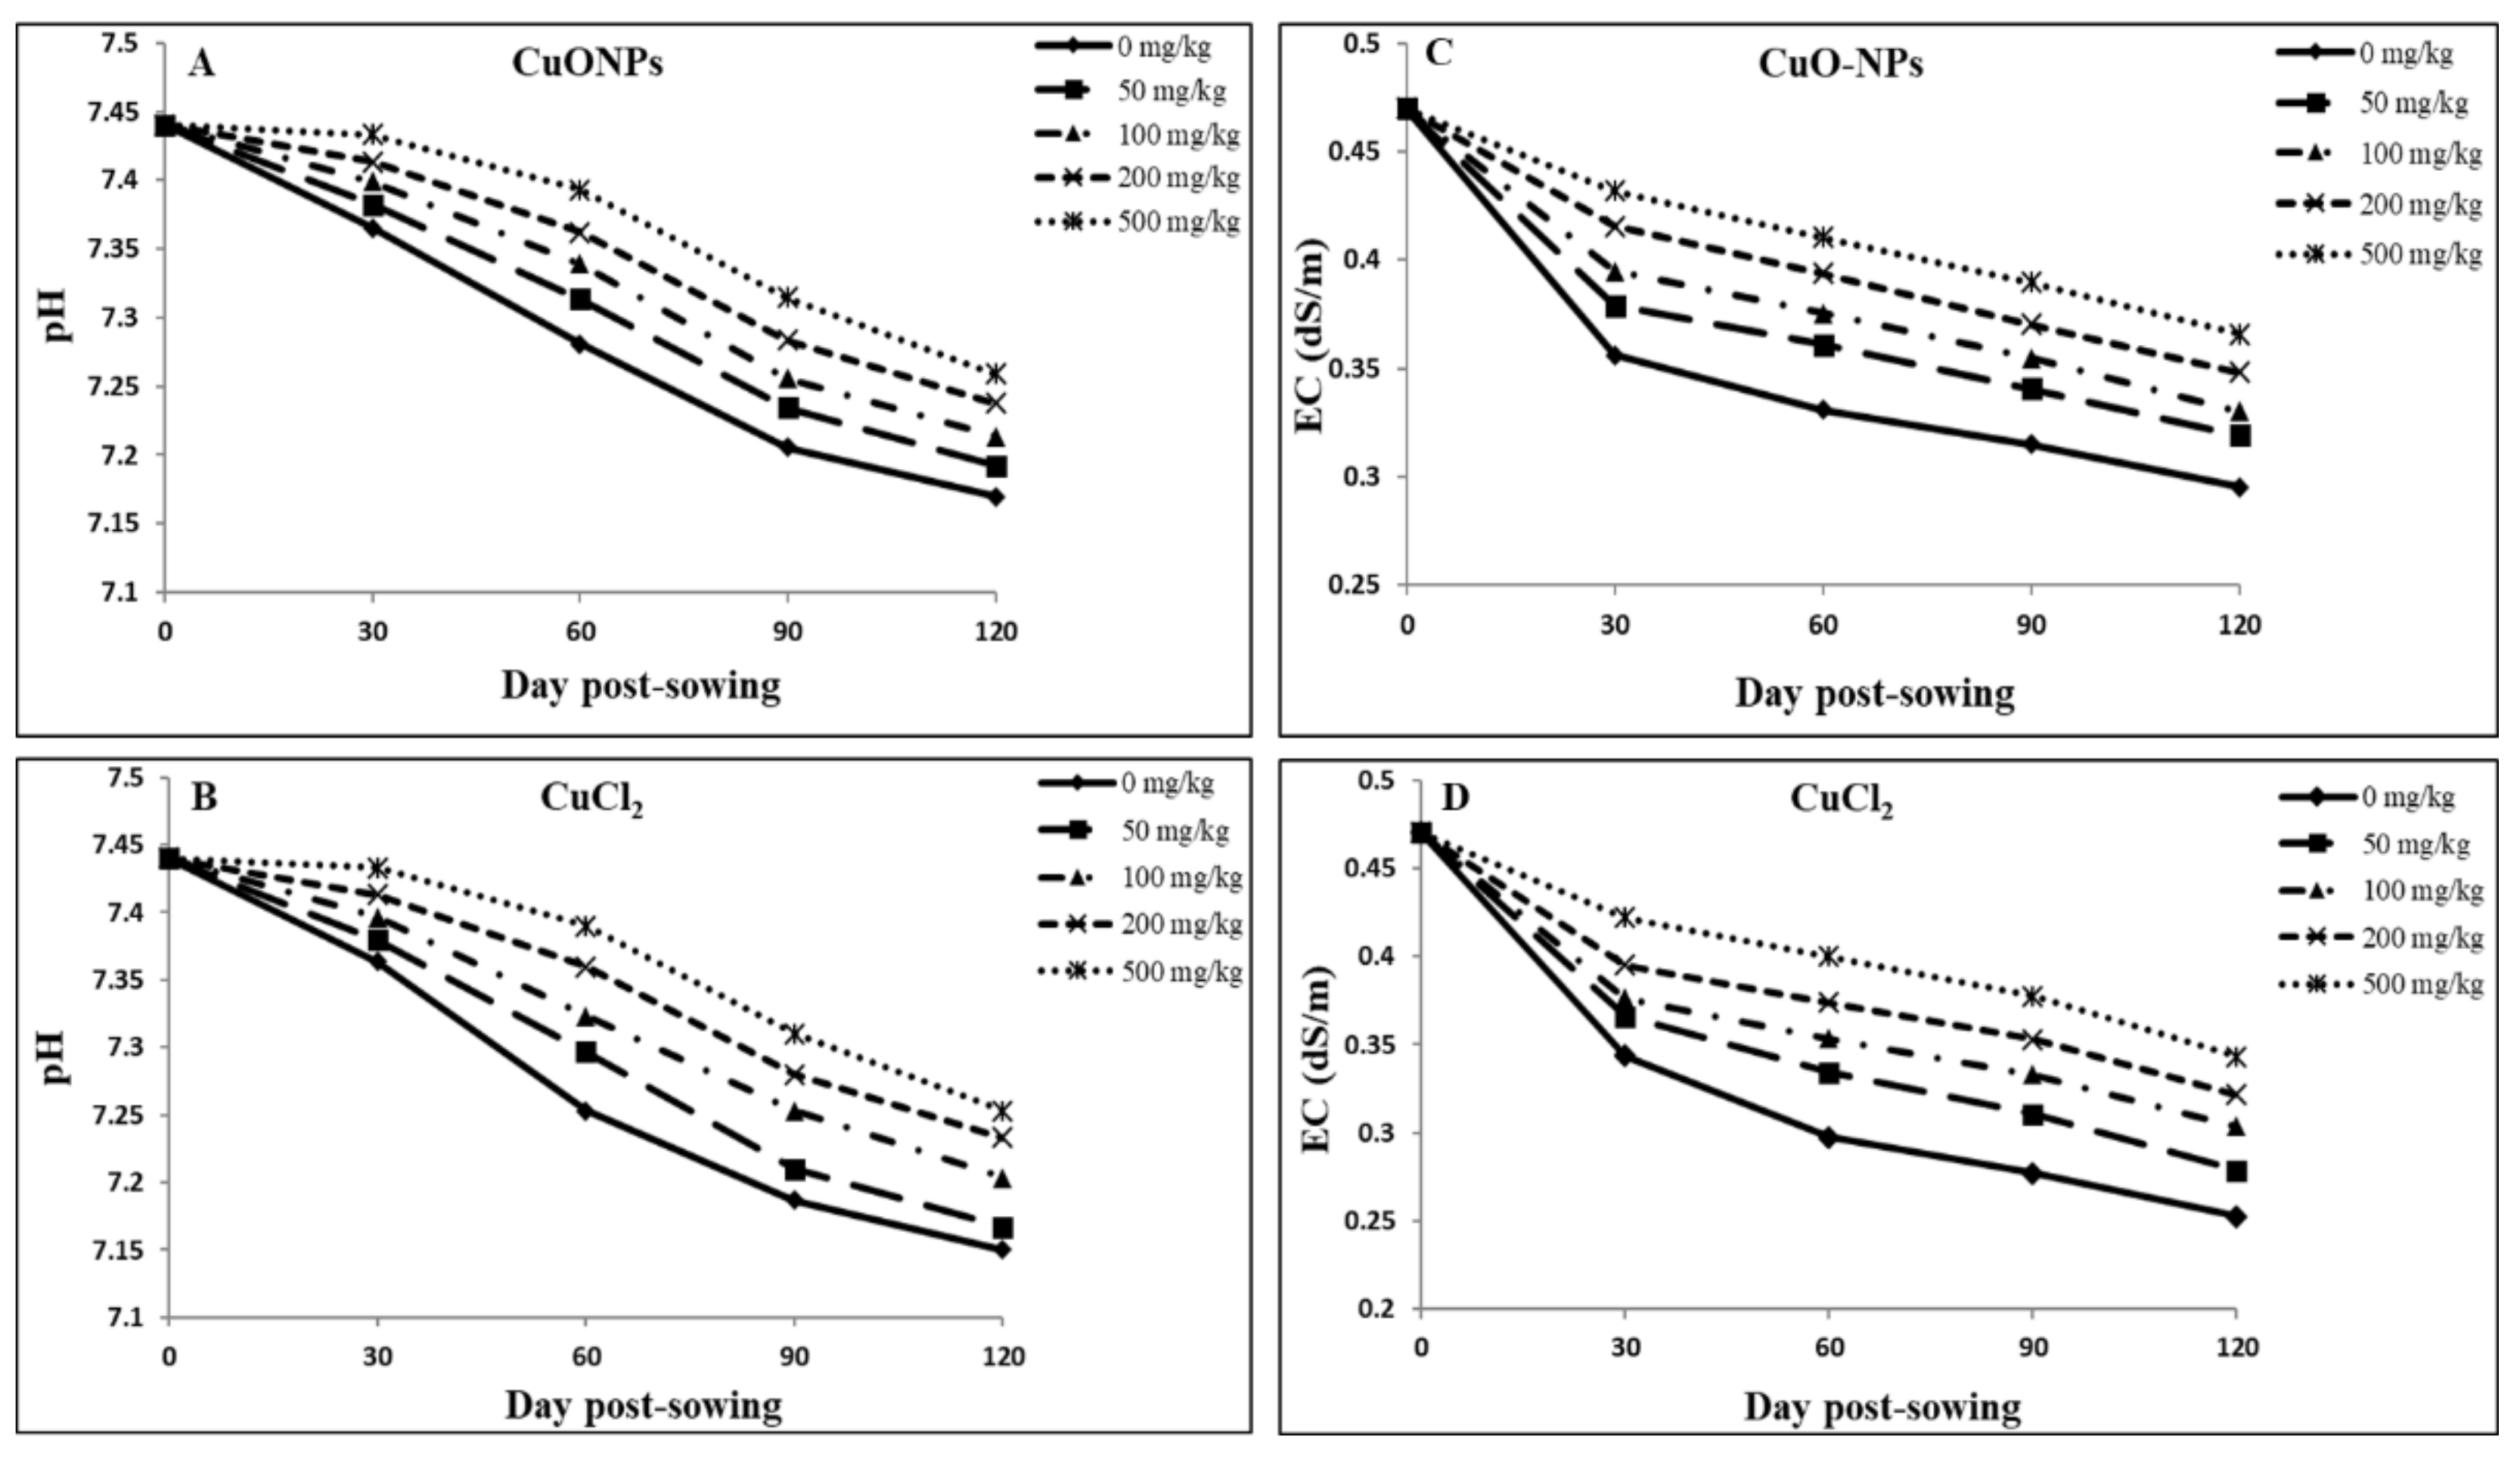
4.6. Soil pH and EC
4.7. Implications for Human Nutrition
5. Conclusions
Supplementary Materials
Author Contributions
Funding
Conflicts of Interest
References
- Singh, R.J.; Nelson, R.L.; Chung, G. Genetic Resources, Chromosome Engineering, and Crop Improvement, Chapter 2: Soybean (Glycine max (L.) Merr.); CRC Press: Boca Raton, FL, USA, 2007; pp. 14–49. [Google Scholar]
- Mataveli, L.R.V.; Pohl, P.; Mounicou, S.; Arruda, M.A.Z.; Szpunar, J. A comparative study of element concentrations and binding in transgenic and non-transgenic soybean seeds. Metallomics 2010, 2, 800–805. [Google Scholar] [CrossRef]
- Lee, K.; Rahman, M.S.; Kim, A.N.; Gul, K.; Kang, S.W.; Chun, J.; Kerr, W.L.; Choi, S.G. Quality characteristics and storage stability of low-fat tofu prepared with defatted soy flours treated by supercritical-CO2 and hexane. LWT Food Sci. Technol. 2019, 100, 237–243. [Google Scholar] [CrossRef]
- Xu, R.; Hu, W.; Zhou, Y.; Zhang, X.; Xu, S.; Guo, Q.; Qi, P.; Chen, L.; Yang, X.; Zhang, F.; et al. Use of near-infrared spectroscopy for the rapid evaluation of soybean [Glycine max (L.) Merri.] water soluble protein content. Spectrochim. Acta A Mol. Biomol. Spectrosc. 2020, 224, 117400. [Google Scholar] [CrossRef]
- Kumar, P.; Chatli, M.K.; Mehta, N.; Singh, P.; Malav, O.P.; Verma, A.K. Meat analogues: Health promising sustainable meat substitutes. Crit. Rev. Food Sci. Nutr. 2017, 57, 923–932. [Google Scholar] [CrossRef]
- Blair, R. Nutrition and Feeding of Organic Poultry; CAB International: Oxfordshire, UK, 2008; ISBN 978-1-84593-406-4. [Google Scholar]
- Ososki, A.L.; Kennelly, E.J. Phytoestrogens: A review of the present state of research. Phytother. Res. 2003, 17, 845–869. [Google Scholar] [CrossRef]
- Sakai, T.; Kogiso, M. Soy isoflavones and immunity. J. Med. Investig. 2008, 55, 167–173. [Google Scholar] [CrossRef] [PubMed]
- Kanchana, P.; Lakshmi Santha, M.; Dilip Raja, K. A review on Glycine max (L.) Merr. (soybean). World J. Pharm. Pharm. Sci. 2016, 5, 356–371. [Google Scholar]
- UN Department of Economic and Social Affairs. Population Division 2019 World Population Prospects; United Nations: New York, NY, USA, 2019. [Google Scholar]
- Food and Agriculture Organization of the United Nations. FAOSTAT. 2019. Available online: http://www.fao.org/faostat/en/#data/QC (accessed on 6 September 2020).
- Liu, R.; Lal, R. Potentials of engineered nanoparticles as fertilizers for increasing agronomic productions. Sci. Total Environ. 2015, 514, 131–139. [Google Scholar] [CrossRef] [PubMed]
- Miransari, M. Environmental Stresses in Soybean Production; AbtinBerkeh Scientific Ltd. Company: Isfahan, Iran, 2016; pp. 273–298. ISBN 978-0-12-801535-3. [Google Scholar]
- Welch, R.; Graham, R. Breeding for micronutrients in staple food crops from a human nutrition perspective. J. Exp. Bot. 2004, 55, 353–364. [Google Scholar] [CrossRef] [PubMed]
- Servin, A.; Elmer, W.; Mukherjee, A.; Torre-Roche, R.D.; Hamdi, H.; White, J.C.; Bindraban, P.; Dimkpa, C. A review of the use of engineered nanomaterials to suppress plant disease and enhance crop yield. J. Nanopart. Res. 2015, 17, 92. [Google Scholar] [CrossRef]
- Raliya, R.; Saharan, V.; Dimkpa, C.; Biswas, P. Nanofertilizer for precision and sustainable agriculture: Current state and future perspectives. J. Agric. Food. Chem. 2017, 66, 6487–6503. [Google Scholar] [CrossRef] [PubMed]
- Pokhrel, L.R.; Bacon, C.; Barbour, L. Nanotechnology-enabled agriculture is the future? EC Nutr. 2017, 9.4, 162–167. [Google Scholar]
- Kah, M.; Kookana, R.S.; Gogos, A.; Bucheli, T.D. A critical evaluation of nanopesticides and nanofertilizers against their conventional analogues. Nat. Nanotechnol. 2018, 13, 677–684. [Google Scholar] [CrossRef]
- Dimkpa, C.O.; Bindraban, P.S. Nanofertilizers: New products for the industry? J. Agric. Food Chem. 2018, 66, 6462–6473. [Google Scholar] [CrossRef] [PubMed]
- Pokhrel, L.R.; Dubey, B. Evaluation of developmental responses of two crop plants exposed to silver and zinc oxide nanoparticles. Sci. Total Environ. 2013, 452–453, 321–332. [Google Scholar] [CrossRef]
- Pokhrel, L.R.; Dubey, B. Early developmental responses of plants exposed to metals and oxides nanomaterials. In Nanotechnology and Plant Sciences; Siddiqui, M., Al-Whaibi, M., Mohammad, F., Eds.; Springer: Cham, Switzerland, 2015; pp. 153–164. [Google Scholar] [CrossRef]
- Dimkpa, C.O.; Singh, U.; Bindraban, P.S.; Adisa, I.O.; Elmer, W.H.; Gardea-Torresdey, J.L.; White, J.C. Addition-omission of zinc, copper, and boron nano and bulk oxide particles demonstrate element and size -specific response of soybean to micronutrients exposure. Sci. Total Environ. 2019, 665, 606–616. [Google Scholar] [CrossRef]
- Ma, X.; Geiser-Lee, J.; Deng, Y.; Kolmakov, A. Interactions between engineered nanoparticles (ENPs) and plants: Phytotoxicity, uptake and accumulation. Sci. Total Environ. 2010, 408, 3053–3061. [Google Scholar] [CrossRef]
- Rajput, V.D.; Minkina, T.; Sushkova, S.; Mandzhieva, S.; Fedorenko, A.; Lysenko, V.; Bederska-Błaszczyk, M.; Olchowik, J.; Tsitsuashvili, V.; Chaplygin, V. Structural and ultrastructural changes in nanoparticle exposed plants. In Nanoscience for Sustainable Agriculture; Springer: Cham, Switzerland, 2019; pp. 281–295. [Google Scholar] [CrossRef]
- Crowe, S.A.; Dossing, L.N.; Beukes, N.J.; Bau, M.; Kruger, S.J.; Frei, R.; Canfield, D.E. Atmospheric oxygenation three billion years ago. Nature 2013, 501, 535–538. [Google Scholar] [CrossRef]
- Chakraborty, A.; Kumar, P.; Ghosh, K.; Roy, P. Evaluation of a Schiff base copper complex compound as potent anticancer molecule with multiple targets of action. Eur. J. Pharmacol. 2010, 647, 1–12. [Google Scholar] [CrossRef]
- Puig, S.; Andrés-Colás, N.; García-Molina, A.; Peñarrubia, L. Copper and iron homeostasis in Arabidopsis: Responses to metal deficiencies, interactions and biotechnological applications. Plant Cell Environ. 2007, 30, 271–290. [Google Scholar] [CrossRef]
- Burkhead, J.L.; Reynolds, K.A.G.; Abdel-Ghany, S.E.; Cohu, C.M.; Pilon, M. Copper homeostasis. New Phytol. 2009, 182, 799–816. [Google Scholar] [CrossRef] [PubMed]
- Yuan, M.; Wang, S.; Chu, Z.; Li, X.; Xu, C. The bacterial pathogen Xanthomonas oryzae overcomes rice defenses by regulating host copper redistribution. Plant Cell. 2010, 22, 3164–3176. [Google Scholar] [CrossRef] [PubMed]
- Rai, M.; Lngle, A.P.; Pandit, R.; Paralikar, P.; Shende, S.; Gupta, I.; Biswas, J.K.; da Silva, S.S. Copper and copper nanoparticles: Role in management of insect-pests and pathogenic microbes. Nanotechnol. Rev. 2018, 7, 303–315. [Google Scholar] [CrossRef]
- Lequeux, H.; Hermans, C.; Lutts, S.; Verbruggen, N. Response to copper excess in Arabidopsis thaliana: Impact on the root system architecture, hormone distribution, lignin accumulation and mineral profile. Plant Physiol. Biochem. 2010, 48, 673–682. [Google Scholar] [CrossRef]
- Finger-Teixeira, A.; Ferrarese, M.d.L.L.; Soares, A.R.; da Silva, D.; Ferrarese-Filho, O. Cadmium-induced lignification restricts soybean root growth. Ecotoxicol. Environ. Saf. 2010, 73, 1959–1964. [Google Scholar] [CrossRef]
- Shaw, A.K.; Hossain, Z. Impact of nano-CuO stress on rice (Oryza sativa L.) seedlings. Chemosphere 2013, 93, 906–915. [Google Scholar] [CrossRef] [PubMed]
- Dimkpa, C.O.; Bindraban, P.S.; Fugice, J.; Agyin-Birikorang, S.; Singh, U.; Hellums, D. Composite micronutrient nanoparticles and salts decrease drought stress in soybean. Agron. Sustain. Dev. 2017, 37, 5. [Google Scholar] [CrossRef]
- Lee, W.M.; An, Y.J.; Yoon, H.; Kweon, H.S. Toxicity and bioavailability of copper nanoparticles to the terrestrial plants mung bean (Phaseolus radiatus) and wheat (Triticum aestivum): Plant agar test for water insoluble nanoparticles. Environ. Toxicol. Chem. 2008, 27, 1915–1921. [Google Scholar] [CrossRef]
- Shah, V.; Belozerova, I. Influence of metal nanoparticles on the soil microbial community and germination of lettuce seeds. Water Air Soil Pollut. 2009, 197, 143–148. [Google Scholar] [CrossRef]
- Stampoulis, D.; Sinha, S.K.; White, J.C. Assay-dependent phytotoxicity of nanoparticles to plants. Environ. Sci. Technol. 2009, 43, 9473–9479. [Google Scholar] [CrossRef]
- Institute of Medicine, Food and Nutrition Board. Dietary Reference Intakes for Vitamin A, Vitamin K, Arsenic, Boron, Chromium, Copper, Iodine, Iron, Manganese, Molybdenum, Nickel, Silicon, Vanadium, and Zinc; National Academies Press: Washington, DC, USA, 2001. [Google Scholar]
- Hellman, N.E.; Gitlin, J.D. Ceruloplasmin metabolism and function. Annu. Rev. Nutr. 2002, 22, 439–458. [Google Scholar] [CrossRef] [PubMed]
- Prohaska, J.R. Present Knowledge in Nutrition, 10th ed.; Erdman, J.W., Macdonald, I.A., Zeisel, S.H., Eds.; Wiley-Blackwell: Washington, DC, USA, 2012; pp. 540–553. [Google Scholar]
- Collins, J.F. Copper. In Modern Nutrition in Health and Disease, 11th ed.; Ross, A.C., Caballero, B., Cousins, R.J., Tucker, K.L., Ziegler, T.R., Eds.; Lippincott Williams & Wilkins: Baltimore, MD, USA, 2014; pp. 206–216. [Google Scholar]
- Owen, C.A.J. Biochemical Aspects of Copper: Copper Proteins, Ceruloplasmin, and Copper Protein Binding; Noyes Publications: Park Ridge, NJ, USA, 1982; p. 205. [Google Scholar]
- Allen, K.G.; Klevay, L.M. Copper: An antioxidant nutrient for cardiovascular health. Curr. Opin. Lipidol. 1994, 5, 22–28. [Google Scholar] [CrossRef]
- Blumberg, J.B.; Frei, B.; Fulgoni, V.L.; Weaver, C.M.; Zeisel, S.H. Contribution of dietary supplements to nutritional adequacy in various adult age groups. Nutrition 2017, 9, 1325. [Google Scholar] [CrossRef]
- Fairweather-Tait, S.J.; Harvey, L.J.; Collings, R. Risk-benefit analysis of mineral intakes: Case studies on copper and iron. Proc. Nutr. Soc. 2011, 70, 1–9. [Google Scholar] [CrossRef] [PubMed]
- Prohaska, J.R. Impact of copper deficiency in humans. Ann. N. Y. Acad. Sci. 2014, 13, 1–5. [Google Scholar] [CrossRef] [PubMed]
- Yusefi-Tanha, E.; Fallah, S.; Rostamnejadi, A.; Pokhrel, L.R. Particle size and concentration dependent toxicity of copper oxide nanoparticles (CuONPs) on seed yield and antioxidant defense system in soil grown soybean (Glycine max cv. Kowsar). Sci. Total Environ. 2020, 715, 136994. [Google Scholar] [CrossRef]
- García-Gómez, C.; Obrador, A.; González, D.; Babín, M.; Fernández, M.D. Comparative study of the phytotoxicity of ZnO nanoparticles and Zn accumulation in nine crops grown in a calcareous soil and an acidic soil. Sci. Total Environ. 2018, 644, 770–780. [Google Scholar] [CrossRef] [PubMed]
- De Baets, S.; Poesen, J.; Knapen, A.; Barbera, G.G.; Navarro, J.A. Root characteristics of representative Mediterranean plant species and their erosion-reducing potential during concentrated runoff. Plant Soil 2007, 294, 169–183. [Google Scholar] [CrossRef]
- Ghasemi Siani, N.; Fallah, S.; Pokhrel, L.R.; Rostamnejadi, A. Natural amelioration of zinc oxide nanoparticles toxicity in fenugreek (Trigonella foenum-gracum) by arbuscular mycorrhizal (Glomus intraradices) secretion of glomalin. Plant Physiol. Biochem. 2017, 112, 227–238. [Google Scholar] [CrossRef]
- National Institute of Health (NIH). Copper: Fact Sheet for Health Professionals. 2020. Available online: https://ods.od.nih.gov/factsheets/Copper-HealthProfessional/#en3 (accessed on 6 September 2020).
- US Food and Drug Administration (FDA). Food Labeling: Revision of the Nutrition and Supplement Facts Labels. Federal Register, 27 May 2016; Volume 81, No. 103, Docket No. FDA–2012–N–1210; RIN 0910–AF22. [Google Scholar]
- U.S. Department of Agriculture (USDA). Agricultural Research Service’s Food Data Central. 2019. Available online: https://fdc.nal.usda.gov/ (accessed on 6 September 2020).
- The World’s Healthiest Foods. What’s New and Beneficial about Garbanzo Beans. Available online: http://www.whfoods.com/genpage.php?tname=foodspice&dbid=58 (accessed on 6 September 2020).
- Nair, P.M.G.; Chung, I.M. A mechanistic study on the toxic effect of copper oxide nanoparticles in soybean (Glycine max L.) root development and lignification of root cells. Biol. Trace Elem. Res. 2014, 162, 342–352. [Google Scholar] [CrossRef]
- Barker, A.V.; Pilbeam, D.J. Handbook of Plant Nutrition, 2nd ed.; CRC Press: Boca Raton, FL, USA, 2015; p. 774. [Google Scholar]
- Shaw, A.K.; Ghosh, S.; Kalaji, H.M.; Bosa, K.; Brestic, M.; Zivcak, M.; Hossain, Z. Nano-CuO stress induced modulation of antioxidative defenseand photosynthetic performance of Syrianbarley (Hordeum vulgare L.). Environ. Exp. Bot. 2014, 102, 37–47. [Google Scholar] [CrossRef]
- Dimkpa, C.O.; McLean, J.E.; Latta, D.E.; Manangón, E.; Britt, D.W.; Johnson, W.P.; Boyanov, M.I.; Anderson, A.J. CuO and ZnO nanoparticles: Phytotoxicity, metal speciation, and induction of oxidative stress in sand-grown wheat. J. Nanopart. Res. 2012, 14, 1125. [Google Scholar] [CrossRef]
- Nair, P.M.G.; Chung, I.M. Impact of copper oxide nanoparticles exposure on Arabidopsis thaliana growth root system development root lignificaion and molecular level changes. Environ. Sci. Pollut. Res. 2014, 21, 12709–12722. [Google Scholar] [CrossRef] [PubMed]
- Lin, C.C.; Chen, L.M.; Liu, Z.H. Rapid effect of copper on lignin biosynthesis in soybean roots. Plant Sci. 2005, 168, 855–861. [Google Scholar] [CrossRef]
- Adams, J.; Wright, M.; Wagner, H.; Valiente, J.; Britt, D.; Anderson, A. Cu from dissolution of CuO nanoparticles signals changes in root morphology. Plant Physiol. Biochem. 2016. [Google Scholar] [CrossRef]
- Yang, Z.Z.; Chen, J.; Dou, R.Z.; Gao, X.; Mao, C.B.; Wang, L. Assessment of the phytotoxicity of metal oxide nanoparticles on two crop plants, maize (Zea mays L.) and rice (Oryza sativa L.). Int. J. Environ. Res. Public Health 2015, 12, 15100–15109. [Google Scholar] [CrossRef]
- Nair, P.M.G.; Chung, I.M. Study on the correlation between copper oxide nanoparticles induced growth suppression and enhanced lignification in Indian mustard (Brassica juncea L.). Ecotoxicol. Environ. Saf. 2015, 113, 302–313. [Google Scholar] [CrossRef]
- Nair, P.M.G.; Kim, S.H.; Chung, I.M. Copper oxide nanoparticle toxicity in mung bean (Vigna radiata L.) seedlings: Physiological and molecular level responses of in vitro grown plants. Acta Physiol. Plant 2014, 36, 2947–2958. [Google Scholar] [CrossRef]
- Castiglione Monica, R.; Cremonini, R. Nanoparticles and higher plants. J. Caryologia 2009, 62, 161–165. [Google Scholar] [CrossRef]
- Rawat, S.; Pullagurala, V.L.R.; Hernandez-Molina, M.; Sun, Y.; Niu, G.; Hernandez-Viezcas, J.; Peralta-Videa, J.R.; Gardea-Torresdey, J. Impacts of copper oxide nanoparticles in bell pepper (Capsicum annum L.) plants: A full life cycle study. Environ. Sci. Nano 2017, 5, 83–95. [Google Scholar] [CrossRef]
- Trujillo-Reyes, J.; Majumdar, S.; Botez, C.E.; Peralta-Videa, J.R.; Gardea-Torresdey, J.L. Exposure studies of core-shell Fe/Fe3O4 and Cu/CuO NPs to lettuce (Lactuca sativa) plants: Are they a potential physiological and nutritional hazard? J. Hazard. Mater. 2014, 267, 263–455. [Google Scholar] [CrossRef] [PubMed]
- Andreotti, F.; Mucha, A.P.; Caetano, C.; Rodrigues, P.; Gomes, C.R.; Almeida, C.M.R. Interactions between salt marsh plants and Cu nanoparticles—Effects on metal uptake and phytoremediation processes. Ecotoxicol. Environ. Saf. 2015, 120, 303–309. [Google Scholar] [CrossRef] [PubMed]
- Ogunkunle, C.O.; Jimoh, M.A.; Asogwa, N.T.; Viswanathan, K.; Vishwakarma, V.; Fatoba, P.O. Effects of manufactured nano-copper on copper uptake, bioaccumulation and enzyme activities in cowpea grown on soil substrate. Ecotoxicol. Environ. Saf. 2018, 155, 86–93. [Google Scholar] [CrossRef] [PubMed]
- Deng, C.; Wang, Y.; Cota-Ruiz, K.; Reyes, A.; Sun, Y.; Peralta-Videa, J.; Hernandez-Viezcas, J.A.; Turley, R.S.; Niu, G.; Li, C.; et al. Bok choy (Brassica rapa) grown in copper oxide nanoparticles-amended soils exhibits toxicity in a phenotype-dependent manner: Translocation, biodistribution and nutritional disturbance. J. Hazard. Mater. 2020, 398, 122978. [Google Scholar] [CrossRef] [PubMed]
- Manusadžianas, L.; Caillet, C.; Fachetti, L.; Gylytė, B.; Grigutytė, R.; Jurkonienė, S.; Karitonas, R.; Sadauskas, K.; Thomas, F.; Vitkus, R.; et al. Toxicity of copper oxide nanoparticle suspensions to aquatic biota. Environ. Toxicol. Chem. 2012, 31, 108–114. [Google Scholar] [CrossRef] [PubMed]
- Shi, J.; Abid, A.D.; Kennedy, I.M.; Hristova, K.R.; Silk, W.K. To duckweeds (Landoltia punctata), nanoparticulate copper oxide is more inhibitory than the soluble copper in the bulk solution. Environ. Pollut. 2011, 159, 1277–1282. [Google Scholar] [CrossRef] [PubMed]
- Hong, J.; Rico, C.M.; Zhao, L.; Adeleye, A.S.; Keller, A.A.; Peralta-Videa, J.R.; Gardea Torresdey, J.L. Toxic effects of copper-based nanoparticles or compounds to lettuce (Lactuca sativa) and alfalfa (Medicago sativa). Environ. Sci. Process. Impact. 2015, 17, 177–185. [Google Scholar] [CrossRef] [PubMed]
- Albersheim, P.; Darvill, A.; Roberts, K.; Sederoff, R.; Staehelin, A. Plant Cell Walls: From Chemistry to Biology; Garland Science: New York, NY, USA, 2011. [Google Scholar]
- Navarro, E.; Baun, A.; Behra, R.; Hartmann, N.B.; Filser, J.; Miao, A.J.; Quigg, A.; Santschi, P.H.; Sigg, L. Environmental behavior and ecotoxicity of engineered nanoparticles to algae, plants, and fungi. Ecotoxicology 2008, 17, 372–386. [Google Scholar] [CrossRef]
- Navarro, E.; Piccapietra, F.; Wagner, B.; Marconi, F.; Kaegi, R.; Odzak, N.; Sigg, L.; Behra, R. Toxicity of silver nanoparticles to Chlamydomonas reinhardtii. Environ. Sci. Technol. 2008, 42, 8959–8964. [Google Scholar] [CrossRef]
- Kim, S.; Lee, S.; Lee, I. Alteration of phytotoxicity and oxidant stress potential by metal oxide nanoparticles in Cucumis sativus. Water Air Soil Poll. 2012, 223, 2799–2806. [Google Scholar] [CrossRef]
- Ross, K.A.; Brenza, T.M.; Binnebose, A.M.; Phanse, Y.; Kanthasamy, A.G.; Gendelman, H.E.; Salem, A.K.; Bartholomay, L.C.; Bellaire, B.H.; Narasimhan, B. Nano-enabled delivery of diverse payloads across complex biological barriers. J. Control. Release 2015, 219, 548–559. [Google Scholar] [CrossRef] [PubMed]
- Heinlein, M.; Epel, B.L. Macromolecular transport and signaling through plasmodesmata. Int. Rev. Cytol. 2004, 235, 93–164. [Google Scholar] [PubMed]
- Lucas, W.J.; Lee, J.Y. Plasmodesmata as a supracellular control network in plants. Nat. Rev. Mol. Cell Biol. 2004, 5, 712–726. [Google Scholar] [CrossRef] [PubMed]
- Microbe Notes. Plasmodesmata- Definition, Structure, Functions and Diagram. 2019. Available online: https://microbenotes.com/plasmodesmata-structure-and-functions/ (accessed on 6 September 2020).
- Shi, J.Y.; Peng, C.; Yang, Y.Q.; Yang, J.J.; Zhang, H.; Yuan, X.F.; Chen, Y.X.; Hu, T.D. Phytotoxicity and accumulation of copper oxide nanoparticles to the Cu-tolerant plant Elsholtzia splendens. Nanotoxicology 2014, 8, 179–188. [Google Scholar] [CrossRef]
- Wang, Z.; Xie, X.; Zhao, J.; Liu, X.; Feng, W.; White, J.C.; Xing, B. Xylem-and phloem-based transport of CuO nanoparticles in maize (Zea mays L.). Environ. Sci. Technol. 2012, 46, 4434–4441. [Google Scholar] [CrossRef] [PubMed]
- Dimkpa, C.O.; Singh, U.; Adisa, I.O.; Bindraban, P.S.; Elmer, W.H.; Gardea-Torresdey, J.L.; White, J.C. Effects of manganese nanoparticle exposure on nutrient acquisition in wheat (Triticum aestivum L.). Agronomy 2018, 8, 158. [Google Scholar] [CrossRef]
- Qiu, H.; Smolders, E. Nanospecific phytotoxicity of CuO nanoparticles in soils disappeared when bioavailability factors were considered. Environ. Sci. Technol. 2017, 51, 11976–11985. [Google Scholar] [CrossRef]
- Sekine, R.; Marzouk, E.R.; Khaksar, M.; Scheckel, K.G.; Stegemeier, J.P.; Lowry, G.V.; Donner, E.; Lombi, E. Aging of dissolved copper and copper-based nanoparticles in five different soils: Short-term kinetics vs. long-term fate. J. Environ. Qual. 2017, 46, 1198–1205. [Google Scholar] [CrossRef]
- Peretyazhko, T.S.; Zhang, Q.; Colvin, V.L. Size-controlled dissolution of silver nanoparticles at neutral and acidic pH conditions: Kinetics and size changes. Environ. Sci. Technol. 2014, 48, 11954–11961. [Google Scholar] [CrossRef]
- Zhou, W.; Liu, Y.L.; Stallworth, A.M.; Ye, C.; Lenhart, J.J. Effects of pH, electrolyte, humic acid, and light exposure on the long-term fate of silver nanoparticles. Environ. Sci. Technol. 2016, 50, 12214–12224. [Google Scholar] [CrossRef]
- Silva, T.U.; Pokhrel, L.R.; Dubey, B.; Tolaymat, T.M.; Maier, K.J.; Liu, X. Particle size, surface charge and concentration dependent ecotoxicity of three organo-coated silver nanoparticles: General linear model-predicted and observed toxicity. Sci. Total Environ. 2014, 468–469, 968–976. [Google Scholar] [CrossRef] [PubMed]
- Pokhrel, L.R.; Dubey, B.; Scheuerman, P.R. Impacts of select organic ligands on the colloidal stability, dissolution dynamics and toxicity of silver nanoparticles. Environ. Sci. Technol. 2013, 47, 12877–12885. [Google Scholar] [CrossRef] [PubMed]
- Pokhrel, L.R.; Dubey, B.; Scheuerman, P.R. Natural water chemistry (dissolved organic carbon, pH, and hardness) modulates colloidal stability, dissolution kinetics and antimicrobial activity of silver nanoparticles. Environ. Sci. Nano. 2014, 1, 45–54. [Google Scholar] [CrossRef]
- Dimkpa, C.O. Soil properties influence the response of terrestrial plants to metallic nanoparticles exposure. Curr. Opin. Environ. Sci. Health 2018, 6, 1–8. [Google Scholar] [CrossRef]
- U.S. Food and Drug Administration. Guidance for Industry: A Food Labeling guide (14. Appendix F: Calculate the Percent Daily Value for the Appropriate Nutrients). Center for Food Safety and Applied Nutrition. 2019. Available online: https://www.fda.gov/regulatory-information/search-fda-guidance-documents/guidance-industry-food-labeling-guide (accessed on 6 September 2020).
- U.S. Food and Drug Administration. Food Labeling: Revision of the Nutrition and Supplement Facts Labels and Serving Sizes of Foods That Can Reasonably Be Consumed At One Eating Occasion; Dual-Column Labeling; Updating, Modifying, and Establishing Certain Reference Amounts Customarily Consumed; Serving Size for Breath Mints; and Technical Amendments; Proposed Extension of Compliance Dates. 21 CFR 101; Docket Nos. FDA-2012-N-1210 and FDA-2004-N-0258. 2017. Available online: https://www.govinfo.gov/app/details/FR-2017-10-02/2017-21019 (accessed on 6 September 2020).
- De Camargo, A.C.; Favero, B.T.; Morzelle, M.C.; Franchin, M.; Alvarez-Parrilla, E.; de la Rosa, L.A.; Geraldi, M.V.; Maróstica Júnior, M.R.; Shahidi, F.; Schwember, A.R. Is chickpea a potential substitute for soybean? phenolic bioactives and potential health benefits. Int. J. Mol. Sci. 2019, 20, 2644. [Google Scholar] [CrossRef]


| Sample | S1 | S2 | S3 |
|---|---|---|---|
| Structure | Monoclinic | Monoclinic | Monoclinic |
| Space group | C2/c | C2/c | C2/c |
| Lattice parameters | |||
| a (Å) | 4.68369 | 4.68678 | 4.68469 |
| b (Å) | 3.42223 | 3.42659 | 3.42223 |
| c (Å) | 5.12774 | 5.13265 | 5.12964 |
| α (°) | 90.00 | 90.00 | 90.00 |
| β (°) | 99.37073 | 99.4 | 99.49814 |
| γ (°) | 90.00 | 90.00 | 90.00 |
| Unit cell Volume (Å)3 | 81.094 | 81.321 | 81.111 |
| Particle size (nm) | 25 | 50 | 250 |
| Reliability factors | |||
| Weighted profile factor (Rwp) | 13.3 | 12.1 | 12.9 |
| Profile factor (Rp) | 16.1 | 14.7 | 17.4 |
| Expected R-factor (Rexp) | 10.41 | 9.78 | 10.87 |
| Bragg R-factor (RBragg) | 1.65 | 1.29 | 1.10 |
| R-factor (RF) | 1.16 | 1.01 | 0.843 |
| Chi squared (χ2) | 1.85 | 1.80 | 1.90 |
| Source of Variation | Root Dry Weight | Root Length | Root Volume | Root Area | Root Density | |
|---|---|---|---|---|---|---|
| Copper compounds type (Cutype) | MS | 7.48 | 128.74 | 87.02 | 1315 | 0.0053 |
| df | 3 | 3 | 3 | 3 | 3 | |
| F | 32.54 | 28.77 | 12.66 | 31.40 | 8.93 | |
| P | <0.0001 | <0.0001 | <0.0001 | <0.0001 | 0.0001 | |
| Compounds concentration (C) | MS | 21.23 | 366 | 294.7 | 4046 | 0.0096 |
| df | 4 | 4 | 4 | 4 | 4 | |
| F | 92.27 | 81.79 | 42.87 | 96.60 | 16.27 | |
| p | <0.0001 | <0.0001 | <0.0001 | <0.0001 | <0.0001 | |
| Cutype × C | MS | 0.55 | 14.28 | 13.39 | 155.2 | 0.0005 |
| df | 12 | 12 | 12 | 12 | 12 | |
| F | 2.40 | 3.19 | 1.95 | 3.71 | 0.95 | |
| p | 0.0188 | 0.0028 | 0.0572 | 0.0009 | 0.5139 |
| Concentration (mg/kg soil) | Mean Root Dry Weight (g/plant) | Mean Root Length (cm) | ||||||
| CuONPs | CuCl2 | CuONPs | CuCl2 | |||||
| 25 nm | 50 nm | 250 nm | 25 nm | 50 nm | 250 nm | |||
| 0 | 5.45 a | 5.45 a | 5.45 a | 5.45 a | 38.60 a | 38.60 a | 38.60 a | 38.60 a |
| 50 | 3.02 f | 4.08 bc | 4.42 bc | 4.81 ab | 34.22 bc | 34.22 bc | 35.16 abc | 37.83 a |
| 100 | 2.20 ghi | 3.27 def | 4.02 bcd | 4.30 bc | 26.50 ef | 32.53 cd | 34.01 bc | 37 ab |
| 200 | 1.53 ij | 2.63 fgh | 2.99 fg | 3.83 cde | 22.50 g | 26.50 ef | 29.83 de | 32.33 cd |
| 500 | 0.94 j | 1.67 ij | 2.05 hi | 3.16 ef | 18.83 h | 25.03 fg | 26.05 f | 30 d |
| Parameters | R-Squared | |||
| CuONP–25 nm | CuONP–50 nm | CuONP–250 nm | CuCl2 | |
| Root dry weight | 0.60 (NL) | 0.78 (L) | 0.87 (L) | 0.85 (L) |
| Root length | 0.75 (L) | 0.76 (L) | 0.89 (L) | 0.88 (L) |
| Root volume | 0.68 (L) | 0.65 (L) | 0.43 (NL) | 0.67 (L) |
| Root area | 0.72(L) | 0.71 (L) | 0.72 (L) | 0.84 (L) |
| Root Cu uptake | 0.64 (NL) | 0.90 (L) | 0.97 (L) | 0.99 (L) |
| Stem Cu uptake | 0.96 (L) | 0.90 (L) | 0.85 (L) | 0.79 (L) |
| Leaf Cu uptake | 0.55 (NL) | 0.74 (L) | 0.87 (L) | 0.72 (L) |
| Seed Cu uptake | 0.85 (L) | 0.87 (L) | 0.89 (L) | 0.90 (L) |
| Concentration (mg/kg) | Mean Root Volume (cm3) | Mean Root Area (cm2) | ||||||
| CuONPs | CuCl2 | CuONPs | CuCl2 | |||||
| 25 | 50 | 250 | 25 | 50 | 250 | |||
| 0 | 33.34 a | 33.34 a | 33.34 a | 33.34 a | 126.94 a | 126.94 a | 126.94 a | 126.94 a |
| 50 | 28.16 bc | 28.66 bc | 28.83 bc | 30.83 ab | 110.01 c | 110.89 bc | 112.84 bc | 121 ab |
| 100 | 22.66 efg | 23.33 defg | 25.16 cdef | 27.50 bcd | 86.73 fgh | 97.44 de | 103.45 cd | 112.98 bc |
| 200 | 17 hi | 21 fgh | 25 cdef | 27.16 bcd | 69.27 ij | 83.60 gh | 96.70 def | 104.95 cd |
| 500 | 16 i | 19.33 ghi | 24.83 cdef | 25.48 cde | 61.21 j | 77.96 hi | 90.13 efg | 97.86 de |
| Experimental | Cu Concentration in Chickpea Seeds (µg Cu/100 g Seed) | Fold (×) Higher than Chickpea Seed Cu Concentration (per Serving of ½ Cup) | Recommended Dietary Allowances (RDA) for Cu Intake for Adults and Children Aged 4 Years and Older (µg) | % Daily Values (DV) * | World’s Healthiest Foods Rating # | Food Items that Provide Lower Cu than Our Soybean Seeds £ | |||
|---|---|---|---|---|---|---|---|---|---|
| Treatment Types | Concentration Applied (mg CuONPs/kg Soil) | Mg Total Cu/kg Soybean Seed | µg Total Cu/100 g Soybean Seed | ||||||
| CuONPs-25 nm | 50 | 4.28 | 428 | 289 | ×1.48 | 900 | 47.5 | Good | Atlantic salmon (wild, cooked), avocado, asparagus, cream of wheat, dried figs, ground turkey, Greek yogurt, non-fat milk, pasta, sesame seeds, whole wheat |
| 100 | 5.00 | 500 | ×1.73 | 55.5 | Very Good | ||||
| 200 | 5.80 | 580 | ×2.00 | 64.4 | Very Good | ||||
| 500 | 6.55 | 655 | ×2.30 | 73.0 | Very Good | ||||
| CuONPs-50 nm | 50 | 4.11 | 411 | ×1.42 | 45.6 | Good | |||
| 100 | 4.74 | 474 | ×1.64 | 53.0 | Very Good | ||||
| 200 | 5.48 | 548 | ×1.90 | 61.0 | Very Good | ||||
| 500 | 6.21 | 621 | ×2.15 | 69.0 | Very Good | ||||
| CuONPs-250 nm | 50 | 3.94 | 394 | ×1.36 | 44.0 | Good | |||
| 100 | 4.4 | 440 | ×1.52 | 49.0 | Good | ||||
| 200 | 5.19 | 519 | ×1.80 | 58.0 | Very Good | ||||
| 500 | 5.81 | 581 | ×2.01 | 65.0 | Very Good | ||||
| CuCl2 | 50 | 3.98 | 398 | ×1.38 | 44.2 | Good | |||
| 100 | 4.41 | 441 | ×1.53 | 49.0 | Good | ||||
| 200 | 5.31 | 531 | ×1.84 | 59.0 | Very Good | ||||
| 500 | 6.03 | 603 | ×2.10 | 67.0 | Very Good | ||||
| Control | 0 | 3.62 | 362 | ×1.25 | 40.2 | Good | |||
© 2020 by the authors. Licensee MDPI, Basel, Switzerland. This article is an open access article distributed under the terms and conditions of the Creative Commons Attribution (CC BY) license (http://creativecommons.org/licenses/by/4.0/).
Share and Cite
Yusefi-Tanha, E.; Fallah, S.; Rostamnejadi, A.; Pokhrel, L.R. Root System Architecture, Copper Uptake and Tissue Distribution in Soybean (Glycine max (L.) Merr.) Grown in Copper Oxide Nanoparticle (CuONP)-Amended Soil and Implications for Human Nutrition. Plants 2020, 9, 1326. https://doi.org/10.3390/plants9101326
Yusefi-Tanha E, Fallah S, Rostamnejadi A, Pokhrel LR. Root System Architecture, Copper Uptake and Tissue Distribution in Soybean (Glycine max (L.) Merr.) Grown in Copper Oxide Nanoparticle (CuONP)-Amended Soil and Implications for Human Nutrition. Plants. 2020; 9(10):1326. https://doi.org/10.3390/plants9101326
Chicago/Turabian StyleYusefi-Tanha, Elham, Sina Fallah, Ali Rostamnejadi, and Lok Raj Pokhrel. 2020. "Root System Architecture, Copper Uptake and Tissue Distribution in Soybean (Glycine max (L.) Merr.) Grown in Copper Oxide Nanoparticle (CuONP)-Amended Soil and Implications for Human Nutrition" Plants 9, no. 10: 1326. https://doi.org/10.3390/plants9101326
APA StyleYusefi-Tanha, E., Fallah, S., Rostamnejadi, A., & Pokhrel, L. R. (2020). Root System Architecture, Copper Uptake and Tissue Distribution in Soybean (Glycine max (L.) Merr.) Grown in Copper Oxide Nanoparticle (CuONP)-Amended Soil and Implications for Human Nutrition. Plants, 9(10), 1326. https://doi.org/10.3390/plants9101326