Abstract
Volunteered Geographic Information (VGI) is geographic data obtained from voluntary contributions of individual contributors on social media and non-social media platforms, where contributors exhibit diverse interests and behavior patterns. While studies have found that the COVID-19 pandemic has influenced VGI contributor behavior on social media platforms (Facebook, X, and Instagram, etc.), less is known about contribution behaviors on non-social media VGI platforms such as OpenStreetMap (OSM). This study investigates how individual OSM contributors’ data contribution behaviors changed after the COVID-19 outbreak, using New York City as a case study. Metrics quantifying temporal, spatial, thematic, participation, and social interaction aspects of contribution behavior were developed to characterize individual-level contribution behaviors in both the pre- and post-COVID periods (2016–2019 and 2020–2023, respectively). Contributors were clustered into three groups based on pre-COVID behavioral patterns (as reflected by the metrics) using the K-Means algorithm. The resulting model was then applied to identify changes in contributors’ cluster memberships in the post-COVID period. Results reveal differences in contribution behaviors between the two time periods. Compared to pre-COVID contributors, post-COVID contributors, on average, showed stronger contribution engagement, including longer lifespans, larger spatial extent of edits, higher contribution volumes, a greater emphasis on modification over creation, and stronger co-editing network interactions. Healthcare amenity-related edits remained a small fraction of total contributions across both periods and all clusters. Contributors participating in data contribution in both time periods generally increased data contribution engagement after the COVID outbreak, characterized by longer lifespans, broader spatial coverage, more balanced creation and modification, and stronger network centrality. These findings highlight changes in individual contribution behavior under COVID-19 and exhibits the value of examining VGI contribution at the individual level.
1. Introduction
Volunteered Geographic Information (VGI) refers to crowdsourced geographic information obtained through the voluntary contribution from individual contributors [1,2]. VGI contributions can occur on social media platforms (e.g., X, Facebook, Weibo) or non-social media platforms (e.g., iNaturalist, ebird, OpenStreetMap) [3]. VGI contributors’ data contribution behaviors reflect personal interests and unique contribution patterns, which in turn influence the overall quality and usability of VGI data [4,5,6]. Previous studies suggest that the COVID-19 pandemic has influenced the behavior of individual contributors to social media VGI [7,8,9], yet how contribution behaviors on the most prominent non-social media VGI project, OpenStreetMap (OSM) [10], changed during the pandemic remained underexplored. Furthermore, existing analyses of VGI data contribution behavior have predominantly focused on aggregated, platform-level contributions rather than the individual contributor level. Investigating VGI contribution patterns at the level of individual contributors is essential, as it captures the heterogeneity of behaviors and provides deeper insights into how collective contributions of individual contributors shape the overall quality of VGI datasets.
To bridge this research gap, this study examines how individual OSM contributors’ behaviors have changed after the COVID-19 pandemic outbreak. Individual contributors’ contribution behavior was quantified through metrics reflecting temporal, spatial, thematic, participation, and social interaction characteristics, enabling identification of individual data contribution patterns in New York City (NYC) over an eight-year period (2016–2023). NYC was selected due to the significant impact of COVID-19 and the potential diversity of OSM data contribution behaviors. Contributions in the post-COVID period (2020–2023) were compared with pre-COVID period (2016–2019) contributions to identify behavioral changes at the individual level.
This study contributes to a more comprehensive understanding of changes in individual VGI contributors’ data contribution behaviors under global public health crises. Using OSM under the COVID-19 pandemic as a case study, this research investigates how individual contributors’ mapping behaviors changed after the pandemic outbreak. Individual-level metrics characterizing data contribution behavior across temporal, spatial, thematic, participation, and social dimensions were generated, enabling a detailed analysis of behavioral changes. Assessing contribution behaviors at the individual level provides fine-grained insights into personal engagement, advancing understanding of resilience and dynamics of VGI platforms.
2. Related Works
VGI data contribution behavior is highly personal, with data uploaded based on individual (personal) interests [4,5,6]. Contributions may take the form of voluntary posts containing geographic information on social media platforms (e.g., X, Facebook, Weibo), observations with geographic locations on citizen science platforms (e.g., iNaturalist, ebird), or contributions to open-source geographic projects (e.g., OSM). Voluntary VGI contributions are often motivated by self-expression, personal interest, and the personal satisfaction of generating knowledge for the public [3,11,12]. Contributors exhibit diverse behavior patterns, which in turn influence the quality of VGI databases [13,14,15]. Additionally, individual contribution behaviors can be affected by special occasions, including natural disasters, political events, and public health crises [16,17,18].
Social media VGI has been the most studied in terms of individual contribution behavior. Previous studies suggest that social media data contribution is motivated by personal interest and shaped by interactions on social media platforms. People post to express affection, convey negative feelings, gain recognition, seek entertainment, or fulfill cognitive needs [19,20,21]. Social media posts often include information about the contributor, with personality traits manifested through content and profile pictures, and models have been developed to predict users’ personalities for psychological studies [22,23,24]. Distinctive characteristics also exist among social media users. Gender differences are observed in posted content, with men showing greater emotional instability and lower desire for social support compared to women [25,26]. Adolescents use social media more frequently, which is positively associated with self-reported fear of missing out and loneliness [27,28]. Culture differences among social media users have also been documented [29,30].
Data contributions to non-social media VGI, such as citizen science platforms (e.g., iNaturalist), also present individuality. Contributions are motivated by personal interests reinforced by the sense of achievement [31,32]. Contributors with professional knowledge tend to generate data of higher quality and greater quantity [14,15,33]. Demographic factors, including culture and age, are associated with distinct characteristics of data contribution. Contributors with different value orientations also engage with others in varying ways [34], and younger contributors are generally more active and more interested in contributing data [35,36].
In the case of OSM, both the number of contributors and their mapping behavior directly affect data quality. Early studies have found that data quality is generally higher when more contributors participate in data contribution [13]. Although an increasing number of contributors have registered on the OSM platform [37], most only participated in data contribution for a short period of time [38,39], and the types of OSM map objects (e.g., node, ways, or relations) they edit generally remain consistent throughout their contribution lifespan [40]. Contributors rarely add descriptions to OSM map objects [41], and when they do, these descriptions often do not comply with platform guidelines [42]. The majority of contributors focus on the densification of data rather than creating new objects in less-mapped areas [43,44]. Contributors with larger volumes of data contributions typically engage in modifications and create new OSM map objects [45], making more detailed contributions [46], and are more likely to participate in updating dispute-related objects [47]. Contributors participating in dispute-related contributions are also more active [47]. The spatial extent of OSM objects contributed by an individual contributor is usually within 50 square kilometers [48], with more detailed contributions occurring near the contributors’ actual residence [49]. Large-scale analyses also reveal spatial biases of OSM building data across global urban areas and highlight inequalities in data quality worldwide [50]. Consequently, European countries, which have a larger number of OSM contributors and more intensive land areas, tend to exhibit higher data quality compared to other regions [51].
The demographic background of OSM contributors also influences data quality [52]. Contributors with higher levels of participation are generally those with professional GIS (geographic information system) skills [53], and those who provide higher-quality OSM data tend to be well-educated, urban young adults [54]. Data quality is not related to the demographics of the mapped areas [55]; however, contributor gender does affect OSM data quality. The uneven representation of male and female contributors often introduces biases into the VGI database [56]. For example, female and male contributors tend to focus on different types of OSM objects, and male contributors are more likely to engage in modifications and tagging [57].
These studies show that demographic background, personal experiences, and individual contribution patterns all shape what is contributed to the VGI database and how contributions are made, which in turn affects the quality and usability of VGI data. The outbreak of the COVID-19 pandemic has had a profound impact on human behavior, altering how people interact with technology, society, and the economy. Research has documented an accelerated reliance on digital technologies [58], as well as exacerbated social inequalities and economic vulnerabilities [59]. In addition, local governments worldwide implemented restrictive measures, such as lockdowns during the early phase of the pandemic [60], which transformed daily urban life and influenced individual behavior under the fear of infection [61,62].
The impact of COVID-19 on everyday life introduced new personal experiences that influence the online data contribution behavior of VGI contributors. Social media contributors expressed anxiety and sometimes spread misinformation in their posts, amplifying stress and negative sentiments across social media platforms [9,63,64,65]. Contributors to citizen science VGI platforms also changed their contribution behavior. For instance, increased species observations were generally observed on biodiversity-themed citizen science platforms [66], while participants and the number of observations in iNaturalist City Nature Challenges decreased, with observations becoming more spatially dispersed [67].
Studies at the intersection of the COVID-19 pandemic and OSM have primarily focused on platform-level responses, aggregated contribution patterns, and data usage. During the early stages of the pandemic, OSM was widely used as a base map to support COVID-19 crisis responses [68,69], as well as studies of behavior change under the pandemic [70], and as a navigation tool designed to avoid exposure to contaminated areas [71]. With respect to OSM data contributions, prior research suggests that female contributors tend to increase their level of data contribution, while male contributors show less pronounced changes after the COVID-19 outbreak [72]. The OSM contributor community acts as a boost for increased contributions under the stimulation of COVID-19. Short-term increases in new OSM data and newly registered contributors were documented [73,74], largely driven by the Humanitarian OpenStreetMap Team (HOT) and organized mapping campaigns [73].
However, there are insufficient studies examining how the OSM platform was affected by the COVID-19 outbreak, and few studies have focused on individual-level VGI data contribution behavior. Many studies have relied on social media VGI data (e.g., geotagged tweets) to extract information about human behavior during the pandemic [63,65,75], while very few have investigated how contribution behaviors on non-social media VGI platforms changed after the pandemic outbreak. Additional research using VGI sources beyond social media is needed to better understand whether the pandemic influenced VGI data contributions and to produce less biased insights into the relationship between the pandemic and VGI. Moreover, VGI data contribution is highly personalized. Existing studies have largely focused on aggregated statistics of VGI contributors, overlooking individual contribution characteristics. Analyses at the individual level could reveal the “narrative” of individual contributors in quantitative analyses, linking individual contribution behavior to the overall quality of the VGI dataset and offering novel insights into how individual behavior shapes VGI data quality.
Therefore, this study analyzes the data contribution behavior of OSM contributors at the individual level during both the pre- and post-COVID periods to investigate how VGI contribution behavior may have changed under public health crises. The specific research questions are as follows: (1) Are there any significant differences in overall OSM contributors’ data contribution patterns between the pre- and post-COVID periods? (2) For contributors who participated in OSM data contribution in both time periods, did their data contribution behaviors change?
3. Materials and Methods
3.1. Data and Study Area
OSM history data were gathered from the Geofabrik Download Server (https://osm-internal.download.geofabrik.de/index.html, accessed on 13 August 2025). The data were clipped using the bounding box of the study area, imported into a PostgreSQL/PostGIS database, and then further filtered using the study area boundary. The study period spans from 1 January 2016 to 31 December 2023, and was divided into the pre-COVID period (1 January 2016 to 31 December 2019) and the post-COVID period (1 January 2020 to 31 December 2023). Although the first confirmed case of COVID-19 in NYC occurred on 5 March 2020 [76], 1 January 2020 is used as the temporal dividing point between the pre- and post-COVID-19 periods.
NYC was selected as the study area (Figure 1). Its global influence, cultural diversity, and high population density, which is associated with an elevated risk of infection, imply an OSM database with relatively high quality that may have been influenced by COVID-19. NYC has a population of more than 8.8 million residents within an area of 300.4 square miles [77]. As a global economic center, NYC attracts substantial domestic and international migration for investment, employment, and tourism [78]. Its high population density makes it more vulnerable to COVID-19 infections, while its economic strength indicates better OSM data quality. Previous studies have indicated inequalities in OSM data quality [50], with economically developed regions generally exhibiting more complete and higher-quality datasets [79]. Therefore, NYC is expected to have a larger and more diverse group of OSM contributors than other US cities, leading to greater activity (e.g., higher frequency of edits) and greater variation (e.g., places with diverse functions) in OSM data contributions.
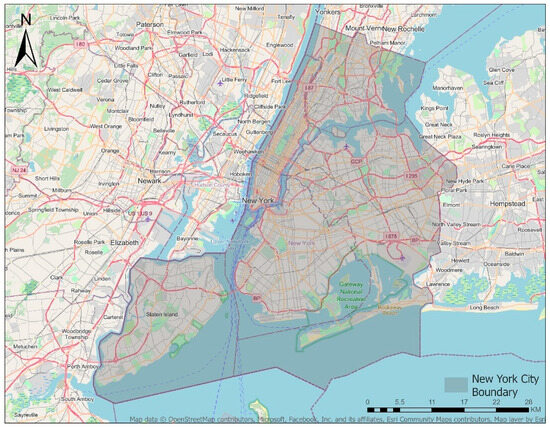
Figure 1.
Study area.
COVID-19 has had a substantial impact on NYC. According to COVID-19 data from the Center for Systems Science and Engineering at Johns Hopkins University [76] (aggregated by calendar week and shown in Figure 2), there was a high rise in COVID-19 death cases during the second quarter of 2020 and a sharp increase in confirmed cases during late 2021 and early 2022. The first confirmed cases appeared on 5 March 2020, with 2 cases reported, and the first case of death was reported on 11 March 2020. Shortly after these dates, weekly confirmed and death cases began to increase rapidly.
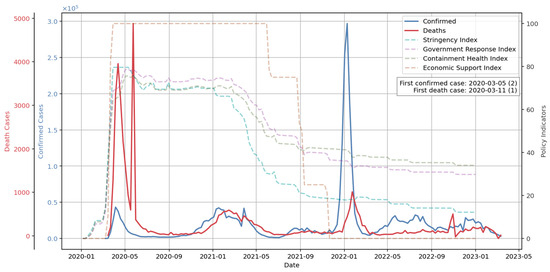
Figure 2.
Weekly (calendar week) new confirmed and death COVID-19 cases in NYC, and weekly (calendar week) average New York State policy indexes. Blue line and y-axis in blue represent the number of confirmed cases. Red line and y-axis in red represent the number of death cases. Dash lines and y-axis on the right represent the policy indexes.
In response to the increasing number of COVID-19 cases, NYC and New York State have implemented a series of disease control and economic support policies. Figure 2 also presents state-wide policy indexes from the Oxford COVID-19 Government Response Tracker [80]. Beginning in early 2020, several state-wide policies were introduced prior to the first confirmed and death cases in NYC. Following the emergence of confirmed and death cases in NYC, all policy indexes increased, suggesting a rise in concern and increasingly intensive public health responses. These policy indexes remained at relatively high levels for approximately one year, reflecting stringency policies, government responses, containment health policies, and economic supports are rapid before gradually declining after early 2021.
These developments influenced human behavior in NYC in multiple ways. Changes in contribution behavior are therefore expected to be more pronounced in NYC than in other US cities, given the high numbers of confirmed and fatal COVID-19 cases. Human mobility declined due to the stay-at-home orders [81]. Restaurants were closed during the pandemic [82], and interpersonal distances between pedestrians increased [83]. Although OSM contributors were not required to be outdoors to make edits, contributors may have made more edits while staying at home. Additionally, given NYC’s global prominence and the large number of COVID-19 cases, it is possible that OSM contributors outside the region paid increased attention to NYC during the pandemic.
3.2. Methods
Contribution patterns of individual contributors were measured using metrics characterizing temporal, spatial, thematic, participation and social aspects of contribution. Based on these metrics, individual contributors with similar contribution patterns in the pre-COVID period were clustered into groups using the K-Means algorithm. The contribution pattern characteristics of these clusters were visualized using the metric values of each cluster centroid to illustrate the typical profile of the cluster. The K-Means clustering model was then applied to classify contributors in the post-COVID-19 period. The cluster memberships of individual contributors in the pre- and post-COVID-19 periods were compared to examine changes in contribution patterns after the COVID-19 outbreak.
3.2.1. Metrics Characterizing Contribution
Table 1 presents the metrics used to quantify individual contributors’ behavior. These metrics capture contribution behavior from temporal, spatial, thematic, and participation perspectives. Temporal metrics assess how long and how frequently individual contributors engage in data contribution [36,84,85]. Spatial metrics quantify the area of contribution using the standard distance [86]. Thematic metrics focus on healthcare-specific contributions made by individual contributors. Participation metrics evaluate the quantity and type of contributions (creation or modification) made by each contributor, and indicate engagement status in pre- and post-COVID-19 periods (contributions made in only one period or both periods) [87]. Social metrics measure the co-editing interaction centrality and connectivity of individual contributors [88,89].

Table 1.
Metrics characterizing OSM contributors’ data contribution patterns.
Temporal metrics include lifespan, frequency of activeness, and mean of gap days, capturing participation along the temporal dimension. Lifespan measures the number of days between a contributor’s first and last day of data contribution, indicating the duration of engagement with contribution. Active days measures the total number of days a contributor made any contributions, while frequency of activeness measures the proportion of days with contributions relative to the whole lifespan. The mean of consecutive days without any data contribution between two active days is also included to capture periods of inactivity.
The spatial metric measures the standard distance (in km) of the centroid of all OSM map objects edited by each contributor [86]. Standard distance is calculated with Formula (1), where and are the coordinates of each contribution, and and are the mean coordinates. For polygon and line (OSM way) objects, centroids are used for calculation.
Thematic metrics measure the number of healthcare amenity edits. Both the total count and the percentage of healthcare amenity edits among contributors’ total contributions are calculated. OSM objects tagged as hospital, clinic, dentist, doctors, and pharmacy are considered healthcare amenities in this study, according to the OSM Wiki Healthcare page (https://wiki.openstreetmap.org/wiki/Healthcare, accessed on 17 October 2025).
Participation metrics measure how contributors engage in data contribution. Total contribution counts the number of edits made by a contributor over the pre- or post-COVID-19 period, reflecting overall activeness. Action measures the number and percentage of created and modified objects, as well as the proportion of creations and modifications among total contributions. Any contribution associated with an OSM object whose version equals 1 is considered a creation. Otherwise, it is counted as a modification. Engagement status is a categorical attribute indicating whether a contributor is new, quit, or stayed after the COVID-19 outbreak [87]. New contributors only participated in data contribution in the post-COVID-19 period but not in the pre-COVID-19 period. Quit contributors, by contrast, contributed only in the pre-COVID-19 period. Stay contributors participated in both time periods.
Social metrics were generated using the NetworkX (version 3.4.2) Python package [90] based on the co-editing network. Contributors who edited the same map object are considered to have co-editing interactions. Each node in the co-editing network represents a contributor, and each edge represents co-editing interactions between a pair of contributors.
Degree measures the number of other contributors with whom a contributor has co-editing interactions, with higher values indicating more interactions with other contributors. Betweenness measures the importance of a node (contributor) in controlling the information flow within the co-editing network. For node v in the set of nodes V, betweenness is calculated using Formula (2), where is the number of shortest paths between node s and t, and is the number of s-t shortest paths passing through node v. Higher betweenness values represent greater importance of node v in the co-editing network.
Closeness measures how close a node (contributor) is to other nodes in the network [89]. The closeness of a node u is calculated using Formula (3), where n − 1 is the number of all reachable nodes from u, and is the shortest path distance between node v and u. A higher closeness value indicates that the node can reach to other nodes more quickly, reflecting greater efficiency in information flow within the network.
Since these metrics were computed for each contributor, histograms were generated for each metric to show their distributions. Permutation tests were conducted to compare the difference in mean values between the pre- and post-COVID-19 metrics. The permutation test also allows detection of changes in data contribution patterns while making no assumptions about the underlying distributions. In addition, Cohen’s d [91] was calculated to quantify the effect size of these changes, providing a standardized measure of the magnitude of differences in data contribution behavior between the two time periods.
3.2.2. Clustering Contribution Patterns
The metrics described above were later used in clustering analysis to identify groups of contributors with similar contribution patterns. A cross-correlation matrix was generated for all metrics computed in the pre-COVID-19 period to explore pair-wise correlations among the metrics. Metrics with a correlation coefficient larger than 0.8 were removed, keeping only one of the two highly correlated metrics for the cluster.
Based on these metrics, the K-Means algorithm was applied using the scikit-learn (version 1.7.1) Python package [92] to cluster contributors who participated in OSM data contribution in the pre-COVID period. K-Means was chosen over alternative methods because it efficiently handles large datasets and provides easily interpretable cluster centroids, which are important for understanding typical contribution patterns. Because K-Means is distance-based and sensitive to the scale of each metric, the metrics were scaled using a max–min scaler, where the minimum and maximum of each metric were determined from values computed across both the pre- and post-COVID-19 periods. Metrics with large value ranges were log-transformed before scaling. Contributors representing isolated nodes in the co-editing network were excluded from clustering.
The optimal number of clusters for K-Means was selected based on a combination of the Silhouette score [93], Davies–Bouldin score [94], and the elbow method. The best K-Means model was fitted on metrics of pre-COVID-19 contributors. Each contributor was then assigned a cluster group number, and the centroids of the clusters were visualized in radar graphs to represent the ‘average’ data contribution pattern of each group.
The fitted K-Means model was also applied to classify contributors in the post-COVID-19 period. Each contributor was assigned to a cluster group based on their contribution patterns as measured by the metrics. The cluster membership of contributors who were new (contributed only in the post-COVID-19 period), quit (contributed only in the pre-COVID-19 period), or stayed (contributed in both time periods) were compared, based on the number of contributors in each engagement status within each cluster. For stay contributors, cluster memberships in the pre- and post-COVID-19 periods were compared to identify changes in contribution patterns after the COVID-19 outbreak.
4. Results
4.1. Changes in the Metrics
4.1.1. Temporal Metrics
Frequency distributions of the temporal metrics and permutation test results on the difference in the mean values of the metrics between the pre- and post-COVID-19 periods are shown in Figure 3. In both periods, lifespan, active days, and the mean of gap days all show long-tail distributions, where there are only very few large values and most values are low. This indicates that most OSM contributors only contributed data for a very short period of time. Lifespan and active days are generally low, with medians of only 1. Mean gap days are also generally low, with a median of 0. Meanwhile, frequency values are high, with mean values of 0.727 and 0.628 in the pre- and post-COVID-19 periods, respectively. There is also a high count of contributors with frequency values near 1 (i.e., contributing data on every day within their lifespan). Overall, most contributors only participated in data contributions for a few days (i.e., short lifespan), but were active on most of these days and then left the OSM platform without returning for data contribution.
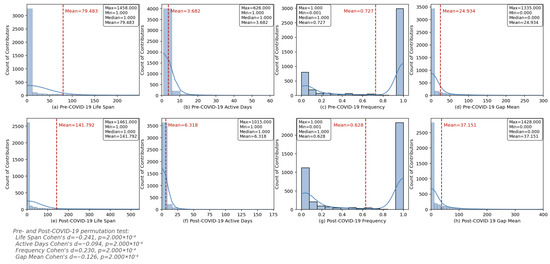
Figure 3.
Frequency distribution of the temporal metrics in the pre- and post-COVID-19 periods. (a,e) Lifespan; (b,f) number of active days; (c,g) frequency of activeness; (d,h) mean of gap days.
The means of these temporal metrics in the post-COVID-19 period are all statistically significantly different from those in the post-COVID-19 period based on a permutation test. However, the corresponding effect sizes (Cohen’s d) are generally small, indicating that the observed changes represent a modest shift in average behavior. The mean of these metrics increased after the COVID-19 outbreak, except for the frequency of activeness, of which the mean slightly decreased from 0.727 to 0.628. On average, contributors participating in the post-COVID-19 period had longer lifespans, more active days, and more gap days between two consecutive active days. They also had a lower frequency of activeness, suggesting that although they stayed for data contribution for a longer period of time and were active on more days, the proportion of active days within their lifespan (i.e., frequency) decreased in the post-COVID-19 period relative to the pre-COVID-19 period.
The temporal metrics indicate that most OSM contributors have intensive engagement in data contribution for a short period of time, while they are more casual (more gap days and low frequency) in data contribution over a longer time span after the COVID-19 outbreak. Before the COVID-19 outbreak, contributors only participated in data contribution for a short lifespan, with few active days, a few gap days, and a high frequency of activeness. It suggests that contributors have concentrated engagement within a short period of time. In contrast, contributors in the post-COVID-19 period generally exhibited longer lifespans and more active days, but also more gap days, resulting in lower overall contribution frequency. This pattern suggests a modest shift toward more casual data contribution behavior within contributors’ lifespans.
4.1.2. Spatial Metrics
Standard distance measures the spatial spread of all edits made by a contributor. Figure 4 is the frequency distribution of the standard distance (in km) of OSM contributors in the pre- and post-COVID-19 periods.
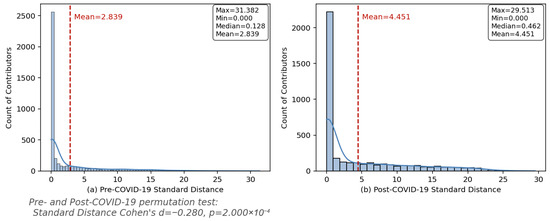
Figure 4.
Frequency distribution of the standard distance of OSM contributors’ edits in the pre- and post-COVID-19 periods. (a) Pre-COVID standard distance; (b) post-COVID standard distance.
Similarly to the distribution of temporal metrics, the standard distances of edits also show long-tail distributions, with a maximum around 30 km and medians below 1 km in both periods. The median standard distance increased slightly from 0.128 km pre-COVID-19 to 0.462 km post-COVID-19. The permutation test suggests a statistically significant increase in the average edit standard distance, from 2.839 km to 4.451 km, with a moderate effect size. These results suggest that, although contributors generally make edits within small areas, they expanded the spatial extent of their edits after the COVID-19 outbreak. Overall, spatial metrics confirm that contributors in the post-COVID-19 period had larger average and median contribution standard distances compared to the pre-COVID-19 period.
4.1.3. Thematic Metrics
Thematic metrics measure the volume of healthcare amenity contributions and their proportion among total contribution. Figure 5 shows the distribution of thematic metrics and the comparison of mean differences between pre- and post-COVID-19 periods. Figure 6 shows the healthcare contribution and contributor proportions in the two periods.
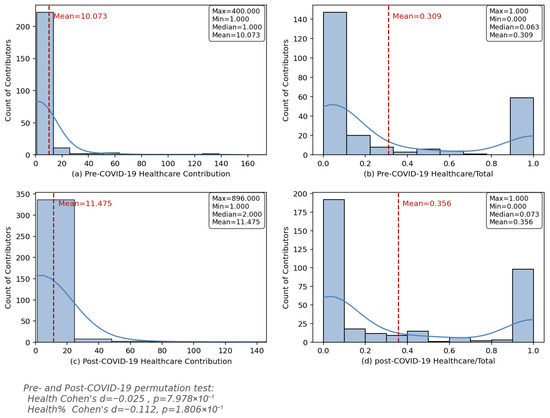
Figure 5.
Frequency distribution of the thematic metrics in the pre- and post-COVID-19 period. (a,c) Volume of healthcare amenity edits for individual contributors; (b,d) percentage of healthcare amenity edits among total edits for individual contributors.
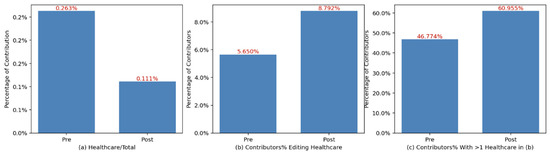
Figure 6.
Healthcare contribution and contributor proportion. (a) Percentage of healthcare amenity edits among total edits contributed by all contributors; (b) percentage of contributors who made healthcare amenity edits among all contributors; (c) percentage of contributors making more than one healthcare edit among all contributors who made healthcare amenity edits.
Healthcare amenity contributions are quantified as the proportion of healthcare-related edits among total contributions, calculated only for contributors with at least one healthcare contribution. For these contributors, healthcare edits exhibit a bi-modal distribution (Figure 5b,d), with individuals contributing either exclusively to healthcare amenities or only minimally. The median healthcare edits proportion is 0.063% pre-COVID-19 and 0.073% post-COVID-19, suggesting that healthcare amenities contributions represent a very small fraction of total contributions. Considering all contributors (regardless of whether they contributed healthcare amenity-related edits), the mean proportion of healthcare edits increased from 30.9% to 35.6% after the COVID-19 outbreak. However, this difference is not statistically significant, suggesting that contributors in general did not significantly change their focus on editing healthcare amenities in the post-COVID-19 period.
Among contributors with at least one healthcare amenity-related edit, the absolute number of healthcare edits increased in the post-COVID-19 period (Figure 5c,d). However, due to a larger increase in total edits, the mean proportion of healthcare edits among total edits decreased from 0.263% pre-COVID-19 to 0.111% post-COVID-19 (Figure 6a). Nonetheless, a larger proportion of contributors edited healthcare amenities in the post-COVID-19 period (8.792%) compared to the pre-COVID-19 period (5.65%) (Figure 6b). Furthermore, among contributors who made at least one healthcare edit, a higher percentage contributed more than one healthcare-related edit post-COVID-19 (60.955%) than pre-COVID-19 (46.774%). Overall, these results suggest that the observed decrease in the proportion of healthcare edits relative to total edits is not due to reduced attention on healthcare amenities. On the contrary, contributors who edited healthcare amenities became more actively engaged in these contributions in the post-COVID-19 period.
Thematic metrics indicate that healthcare amenity contributions generally represent a small fraction of contributors’ total contributions. After the COVID-19 outbreak, contributors made slightly more healthcare-related edits, but the changes in both absolute and relative contributions were not statistically significant.
4.1.4. Participation Metrics
Participation metrics measure contributors’ total contributions, the proportion of editing action types (modification or creation), and engagement status (new, quit, or stay contributors). The distributions of these metrics are shown in Figure 7.
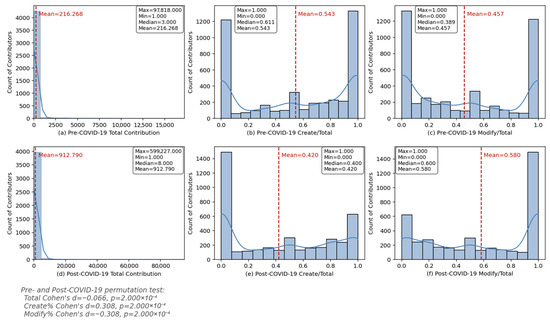
Figure 7.
Frequency distribution of the participation metrics in the pre- and post-COVID-19 period. (a,d) Volume of total contributions for individual contributors; (b,e) percentage of creation among total edits for individual contributors; (c,f) percentage of modification among total edits for individual contributors.
Contributors’ total contributions in both the pre- and post-COVID-19 periods also follow a long-tail distribution. Maximum total edits reached 97,818 pre-COVID-19 and 599,227 post-COVID-19. The medians are below 10 in both periods, but the mean total contributions increased from 216.266 pre-COVID-19 to 912.79 post-COVID-19. The change is statistically significant (p-value = 0.0002, Cohen’s d = −0.066). This might be due to the fact that the majority of contributors still made relatively few edits (median below 10), and the increase is primarily driven by a small number of contributors with a large number of edits.
Post-COVID-19 contributors generally made a higher proportion of modifications relative to creations (among all edits) compared to pre-COVID-19 contributors (Figure 7). In the pre-COVID-19 period, contributors were more polarized: they either almost entirely made creations or modifications (i.e., the bi-modal distributions in Figure 7b,c), with a median proportion of 61.1% creations and 38.9% modifications. In the post-COVID-19 period, contributors were less polarized and tended to make more modifications than creations, with median percentages of 40% creations and 60% modifications, and corresponding means of 42% and 58%. The increase in mean proportion of creation (p = 0.0002, Cohen’s d = 0.308) and corresponding decrease in modification (p = 0.0002, Cohen’s d = −0.308) highlight a statistically significant shift in editing behavior, suggesting that contributors changed their focus toward modifications after the COVID-19 outbreak.
Figure 8a shows the volume of creations and modifications, and Figure 8b shows the number of contributors performing each action. At the city level, there are more creations than modifications in both time periods. However, in the post-COVID-19 period, more contributors tended to focus on modifications rather than creations. Volume of creations and modifications largely increased after the COVID-19 outbreak, from 578,502 and 370,699 pre-COVID-19 to 2,277,111 and 1,418,755 post-COVID-19, respectively. Meanwhile, the number of contributors making creations decreased from 3221 to 2655, whereas those making modifications increased from 3153 to 3557. This shift widened the gap between contributors making creations and modifications, indicating that in the post-COVID-19 period, contributors were more engaged in making modifications than creations. These observations are consistent with Figure 7, which shows a general increase in the proportion of modifications relative to creations in the post-COVID-19 period.
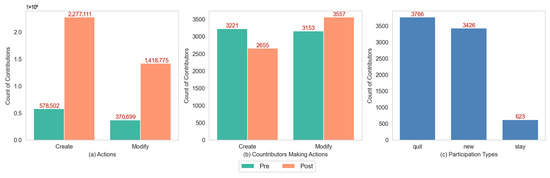
Figure 8.
Participation metrics in the pre- and post-COVID-19 period. (a) Number of creation and modification edits by all contributors; (b) number of contributors who made creations and modifications; (c) number of contributors in each participation status type.
The decrease in creations and increase in modifications might be caused by the expanding platform, which offers fewer opportunities to add new objects to the map. To verify this speculation, the monthly numbers of creations and modifications were counted over the eight-year study period, and their proportion relative to total edits was calculated. The results are shown in Figure 9.
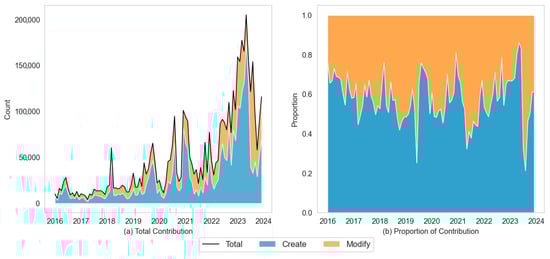
Figure 9.
Monthly volume and proportion of create and modify actions. (a) Monthly volume of creations, modifications, and total edits by all contributors; (b) monthly percentages of creation and modification among total edits by all contributors.
The total number of both modifications and creations increased after the COVID-19 outbreak, leading to a substantial rise in overall contribution. The proportion of creations generally remained around 60%, with greater fluctuation observed after 2020. Figure 8a further supports this observation, showing that although the total number of both creations and modifications increased over time, creations consistently outnumber modifications within each time period.
Participation metrics show that most contributors made relatively few total contributions and participated in only a single time period. In the pre-COVID-19 period, contributors’ edits were relatively balanced between creations and modifications. In contrast, in the post-COVID-19 period, contributors not only increased their total contributions but also tended to focus more on modifications than creations within their overall data contributions.
4.1.5. Social Metrics
The distribution of weighted and unweighted social metrics in the pre- and post-COVID-19 periods is shown in Figure 10. Unweighted social metrics measure the structure of the co-editing network, while weighted metrics capture the strength of co-editing interactions. Combining both weighted and unweighted metrics provides a more comprehensive characterization of contributors’ co-editing behavior, including the strength of interactions among all pairs of contributors.
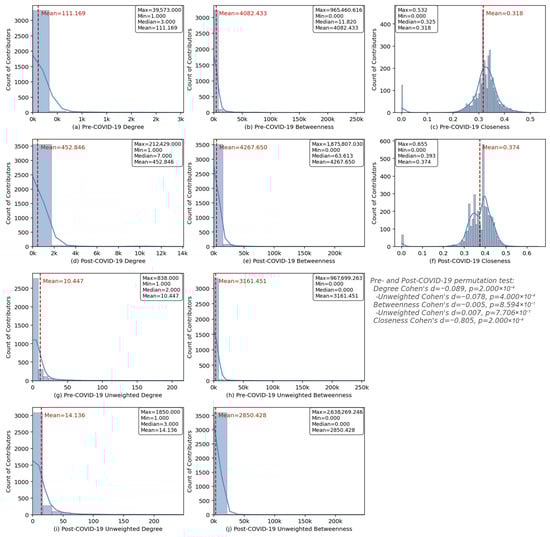
Figure 10.
Frequency distribution of the social metrics in pre- and post-COVID periods. (a,d) Weighted degree for individual contributors; (b,e) weighted betweenness for individual contributors; (c,f) closeness for individual contributors; (g,i) unweighted degree for individual contributors; (h,j) unweighted betweenness for individual contributors.
Similarly to other metrics discussed above, weighted and unweighted degree and betweenness exhibit long-tail distributions in both time periods. Weighted and unweighted degree and betweenness increased their maximum, mean, and median in the post-COVID-19 period compared to the pre-COVID-19 period, indicating that contributors generally interacted with more contributors and had stronger connections. For weighted degree, the mean increased from 111.169 to 452.846, and the median increased from 3 to 7 (p = 0.0002, Cohen’s d = −0.089). The unweighted degree increased the mean from 10.436 to 14.124, and the median increased from 2 to 3 (p = 0.0004, Cohen’s d = −0.078). Although the differences are statistically significant, the small magnitudes of Cohen’s d indicate that the effect size is modest. It suggests that, on average, contributors increased their interactions and formed stronger connections with other contributors in the post-COVID-19 period. However, the majority of contributors still have relatively few interactions and weak connections, and the overall increase is largely driven by a small number of highly connected contributors. Thus, while the co-editing network became more connected, the change in individual contributors’ behavior is relatively small.
While a small number of contributors became more central, the majority did not become more influential in the network. For weighted betweenness, the median increased from 12.297 to 64.914, and the mean increased from 4078.404 to 4267.414 in the post-COVID-19 period. However, the difference in means was not statistically significant (p = 0.8594, Cohen’s d = −0.005). It suggests that although contributors generally formed stronger connections with higher interaction weights, they did not play a more important intermediary role in connecting other contributors in the network. For unweighted betweenness, the median remained at 0 in both time periods, and the mean decreased from 3160.583 to 2850.73. This difference was also not statistically significant (p = 0.7706, Cohen’s d = 0.007). The persistent zero median indicates that most contributors did not lie on the shortest paths between other contributors, and they may be disconnected or weakly connected in the network. The decline in mean suggests a slight reduction in overall importance of contributors in the network, with relatively fewer shortest paths passing through them. Although the maximum betweenness increased, suggesting that a small number of contributors became more central, the lack of significant changes in the mean indicates that, overall, contributors did not become more or less important in the network in the post-COVID-19 period.
Contributors in the post-COVID-19 period generally had enhanced interaction with other contributors, resulting in a tighter network structure compared to the pre-COVID-19 period. Closeness did not exhibit a long-tail distribution in either time period. Rather, the distribution was approximately bell-shaped, with a mean of 0.318 and a median of 0.325 in the pre-COVID-19 period, and a mean of 0.374 and a median of 0.393 in the post-COVID-19 period. The difference in mean was statistically significant with a large effect size (p = 0.0002, Cohen’s d = −0.805), indicating that, on average, contributors were closer to each other in the network, with fewer steps to reach other interacted contributors.
Social metrics show that the co-editing network became denser and more connected in the post-COVID-19 period. Individual contributors interacted with more peers and formed statistically significantly stronger interactions, but the increases were modest and largely driven by a few highly connected contributors. Contributors did not become more influential in the network, as weighted and unweighted betweenness did not show significant differences in means. Contributors were closer on average and could reach others in fewer steps, as indicated by the significant increase in closeness. Overall, the network became tighter, but changes in individual contributors’ influence remained limited.
4.2. Contribution Behavior Clusters
4.2.1. Metric Correlations
A cross-correlation matrix was generated for the numeric metrics under the five categories (Section 3.2.1) computed in the pre-COVID-19 period (Figure 11). The metrics generally do not exhibit strong cross-category correlations (e.g., temporal metrics are not highly correlated with standard distance). However, strong correlations are observed among metrics within the same category (e.g., total number of contributions is highly correlated with the number of creations and modifications).
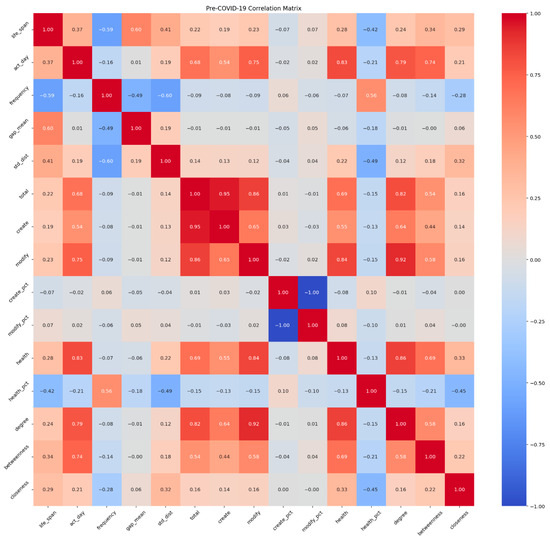
Figure 11.
Pre-COVID-19 cross-correlation matrix (Pearson Correlation Coefficient). Blue color represents negative correlation. Red color represents positive correlation. The darker color represents stronger correlation.
Temporal metrics do not show strong correlations (larger than 0.8) with each other. Lifespan is moderately negatively correlated with the frequency and positively correlated with the gap day mean. A longer lifespan allows for more active days and more gap days, resulting in a lower frequency of activeness. Frequency and gap mean are moderately negatively correlated, indicating that longer gaps between contributions are associated with fewer active days and lower frequency of activeness over the contributors’ lifespan.
The spatial metric (i.e., standard distance) shows little correlation with most other metrics. Interestingly, it is moderately correlated with frequency of activeness and is also positively correlated with lifespan and percentage of healthcare contributions among total contributions. Most contributors have short lifespans and a high frequency of activeness (Figure 3), participating in data contribution for only a few days before leaving without returning for data contribution. These contributors tend to make edits within small areas during their active days, resulting in high frequency but short lifespans and a small standard distance of contributions. The number of healthcare amenity edits is weakly positively correlated with standard distance, while the percentage of them among total contributions is moderately negatively correlated with standard distance. A larger spatial extent of edits encompasses more healthcare amenities, but the total number of editable healthcare amenities is limited. As contributors’ edits become more spatially dispersed, they tend to make more total contributions in the study area, which reduces the relative proportion of healthcare amenity edits among total contributions.
Among thematic metrics, total contributions are highly correlated with the number of creations and modifications, as well as with weighted degree. Total contributions are also moderately positively correlated with active days, healthcare amenity edits, and weighted betweenness. Higher numbers of creations, modifications, and healthcare amenity edits increase total contributions. Contributors with higher total contribution volumes also have a greater likelihood of co-editing with others, leading to stronger co-editing interactions and higher weighted degree and betweenness. Similarly, more active days provide more opportunities for contribution, resulting in higher cumulative contribution volumes.
The number of creations and modifications also showed correlation patterns similar to those of total contributions. Since total contributions consist of creations and modifications, both are highly correlated with total contributions and show moderate to high correlations with active days, healthcare amenity edits, degree, and betweenness. Creations and modifications are also moderately positively correlated with each other, with a correlation coefficient of 0.65, suggesting that contributors who create many map objects also tend to make many modifications.
Among social metrics, weighted degree and weighted betweenness show moderate to high correlations with active days, total contributions, creations, modifications, and healthcare edits. These two metrics are also moderately positively correlated with each other, with a correlation coefficient of 0.58. As higher total contribution volumes increase the likelihood of co-editing, contributors with more edits tend to have more co-editing interactions with a larger number of contributors, resulting in a higher degree and betweenness.
Based on these observed correlations, the absolute numbers of creations, modifications, and healthcare edits were removed from clustering analysis. Instead, percentages of creations, modifications, and healthcare amenity edits relative to total contributions were retained as clustering metrics.
4.2.2. K-Means Clustering of Contributors
Based on the maximum Silhouette score and the minimum Davies–Bouldin score, and using metrics computed in the pre-COVID period, the optimal k for K-Means was determined to be 3 (Figure 12). A K-Means clustering model was fitted to contributor metrics in the pre-COVID-19 period. The centroids of each cluster group from the K-Means clustering, with scaled metric values, are shown in Figure 13. This process was repeated 20 times with different random initial cluster centers for robustness checking. 19 out of 20 runs produced three clusters with similar characteristics, and 95% of contributors were clustered to the same cluster across these 19 runs.
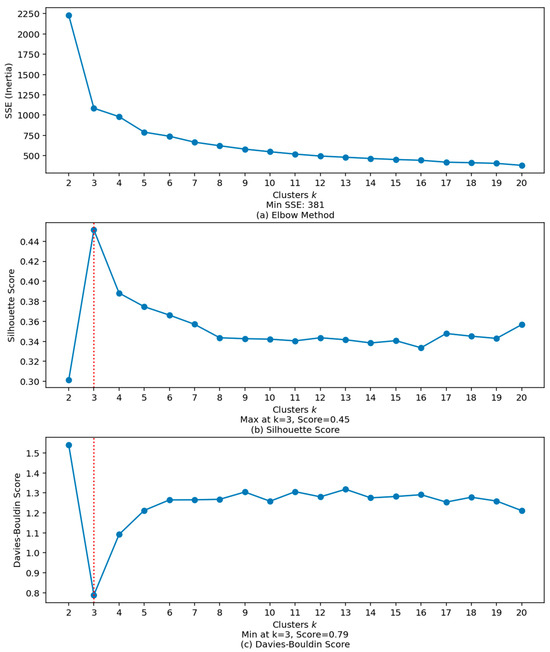
Figure 12.
Optimal k for K-Means. (a) Best k selected by elbow method with sum of squared errors (SSE); (b) best k selected by Silhouette Score; (c) best k selected by Davies–Bouldin Score. The red dashed line indicates the selected optimal k.
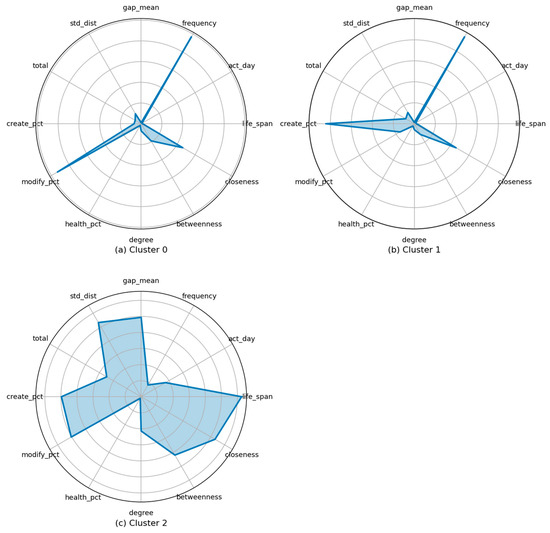
Figure 13.
K-Means cluster group centroids. (a) Characteristics of cluster 0 center; (b) characteristics of cluster 1 center; (c) characteristics of cluster 2 center.
Contributors in clusters 0 and 1 have similar patterns, with the primary difference being the edit type. Contributors in both clusters have low values of total contributions, standard distance of contributions, lifespan, active days, and gap days. They also have a low degree and betweenness, moderate closeness, very high frequency of activeness, and near-zero percentages of healthcare edits among total contributions. The major distinction between the two clusters is that contributors in cluster 0 tend to make more modifications than creations, while contributors in cluster 1 show the opposite tendency. Contributors in cluster 1 also have slightly higher betweenness and closeness than those in cluster 0.
Contributors in cluster 2 have distinct characteristics compared to those in clusters 0 and 1. They have moderate levels of total contributions, larger standard distances of contributions, substantially longer lifespans, more active days, and more gap days. They also have moderate degrees, high betweenness and closeness, very high frequency of activeness, and near-zero healthcare amenity edit percentages among total contributions. The percentages of creation and modification within their total contributions are relatively balanced.
Figure 14 shows the number of contributors in each cluster group in the pre- and post-COVID-19 periods. The K-Means model fitted on pre-COVID-19 metrics was applied to cluster contributors in the post-COVID-19 period using their corresponding metric values. Cluster 1 contains the greatest number of contributors in the pre-COVID-19 period but the fewest in the post-COVID-19 period. The number of contributors in cluster 1 decreased from 1296 to 925. In contrast, more contributors were grouped into clusters 0 and 2. The number of contributors in cluster 0 increased from 999 to 1208, while cluster 2 increased from 1167 to 1521. In general, the post-COVID-19 period shows more contributors showing cluster 0 and cluster 2 characteristics, but fewer contributors show cluster 1 characteristics. It indicates changes in individual contribution patterns in the post-COVID-19 period.
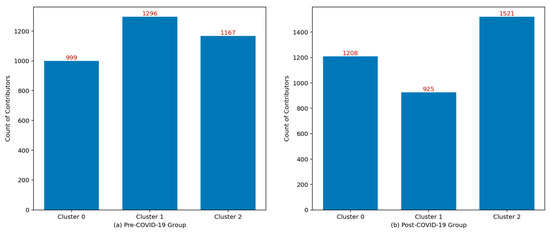
Figure 14.
Count of contributors in K-Means clustering groups. (a) Number of contributors in each cluster group in pre-COVID-19 period; (b) number of contributors in each cluster groups in post-COVID-19 period.
4.2.3. Change in Contribution Cluster Memberships
Contributors who contributed data to OSM in the pre-COVID-19 period may cease data contribution within the study area (“quit” contributors) in the post-COVID-19 period, or continue contributing (“stay” contributors). “New” contributors are those who began contributing data within the study area for the first time in the post-COVID-19 period. Figure 15 shows the numbers of quit, new, and stay contributors across cluster groups in the pre- and post-COVID-19 periods.
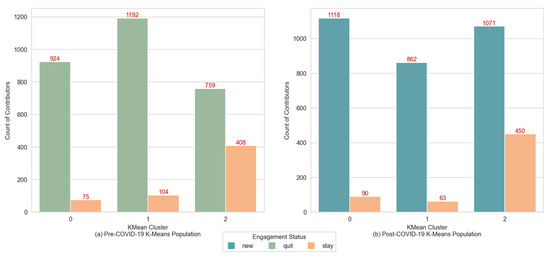
Figure 15.
Cluster group population by engagement status. (a) Number of contributors of different participation status in each cluster group in pre-COVID-19 period; (b) Number of contributors of different participation status in each cluster group in post-COVID-19 period.
Contributors who participated in only one time period show different characteristics compared to those who contributed in both time periods. The majority of contributors participated in data contribution in only one time period, and most of them were grouped into clusters 0 and 1. In the pre-COVID-19 period, there were 924 contributors in cluster 0 and 1192 contributors in cluster 1. In the post-COVID-19 period, there were 1118 contributors in cluster 0 and 862 contributors in cluster 1. Most contributors who participated in data contribution in only one time period have low levels of total contribution, degree, betweenness, lifespan, active days, gap days, and healthcare edit percentage among total contributions. They also have a high frequency of activeness and moderate closeness. Contributors who participated in the pre-COVID-19 period were mostly grouped into cluster 1, but relatively few contributors in the post-COVID-19 period were assigned to this cluster. In contrast, most contributors who participated in data contribution in both time periods were grouped into cluster 2. Among these contributors, more were assigned to cluster 1 than to cluster 0 in the pre-COVID-19 period, while more were grouped into cluster 0 than cluster 1 in the post-COVID-19 period. These contributors exhibit cluster 2 characteristics, including low healthcare edit percentages, moderate total contributions and degree, and high standard distance of contributions, lifespan, active days, gap days, betweenness, closeness, and frequency of activeness.
Figure 16 shows the change in cluster membership for contributors who participated in both time periods. The largest transitions occur between cluster 2 and the other clusters. Most contributors transitioned to, or remained in, cluster 2 in the post-COVID-19 period. Contributors assigned to cluster 2 in the pre-COVID-19 period largely remained in the same cluster in the post-COVID-19 period, while many contributors in clusters 0 and 1 transitioned to cluster 2. Only 24 contributors remained in cluster 0 across both periods, compared to 42 who transitioned from cluster 0 to cluster 2 in the post-COVID-19 period. Among contributors in cluster 1 in the pre-COVID-19 period, only 10 remained in the same cluster, while 12 of them transitioned to cluster 0, and 77 transitioned to cluster 2. For contributors in cluster 2 in the pre-COVID-19 period, 316 remained in the same cluster, 45 transitioned to cluster 0, and 40 transitioned to cluster 1 in the post-COVID-19 period. Note that the total numbers shown in Figure 15 and Figure 16 for contributors who participated in both time periods differ because contributors with null values were removed separately from the datasets for each period.
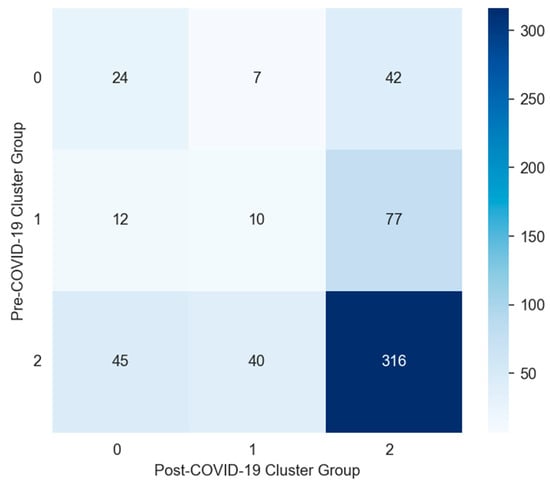
Figure 16.
Cluster group population transition matrix. The darker color represents more contributors.
5. Discussion
5.1. Cluster Membership Change
Cluster features in Figure 13 indicate that major differences can be observed between cluster 2 and other clusters across many metrics, such as active days, standard distance of edits, and closeness. Individual contributors changed their cluster membership in response to the changes in these metrics, suggesting that cluster transitions are associated with the shift in individual contribution behaviors.
Figure 17 presents a comparison of pre- and post-COVID-19 distributions of active days, standard distance, total contributions, and closeness for contributors transitioning between cluster 2 and other clusters. The mean values of these metrics generally increased in the post-COVID-19 period for contributors who transitioned from other clusters to cluster 2, and contributors who transitioned out of cluster 2 generally exhibited decreases in these metrics. These changes in individual behavior are consistent with the characteristics of cluster 2 compared to other clusters (Figure 13). Mean closeness for contributors transitioning from cluster 2 to other clusters remained at a similar level.
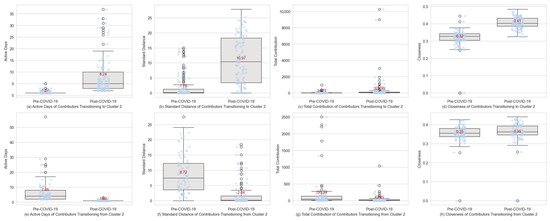
Figure 17.
Metrics of contributors transitioning cluster membership. (a,e) Active days in both time periods of contributors changed between cluster 2 and other clusters. (b,f) Standard distance for transitioned contributors. (c,g) Total contribution for transitioned contributors. (d,h) Closeness for transitioned contributors. Blue dots represent data points, and white dots indicate outliers identified by the boxplot.
Overall, these differences in the pre- and post-COVID metrics suggest that transitions in membership between cluster 2 and other clusters are driven by changes in individual contribution behavior. Transitioning to cluster 2 reflects a stronger contribution engagement, while transitions out of cluster 2 are associated with a decline.
5.2. General Behavior Change
In general, differences are observed in data contribution patterns of individual contributors before and after the COVID-19 outbreak. These differences may reflect the influences of COVID-19 or the normal pattern on the expanding platform. Based on the metric statistics, OSM contributors in the post-COVID-19 period are more casual in data contribution over a longer period of time (Figure 3). They contribute over larger areas (Figure 4), have slightly higher proportion of healthcare amenity contributions (Figure 5), produce more total contributions, and make more modifications than creations among their total data contributions (Figure 7). They also interact with more other contributors and exhibit stronger interactions, resulting in a more tightly connected co-editing network (Figure 10).
Compared to pre-COVID-19 contributors, post-COVID-19 contributors are more engaged in data contributions. By examining individual contribution patterns, most contributors belong to cluster 1 in the pre-COVID-19 period, whereas most contributors belong to cluster 2 in the post-COVID-19 period (Figure 14). Overall, contributors who participated in data contribution in the pre-COVID-19 period exhibit characteristics of a small volume of total contributions, small areas of edits, short lifespans with intensive activity characterized by fewer gap days and higher frequency, more creations than modifications, few interactions in the co-editing network, and very few healthcare amenity contributions. In contrast, contributors who participated in data contribution in the post-COVID-19 period exhibit characteristics of larger volumes of total contributions, larger areas of edits, longer lifespans with more casual activity characterized by more gap days and lower frequency, more balanced levels of modifications and creations, stronger interactions in the co-editing network, and greater importance within the co-editing network.
Most contributors participated in only one period of time, either the pre-COVID-19 period or the post-COVID-19 period. Among contributors who participated in data contribution during both periods, most transitioned from clusters 0 and 1 to cluster 2 in the post-COVID-19 period. This transition indicates increased engagement in data contributions, characterized by a higher volume of total contributions, larger area of edits, longer lifespans with more intensive activity, a more balanced pattern of creations and modifications, and stronger interactions and greater importance in the co-editing network.
5.3. Limitations
Although changes are observed in metric statistics, overall individual contribution patterns, and contributors who changed their contribution patterns, it cannot yet be verified that these differences are caused by COVID-19. Further studies are needed to determine whether the observed behavioral changes can be attributed to COVID-19. Interviews and surveys could be conducted with individual contributors who changed their contribution patterns. More detailed COVID-19 data could also be incorporated to examine correlations with changes in contribution behavior at a finer temporal scale.
Individual contributors changed their contribution pattern after COVID-19, but these changes may not be led by COVID-19. In this study, contributor lifespan is defined separately for pre- and post-COVID-19 periods, using the first day of 2020 as the dividing point. Accordingly, contributors are categorized as stay, new, and quit based on whether they participated in data contribution before and after this date. While in real life, the lifespan of contributors is continuous rather than segmented by calendar boundaries. This temporal partitioning may partially explain why many contributors changed to cluster 2 in the post-COVID-19 period. Contributors who began data contribution in the last few days of 2019 and continued afterwards have a short lifespan in the pre-COVID-19 period but a longer lifespan in the post-COVID-19 period. Although their pre-COVID-19 participation is minimal, they are still classified as stay contributors. Since lifespan is another primary distinguishing factor between cluster 2 and other clusters, these contributors may be clustered into cluster 0 or 1 in the pre-COVID-19 period, but grouped to cluster 2 in the post-COVID-19 period. Conversely, contributors who have been making data contributions for a long time before 2020 but stopped data contributions in the early days of the year 2020 would have a long lifespan in the pre-COVID-19 period and a short lifespan in the post-COVID-19 period. They may therefore be assigned to cluster 2 in the pre-COVID-19 period, but grouped into cluster 0 or 1 in the post-COVID-19 period.
Overall, contributors changed their behavior pattern, but it cannot be determined whether these changes fall within the natural growth of the platform. Figure 18 shows the time-series forecast of the post-COVID-19 period monthly total contribution and healthcare amenity edits at the platform level based on time-series models fitted on pre-COVID-19 trends using the SARIMAX (Seasonal AutoRegressive Integrated Moving Average with eXogenous regressors) model [95]. During model fitting, pre-COVID-19 monthly total contributions and health contributions were decomposed into trend and seasonality. The time-series forecast presents the expected monthly total and health contributions in the post-COVID-19 period without any COVID-19 influence.
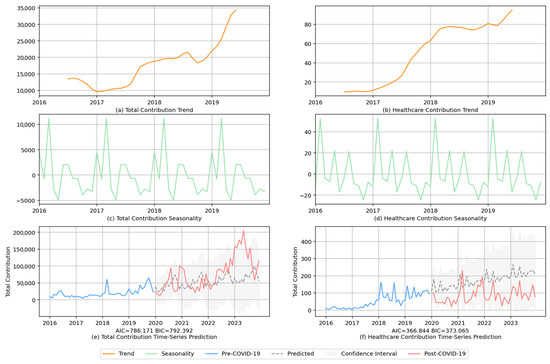
Figure 18.
Time-series (monthly) modeling and forecasting. (a,c) Total contribution time-series decomposition; (e) total contribution time-series forecasting; (b,d) healthcare contribution time-series decomposition; (f) healthcare contribution time-series forecasting. Orange line is the decomposed pre-COVID-19 time-series trend, green line is the decomposed pre-COVID-19 time-series seasonality, blue line is the actual pre-COVID-19 time series, gray dash line is the forecasted post-COVID-19 time series, gray area is the 95% confidence interval of forecasting, and red line is the actual post-COVID-19 time series.
The results show that total contributions are within the natural growth of the platform, but health contributions are lower than expected. These observations suggest that at the platform level, COVID-19 did not have much influence on these metrics. Monthly total contribution and healthcare contributions generally fell within the 95% confidence interval of the forecasted time series. Healthcare contributions were lower than expected and did not exhibit the pre-COVID-19 growing trend, which is consistent with Figure 5, showing that the differences in pre- and post-COVID-19 means are not statistically significant. These patterns also explained the decrease in the proportion of healthcare edit relative to total contributions in the post-COVID-19 period (Figure 6a). Although more contributors made healthcare edits and increased the volume of healthcare edits (Figure 6b,c), the faster growth of total contribution relative to healthcare edits led to a reduced percentage of healthcare edits at the platform level.
In summary, contributors exhibited changes in individual behavior, cluster membership, and contribution after the outbreak of COVID-19, but it cannot be determined with certainty that these changes were caused by the pandemic. At the platform level, total contributions remained within the expected growth trajectory, while healthcare contributions were lower than forecasted. These patterns suggest that observed changes might have resulted from a combination of natural platform growth, individual factors, and temporal definitions, rather than being solely attributable to the pandemic. Finer-grained analyses and contributor-level surveys could be conducted in more in-depth future studies.
6. Conclusions
This study examined changes in individual OSM contributors’ contribution behavior through temporal, spatial, thematic, participation, and social metrics. Individual contribution patterns were grouped to characterize distinct contribution patterns and compared between the pre- and post-COVID-19 periods. The result suggests that differences exist in contributors’ contribution patterns across two time periods, but no direct evidence confirms COVID-19 as the sole cause of these differences.
Statistically significant differences were observed in overall contribution patterns between the pre- and post-COVID-19 periods according to permutation tests. Post-COVID-19 contributors, on average, exhibited longer lifespans, more active days, larger spatial extents of edits, higher volumes of total contributions, a greater emphasis on modification over creation, and stronger co-editing interactions. Although most test effect sizes were small and long-tail distributions persisted across most metrics, indicating that the majority of contributors in both time periods had low engagement, the results indicate a subtle change in contribution behavior. Healthcare contributions continued to represent a small fraction of total edits with no statistically significant change.
Contributors who participated in OSM data contributions in both periods generally demonstrated increased engagement in the post-COVID-19 period. Many transitioned from low-engagement clusters (clusters 0 and 1) to a higher-engagement cluster (cluster 2), characterized by longer lifespans, broader spatial coverage, more balanced creation and modification, and stronger network centrality. These transitions reflect changes in individual contribution behavior, while also reflecting the influence of contributor lifespan segmentation and platform growth.
The findings reveal differences in contribution patterns across the pre- and post-COVID-19 periods at both individual and platform levels in NYC. These findings provide insights mainly relevant to cities with similar OSM maturity and contributor dynamics, but are likely to reflect only partial features of OSM contribution behavior in cities with lower or higher data maturity. By examining contribution behavior at the individual level, this study provides empirical evidence of how VGI data contribution evolves over time under external disruption of a public health crisis, such as COVID-19, and contributes to a deeper understanding of individual-level contribution behaviors on the OSM platform.
Author Contributions
Conceptualization, Jin Xu and Guiming Zhang; methodology, Jin Xu and Guiming Zhang; software, Jin Xu and Guiming Zhang; validation, Guiming Zhang; formal analysis, Jin Xu; investigation, Jin Xu and Guiming Zhang; resources, Guiming Zhang; data curation, Jin Xu; writing—original draft preparation, Jin Xu; writing—review and editing, Jin Xu and Guiming Zhang; visualization, Jin Xu; supervision, Guiming Zhang; project administration, Jin Xu and Guiming Zhang; funding acquisition, Guiming Zhang. All authors have read and agreed to the published version of the manuscript.
Funding
This research received no external funding. The APC was funded by the University of Denver’s Open Access Publication Equity Fund.
Data Availability Statement
Original data were obtained from the Geofabrik Download Server (https://osm-internal.download.geofabrik.de/index.html, accessed on 13 August 2025).
Acknowledgments
During the preparation and revision of this manuscript, the authors used ChatGPT (GPT-5, OpenAI) for language polishing and improving clarity. The authors have reviewed and edited the output and take full responsibility for the content of this publication.
Conflicts of Interest
The authors declare no conflict of interest.
Abbreviations
The following abbreviations are used in this manuscript:
| VGI | Volunteered Geographic Information |
| OSM | OpenStreetMap |
| NYC | New York City |
| SSE | Sum of Squared Errors |
| SARIMAX | Seasonal AutoRegressive Integrated Moving Average with eXogenous regressors |
References
- Bonney, R.; Shirk, J.L.; Phillips, T.B.; Wiggins, A.; Ballard, H.L.; Miller-Rushing, A.J.; Parrish, J.K. Next Steps for Citizen Science. Science 2014, 343, 1436–1437. [Google Scholar] [CrossRef] [PubMed]
- See, L.; Mooney, P.; Foody, G.; Bastin, L.; Comber, A.; Estima, J.; Fritz, S.; Kerle, N.; Jiang, B.; Laakso, M.; et al. Crowdsourcing, Citizen Science or Volunteered Geographic Information? The Current State of Crowdsourced Geographic Information. ISPRS Int. J. Geo-Inf. 2016, 5, 55. [Google Scholar] [CrossRef]
- Goodchild, M.F. Citizens as Sensors: The World of Volunteered Geography. GeoJournal 2007, 69, 211–221. [Google Scholar] [CrossRef]
- Elwood, S. Geographic Information Science: Emerging Research on the Societal Implications of the Geospatial Web. Prog. Hum. Geogr. 2010, 34, 349–357. [Google Scholar] [CrossRef]
- Caquard, S. Cartography II: Collective Cartographies in the Social Media Era. Prog. Hum. Geogr. 2014, 38, 141–150. [Google Scholar] [CrossRef]
- Jonietz, D.; Antonio, V.; See, L.; Zipf, A. Highlighting Current Trends in Volunteered Geographic Information. ISPRS Int. J. Geo-Inf. 2017, 6, 202. [Google Scholar] [CrossRef]
- Zhao, N.; Zhou, G. Social Media Use and Mental Health during the COVID-19 Pandemic: Moderator Role of Disaster Stressor and Mediator Role of Negative Affect. Appl. Psychol. Health Well-Being 2020, 12, 1019–1038. [Google Scholar] [CrossRef] [PubMed]
- Geirdal, A.Ø.; Ruffolo, M.; Leung, J.; Thygesen, H.; Price, D.; Bonsaksen, T.; Schoultz, M. Mental Health, Quality of Life, Wellbeing, Loneliness and Use of Social Media in a Time of Social Distancing during the COVID-19 Outbreak. A Cross-Country Comparative Study. J. Ment. Health 2021, 30, 148–155. [Google Scholar] [CrossRef] [PubMed]
- He, B.; Ziems, C.; Soni, S.; Ramakrishnan, N.; Yang, D.; Kumar, S. Racism Is a Virus: Anti-Asian Hate and Counterspeech in Social Media during the COVID-19 Crisis. In Proceedings of the 2021 IEEE/ACM International Conference on Advances in Social Networks Analysis and Mining, Amsterdam, The Netherlands, 8–11 November 2021; pp. 90–94. [Google Scholar]
- Yan, Y.; Feng, C.-C.; Huang, W.; Fan, H.; Wang, Y.-C.; Zipf, A. Volunteered Geographic Information Research in the First Decade: A Narrative Review of Selected Journal Articles in GIScience. Int. J. Geogr. Inf. Sci. 2020, 34, 1765–1791. [Google Scholar] [CrossRef]
- Coleman, D.J.; Georgiadou, Y.; Labonte, J. Volunteered Geographic Information: The Nature and Motivation of Produsers *. Int. J. Spat. Data Infrastruct. Res. 2009, 4, 332–358. [Google Scholar] [CrossRef]
- Quinn, S. Using Small Cities to Understand the Crowd behind OpenStreetMap. GeoJournal 2017, 82, 455–473. [Google Scholar] [CrossRef]
- Haklay, M.; Basiouka, S.; Antoniou, V.; Ather, A. How Many Volunteers Does It Take to Map an Area Well? The Validity of Linus’ Law to Volunteered Geographic Information. Cartogr. J. 2010, 47, 315–322. [Google Scholar] [CrossRef]
- Di Cecco, G.J.; Barve, V.; Belitz, M.W.; Stucky, B.J.; Guralnick, R.P.; Hurlbert, A.H. Observing the Observers: How Participants Contribute Data to iNaturalist and Implications for Biodiversity Science. BioScience 2021, 71, 1179–1188. [Google Scholar] [CrossRef]
- Rosenblatt, C.J.; Dayer, A.A.; Duberstein, J.N.; Phillips, T.B.; Harshaw, H.W.; Fulton, D.C.; Cole, N.W.; Raedeke, A.H.; Rutter, J.D.; Wood, C.L. Highly Specialized Recreationists Contribute the Most to the Citizen Science Project eBird. Ornithol. Appl. 2022, 124, duac008. [Google Scholar] [CrossRef]
- Xu, J.; Li, L.; Zhou, Q. Spatial-temporal analysis of openstreetmap data after natural disasters: A case study of haiti under hurricane matthew. Int. Arch. Photogramm. Remote Sens. Spat. Inf. Sci. 2017, 42, 1401–1406. [Google Scholar] [CrossRef]
- Ahmed, W.; Bath, P.A.; Sbaffi, L.; Demartini, G. Moral Panic through the Lens of Twitter: An Analysis of Infectious Disease Outbreaks. In Proceedings of the 9th International Conference on Social Media and Society, New York, NY, USA, 18 July 2018. [Google Scholar]
- Jost, J.T.; Barberá, P.; Bonneau, R.; Langer, M.; Metzger, M.; Nagler, J.; Sterling, J.; Tucker, J.A. How Social Media Facilitates Political Protest: Information, Motivation, and Social Networks. Political Psychol. 2018, 39, 85–118. [Google Scholar] [CrossRef]
- Leung, L. Generational Differences in Content Generation in Social Media: The Roles of the Gratifications Sought and of Narcissism. Comput. Hum. Behav. 2013, 29, 997–1006. [Google Scholar] [CrossRef]
- Sheldon, P.; Bryant, K. Instagram: Motives for Its Use and Relationship to Narcissism and Contextual Age. Comput. Hum. Behav. 2016, 58, 89–97. [Google Scholar] [CrossRef]
- Ghaisani, A.P.; Handayani, P.W.; Munajat, Q. Users’ Motivation in Sharing Information on Social Media. Procedia Comput. Sci. 2017, 124, 530–535. [Google Scholar] [CrossRef]
- Golbeck, J.; Robles, C.; Turner, K. Predicting Personality with Social Media. In Proceedings of the CHI ’11 Extended Abstracts on Human Factors in Computing Systems, New York, NY, USA, 7 May 2011. [Google Scholar]
- Park, G.; Schwartz, H.A.; Eichstaedt, J.C.; Kern, M.L.; Kosinski, M.; Stillwell, D.J.; Ungar, L.H.; Seligman, M.E.P. Automatic Personality Assessment through Social Media Language. J. Personal. Soc. Psychol. 2015, 108, 934–952. [Google Scholar] [CrossRef]
- Liu, L.; Preotiuc-Pietro, D.; Samani, Z.R.; Moghaddam, M.E.; Ungar, L. Analyzing Personality through Social Media Profile Picture Choice. Proc. Int. AAAI Conf. Web Soc. Media 2016, 10, 211–220. [Google Scholar] [CrossRef]
- Correa, T.; Hinsley, A.W.; de Zúñiga, H.G. Who Interacts on the Web?: The Intersection of Users’ Personality and Social Media Use. Comput. Hum. Behav. 2010, 26, 247–253. [Google Scholar] [CrossRef]
- De Choudhury, M.; Sharma, S.S.; Logar, T.; Eekhout, W.; Nielsen, R.C. Gender and Cross-Cultural Differences in Social Media Disclosures of Mental Illness. In Proceedings of the 2017 ACM Conference on Computer Supported Cooperative Work and Social Computing, New York, NY, USA, 25 February 2017. [Google Scholar]
- Barry, C.T.; Sidoti, C.L.; Briggs, S.M.; Reiter, S.R.; Lindsey, R.A. Adolescent Social Media Use and Mental Health from Adolescent and Parent Perspectives. J. Adolesc. 2017, 61, 1–11. [Google Scholar] [CrossRef] [PubMed]
- Moreno, M.A.; Binger, K.; Zhao, Q.; Eickhoff, J. Adolescents’ Digital Technology Interactions and Importance: Associations with Demographics and Social Media Frequency. J. Pediatr. 2021, 236, 312–315.e1. [Google Scholar] [CrossRef]
- Vasalou, A.; Joinson, A.N.; Courvoisier, D. Cultural Differences, Experience with Social Networks and the Nature of “True Commitment” in Facebook. Int. J. Hum. Comput. Stud. 2010, 68, 719–728. [Google Scholar] [CrossRef]
- Sheldon, P.; Herzfeldt, E.; Rauschnabel, P.A. Culture and Social Media: The Relationship between Cultural Values and Hashtagging Styles. Behav. Inf. Technol. 2020, 39, 758–770. [Google Scholar] [CrossRef]
- Reed, J.; Raddick, M.J.; Lardner, A.; Carney, K. An Exploratory Factor Analysis of Motivations for Participating in Zooniverse, a Collection of Virtual Citizen Science Projects. In Proceedings of the 2013 46th Hawaii International Conference on System Sciences, Wailea, HI, USA, 7–10 January 2013. [Google Scholar]
- Wright, D.R.; Underhill, L.G.; Keene, M.; Knight, A.T. Understanding the Motivations and Satisfactions of Volunteers to Improve the Effectiveness of Citizen Science Programs. Soc. Nat. Resour. 2015, 28, 1013–1029. [Google Scholar] [CrossRef]
- Roman, L.A.; Scharenbroch, B.C.; Östberg, J.P.A.; Mueller, L.S.; Henning, J.G.; Koeser, A.K.; Sanders, J.R.; Betz, D.R.; Jordan, R.C. Data Quality in Citizen Science Urban Tree Inventories. Urban For. Urban Green. 2017, 22, 124–135. [Google Scholar] [CrossRef]
- Rotman, D.; Hammock, J.; Preece, J.J.; Boston, C.L.; Hansen, D.L.; Bowser, A.; He, Y. Does Motivation in Citizen Science Change with Time and Culture? In Proceedings of the Companion Publication of the 17th ACM Conference on Computer Supported Cooperative Work & Social Computing, New York, NY, USA, 15 February 2014. [Google Scholar]
- Aristeidou, M.; Herodotou, C.; Ballard, H.L.; Higgins, L.; Johnson, R.F.; Miller, A.E.; Young, A.N.; Robinson, L.D. How Do Young Community and Citizen Science Volunteers Support Scientific Research on Biodiversity? The Case of iNaturalist. Diversity 2021, 13, 318. [Google Scholar] [CrossRef]
- Aristeidou, M.; Herodotou, C.; Ballard, H.L.; Young, A.N.; Miller, A.E.; Higgins, L.; Johnson, R.F. Exploring the Participation of Young Citizen Scientists in Scientific Research: The Case of iNaturalist. PLoS ONE 2021, 16, e0245682. [Google Scholar] [CrossRef]
- Haklay, M.; Weber, P. OpenStreet Map: User-Generated Street Maps. IEEE Pervasive Comput. 2008, 7, 12–18. [Google Scholar] [CrossRef]
- Chung, T.Y.; Chuang, K.T.; Hsu, C.M.; Ku, W.S. Spatiotemporal Crowdsourcing Behavior: Analysis on OpenStreetMap. In Proceedings of the TAAI 2015—2015 Conference on Technologies and Applications of Artificial Intelligence, Tainan, Taiwan, 20–22 November 2015. [Google Scholar]
- Bégin, D.; Devillers, R.; Roche, S. The Life Cycle of Contributors in Collaborative Online Communities -the Case of OpenStreetMap. Int. J. Geogr. Inf. Sci. 2018, 32, 1611–1630. [Google Scholar] [CrossRef]
- Thebault-Spieker, J.; Hecht, B.; Terveen, L. Geographic Biases Are ‘Born, Not Made’: Exploring Contributors’ Spatiotemporal Behavior in OpenStreetMap; Association for Computing Machinery (ACM): New York, NY, USA, 2017; pp. 71–82. [Google Scholar]
- Mooney, P.; Corcoran, P. Characteristics of Heavily Edited Objects in Openstreetmap. Future Internet 2012, 4, 285–305. [Google Scholar] [CrossRef]
- Davidovic, N.; Mooney, P.; Stoimenov, L.; Minghini, M. Tagging in Volunteered Geographic Information: An Analysis of Tagging Practices for Cities and Urban Regions in OpenStreetMap. ISPRS Int. J. Geo-Inf. 2016, 5, 232. [Google Scholar] [CrossRef]
- Corcoran, P.; Mooney, P.; Bertolotto, M. Analysing the Growth of OpenStreetMap Networks. Spat. Stat. 2013, 3, 21–32. [Google Scholar] [CrossRef]
- Jokar Arsanjani, J.; Helbich, M.; Bakillah, M.; Loos, L. The Emergence and Evolution of OpenStreetMap: A Cellular Automata Approach. Int. J. Digit. Earth 2015, 8, 74–88. [Google Scholar] [CrossRef]
- Mooney, P.; Corcoran, P. Analysis of Interaction and Co-Editing Patterns amongst Openstreetmap Contributors. Trans. GIS 2014, 18, 633–659. [Google Scholar] [CrossRef]
- Hacar, M.; Kılıç, B.; Şahbaz, K. Analyzing OpenStreetMap Road Data and Characterizing the Behavior of Contributors in Ankara, Turkey. ISPRS Int. J. Geo-Inf. 2018, 7, 400. [Google Scholar] [CrossRef]
- Yang, A.; Fan, H.; Chen, L.; Jia, Q.; Li, J. Characterizing Behaviors of Territorial-Dispute-Related Mapping in OpenStreetMap. Cartogr. Geogr. Inf. Sci. 2023, 50, 451–464. [Google Scholar] [CrossRef]
- Neis, P.; Zipf, A. Analyzing the Contributor Activity of a Volunteered Geographic Information Project—The Case of OpenStreetMap. ISPRS Int. J. Geo-Inf. 2012, 1, 146–165. [Google Scholar] [CrossRef]
- Zielstra, D.; Hochmair, H.; Neis, P.; Tonini, F. Areal Delineation of Home Regions from Contribution and Editing Patterns in OpenStreetMap. ISPRS Int. J. Geo-Inf. 2014, 3, 1211–1233. [Google Scholar] [CrossRef]
- Herfort, B.; Lautenbach, S.; Porto de Albuquerque, J.; Anderson, J.; Zipf, A. A Spatio-Temporal Analysis Investigating Completeness and Inequalities of Global Urban Building Data in OpenStreetMap. Nat. Commun. 2023, 14, 3985. [Google Scholar] [CrossRef]
- Neis, P.; Zielstra, D.; Zipf, A. Comparison of Volunteered Geographic Information Data Contributions and Community Development for Selected World Regions. Future Internet 2013, 5, 282–300. [Google Scholar] [CrossRef]
- Sutton, D.; Solomon, G.; Yuan, X.; Polat Kayali, M.; Gardner, Z.; Basiri, A. Assessing the Relationship between Socio-Demographic Characteristics and OpenStreetMap Contributor Behaviours. In Proceedings of the 1st ACM SIGSPATIAL International Workshop on Geocomputational Analysis of Socio-Economic Data, New York, NY, USA, 28 November 2023. [Google Scholar]
- Yang, A.; Fan, H.; Jing, N. Amateur or Professional: Assessing the Expertise of Major Contributors in OpenStreetMap Based on Contributing Behaviors. ISPRS Int. J. Geo-Inf. 2016, 5, 21. [Google Scholar] [CrossRef]
- Su, S.; Lei, C.; Li, A.; Pi, J.; Cai, Z. Coverage Inequality and Quality of Volunteered Geographic Features in Chinese Cities: Analyzing the Associated Local Characteristics Using Geographically Weighted Regression. Appl. Geogr. 2017, 78, 78–93. [Google Scholar] [CrossRef]
- Mullen, W.F.; Jackson, S.P.; Croitoru, A.; Crooks, A.; Stefanidis, A.; Agouris, P. Assessing the Impact of Demographic Characteristics on Spatial Error in Volunteered Geographic Information Features. GeoJournal 2015, 80, 587–605. [Google Scholar] [CrossRef]
- Stephens, M. Gender and the GeoWeb: Divisions in the Production of User-Generated Cartographic Information. GeoJournal 2013, 78, 981–996. [Google Scholar] [CrossRef]
- Gardner, Z.; Mooney, P.; De Sabbata, S.; Dowthwaite, L. Quantifying Gendered Participation in OpenStreetMap: Responding to Theories of Female (under) Representation in Crowdsourced Mapping. GeoJournal 2020, 85, 1603–1620. [Google Scholar] [CrossRef]
- Sharifi, A.; Khavarian-Garmsir, A.R.; Kummitha, R.K.R. Contributions of Smart City Solutions and Technologies to Resilience against the COVID-19 Pandemic: A Literature Review. Sustainability 2021, 13, 8018. [Google Scholar] [CrossRef]
- Patel, J.A.; Nielsen, F.B.H.; Badiani, A.A.; Assi, S.; Unadkat, V.A.; Patel, B.; Ravindrane, R.; Wardle, H. Poverty, Inequality and COVID-19: The Forgotten Vulnerable. Public Health 2020, 183, 110–111. [Google Scholar] [CrossRef] [PubMed]
- Robinson, O. COVID-19 Lockdown Policies: An Interdisciplinary Review. SSRN J. 2021. [Google Scholar] [CrossRef]
- Hussain, M.W.; Mirza, T.; Hassan, M.M. Impact of COVID-19 Pandemic on the Human Behavior. Int. J. Educ. Manag. Eng. 2020, 10, 35–61. [Google Scholar] [CrossRef]
- Zhang, N.; Jia, W.; Lei, H.; Wang, P.; Zhao, P.; Guo, Y.; Dung, C.-H.; Bu, Z.; Xue, P.; Xie, J.; et al. Effects of Human Behavior Changes During the Coronavirus Disease 2019 (COVID-19) Pandemic on Influenza Spread in Hong Kong. Clin. Infect. Dis. 2021, 73, e1142–e1150. [Google Scholar] [CrossRef]
- Croucher, S.M.; Nguyen, T.; Rahmani, D. Prejudice toward Asian Americans in the COVID-19 Pandemic: The Effects of Social Media Use in the United States. Front. Commun. 2020, 5, 39. [Google Scholar] [CrossRef]
- Depoux, A.; Martin, S.; Karafillakis, E.; Preet, R.; Wilder-Smith, A.; Larson, H. The Pandemic of Social Media Panic Travels Faster than the COVID-19 Outbreak; Oxford University Press: New York, NY, USA, 2020; Volume 27, p. taaa031. ISBN 1195-1982. [Google Scholar]
- Gupta, A.; Sukumaran, R.; John, K.; Teki, S. Hostility Detection and Covid-19 Fake News Detection in Social Media. arXiv 2021, arXiv:2101.05953. [Google Scholar] [CrossRef]
- Crimmins, T.M.; Posthumus, E.; Schaffer, S.; Prudic, K.L. COVID-19 Impacts on Participation in Large Scale Biodiversity-Themed Community Science Projects in the United States. Biol. Conserv. 2021, 256, 109017. [Google Scholar] [CrossRef]
- Kishimoto, K.; Kobori, H. COVID-19 Pandemic Drives Changes in Participation in Citizen Science Project “City Nature Challenge” in Tokyo. Biol. Conserv. 2021, 255, 109001. [Google Scholar] [CrossRef]
- Mooney, P.; Grinberger, A.Y.; Minghini, M.; Coetzee, S.; Juhasz, L.; Yeboah, G. OpenStreetMap Data Use Cases during the Early Months of the COVID-19 Pandemic. In COVID-19 Pandemic, Geospatial Information, and Community Resilience; CRC Press: Boca Raton, FL, USA, 2021; pp. 171–186. [Google Scholar]
- Grinberger, A.Y.; Minghini, M.; Juhász, L.; Yeboah, G.; Mooney, P. OSM Science—The Academic Study of the OpenStreetMap Project, Data, Contributors, Community, and Applications. ISPRS Int. J. Geo-Inf. 2022, 11, 230. [Google Scholar] [CrossRef]
- Mahajan, V.; Cantelmo, G.; Antoniou, C. Explaining Demand Patterns during COVID-19 Using Opportunistic Data: A Case Study of the City of Munich. Eur. Transp. Res. Rev. 2021, 13, 26. [Google Scholar] [CrossRef]
- Mishra, S.; Singh, N.; Bhattacharya, D. Application-Based COVID-19 Micro-Mobility Solution for Safe and Smart Navigation in Pandemics. ISPRS Int. J. Geo-Inf. 2021, 10, 571. [Google Scholar] [CrossRef]
- Solomon, G.; Sutton, D.; Polat Kayali, M.; Yuan, X.; Gardner, Z.; Basiri, A. Evaluating Geotemporal Behaviours of OpenStreetMap Contributors. Agil. GIScience Ser. 2024, 5, 14. [Google Scholar] [CrossRef]
- Minghini, M.; Sarretta, A.; Napolitano, M. OpenStreetMap Contribution to Local Data Ecosystems in COVID-19 Times: Experiences and Reflections from the Italian Case. Data 2022, 7, 39. [Google Scholar] [CrossRef]
- Herfort, B.; Lautenbach, S.; Porto de Albuquerque, J.; Anderson, J.; Zipf, A. The Evolution of Humanitarian Mapping within the OpenStreetMap Community. Sci. Rep. 2021, 11, 3037. [Google Scholar] [CrossRef]
- Ye, J.; Hai, J.; Wang, Z.; Wei, C.; Song, J. Leveraging Natural Language Processing and Geospatial Time Series Model to Analyze COVID-19 Vaccination Sentiment Dynamics on Tweets. Jamia Open 2023, 6, ooad023. [Google Scholar] [CrossRef]
- Dong, E.; Du, H.; Gardner, L. An Interactive Web-Based Dashboard to Track COVID-19 in Real Time. Lancet Infect. Dis. 2020, 20, 533–534. [Google Scholar] [CrossRef]
- Census Bureau Profiles Results. Available online: https://data.census.gov/profile/New_York_city,_New_York?g=160XX00US3651000 (accessed on 15 November 2025).
- Mayor Adams Celebrates Two Consecutive Years of Population Growth in New York City. Available online: https://www.nyc.gov/mayors-office/news/2025/03/mayor-adams-celebrates-two-consecutive-years-population-growth-new-york-city (accessed on 15 November 2025).
- Girres, J.F.; Touya, G. Quality Assessment of the French OpenStreetMap Dataset. Trans. GIS 2010, 14, 435–459. [Google Scholar] [CrossRef]
- Hale, T.; Angrist, N.; Goldszmidt, R.; Kira, B.; Petherick, A.; Phillips, T.; Webster, S.; Cameron-Blake, E.; Hallas, L.; Majumdar, S.; et al. A Global Panel Database of Pandemic Policies (Oxford COVID-19 Government Response Tracker). Nat. Hum. Behav. 2021, 5, 529–538. [Google Scholar] [CrossRef] [PubMed]
- Rajput, A.A.; Li, Q.; Gao, X.; Mostafavi, A. Revealing Critical Characteristics of Mobility Patterns in New York City during the Onset of COVID-19 Pandemic. Front. Built Environ. 2021, 7, 654409. [Google Scholar] [CrossRef]
- Yi, S.S.; Ali, S.H.; Russo, R.G.; Foster, V.; Radee, A.; Chong, S.; Tsui, F.; Kranick, J.; Lee, D.; Imbruce, V.; et al. COVID-19 Leads to Dramatic Changes in the Food Retail Environment in New York City: May–July 2020. J. Immigr. Minor. Health 2022, 24, 31–37. [Google Scholar] [CrossRef] [PubMed]
- Wang, D.; Zuo, F.; Gao, J.; He, Y.; Bian, Z.; Duran, S.; Na, C.; Wang, J.; Petinos, J.; Ozbay, K.; et al. Agent-Based Simulation Model and Deep Learning Techniques to Evaluate and Predict Transportation Trends around COVID-19. arXiv 2020, arXiv:2010.09648. [Google Scholar] [CrossRef]
- Ponciano, L.; Brasileiro, F. Finding Volunteers’ Engagement Profiles in Human Computation for Citizen Science Projects. Hum. Comput. 2014, 1, 245–264. [Google Scholar] [CrossRef]
- Aristeidou, M.; Scanlon, E.; Sharples, M. Profiles of Engagement in Online Communities of Citizen Science Participation. Comput. Hum. Behav. 2017, 74, 246–256. [Google Scholar] [CrossRef]
- Flury, B.K.; Riedwyl, H. Standard Distance in Univariate and Multivariate Analysis. Am. Stat. 1986, 40, 249–251. [Google Scholar] [CrossRef]
- Xu, J.; Zhou, Q. Temporal-Spatial Analysis of Contributors’ Mapping Behavior for Building Data in OpenStreetMap. Proc. Int. Cartogr. Assoc. 2019, 2, 149. [Google Scholar] [CrossRef]
- Brandes, U. A Faster Algorithm for Betweenness Centrality. J. Math. Sociol. 2001, 25, 163–177. [Google Scholar] [CrossRef]
- Freeman, L.C. Centrality in Social Networks Conceptual Clarification. Soc. Netw. 1978, 1, 215–239. [Google Scholar] [CrossRef]
- Hagberg, A.A.; Schult, D.A.; Swart, P.J. Exploring Network Structure, Dynamics, and Function Using NetworkX. Python Sci. Conf. 2008. [Google Scholar] [CrossRef]
- Cohen, J. Statistical Power Analysis for the Behavioral Sciences; Routledge: London, UK, 2013; ISBN 0-203-77158-3. [Google Scholar]
- Pedregosa, F.; Pedregosa, F.; Varoquaux, G.; Varoquaux, G.; Org, N.; Gramfort, A.; Gramfort, A.; Michel, V.; Michel, V.; Fr, L.; et al. Scikit-Learn: Machine Learning in Python. J. Mach. Learn. Res. 2011, 12, 2825–2830. [Google Scholar]
- Rousseeuw, P.J. Silhouettes: A Graphical Aid to the Interpretation and Validation of Cluster Analysis. J. Comput. Appl. Math. 1987, 20, 53–65. [Google Scholar] [CrossRef]
- Davies, D.L.; Bouldin, D.W. A Cluster Separation Measure. IEEE Trans. Pattern Anal. Mach. Intell. 1979, PAMI-1, 224–227. [Google Scholar] [CrossRef]
- Durbin, J.; Koopman, S.J. Time Series Analysis by State Space Methods; Oxford University Press: Oxford, UK, 2012. [Google Scholar]


Disclaimer/Publisher’s Note: The statements, opinions and data contained in all publications are solely those of the individual author(s) and contributor(s) and not of MDPI and/or the editor(s). MDPI and/or the editor(s) disclaim responsibility for any injury to people or property resulting from any ideas, methods, instructions or products referred to in the content. |
© 2026 by the authors. Published by MDPI on behalf of the International Society for Photogrammetry and Remote Sensing. Licensee MDPI, Basel, Switzerland. This article is an open access article distributed under the terms and conditions of the Creative Commons Attribution (CC BY) license.