1. Introduction
With the rapid proliferation of mobile devices, location-based social networks (LBSNs) such as Foursquare, Gowalla, and Yelp have enabled users to record and share their check-ins at Points of Interest (POIs) in real time [
1,
2,
3,
4]. These massive check-in datasets provide valuable behavioral signals that reflect users’ mobility patterns and location preferences, which are highly useful for personalized POI recommendations. Predicting the next POI that a user is likely to visit can enhance travel convenience, improve user experience, and support location-based marketing and business decision making [
5,
6]. In contrast to conventional item recommendation, the next POI recommendation is inherently constrained by physical space and temporal dynamics. User decisions are bounded by geographical distance and travel feasibility, making mobility behaviors spatially restricted rather than freely selectable. Moreover, POI visits are strongly sequential and context-dependent, with the next destination influenced by recent transitions and temporal routines rather than by static long-term preferences alone. In addition, users can visit only a limited number of locations within finite time windows, resulting in highly sparse, uneven interaction signals. These characteristics make the next POI recommendation a spatiotemporally constrained mobility modeling problem rather than a standard preference matching task [
7,
8].
Extensive studies have been conducted on POI recommendation, resulting in a variety of effective approaches. Existing methods can generally be grouped into three categories: traditional recommendation-based models [
9], deep learning-based approaches [
10,
11,
12], and graph neural network (GNN)-based methods [
13,
14,
15,
16,
17]. Early studies primarily employed matrix factorization or Markov-chain-based approaches, which captured only low-order dependencies and overlooked long-term user intent. These methods first project users, POIs, and contextual information into a shared latent space, where prediction scores are computed via inner products, and the final recommendations are generated based on the estimated scores. Later, sequential neural models based on recurrent and transformer architectures have been proposed to more effectively capture temporal dependencies and contextual features [
18,
19]. However, deep learning-based POI recommendation methods typically focus on mining sequential information from POI visit data while overlooking the modeling of interaction information embedded in the data, which may limit recommendation performance. In addition to modeling local sequential dependencies, graph-based methods employ graph neural networks (GNNs) to learn global relational structures between users and POIs from the entire set of historical trajectories. Recent advances in next-POI recommendation have increasingly recognized the importance of collaborative signals across users. Several studies incorporate user-level correlations through social networks [
20], co-visitation statistics [
16], or trajectory similarity measures [
17]. In practice, users with similar mobility routines—such as recurrent commuting paths, comparable temporal visiting habits, or overlapping functional regions—often exhibit consistent transition preferences beyond isolated trajectory segments. For example, social-aware models leverage explicit friendship graphs to propagate preferences among connected users, while similarity-based approaches compute behavioral proximity (e.g., trajectory overlap or mobility pattern similarity) to enhance representation learning. These methods demonstrate that cross-user information can effectively alleviate sparsity and improve prediction robustness.
However, most existing strategies treat user similarity as an auxiliary signal rather than a first-class structural component. In many models, similarity is used only for neighbor selection, feature augmentation, or shallow aggregation and is not tightly coupled with the global graph representation learning process. As a result, collaborative relations among users are often weakly integrated with POI transition structures and temporal dynamics. This decoupled modeling paradigm limits the ability to capture global behavioral regularities that emerge from shared mobility routines. From a structural perspective, user similarity naturally forms a graph topology, where edges encode behavioral proximity derived from historical trajectories. Instead of employing similarity merely as a weighting mechanism, it can be explicitly modeled as a user–user graph and jointly optimized with POI transition graphs. Such integration enables information propagation across both inter-user and inter-POI dimensions, allowing collaborative patterns and spatial–temporal dependencies to interact within a unified representation space.
To address the above limitations, we propose UPTRec, a unified graph learning framework that jointly models user similarity, POI transition structures, and continuous temporal dynamics. Instead of treating these components as loosely connected modules, UPTRec integrates them within a coherent representation space, enabling information propagation across inter-user and inter-POI relations. Specifically, we construct a behavior-driven user similarity graph to encode global collaborative proximity, alongside a flow-based POI transition graph to capture structural mobility dependencies. Continuous temporal representations are further incorporated to model nonlinear and periodic temporal effects. By jointly optimizing these components within a Transformer-based architecture, UPTRec effectively bridges collaborative regularities and fine-grained spatiotemporal transitions for next-POI prediction.
Our main contributions are summarized as follows:
We design a user similarity graph learning module that utilizes TF-IDF-based behavioral similarity to construct the graph structure and derive user embeddings via Graph Convolutional Networks (GCNs). This design effectively captures implicit collaborative signals often overlooked in traditional sequence recommendation models.
We propose a fine-grained temporal embedding mechanism that integrates Time2Vec encoding with weekday/weekend discrimination, enabling the model to capture complex periodicity and nonlinear temporal regularities in user mobility.
We develop UPTRec, an integrated framework that unifies user graph learning, POI transition modeling, and temporal context encoding within a Transformer architecture. Extensive experiments under unified data splits and evaluation metrics show that UPTRec consistently outperforms strong baseline models.
The remainder of this paper is organized as follows:
Section 2 reviews related work on POI recommendation.
Section 3 defines the problem and introduces notations.
Section 4 elaborates on the framework details of UPTRec.
Section 5 presents the experimental settings, comparative results, and ablation studies. Finally,
Section 6 concludes the paper and outlines future work.
3. Problem Formulation
3.1. Problem Definition
We formalize the next-POI recommendation task as follows: given a target user’s historical check-in sequence and potentially current context, the goal is to predict a ranked list of top-k POIs that the user is most likely to visit next.
3.2. Notations and Definitions
Let denote the set of users, and denote the set of Points of Interests (POIs), where and are the total numbers of users and POIs, respectively. Each POI is characterized by its latitude, longitude, category, and visit frequency, denoted as , where indicates the POI category (e.g., bar, restaurant, mall, or station). Let be the set of all check-in records, where each record consists of a user , a POI , and the corresponding timestamp . For each user , their check-ins are divided into multiple trajectories according to temporal continuity, forming a trajectory set , where each trajectory represents a chronologically ordered sequence of check-ins made by . Based on these definitions, a user similarity graph and a POI transition graph are constructed to capture behavioral and spatial–temporal relationships. In , each node represents a user, and an undirected edge indicates that users and exhibit similar visiting preferences or mobility patterns. In , each node represents a POI, and a directed edge exists if a POI is visited immediately after , within the same trajectory of a user. The edge weight reflects the aggregated transition frequency across all trajectories, capturing local sequential dependencies between POIs.
The model input consists of users’ trajectory-based check-in sequences and possibly contextual factors such as time and category, while the output is a ranked list of POIs that the user is most likely to visit next.
4. Methodology
4.1. UPTRec Framework
We propose UPTRec, a unified model for next-POI recommendation that integrates user similarity, POI transitions, and temporal context.
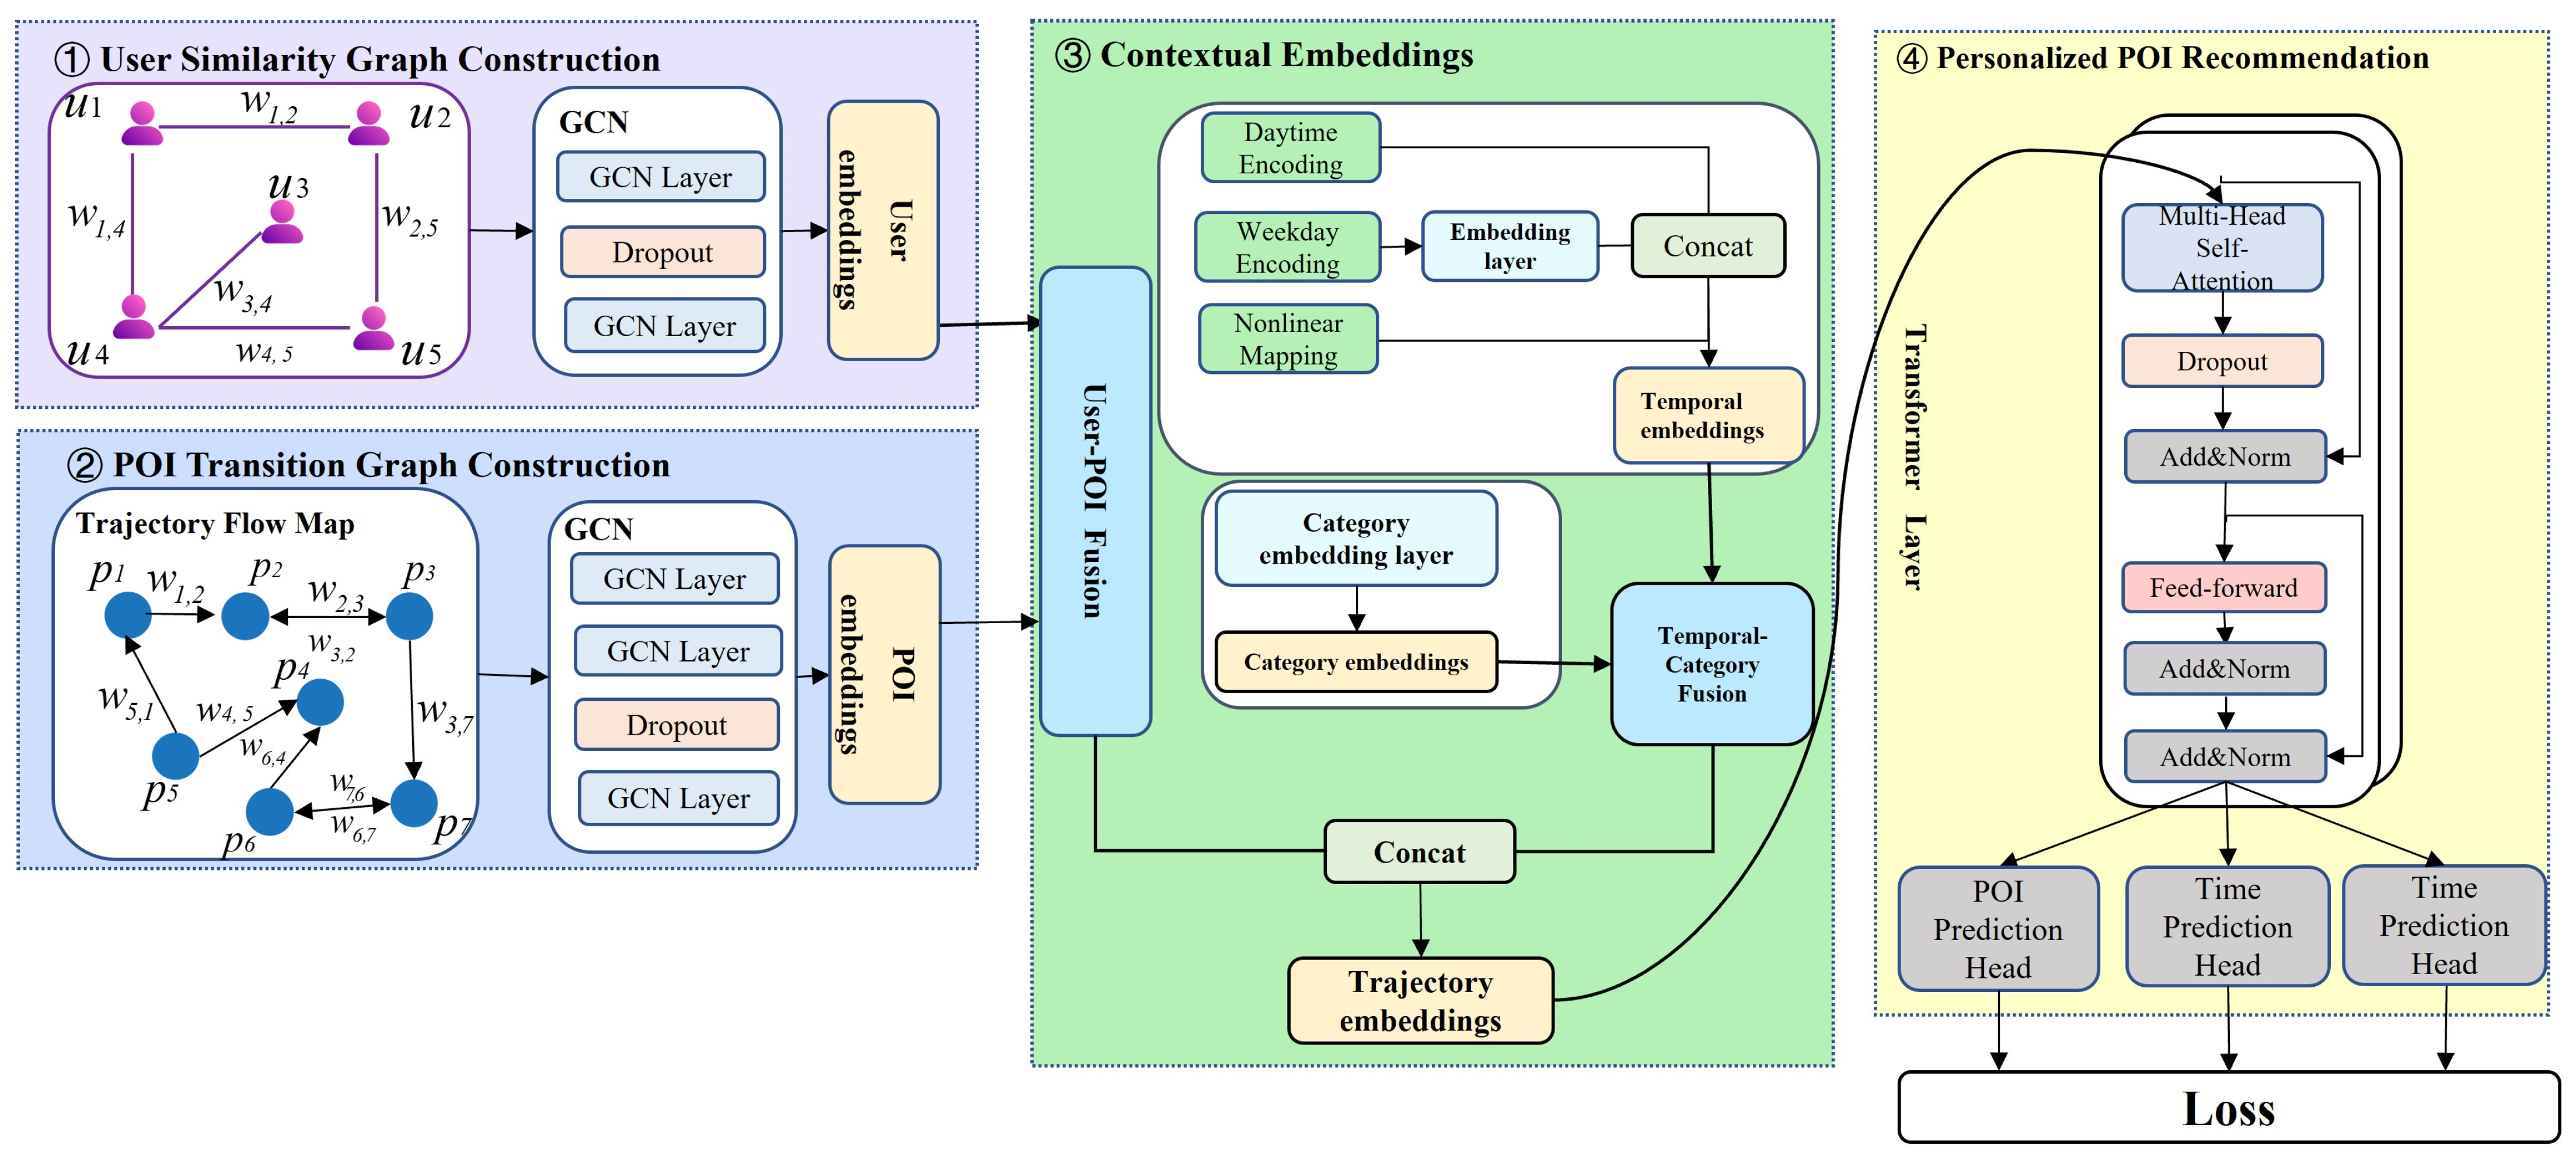
Figure 1 shows the overall architecture of UPTRec. The framework combines information from a user similarity graph, a POI transition graph, and time features, processed through GCNs and a Transformer, to predict the next POI.
In summary, the model consists of three main components:
User and POI Embedding Learning Module, which uses GCNs to learn embeddings on the user–user graph and POI–POI graph, capturing structured similarities among users and transition patterns among POIs.
Context Information Modeling Module, which incorporates temporal embeddings (time of day, weekday/weekend) and POI category embeddings to capture time-dependent behaviors and semantic information of POIs.
Trajectory Representation and Prediction Module, which uses a Transformer encoder to model the sequence of check-ins (the trajectory) and a prediction layer (with an MLP) to estimate the probability distribution of the next POI.
4.2. User Similarity Graph Construction
In many existing next-POI frameworks, collaborative information across users is typically incorporated indirectly through shared POI interactions or sequential co-occurrence patterns. Under such formulations, user representations are primarily derived from individual trajectories or user–POI interaction structures, while cross-user behavioral proximity does not explicitly participate in representation propagation.
In this work, we explicitly model user–user latent similarity as a structural component of the learning graph. Constructing the user similarity graph prior to graph convolutional layers modifies the model’s message-passing topology. Instead of restricting embedding updates to user–POI interaction paths, each user node directly aggregates representations from behaviorally proximate users at every convolution layer. This structural augmentation expands the receptive field and induces representation smoothing. Consequently, collaborative inductive bias is injected throughout the evolution of the representation rather than applied only at the final prediction stage.
From a representation-learning perspective, this early structural integration enforces smoothness across similar users during message passing, leading to a more coherent embedding space in which users with aligned long-term preferences are encouraged to share latent representations. We construct a user similarity graph
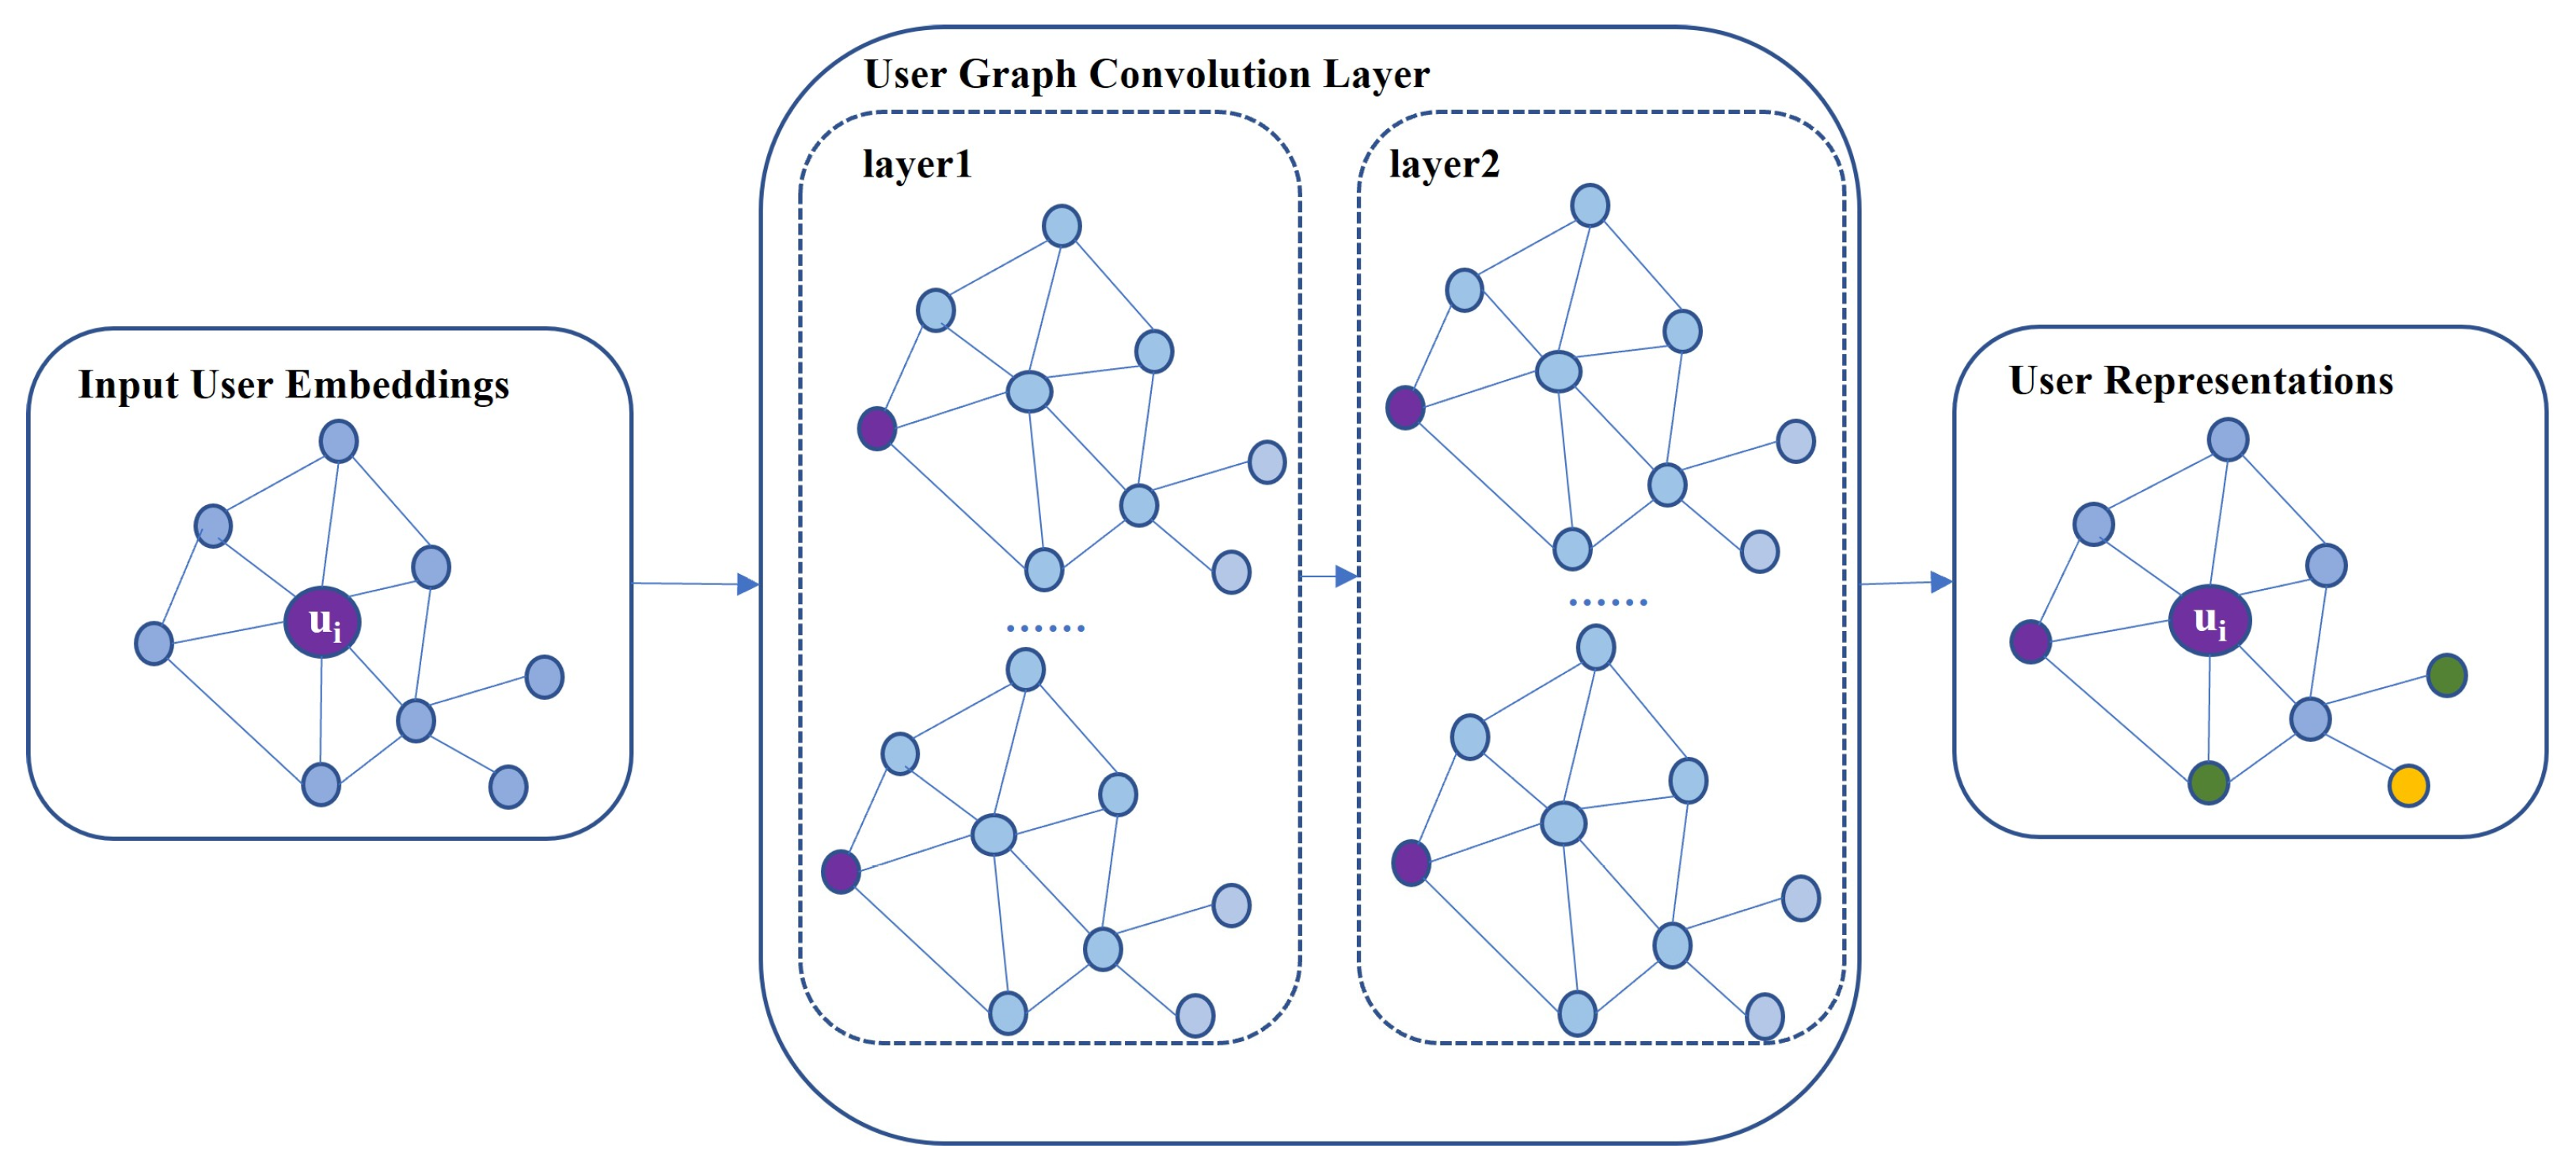
, where nodes represent users and edges denote similarity relationships derived from historical check-in behavior. Based on the constructed graph, user embeddings are initialized and subsequently refined through user graph convolution, allowing each user representation to be influenced not only by their own check-ins but also by those of similar users (
Figure 2).
4.2.1. User Similarity Computation
We first construct an undirected, weighted graph in which each node represents a user. Users with identical interests often visit the same POIs (e.g., a specific jazz bar) at disjoint times due to varying schedules. Forcing rigid temporal alignment fails to capture such long-term preference similarity. Therefore, we adopt a set-based metric that prioritizes semantic interest profiles over temporal coincidence.
A critical challenge in this process is global popularity bias. To mitigate this bias, we adopt TF-IDF weighting to re-scale user–POI interactions. From a behavioral perspective, frequent visits to globally popular POIs (e.g., transit hubs or landmarks) are less indicative of personalized preference alignment. TF-IDF naturally suppresses such ubiquitous locations while amplifying discriminative mobility signals. This adjustment allows the similarity metric to emphasize semantically meaningful co-visitation patterns rather than raw popularity overlap [
2]. Simple co-visitation counts tend to overemphasize popular transit hubs (e.g., central stations), making users appear more similar simply because they visit these high-frequency locations. We employ cosine similarity to measure behavioral proximity, as it captures distributional alignment rather than absolute frequency similarity. In mobility data, users may differ substantially in overall activity intensity while sharing similar preference distributions. Cosine similarity is scale-invariant and thus better suited to sparse LBSN settings compared to Euclidean distance or raw overlap metrics [
27].
Let
be the user–POI frequency matrix, where each entry
represents the number of times the user
visited POI
. The visit frequency vector for user
is
To emphasize distinctive POIs and reduce the effect of popular locations, we compute a TF-IDF weight for each user–POI pair:
Accordingly, each user can be represented by a TF-IDF vector:
To avoid constructing a densely connected and noisy similarity graph, we retain only the top-k neighbors for each user. This sparsification serves as a structural regularization mechanism, preserving local behavioral neighborhoods while preventing over-smoothing in graph convolution. We keep the
most similar users for each
as neighbors, forming a sparse adjacency matrix:
we set
based on our sensitivity analysis (detailed in
Section 5.4.1), which indicates that this threshold optimizes the trade-off between incorporating sufficient collaborative signals and avoiding the introduction of noisy, weakly correlated neighbors. We further average the matrix with its transpose to ensure symmetry:
This guarantees that the adjacency matrix is symmetric, meaning that if considers a neighbor, then is also connected to with the same weight.
4.2.2. Learning User Embeddings with GCN
After constructing the user similarity graph
, we apply a Graph Convolutional Network to learn low-dimensional embeddings. Let
be the initial feature matrix (trainable ID embeddings), where
is the number of users and d represents the dimensionality of the initial user features. To preserve self-information during message passing, we add self-loops to the user graph, yielding the adjusted adjacency matrix:
where
is the
identity matrix. Let
be the degree matrix of
, whose diagonal elements are computed as
we then use the normalized adjacency matrix
in the GCN to maintain numerical stability and prevent scale explosion during message propagation. The propagation rule for each GCN layer
is defined as
where
is the matrix of user representations at layer
(with
as the initial features), and
is the trainable weight matrix. This operation transforms each user’s representation by aggregating the representations of its neighbors (and itself) weighted by the normalized adjacency. Intuitively, a user will receive influence from other users who have similar check-in patterns.
We stack such GCN layers. After the final layer, we obtain user embedding vectors for each user . These user embeddings encode information about the user’s own behavior and the behaviors of similar users. They will later be combined with POI embeddings and time embeddings for sequence prediction.
4.3. POI Transition Graph Construction
Users tend to exhibit sequential patterns in their movements—for instance, going from work to a restaurant, then to a movie theater. To model such sequential dependencies, we construct a POI transition graph that captures how POIs are connected through successive visits, and we learn POI embeddings from this graph using a Graph Convolutional Network (GCN).
4.3.1. POI Transition Computation
The POI transition computation is built upon the POI embedding method in the GETNext [
13] model. Concretely, the model defines a directed weighted graph
, where each node
represents a POI. For any two POIs
, we add a directed edge
, if
frequently follows
in a trajectory. The edge weight
is defined as the number of times
appears immediately after
in all user trajectories:
which quantifies the transition frequency from
to
.
4.3.2. Learning POI Embeddings with GCN
After constructing the POI Transition graph
, we represent the transition graph with an adjacency matrix
, where
is the number of POIs. To include self-connections, we add the identity matrix
, yielding
. Let
be the corresponding degree matrix. We then apply a GCN to learn POI embeddings based on this graph structure:
where
denotes the POI features at layer
,
and
are the trainable weight and bias parameters, and ReLU serves as the activation function. The initial input
is constructed from attribute-based vectors.
Through multiple GCN layers, the model aggregates information from neighboring POIs that are directly or indirectly connected in the transition graph. After
layers, we obtain the final
-dimensional POI embedding for each POI
:
These embeddings encode high-order transition dependencies for subsequent trajectory modeling.
4.4. Spatiotemporal Context Embedding
User visit behaviors in POI recommendation exhibit both spatial regularities and temporal dynamics. People often follow periodic routines, and different POI categories show distinct temporal patterns. To capture these dependencies, we design a spatiotemporal context embedding module that integrates user–POI interactions, temporal periodicity, and semantic category information into a unified representation.
4.4.1. User–POI Fusion Embedding
Using a POI’s embedding alone may not fully represent a user’s personalized preferences. Therefore, we fuse the user embedding
(from the user graph) and the POI embedding
(from the POI graph) to form a joint representation for each check-in event
:
where
and
are learnable parameters, and
denotes a nonlinear activation function, such as ReLU. This fused embedding
captures both who the user is and which POI is visited, providing a personalized spatial representation that reflects the user’s latent preferences toward the POI.
4.4.2. Temporal–Category Embedding Fusion
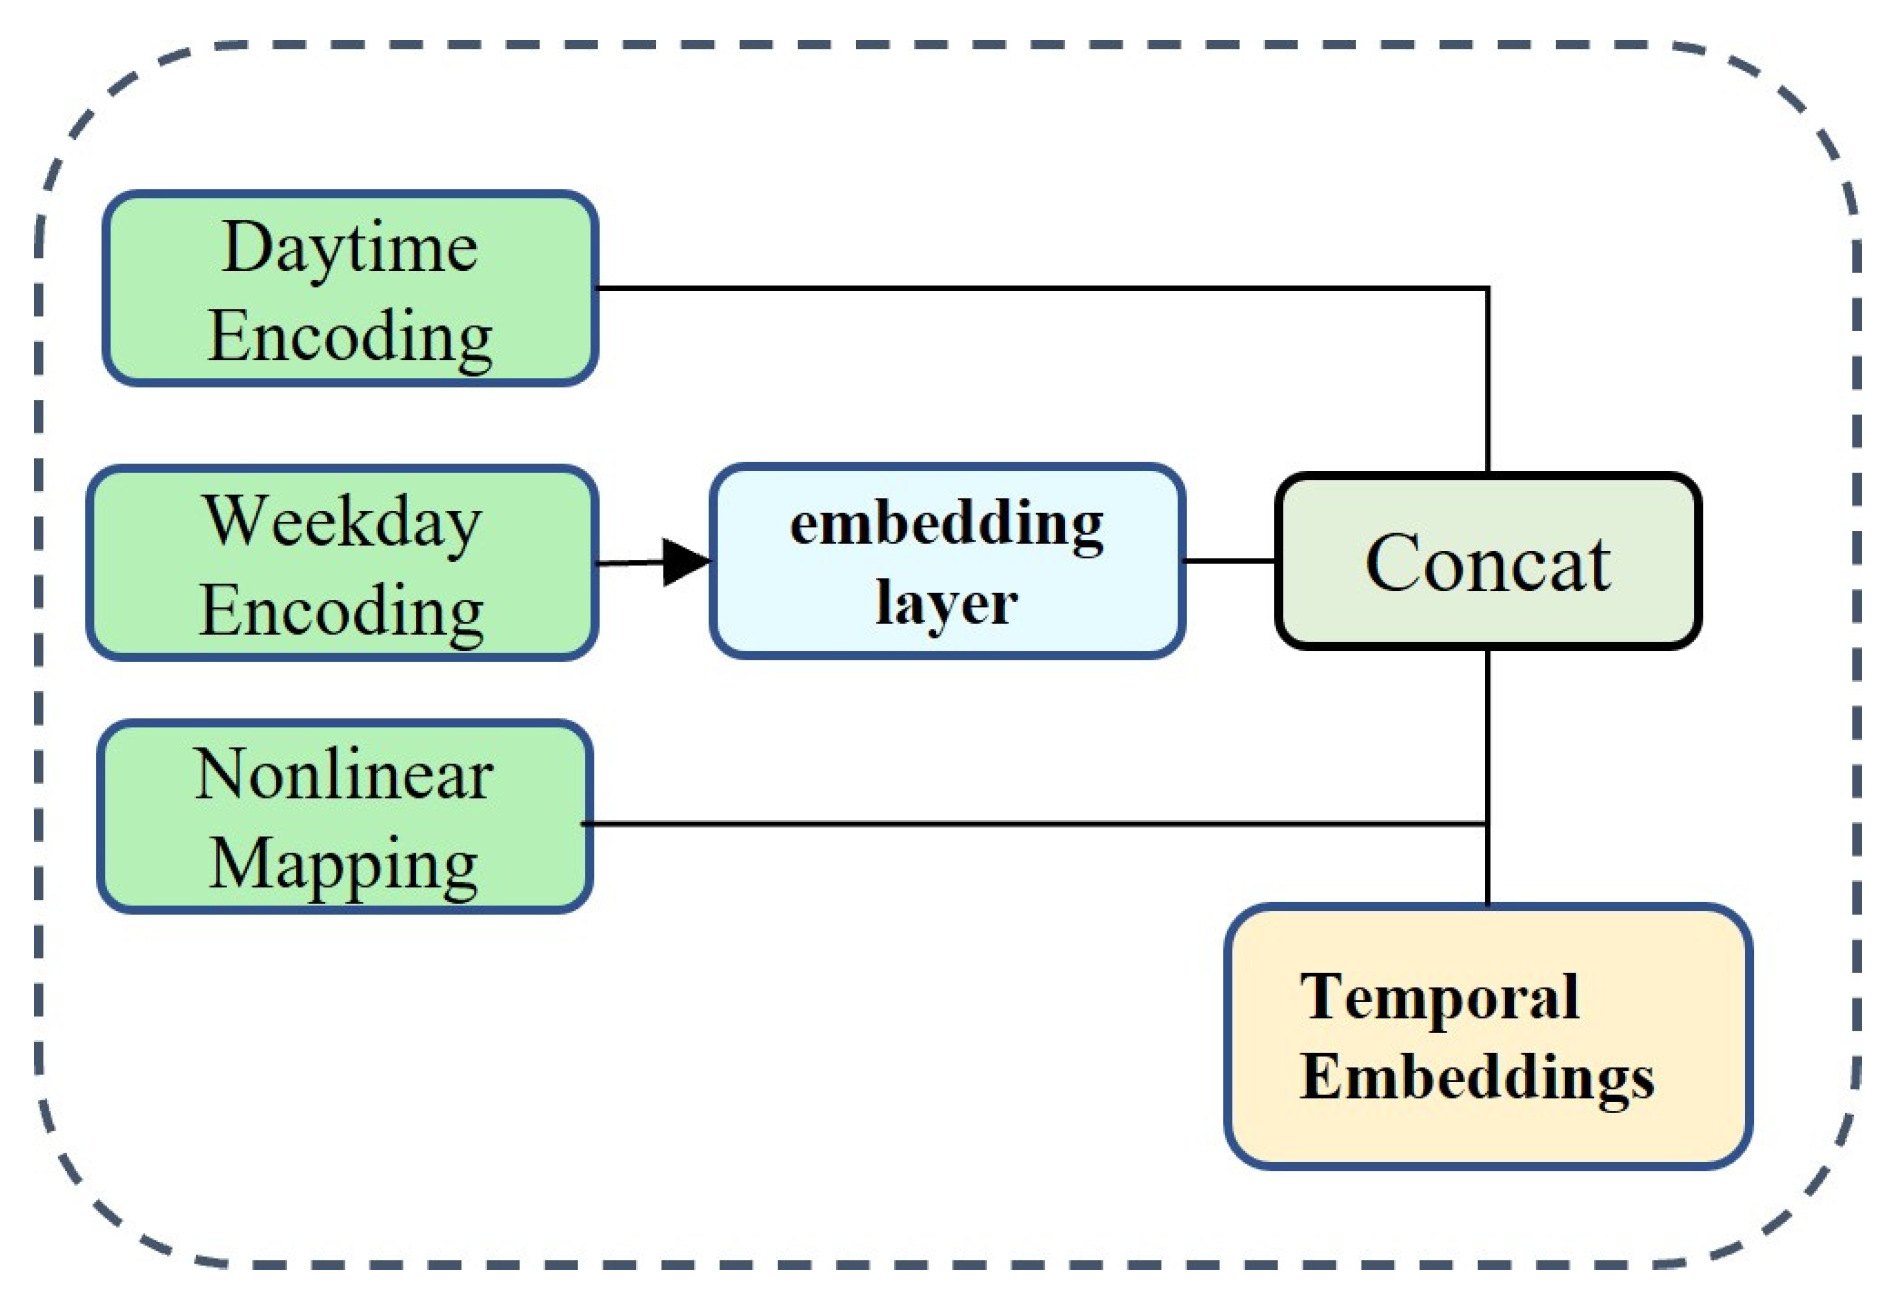
We integrate daily and weekly periodic signals with a nonlinear temporal mapping to model both short-term cycles and long-term temporal trends (
Figure 3). The nonlinear component enhances expressiveness by capturing complex, non-periodic variations beyond simple linear time indices.
Each check-in time
is normalized to
and encoded using an improved Time2Vec (T2V) function that mixes linear and sinusoidal components:
where
and
are learnable parameters. The first term captures linear time progression, while the sinusoidal components represent periodic fluctuations.
To incorporate weekly regularities, we introduce a binary indicator
(1 for weekends, 0 for weekdays) and map it through a small embedding layer:
which outputs a four-dimensional vector that allows the model to distinguish weekday and weekend behaviors.
In addition to periodic signals, users may exhibit irregular or non-periodic time patterns. To capture these variations, we apply a two-layer MLP to the normalized time scalar:
where
,
,
, and
are learned parameters. The three components are concatenated to form a complete time embedding:
in our setup,
is 20 d,
is 4 d, and
is 8 d, yielding a 32-dimensional representation that captures both periodic and non-periodic temporal dynamics.
Each POI also belongs to a semantic category (e.g., food, shopping, and entertainment), which provides valuable contextual information. We assign a trainable embedding to each category:
where
produces a 32-dimensional vector representing the semantic characteristics of each POI category. Finally, we fuse the temporal and categorical representations through a fully connected layer to obtain the overall context embedding:
where
and
are trainable parameters. This context embedding is concatenated with the user–POI representation and fed into the Transformer-based predictor.
4.5. POI Recommendation
To predict the next Point-of-Interest (POI), we employ a Transformer-based sequence encoder [
28] that models a user’s historical check-in trajectory, followed by a multi-layer perceptron (MLP) [
29] decoder for multi-task prediction. This architecture enables UPTRec to capture sequential dependencies while integrating spatial, temporal, and contextual representations learned from previous modules.
4.5.1. Transformer Encoder
Each trajectory is represented as a sequence of check-in records
. For each check-in
, we fuse the user–POI embedding
(from
Section 4.4.1) with the contextual embedding
(from
Section 4.4.2), forming the input representation:
matches the Transformer’s input dimension. Hence, each trajectory can be represented as a sequence of embedding vectors
. This embedding sequence is then fed into a multi-layer Transformer encoder for sequential modeling. The multi-head self-attention mechanism first computes pairwise attention weights among all check-ins to capture their relevance. Specifically, given input matrices of queries
, keys
, and values
, self-attention is computed as
where
are learned projection matrices, and
is the key dimension. Notably, since the input embedding concatenates user–POI and temporal context features, temporal information is incorporated directly into the projections. Consequently, temporal dimensions contribute to the attention score
, influencing how historical check-ins attend to one another. Therefore, the temporal context does not merely act as an appended feature; it reshapes attention weight distributions and dynamically modulates the relative importance of spatial transitions and user-level signals during sequence encoding.
Multi-head attention repeats this operation across heads with different projections, concatenating the results before a linear transformation. The Transformer thus learns context-enhanced representations , where each encodes the temporal and contextual dependencies of the check-in. The last element, , serves as the trajectory-level embedding summarizing the user’s recent behavior.
4.5.2. MLP Decoder and Prediction
We formulate next-POI prediction as a multi-task problem that jointly predicts (1) the next POI, (2) the time of the next check-in, and (3) the category of the next POI. Tasks (2) and (3) act as auxiliary objectives that regularize learning and enhance context awareness.
Let
denote the output corresponding to the last check-in. We apply three independent MLP heads:
where
,
, and
correspond to scores for POI, time, and category, respectively. Each MLP consists of one linear layer mapping from the Transformer’s hidden dimension to its task-specific output.
To improve next-POI prediction, we further incorporate prior knowledge from the POI transition graph. Let
denote the transition weight matrix obtained from the POI GCN and let
be the last visited POI. The prior distribution over possible next POIs is represented by the
row of
, denoted as
. The final next-POI score is computed as
where
is a balancing coefficient controlling the influence of the transition prior. A small
yields a good trade-off between learned predictions and historical transition trends. The
POIs with the highest
values form the final recommendation list.
4.5.3. Loss Function and Optimization
We adopt a multi-task loss to jointly optimize three prediction objectives: next POI, next check-in time, and next POI category. The auxiliary tasks of time and category prediction serve as regularizers, encouraging the model to learn context-aware representations that respect spatiotemporal and semantic constraints. For each trajectory with observed next POI and time, the total loss is defined as
where
,
, and
denote the cross-entropy losses for POI, time, and category. The coefficient
balances the importance of time prediction. In our experiments, we found
, emphasizing that temporal accuracy significantly enhances the model’s overall performance in next-POI recommendation.
The model is trained end-to-end using the Adam optimizer with a learning rate of 0.001 and weight decay of 0.0005. We apply early stopping based on validation loss to prevent overfitting. During evaluation, we report Accuracy and Mean Reciprocal Rank (MRR) on the test set to measure both prediction precision and ranking quality.
5. Experiments and Analysis
5.1. Experimental Settings
We evaluated the proposed model UPTRec on two real-world LBSN datasets: Foursquare and Gowalla. The Foursquare dataset includes long-term check-in records from New York City (NYC) and Tokyo (TKY) collected between April 2012 and September 2013 [
30], while the Gowalla dataset contains global check-ins from a location-based social network, for which we used the California (CA) subset to maintain spatial consistency [
31]. Each record contains user, POI, POI category, GPS coordinates, and timestamp. In preprocessing, we removed users with fewer than 20 check-ins and POIs visited fewer than 20 times in Gowalla and applied a threshold of 10 for the denser Foursquare datasets. Each dataset was then chronologically divided into 80% for training and 20% for testing.
Table 1 summarizes the statistics of the processed datasets. Specifically, the NYC, TKY, and CA datasets contain 1064, 2245, and 5628 users; 5136, 7872, and 31,803 POIs; and 318, 291, and 301 POI categories, respectively. In total, they include 147,939, 447,571, and 620,683 check-ins, forming 14,160, 44,692, and 32,920 user trajectories (
Table 2).
We implemented the model in Python using PyTorch and trained it on a workstation equipped with an Intel Core i9-12900K CPU, 32 GB of RAM, and an NVIDIA RTX 3090 GPU. Model parameters were randomly initialized. The embedding dimension for users and POIs was set to 128, and that for temporal and category features to 32. The user graph GCN module employed two layers with output dimensions of 64 and 128. The POI transition GCN module consisted of three layers with output sizes of 32, 64, and 128, while the Transformer encoder included two stacked layers with a feed-forward size of 1024 and two attention heads. A dropout rate of 0.3 was used to mitigate overfitting, and the model was trained using the Adam optimizer (learning rate = 0.001, weight decay = 0.0005) for up to 200 epochs, with early stopping applied based on validation performance. All other hyperparameters are set as shown in
Table 3.
For evaluation, we adopted two widely used metrics: Accuracy@k (Acc@k) and Mean Reciprocal Rank (MRR). Acc@k measures whether the ground-truth next POI appears within the top-k recommendations, reported at k = 1, 5, and 10. MRR evaluates ranking quality by averaging the reciprocal rank of the true next POI, defined as
where
is the total number of test trajectories, and
denotes the rank position of the actual next POI in the
-th test case. A higher MRR indicates that the model tends to rank the correct POI higher on average. A higher MRR suggests that the model ranks correct POIs higher on average. Together, Acc@k and MRR provide a comprehensive evaluation of both prediction accuracy and ranking quality.
5.2. Baseline Methods
To validate the performance of UPTRec, we compared it with the following eight baseline methods on the Foursquare (NYC, TKY) and Gowalla (CA) datasets. The baselines are selected to represent the major modeling paradigms in next-POI recommendation, including sequential, graph-based, and Graph Transformer hybrid models. This ensures fair comparison across structurally different modeling strategies.
FPMC [
9]: A hybrid model that integrates matrix factorization with first-order Markov chains to capture both user preference and sequential transition patterns.
LSTM [
21]: A standard sequential model using Long Short-Term Memory networks to capture temporal dependencies in user check-in sequences.
STGN [
4]: Extends LSTM with spatial–temporal gating mechanisms that model time intervals and geographic distances between check-ins.
PLSPL [
32]: Combines local sequential behavior and global preference, balancing short-term mobility with long-term user interests.
STAN [
11]: A spatial–temporal attention network that jointly models spatial and temporal dependencies through dual attention.
FPGT [
15]: Proposes a feature-based POI grouping strategy with a Transformer backbone for next-POI recommendation, which avoids explicit graph construction by clustering POIs using geographical and popularity features.
MobGT [
14]: Proposes a graph transformer framework for next-POI recommendation by modeling human mobility as a graph. The model focuses on learning spatial transition patterns via graph-based self-attention to capture mobility dynamics.
GETNext [
13]: A graph-enhanced Transformer that learns POI embeddings through GCN and models sequential transitions with self-attention.
For baseline methods, we adopt official implementations or reported benchmark results when available. When complete experimental results under our data splits are unavailable, the models are implemented based on the original descriptions and evaluated under the same settings as our framework.
5.3. Main Results
All models were trained and evaluated on the NYC, TKY, and CA datasets using Acc@1, Acc@5, Acc@10, and MRR as evaluation metrics.
Table 4,
Table 5 and
Table 6 report the experimental results, where the last row corresponds to our proposed model UPTRec, and the best results in each column are highlighted in bold. Overall, deep learning-based methods, including sequential, attention-based, and graph-based models, consistently outperform the traditional FPMC approach across all datasets, confirming the effectiveness of nonlinear modeling for capturing complex user–POI interaction patterns.
On the NYC dataset, UPTRec achieves the best performance on all metrics, with Acc@1 = 25.76%, Acc@5 = 51.89%, Acc@10 = 64.31%, and MRR = 0.3879, outperforming the strongest baselines such as GETNext. These improvements indicate that UPTRec not only predicts more accurate next POIs but also ranks relevant locations higher in the recommendation list. Similar trends are observed on the TKY dataset, which contains more users and POIs and exhibits more diverse mobility patterns. UPTRec attains Acc@1 = 24.68%, Acc@5 = 46.89%, Acc@10 = 55.21%, and MRR = 0.3421, consistently surpassing all competing methods across evaluation metrics, demonstrating strong generalization ability in dense urban environments.
The CA dataset presents a more challenging scenario due to its broader geographic coverage and higher sparsity. Although the absolute performance of all methods decreases, UPTRec still achieves the best results on Acc@5, Acc@10, and MRR, with values of 31.17%, 38.69%, and 0.2343, respectively. While MobGT slightly outperforms UPTRec on Acc@1, UPTRec maintains superior ranking quality, as reflected by higher-order accuracy metrics and MRR. These results suggest that UPTRec is more effective at producing reliable, well-ranked recommendation lists under sparsity. Overall, the consistent performance gains across datasets can be attributed to the proposed multi-graph and multi-context design, in which the user similarity graph alleviates sparsity, the POI transition graph captures structural mobility patterns, and the temporal embeddings adapt predictions to temporal contexts, highlighting the robustness and adaptability of UPTRec in modeling user mobility across diverse urban scenarios.
5.4. Hyperparameter and Sensitivity Analysis
5.4.1. Sensitivity to User Similarity Metrics
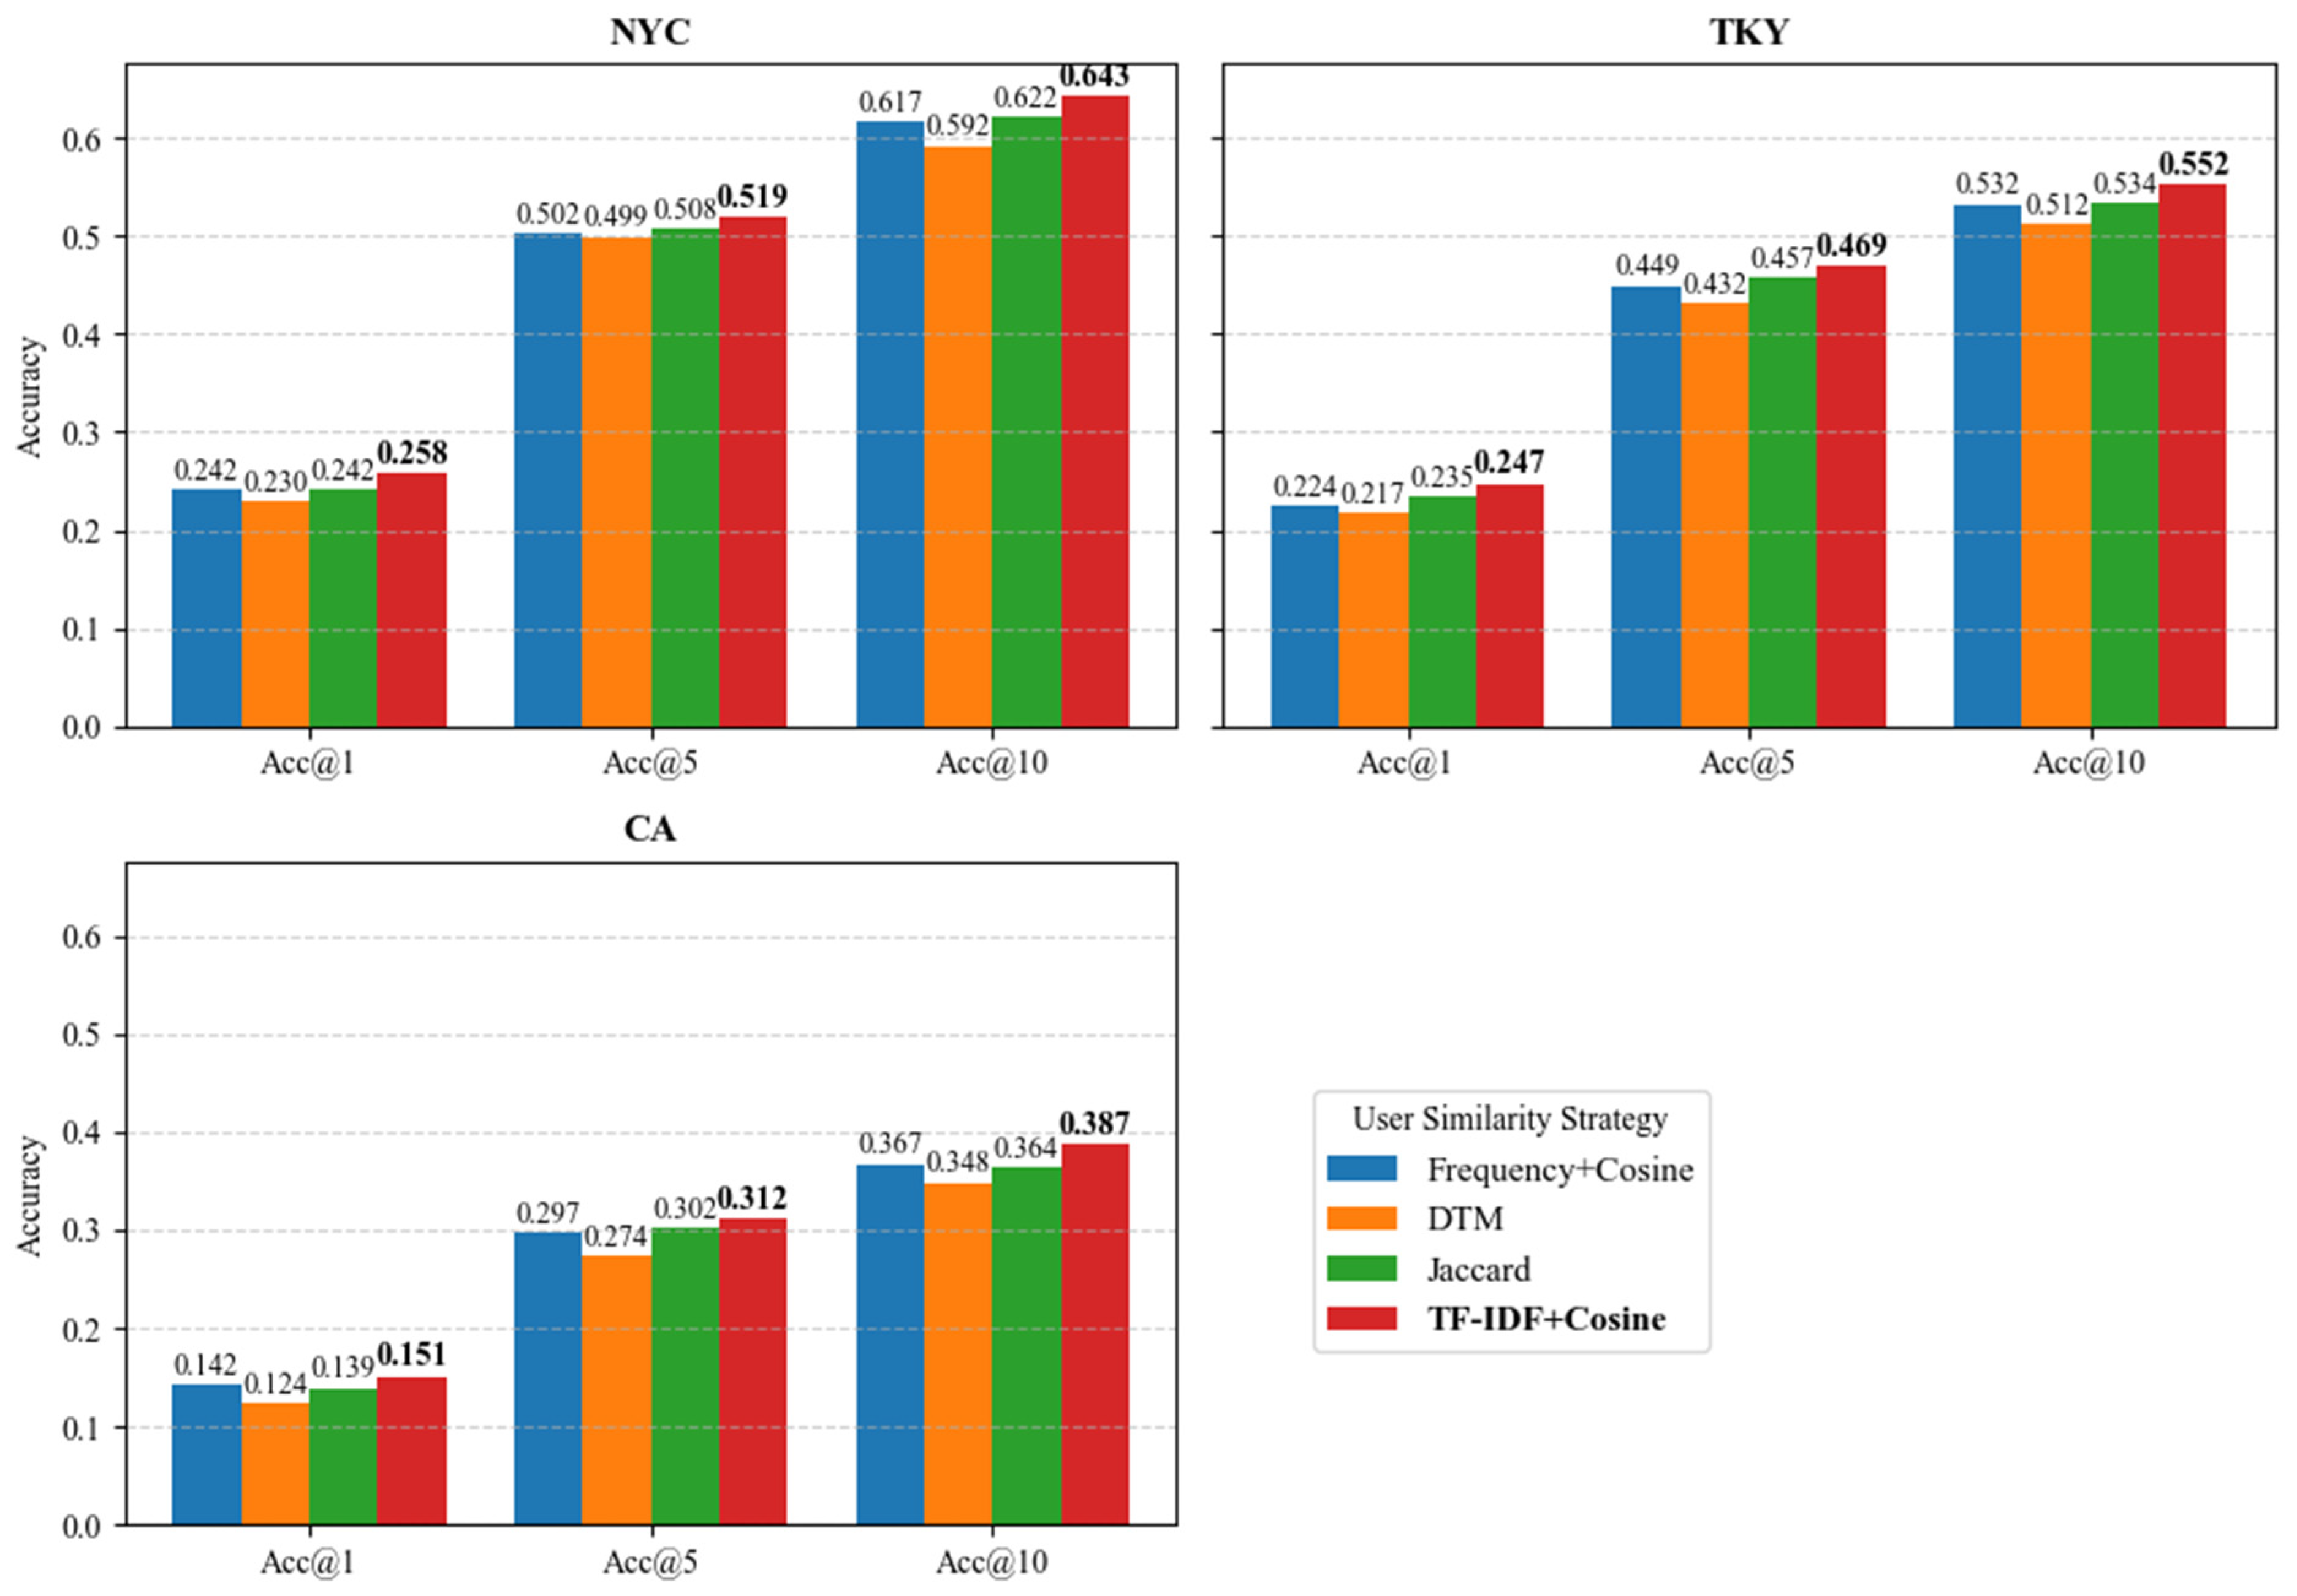
To evaluate the impact of different user similarity metrics on user–user graph construction, we compared four representative approaches under a unified setting: cosine similarity on raw visit-frequency vectors (Frequency + Cosine), Jaccard similarity over visited POI sets, a trajectory-alignment-based DTM metric, and TF–IDF-weighted vectors with cosine similarity. For each metric, the user graph is reconstructed while keeping all other UPTRec components unchanged.
As shown in
Figure 4, TF–IDF + Cosine consistently achieves the best performance across all datasets and evaluation thresholds. Frequency + Cosine and Jaccard yield moderate results, while DTM performs the worst, particularly under sparse settings.
These findings suggest that TF–IDF weighting effectively reduces the influence of globally popular POIs while emphasizing user-specific preferences, and cosine similarity provides a scale-invariant comparison of preference orientations. In contrast, Jaccard similarity ignores frequency information, and DTM is sensitive to variations in trajectory length, making it less robust to sparse and irregular real-world trajectories. Therefore, TF–IDF + Cosine is adopted as the default similarity metric for constructing user graphs in UPTRec.
5.4.2. Temporal Embedding Comparison
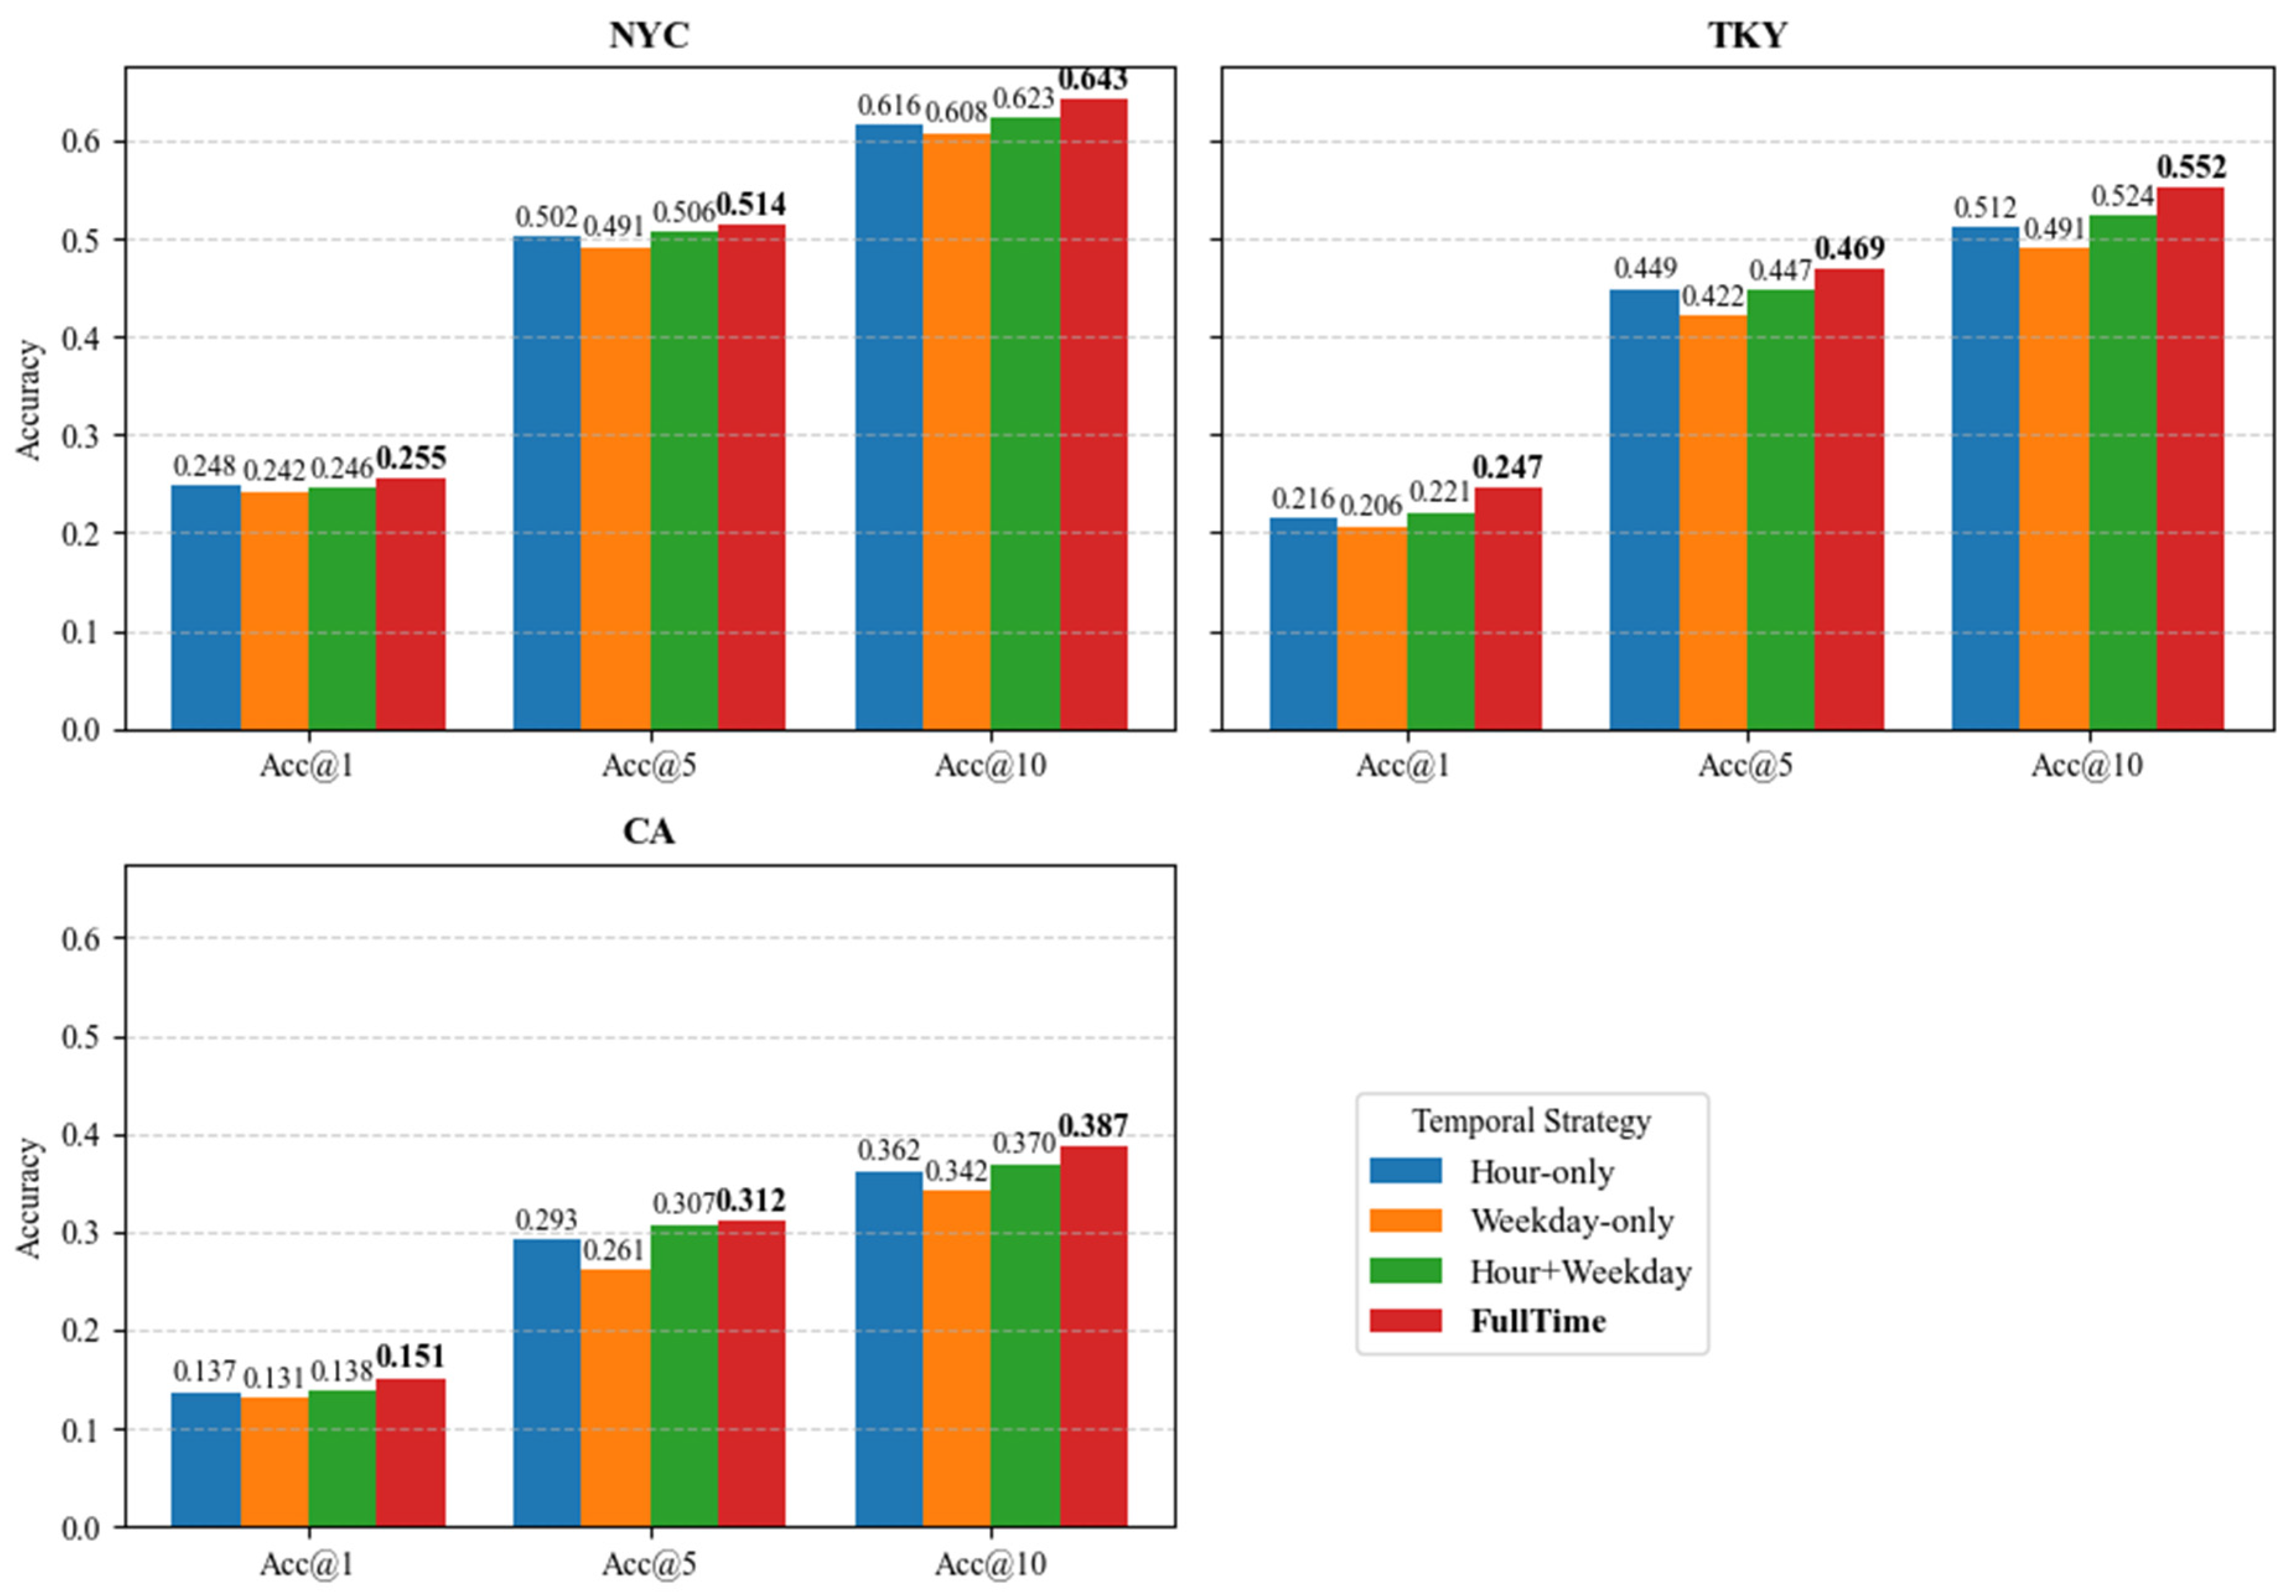
Figure 5 compares four temporal embedding strategies—Hour-only, Weekday-only, Hour + Weekday, and the proposed FullTime module—on the NYC dataset using Acc@1, Acc@5, and Acc@10 as evaluation metrics. As shown in the figure, incorporating temporal information consistently improves next-POI prediction performance. Among the categorical variants, Hour + Weekday outperforms Hour-only and Weekday-only, which is consistent with prior findings that human mobility exhibits both intra-day and weekly regularities [
33].
Across all metrics, the FullTime configuration achieves the best results, improving Acc@1 by 1.3–2.4%, Acc@5 by 2–3.4%, and Acc@10 by 2–3% over the strongest categorical baseline. This performance gain demonstrates that the multi-frequency Time2Vec component captures richer periodic and non-periodic temporal dynamics than simple one-hot encodings. Similar observations have been reported in recent studies, showing that continuous or multi-periodic temporal embeddings substantially enhance sequential and mobility prediction models [
34]. Overall, the results validate the effectiveness of the proposed temporal–category module and highlight the importance of modeling fine-grained temporal structure in next-POI recommendation.
5.4.3. Hyperparameter Analysis
We conducted a hyperparameter analysis to examine the impact of key design choices in UPTRec, including the number of nearest neighbors in the user graph, the depth of GCN encoders, the number of Transformer layers, and embedding dimensions. Each parameter is varied independently while keeping the others fixed.
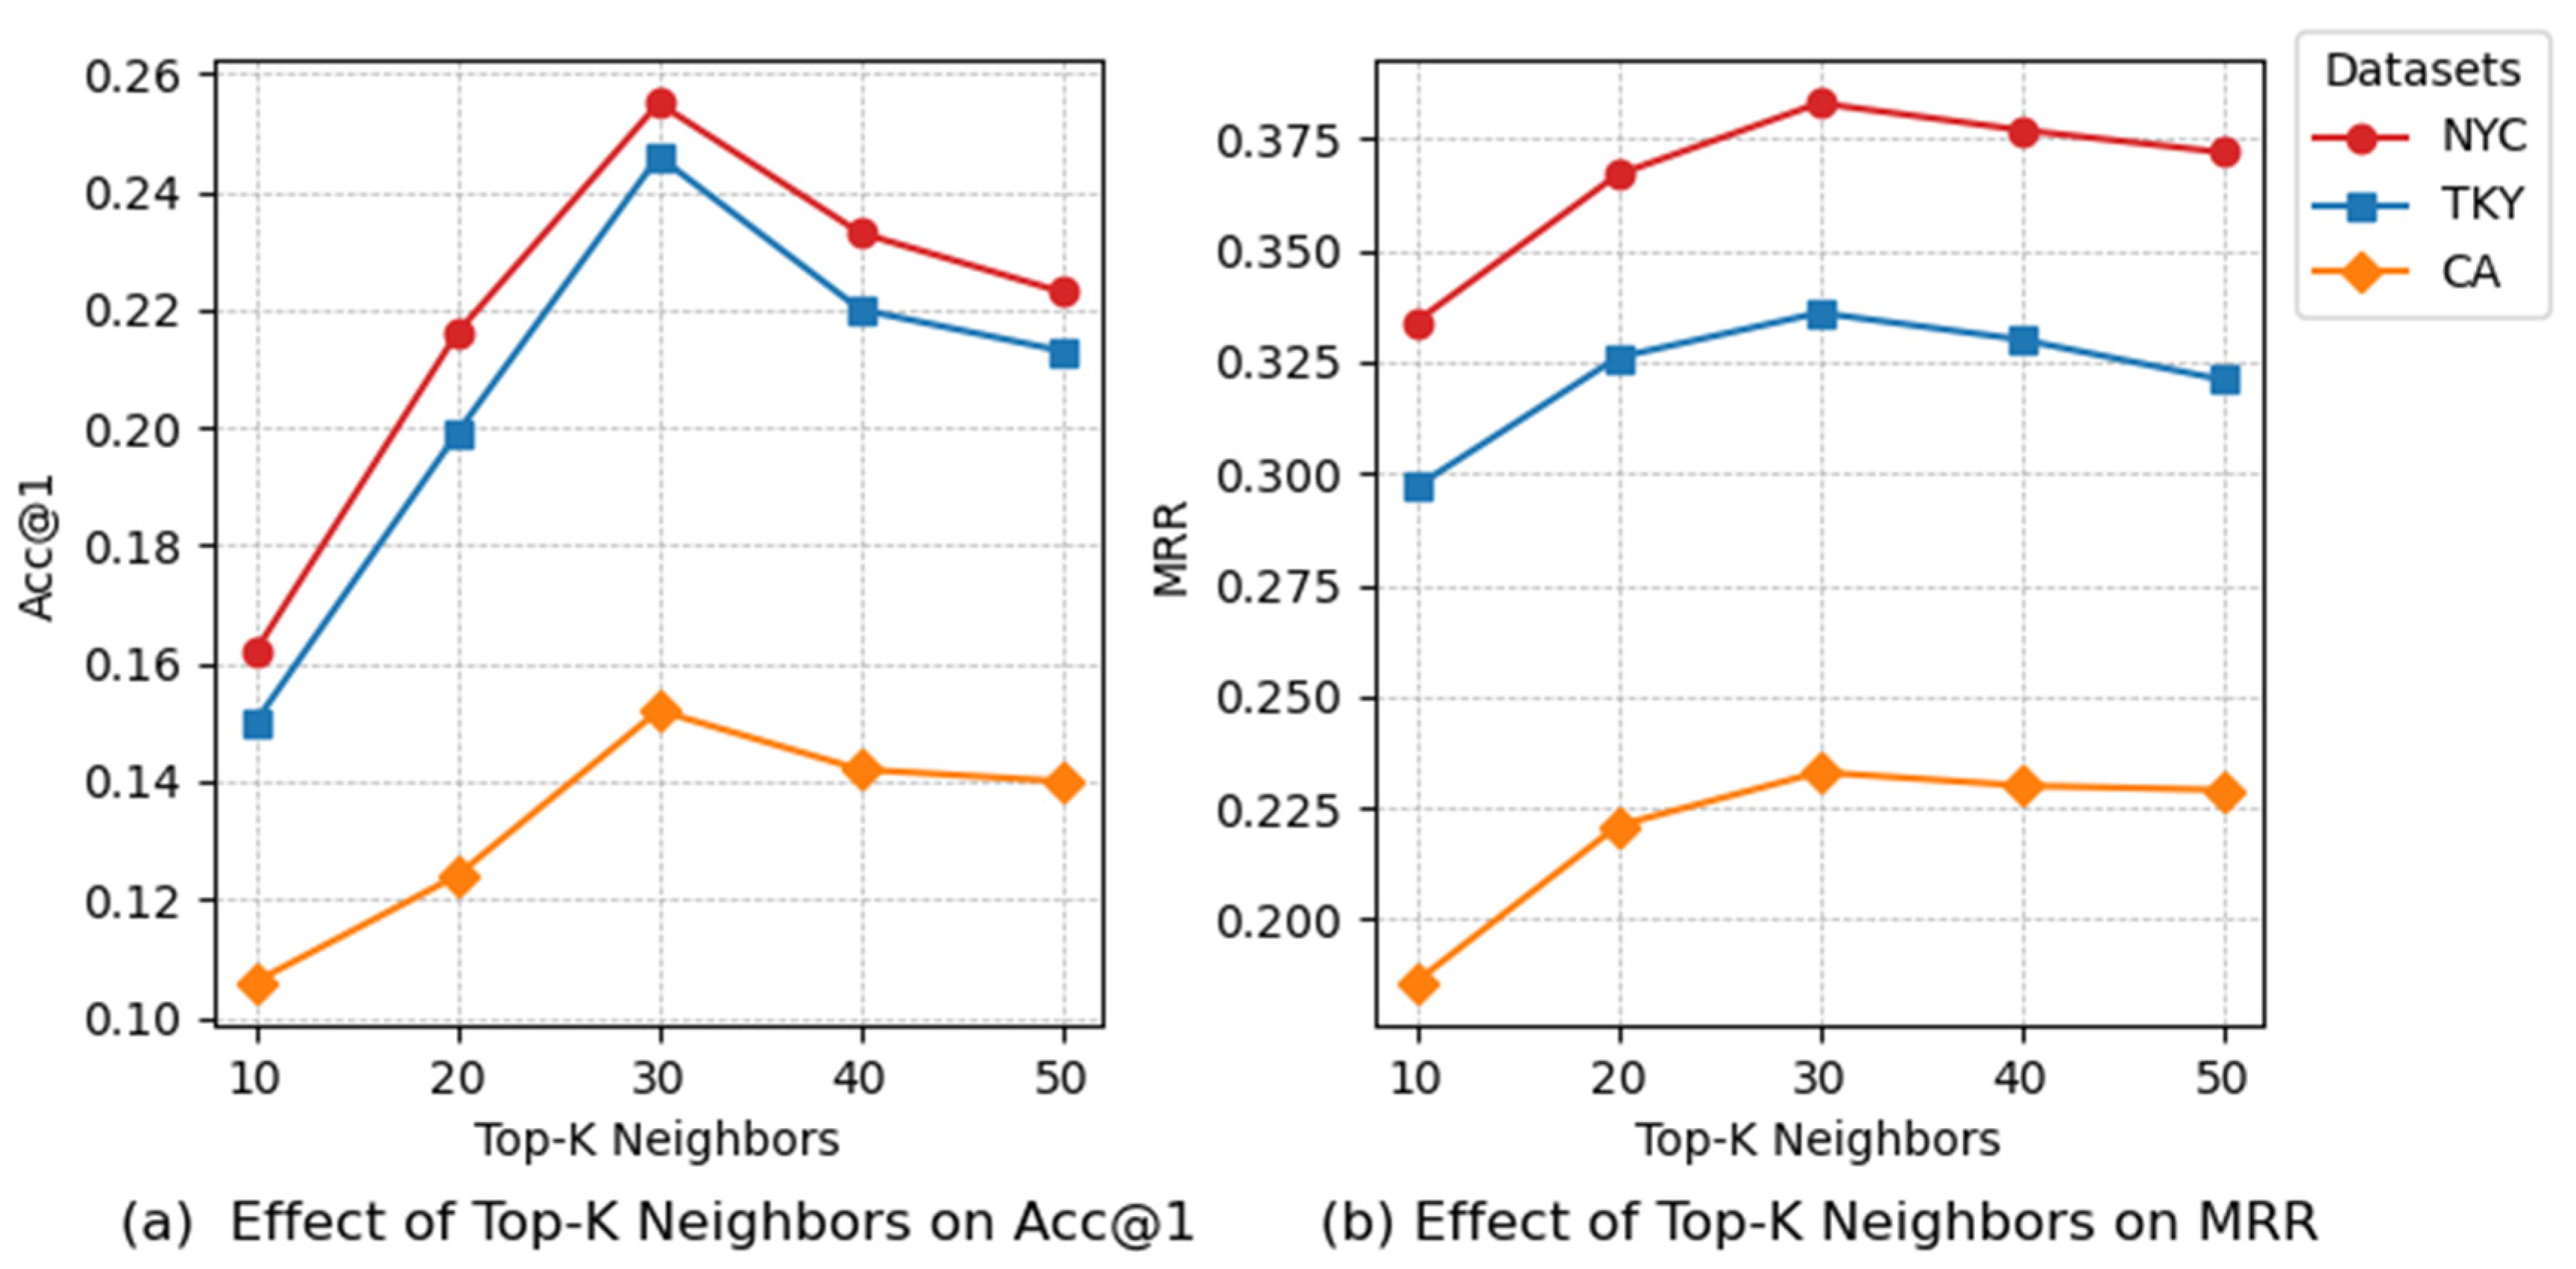
For the user–user graph, we vary
from 10 to 50. As shown in
Figure 6a,b, both Acc@1 and MRR consistently improve as
increases from small values and reach optimal performance around
, followed by a slight decline when
becomes larger. This trend is consistent across NYC, TKY, and CA.
These results indicate that a moderate neighborhood size effectively balances collaborative signal aggregation and noise control. When is too small, insufficient user similarity information is captured; when is too large, weakly related neighbors may introduce noise and over-smoothing. Based on this observation, we set for subsequent experiments.
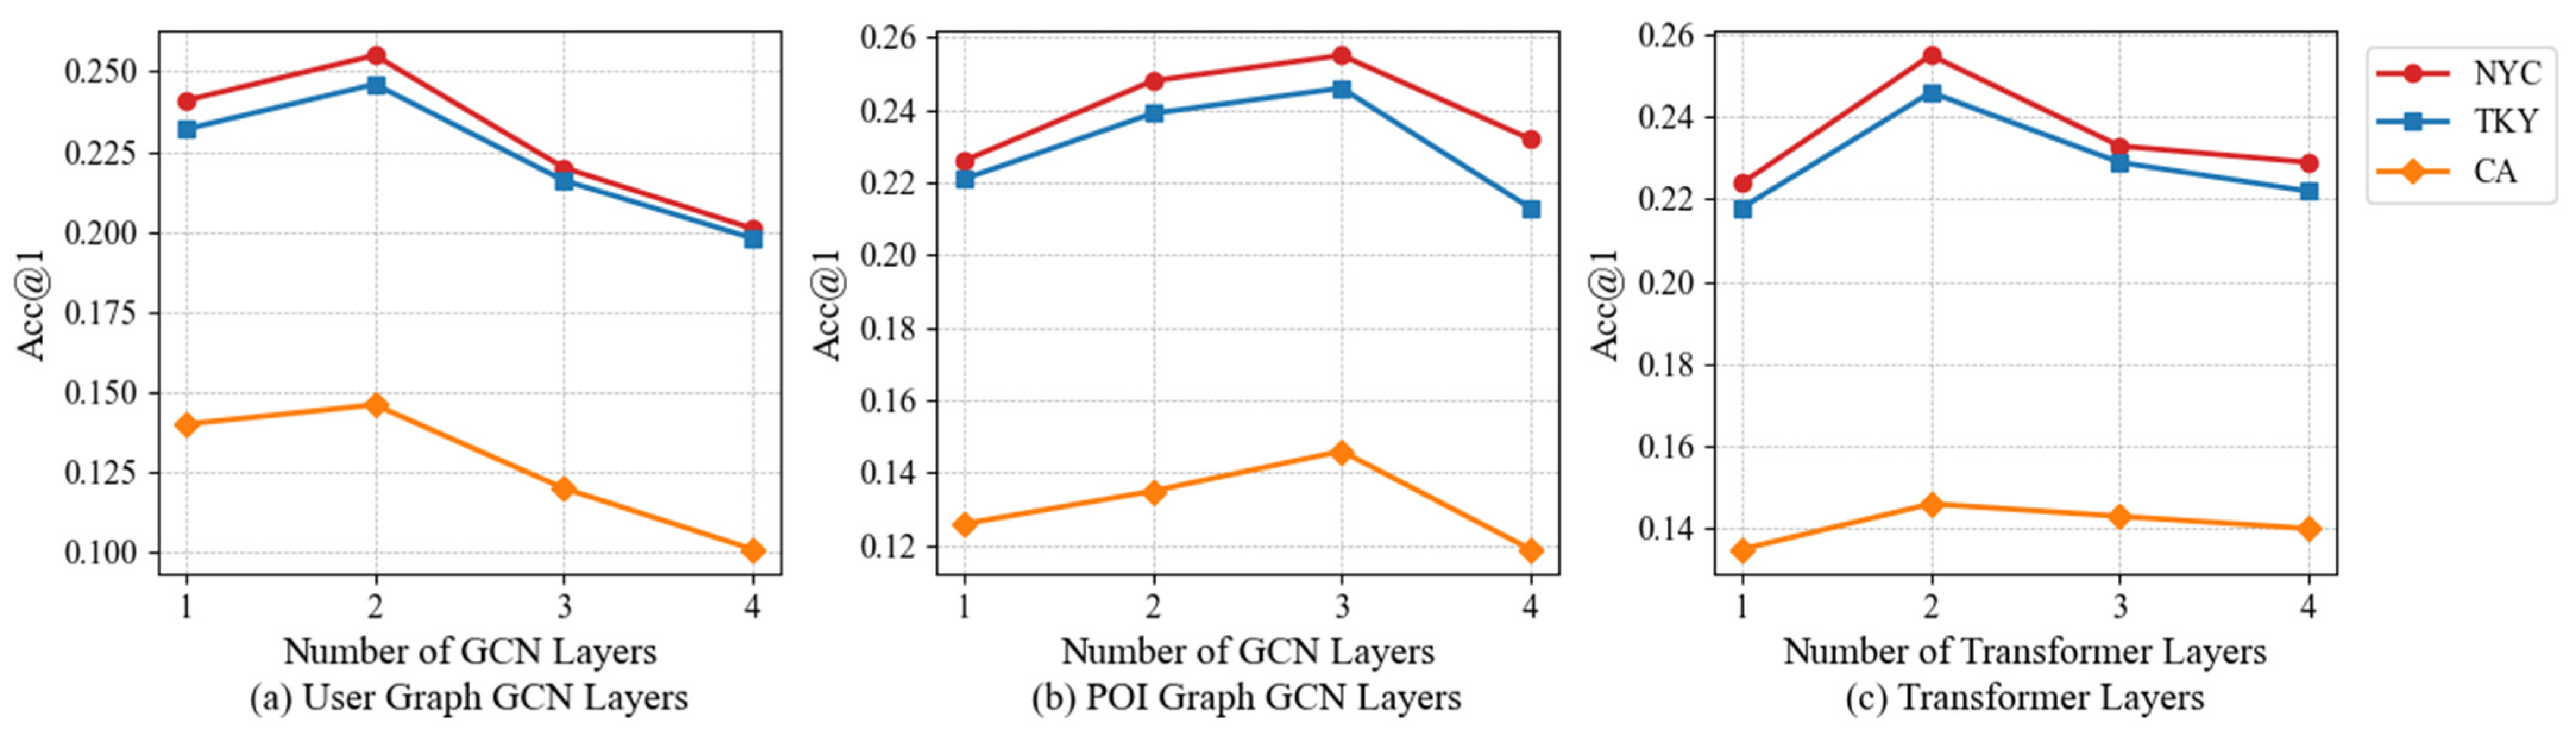
Next, we evaluate the impact of the number of Transformer layers in the sequential encoder.
Figure 7c presents the Acc@1 results for 1–4 layers. Increasing the depth from 1 to 2 layers consistently leads to performance gains across all datasets (e.g., from 0.224 to 0.255 on NYC, from 0.218 to 0.246 on TKY, and from 0.135 to 0.146 on CA), demonstrating the benefit of modeling higher-order temporal dependencies among historical POIs. However, adding additional layers beyond two does not yield further improvement and slightly reduces Acc@1, which can be attributed to overfitting and the relatively short length of user trajectories in these datasets. Similar observations have been reported in recent studies on graph-enhanced and attention-based recommendation models, where shallow transformer structures are preferred under sparse and short sequential behaviors. Based on these results, we set the number of Transformer layers to 2 as a compact yet sufficiently expressive configuration.
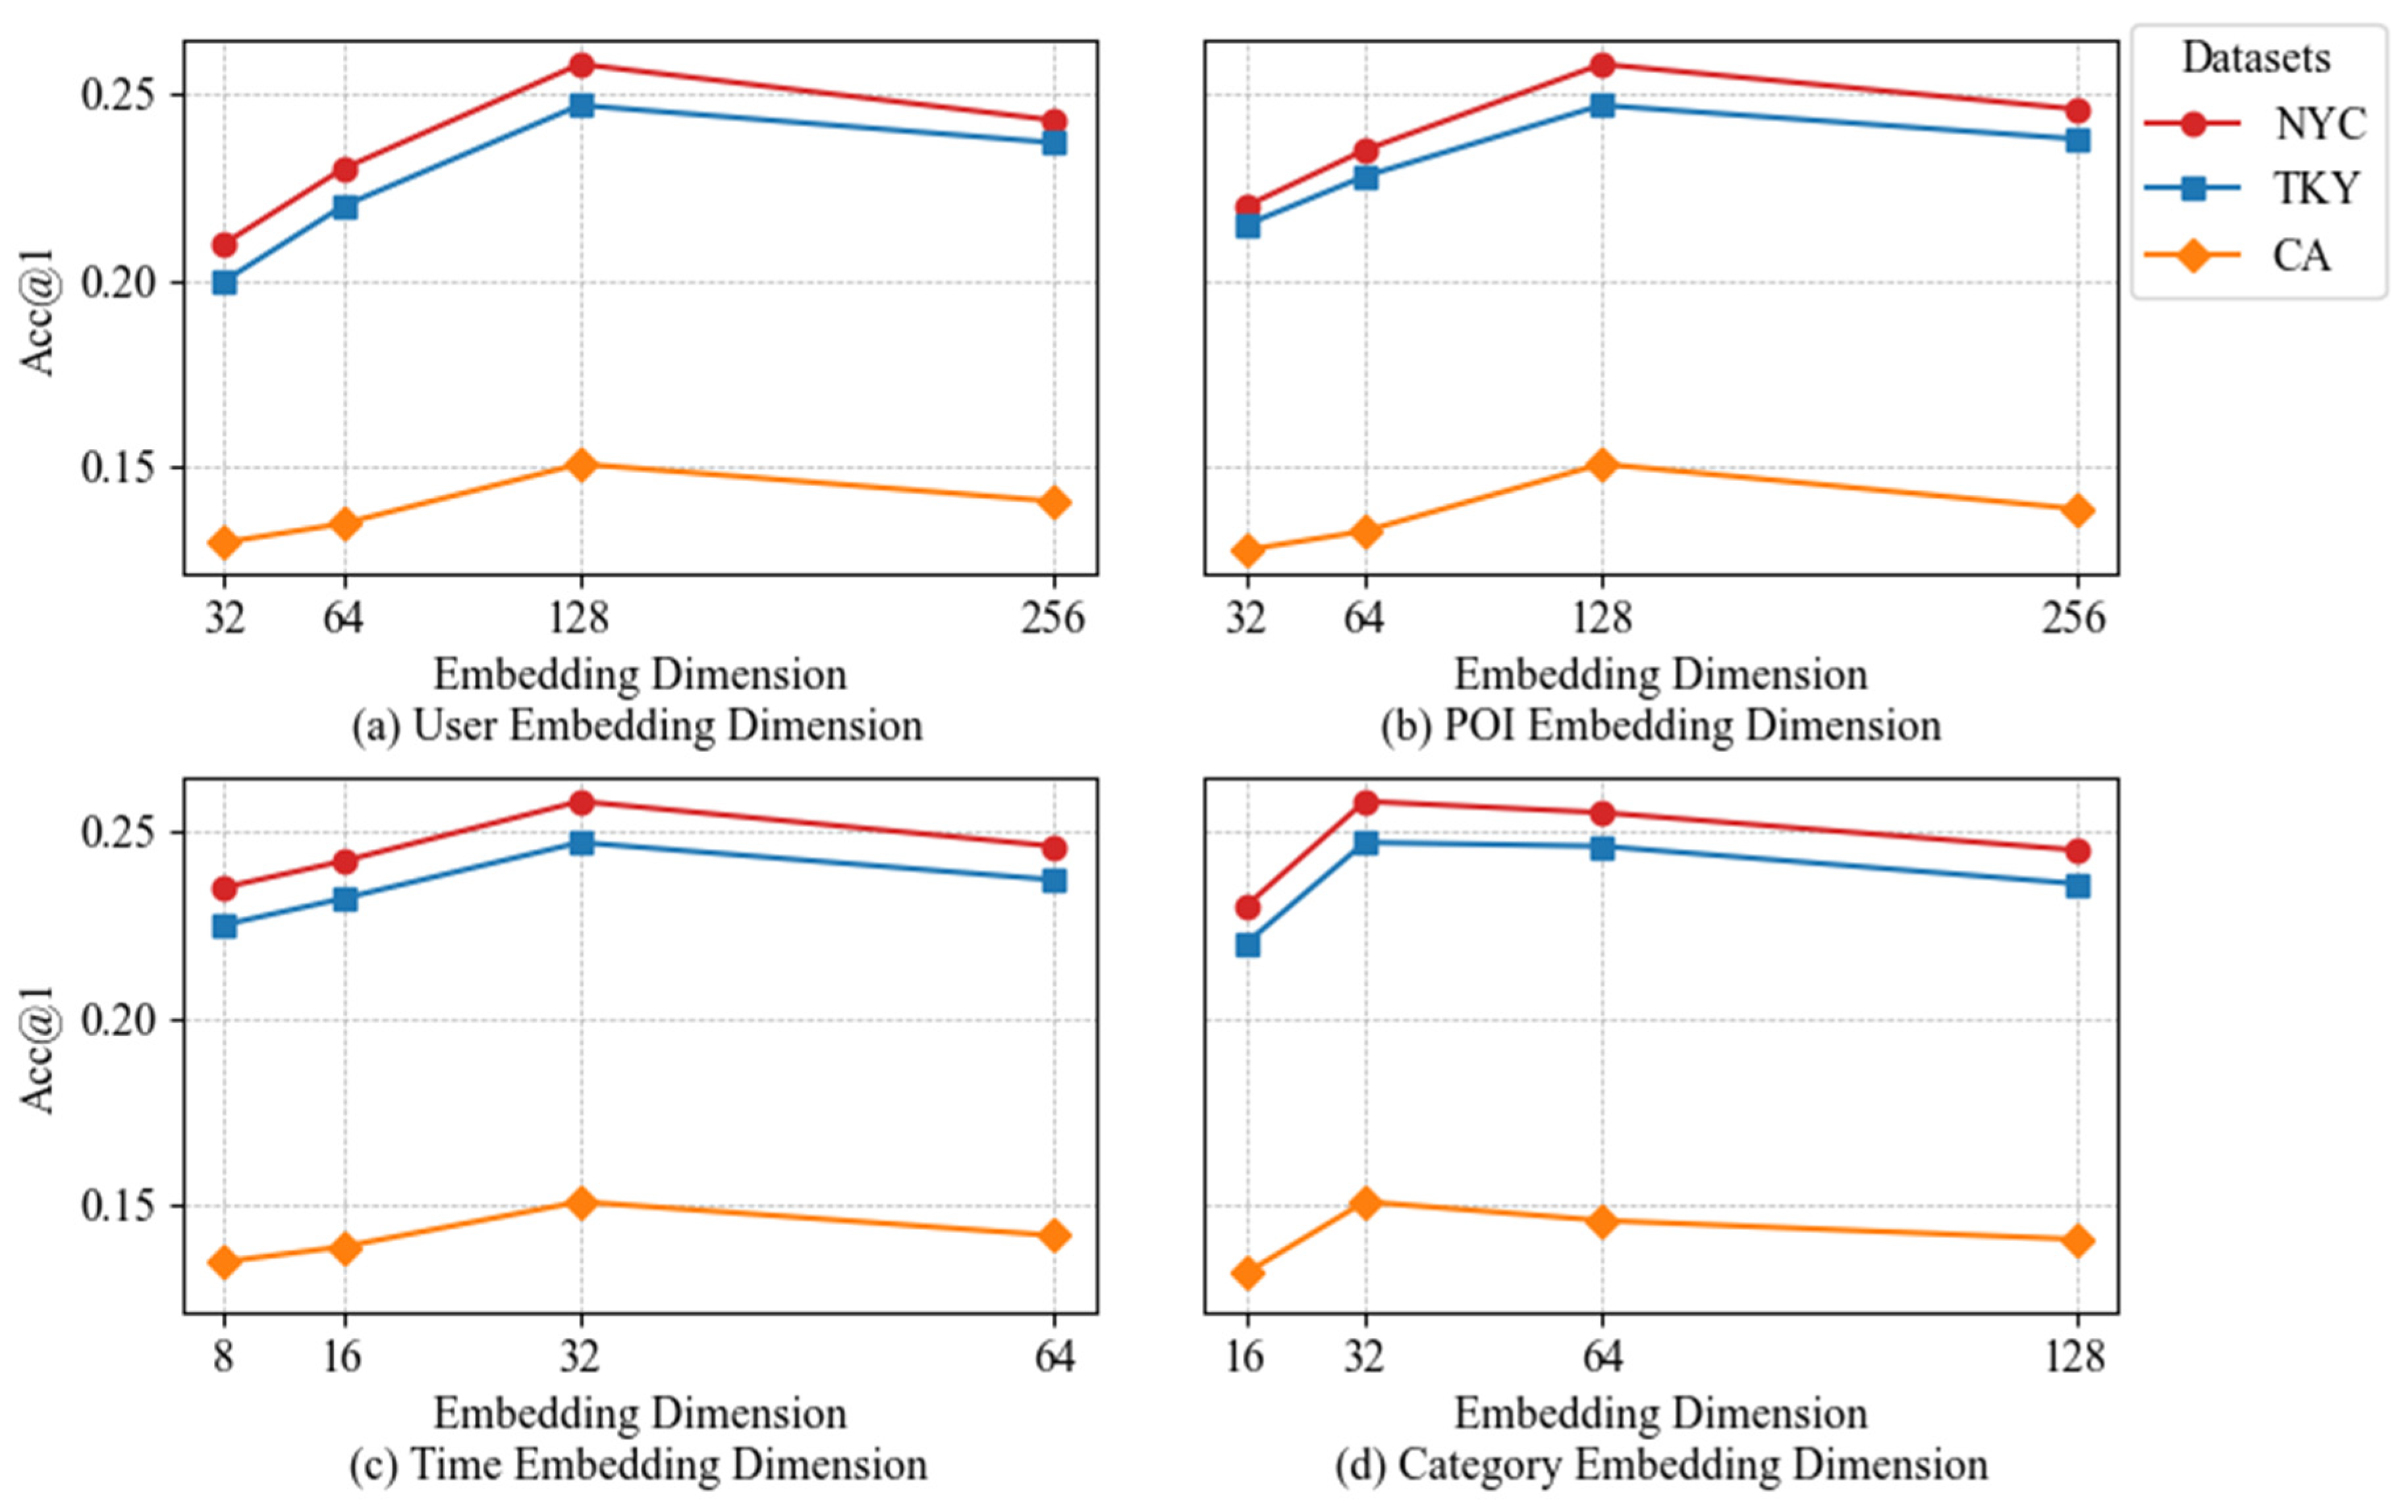
Finally, we examine the impact of embedding dimensionality for different components of UPTRec, including user, POI, temporal, and category embeddings. As shown in
Figure 8, increasing the embedding size generally improves performance up to a moderate dimension, after which gains saturate or slightly decline. User and POI embeddings benefit from relatively larger dimensions, with performance peaking around 128 before marginally decreasing at higher sizes. In contrast, temporal and category embeddings achieve optimal performance with more compact dimensions (around 32) and show no further improvement when enlarged.
Overall, our hyperparameter study shows that the adopted settings—k = 30 neighbors for the user graph, 2 GCN layers for the user encoder, 3 GCN layers for the POI encoder, 2 Transformer layers for the sequential module, 128-dimensional user and POI embeddings, and 32-dimensional temporal and category embeddings—achieve the best balance between model expressiveness, robustness, and computational efficiency. We therefore use these settings as the default configuration in all following experiments.
5.5. Interpretability Study
To further examine how UPTRec generates next-POI predictions, we conduct an interpretability analysis focusing on the social, spatial, temporal, and geographic signals embedded in the model’s multi-graph architecture.
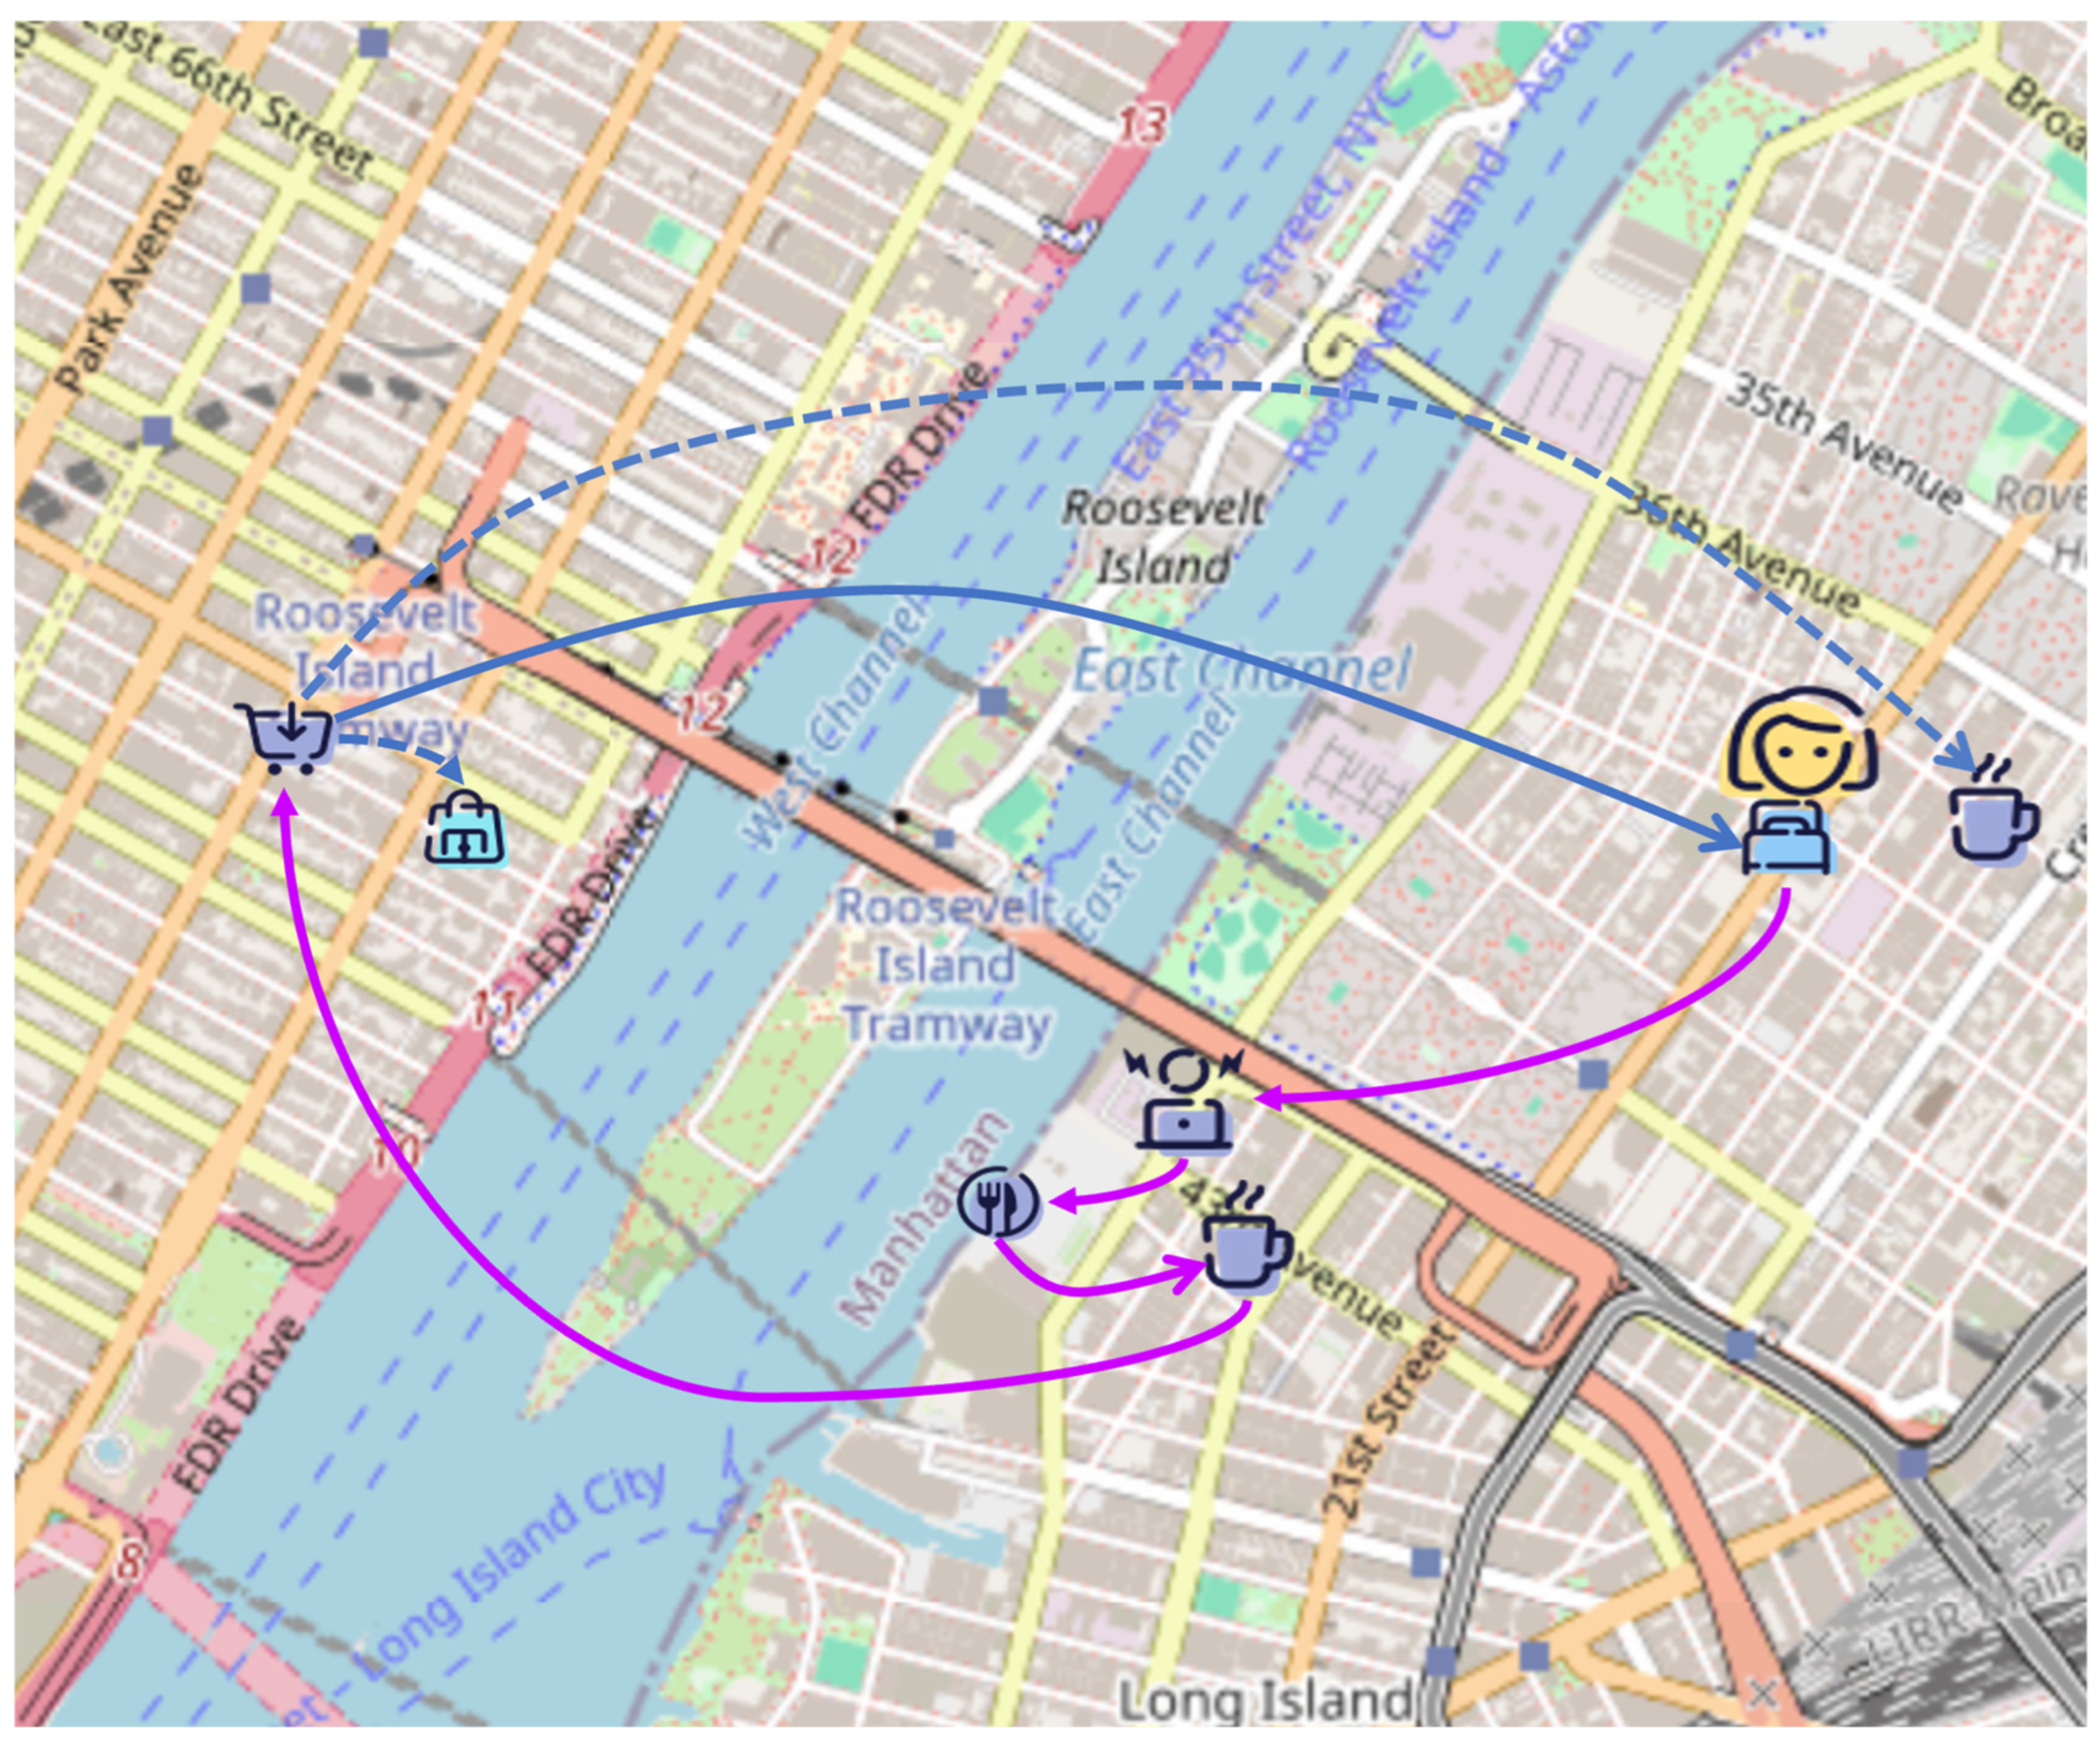
Figure 9 presents an example of a user’s mobility trajectory together with the model’s predicted next-POI transitions. The red trajectory denotes the user’s actual visited POIs, while the blue trajectory illustrates UPTRec’s predicted transitions, where solid segments correspond to observed movements and dashed segments indicate predicted next-POI transitions. The predicted paths align closely with historically frequent and semantically meaningful movement flows embedded in the POI transition graph, such as transitions from workplaces to dining-related locations around midday or from leisure-related POIs to home or transportation hubs during evening hours. Even when intermediate check-ins are absent, the model tends to retrieve plausible transitions that conform to typical human mobility routines, indicating that the learned POI transition representations effectively capture stable sequential movement patterns.
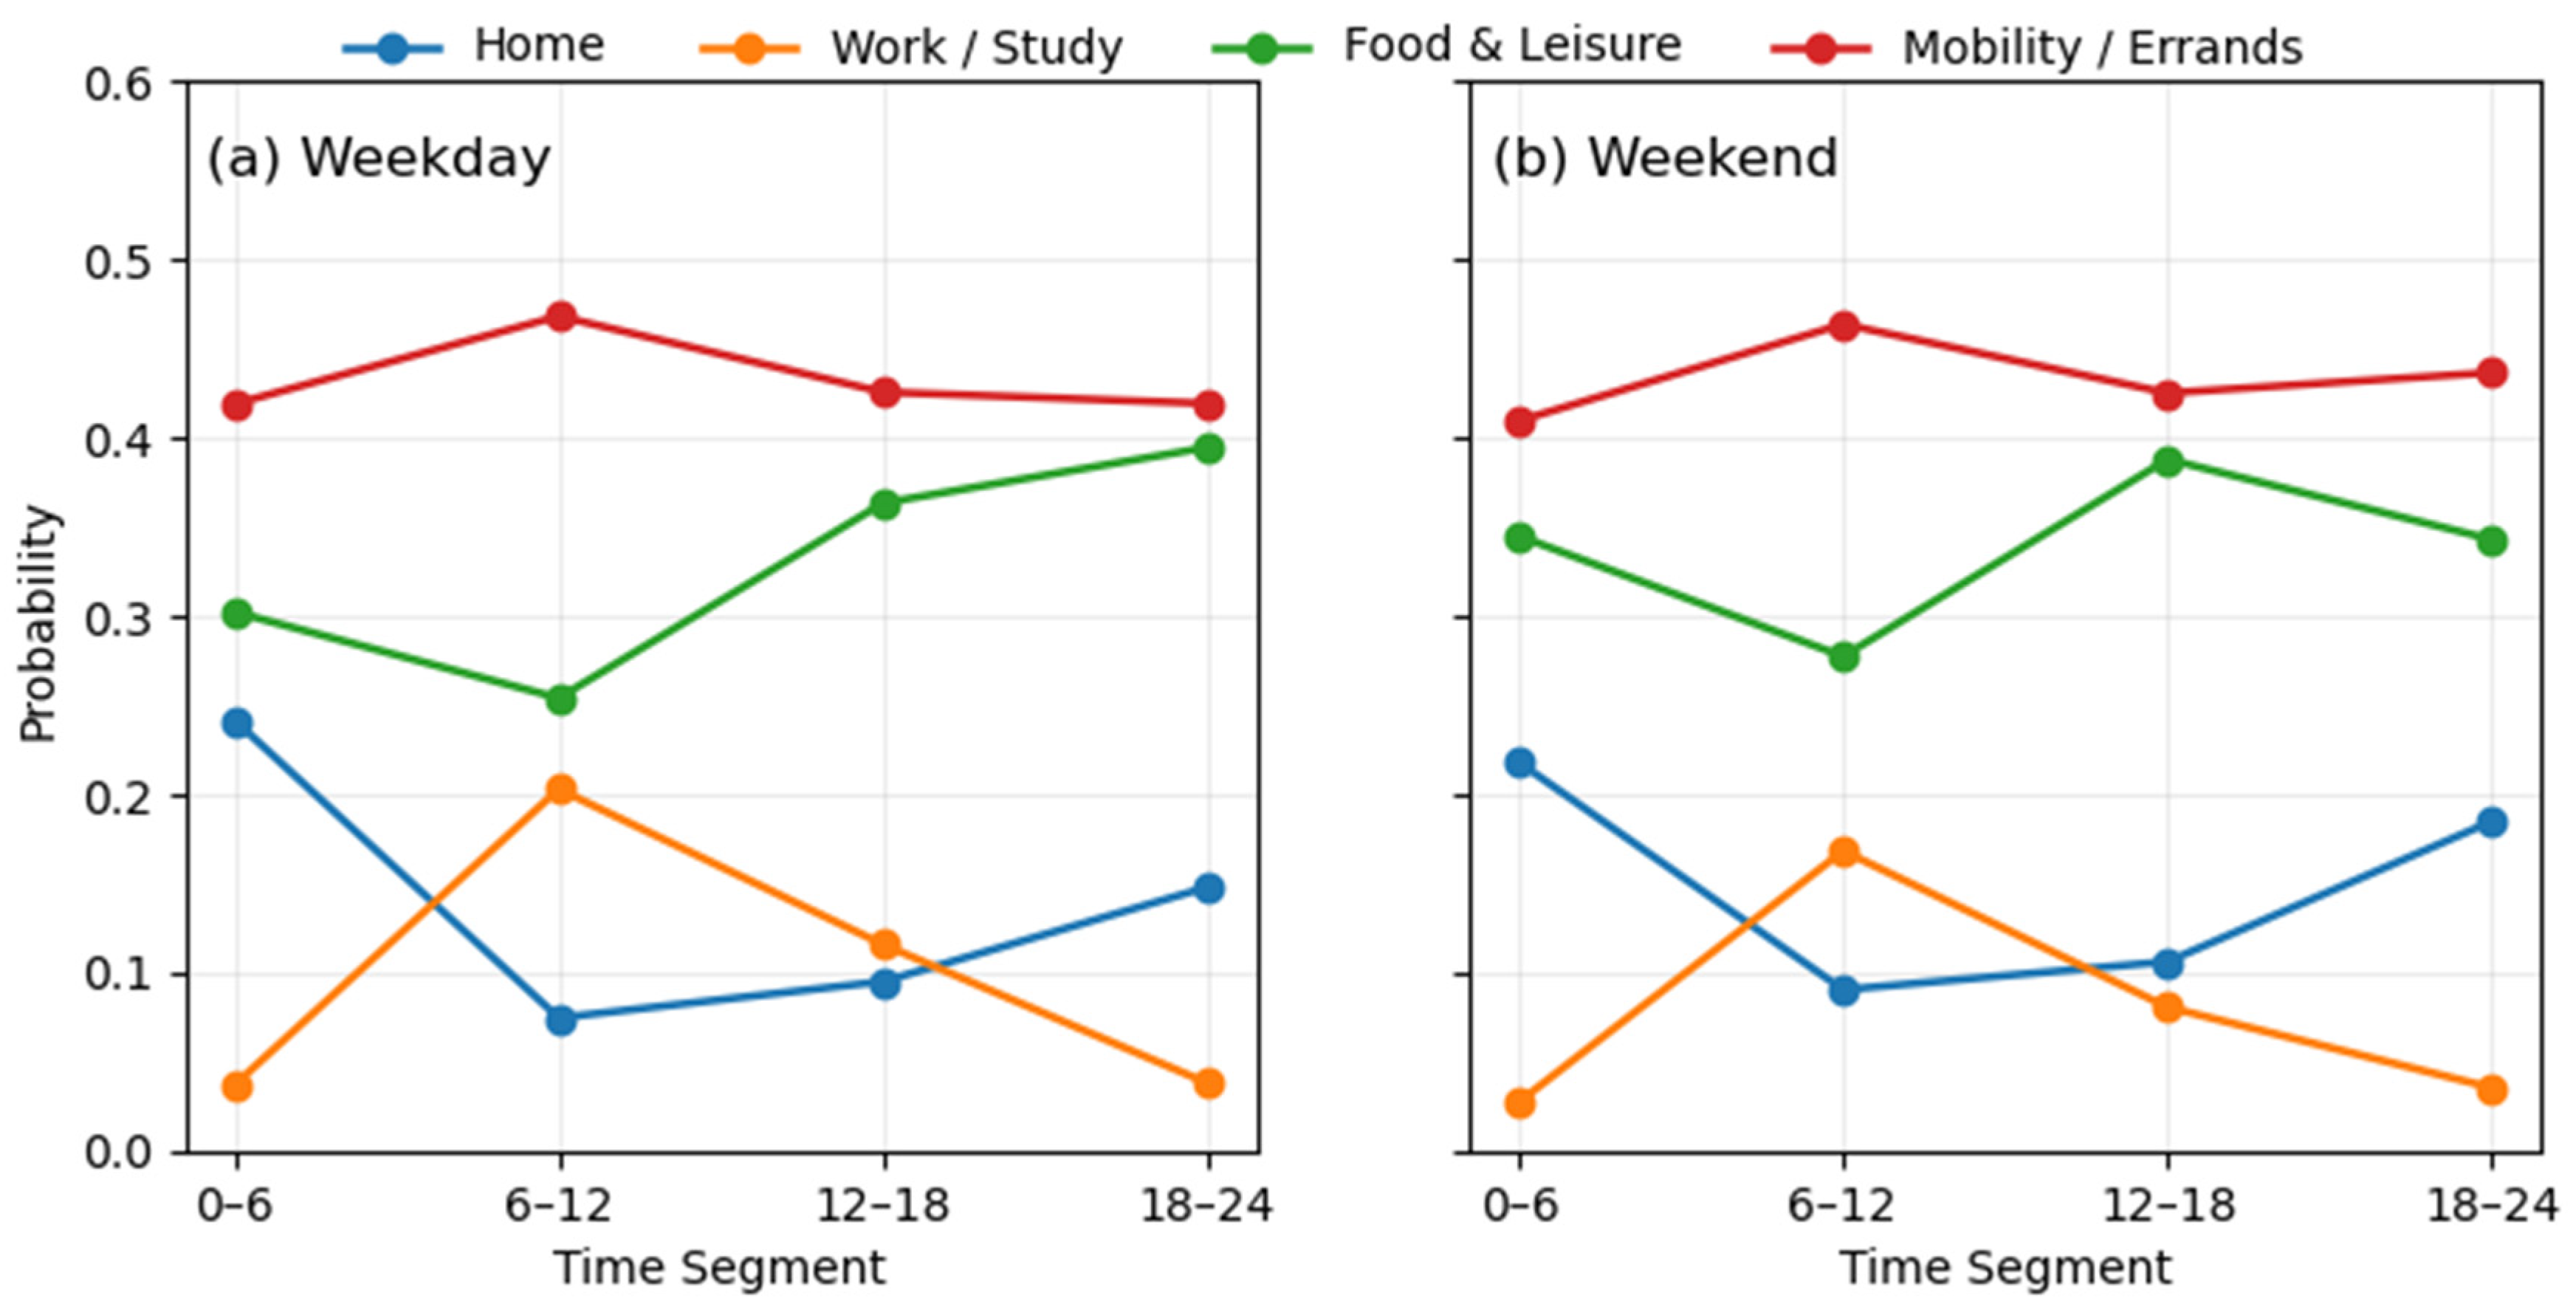
Figure 10 further examines the temporal interpretability of the proposed temporal–category modeling by illustrating the distribution of visit probabilities across different POI categories and time segments on weekdays and weekends. Distinct temporal patterns can be observed for different activity categories: work or study-related visits peak during morning and midday hours on weekdays, food and leisure activities dominate during midday and evening periods, while mobility and errand-related activities maintain relatively high probabilities throughout the day. Compared with weekdays, weekends exhibit more pronounced leisure-oriented patterns and reduced work-related activities, reflecting realistic variations in daily routines. These observations suggest that the temporal module successfully captures activity-dependent temporal preferences and differentiates behavioral rhythms across temporal contexts.
Overall, these qualitative visualizations demonstrate that UPTRec’s multi-graph architecture provides transparent and behaviorally meaningful explanations for its predictions. The POI transition graph encodes realistic sequential movement patterns, while the temporal–category modeling captures daily rhythms and category-specific temporal preferences. Together, these components offer an interpretable rationale for the model’s next-POI recommendations by grounding predictions in consistent spatial–temporal human mobility behaviors.
5.6. Ablation Study
To evaluate the contribution of each component in UPTRec, we conduct an ablation study on the NYC, TKY, and CA datasets. Three variants are constructed by removing one module at a time:
UPTRec-U, which removes the user–user graph and GCN, representing each user only by a trainable ID embedding;
UPTRec-P, which removes the POI–POI transition graph and GCN, so POI embeddings are learned without sequential relations;
UPTRec-T, which removes temporal and category embeddings, so the Transformer uses only user and POI inputs.
All models are trained under identical hyperparameter settings, and their performance is evaluated using Acc@1, Acc@5, and Acc@10.
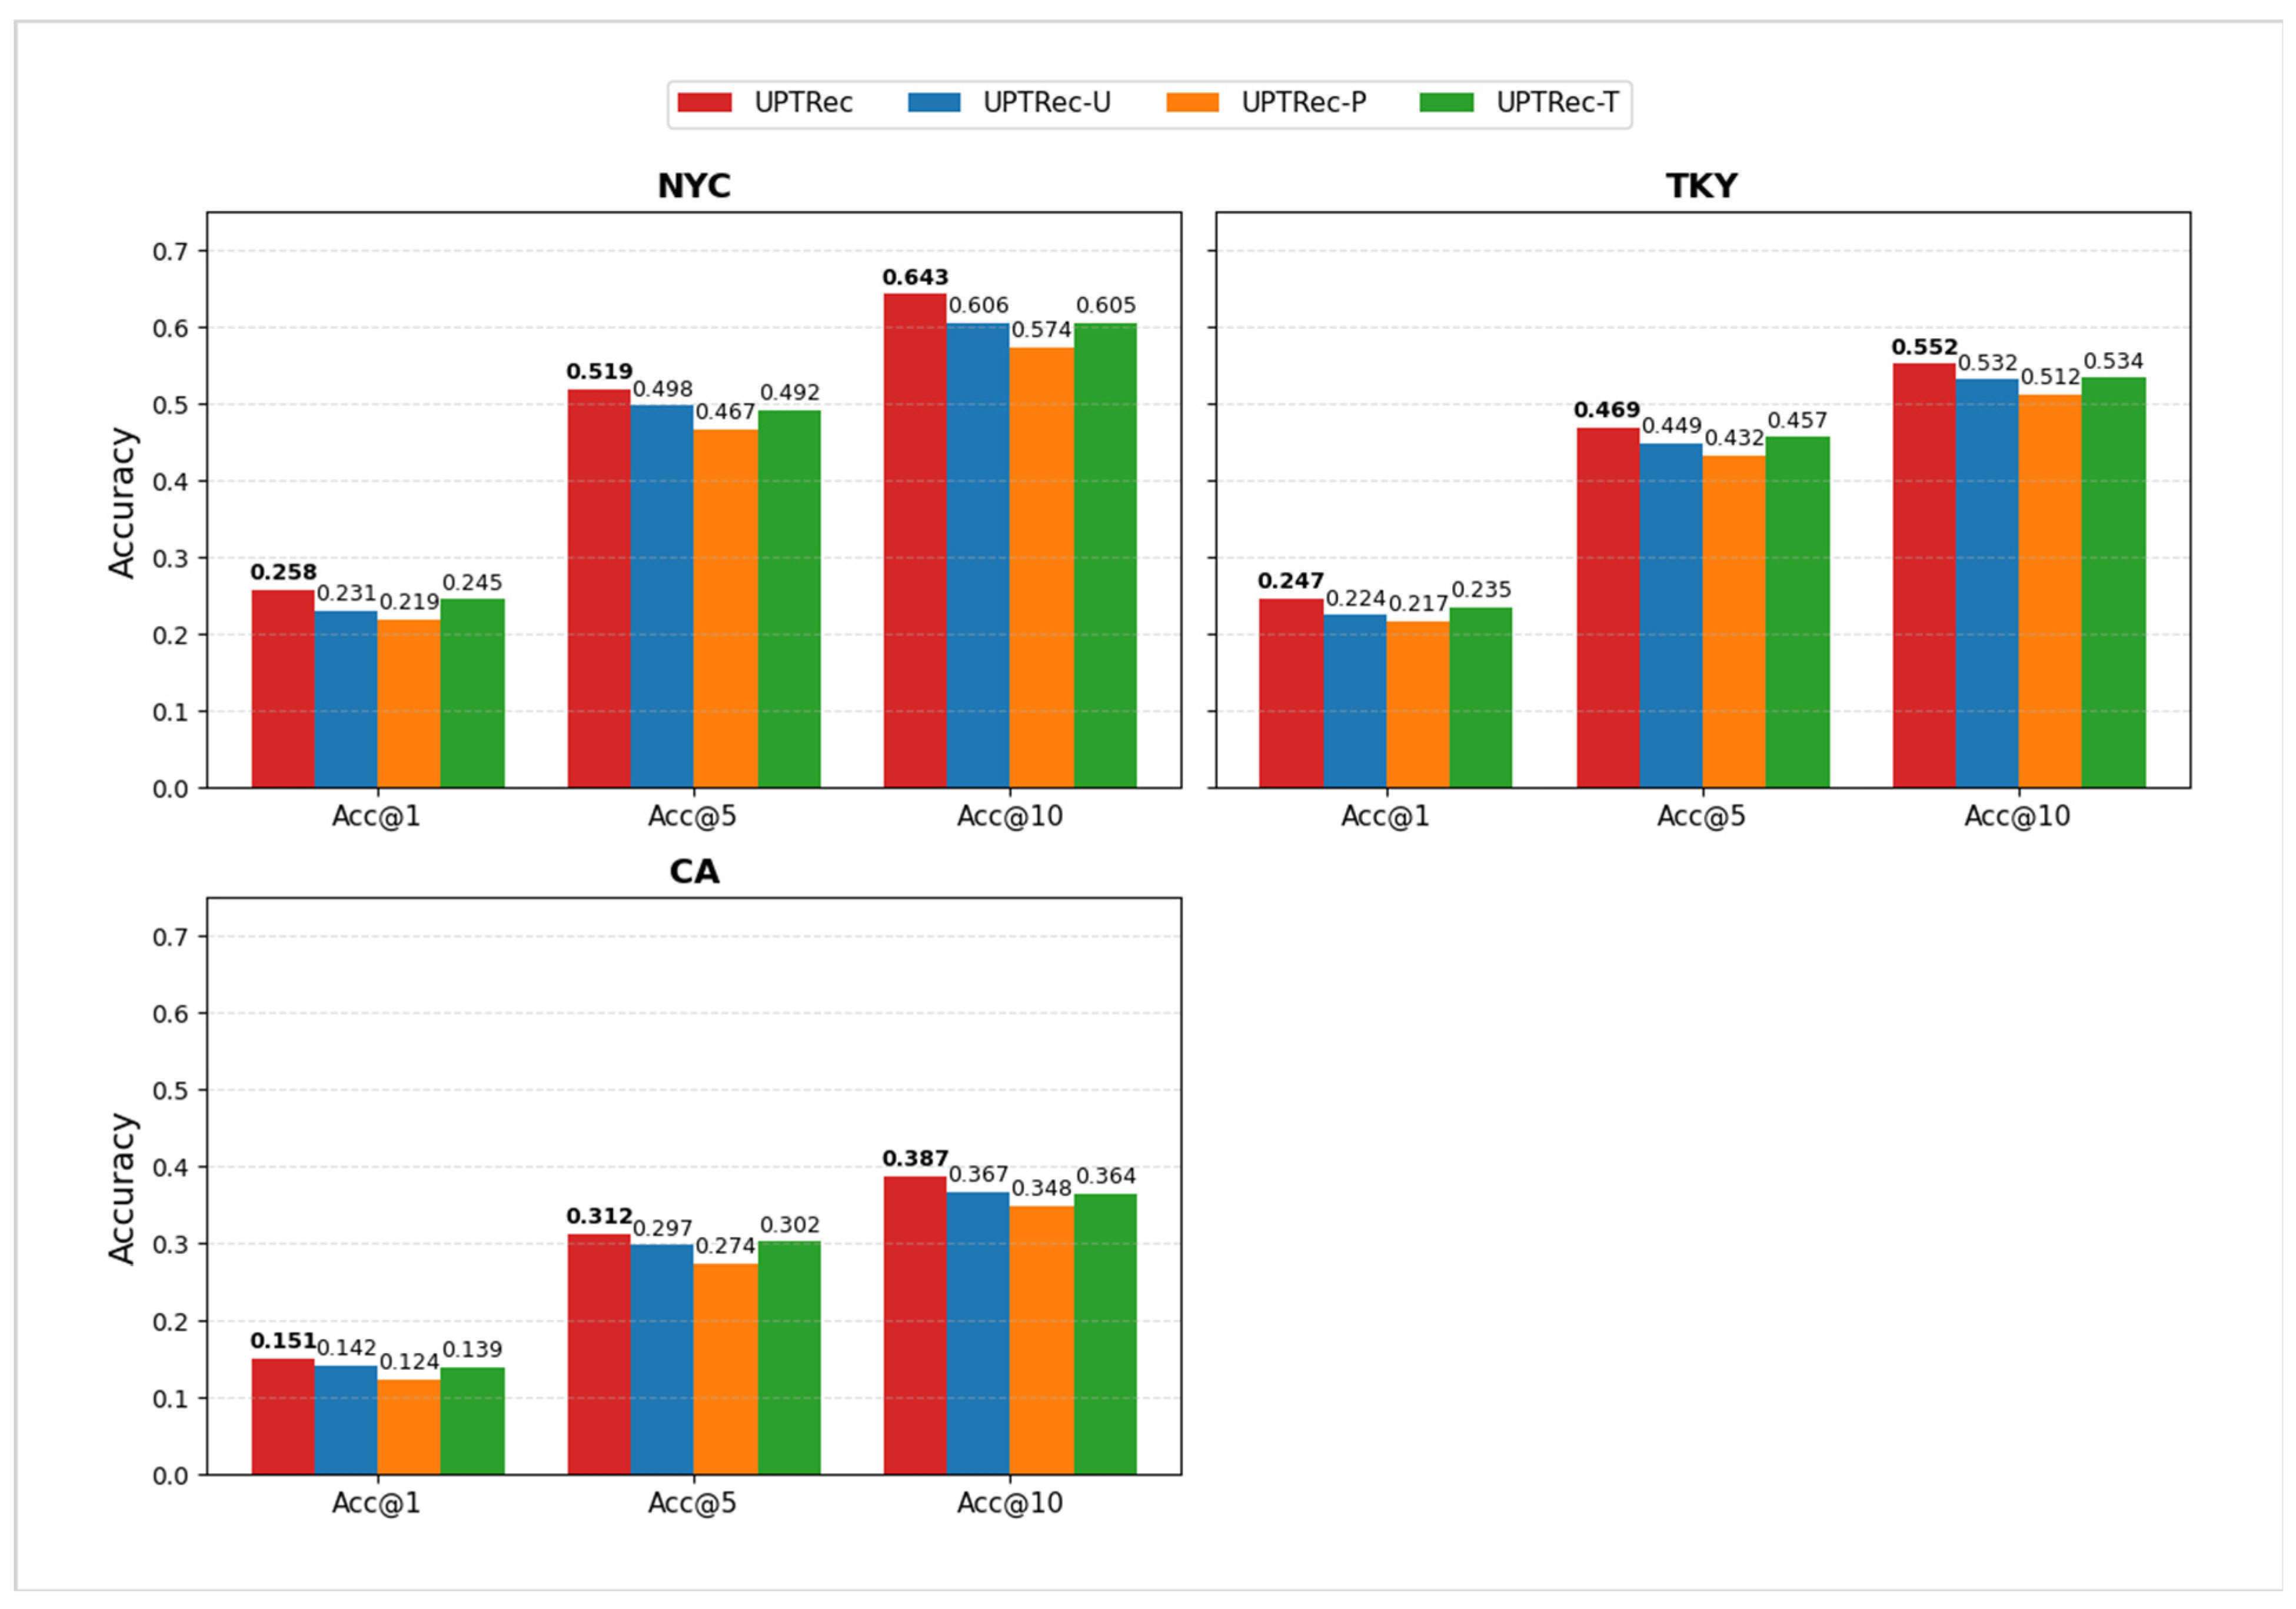
As illustrated in
Figure 11, the full UPTRec model consistently achieves the best performance across all datasets and evaluation metrics, demonstrating that each component contributes positively to next-POI recommendation accuracy. Among the three ablated variants, UPTRec-P exhibits the most significant performance degradation on all datasets. For instance, on the NYC dataset, removing the POI transition graph reduces Acc@1 from 0.2576 to 0.2189, indicating that modeling sequential dependencies among POIs is crucial for accurate next-location prediction. Similar trends can be observed on the TKY and CA datasets, confirming the general importance of POI transition modeling across different urban contexts.
Removing the user–user graph (UPTRec-U) also leads to a noticeable performance decline, though the impact is less severe than that of removing the POI transition graph. This suggests that user similarity information provides valuable collaborative signals that complement individual historical behaviors, thereby enhancing personalized recommendation performance.
In addition, excluding temporal and category embeddings (UPTRec-T) consistently degrades performance across all datasets, highlighting the importance of temporal and contextual information in capturing time-dependent user preferences and producing semantically coherent recommendations. Although the performance drop caused by removing the temporal module is relatively moderate, it remains non-negligible, especially in scenarios where user mobility exhibits strong periodic patterns.
Overall, the ablation results demonstrate that the user graph, POI transition graph, and temporal module are complementary components of UPTRec. Removing any single module consistently degrades performance, validating the effectiveness of jointly modeling social, sequential, and temporal information for robust and accurate next-POI recommendation.
6. Conclusions and Future Work
In this paper, we propose UPTRec, a unified framework for next-POI recommendation that jointly models user similarity, global POI transition structures, and continuous temporal dynamics within a Transformer-based architecture. By constructing a TF-IDF-weighted user similarity graph and a global POI transition graph, the model integrates collaborative signals with high-order structural dependencies, while temporal embeddings capture fine-grained periodic mobility patterns. Experimental results on real-world datasets demonstrate that the proposed framework achieves competitive performance and robust ranking capability across multiple evaluation metrics.
Compared with purely sequential or graph-only approaches, UPTRec benefits from incorporating implicit user similarity and global transition information, thereby enhancing representation learning in sparse check-in scenarios. However, several limitations remain. The current graph construction is static and does not adapt to real-time behavioral changes. Moreover, while the model effectively captures statistical correlations, it lacks explicit semantic reasoning to interpret user intent. Integrating multiple graph components may also increase computational overhead in large-scale systems.
In future work, we plan to transition to dynamic graph learning frameworks that update user–POI relations in real time, enabling the model to adaptively capture evolving mobility patterns. Furthermore, we aim to integrate Large Language Models (LLMs) to enhance the semantic understanding of spatial contexts. By processing textual POI reviews or generating natural language explanations, we seek to bridge the gap between numerical prediction and user-centric reasoning. Finally, investigating the transferability of learned graph structures to data-sparse cities remains a promising avenue for mitigating cold-start issues in cross-city recommendation scenarios.